Cities with the Highest Unemployment Rate Amomg Youth Under the Age of 25 in Missouri
RELATED REPORTS & OPTIONS
Highest Unemployment | Youth < 25
Missouri
Compare Cities
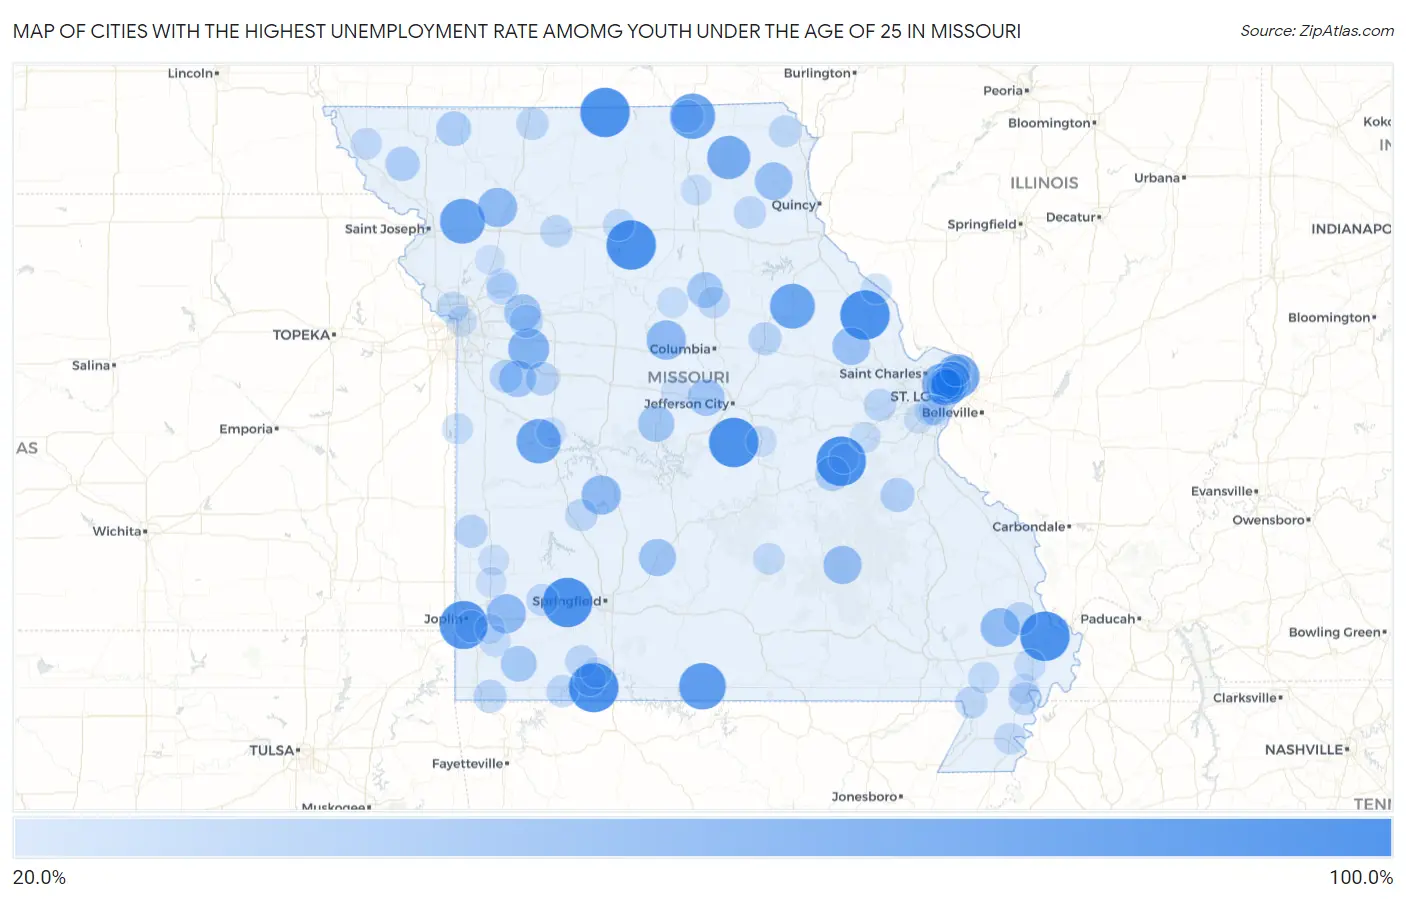
Map of Cities with the Highest Unemployment Rate Amomg Youth Under the Age of 25 in Missouri
0.0%
100.0%
Cities with the Highest Unemployment Rate Amomg Youth Under the Age of 25 in Missouri
| City | Youth Unemployment | vs State | vs National | |
| 1. | Diehlstadt | 100.0% | 8.7%(+91.3)#1 | 10.9%(+89.1)#247 |
| 2. | Whiteside | 100.0% | 8.7%(+91.3)#2 | 10.9%(+89.1)#258 |
| 3. | Powersville | 100.0% | 8.7%(+91.3)#3 | 10.9%(+89.1)#289 |
| 4. | Rothville | 100.0% | 8.7%(+91.3)#4 | 10.9%(+89.1)#294 |
| 5. | Halltown | 100.0% | 8.7%(+91.3)#5 | 10.9%(+89.1)#308 |
| 6. | Coney Island | 100.0% | 8.7%(+91.3)#6 | 10.9%(+89.1)#314 |
| 7. | St Cloud | 100.0% | 8.7%(+91.3)#7 | 10.9%(+89.1)#319 |
| 8. | Meta | 99.9% | 8.7%(+91.2)#8 | 10.9%(+89.0)#362 |
| 9. | Grand Falls Plaza | 94.4% | 8.7%(+85.7)#9 | 10.9%(+83.5)#386 |
| 10. | Gainesville | 88.8% | 8.7%(+80.1)#10 | 10.9%(+77.9)#408 |
| 11. | Lancaster | 83.4% | 8.7%(+74.7)#11 | 10.9%(+72.5)#435 |
| 12. | Clarksdale | 82.5% | 8.7%(+73.8)#12 | 10.9%(+71.6)#443 |
| 13. | Laddonia | 81.7% | 8.7%(+73.0)#13 | 10.9%(+70.8)#450 |
| 14. | La Due | 80.0% | 8.7%(+71.3)#14 | 10.9%(+69.1)#461 |
| 15. | Glasgow Village | 78.2% | 8.7%(+69.5)#15 | 10.9%(+67.3)#477 |
| 16. | Baring | 75.0% | 8.7%(+66.3)#16 | 10.9%(+64.1)#517 |
| 17. | Shakertowne | 70.6% | 8.7%(+61.9)#17 | 10.9%(+59.7)#579 |
| 18. | Flordell Hills | 68.7% | 8.7%(+60.0)#18 | 10.9%(+57.8)#604 |
| 19. | Bel Ridge | 66.7% | 8.7%(+58.0)#19 | 10.9%(+55.8)#631 |
| 20. | Lake Lafayette | 66.6% | 8.7%(+57.9)#20 | 10.9%(+55.7)#640 |
| 21. | Tebbetts | 62.2% | 8.7%(+53.5)#21 | 10.9%(+51.3)#727 |
| 22. | Hermitage | 60.0% | 8.7%(+51.3)#22 | 10.9%(+49.1)#767 |
| 23. | Franklin | 60.0% | 8.7%(+51.3)#23 | 10.9%(+49.1)#775 |
| 24. | Weatherby | 59.9% | 8.7%(+51.2)#24 | 10.9%(+49.0)#786 |
| 25. | Reeds | 59.8% | 8.7%(+51.1)#25 | 10.9%(+48.9)#788 |
| 26. | Bell City | 58.3% | 8.7%(+49.6)#26 | 10.9%(+47.4)#817 |
| 27. | Velda Village Hills | 58.0% | 8.7%(+49.3)#27 | 10.9%(+47.1)#824 |
| 28. | Greendale | 55.5% | 8.7%(+46.8)#28 | 10.9%(+44.6)#898 |
| 29. | Bunker | 55.5% | 8.7%(+46.8)#29 | 10.9%(+44.6)#906 |
| 30. | Lewistown | 54.1% | 8.7%(+45.4)#30 | 10.9%(+43.2)#950 |
| 31. | Hawk Point | 53.3% | 8.7%(+44.6)#31 | 10.9%(+42.4)#982 |
| 32. | Conway | 51.8% | 8.7%(+43.1)#32 | 10.9%(+40.9)#1,034 |
| 33. | Pine Lawn | 50.7% | 8.7%(+42.0)#33 | 10.9%(+39.8)#1,065 |
| 34. | Kingsville | 50.0% | 8.7%(+41.3)#34 | 10.9%(+39.1)#1,105 |
| 35. | Centertown | 49.9% | 8.7%(+41.2)#35 | 10.9%(+39.0)#1,175 |
| 36. | Camden | 49.9% | 8.7%(+41.2)#36 | 10.9%(+39.0)#1,186 |
| 37. | Versailles | 48.8% | 8.7%(+40.1)#37 | 10.9%(+37.9)#1,212 |
| 38. | Wheaton | 46.1% | 8.7%(+37.4)#38 | 10.9%(+35.2)#1,306 |
| 39. | Renick | 46.1% | 8.7%(+37.4)#39 | 10.9%(+35.2)#1,311 |
| 40. | Country Club Hills | 43.9% | 8.7%(+35.2)#40 | 10.9%(+33.0)#1,419 |
| 41. | Parnell | 42.8% | 8.7%(+34.1)#41 | 10.9%(+31.9)#1,522 |
| 42. | Leasburg | 42.2% | 8.7%(+33.5)#42 | 10.9%(+31.3)#1,548 |
| 43. | Maitland | 41.6% | 8.7%(+32.9)#43 | 10.9%(+30.7)#1,599 |
| 44. | Moline Acres | 41.2% | 8.7%(+32.5)#44 | 10.9%(+30.3)#1,622 |
| 45. | Mineral Point | 40.0% | 8.7%(+31.3)#45 | 10.9%(+29.1)#1,693 |
| 46. | Uplands Park | 38.4% | 8.7%(+29.7)#46 | 10.9%(+27.5)#1,817 |
| 47. | Centerview | 37.5% | 8.7%(+28.8)#47 | 10.9%(+26.6)#1,897 |
| 48. | Oran | 36.8% | 8.7%(+28.1)#48 | 10.9%(+25.9)#1,944 |
| 49. | Wellington | 36.8% | 8.7%(+28.1)#49 | 10.9%(+25.9)#1,952 |
| 50. | Strasburg | 36.3% | 8.7%(+27.6)#50 | 10.9%(+25.4)#1,996 |
| 51. | Bronaugh | 36.3% | 8.7%(+27.6)#51 | 10.9%(+25.4)#1,997 |
| 52. | Jane | 36.0% | 8.7%(+27.3)#52 | 10.9%(+25.1)#2,017 |
| 53. | Auxvasse | 35.9% | 8.7%(+27.2)#53 | 10.9%(+25.0)#2,022 |
| 54. | Glenwood | 35.3% | 8.7%(+26.6)#54 | 10.9%(+24.4)#2,083 |
| 55. | Marston | 35.2% | 8.7%(+26.5)#55 | 10.9%(+24.3)#2,093 |
| 56. | Miller | 33.3% | 8.7%(+24.6)#56 | 10.9%(+22.4)#2,260 |
| 57. | Blythedale | 33.3% | 8.7%(+24.6)#57 | 10.9%(+22.4)#2,282 |
| 58. | Saginaw | 33.3% | 8.7%(+24.6)#58 | 10.9%(+22.4)#2,298 |
| 59. | Augusta | 33.3% | 8.7%(+24.6)#59 | 10.9%(+22.4)#2,302 |
| 60. | Mccord Bend | 33.3% | 8.7%(+24.6)#60 | 10.9%(+22.4)#2,308 |
| 61. | Emerald Beach | 33.3% | 8.7%(+24.6)#61 | 10.9%(+22.4)#2,313 |
| 62. | Bethel | 33.3% | 8.7%(+24.6)#62 | 10.9%(+22.4)#2,332 |
| 63. | Mooresville | 33.3% | 8.7%(+24.6)#63 | 10.9%(+22.4)#2,338 |
| 64. | Flemington | 33.3% | 8.7%(+24.6)#64 | 10.9%(+22.4)#2,347 |
| 65. | Kimberling City | 32.8% | 8.7%(+24.1)#65 | 10.9%(+21.9)#2,371 |
| 66. | Campbell | 32.6% | 8.7%(+23.9)#66 | 10.9%(+21.7)#2,388 |
| 67. | Kahoka | 32.2% | 8.7%(+23.5)#67 | 10.9%(+21.3)#2,427 |
| 68. | Clark | 31.8% | 8.7%(+23.1)#68 | 10.9%(+20.9)#2,477 |
| 69. | Homestead | 31.8% | 8.7%(+23.1)#69 | 10.9%(+20.9)#2,478 |
| 70. | Laclede | 31.5% | 8.7%(+22.8)#70 | 10.9%(+20.6)#2,513 |
| 71. | Hayti | 30.8% | 8.7%(+22.1)#71 | 10.9%(+19.9)#2,585 |
| 72. | Licking | 30.7% | 8.7%(+22.0)#72 | 10.9%(+19.8)#2,593 |
| 73. | Lake Waukomis | 30.7% | 8.7%(+22.0)#73 | 10.9%(+19.8)#2,597 |
| 74. | Fairfax | 30.7% | 8.7%(+22.0)#74 | 10.9%(+19.8)#2,599 |
| 75. | Matthews | 30.2% | 8.7%(+21.5)#75 | 10.9%(+19.3)#2,660 |
| 76. | Bernie | 29.9% | 8.7%(+21.2)#76 | 10.9%(+19.0)#2,698 |
| 77. | Bellerive Acres | 29.9% | 8.7%(+21.2)#77 | 10.9%(+19.0)#2,706 |
| 78. | Granby | 29.8% | 8.7%(+21.1)#78 | 10.9%(+18.9)#2,716 |
| 79. | Fenton | 29.0% | 8.7%(+20.3)#79 | 10.9%(+18.1)#2,815 |
| 80. | Clarksville | 28.5% | 8.7%(+19.8)#80 | 10.9%(+17.6)#2,880 |
| 81. | Armstrong | 28.5% | 8.7%(+19.8)#81 | 10.9%(+17.6)#2,889 |
| 82. | Merwin | 28.5% | 8.7%(+19.8)#82 | 10.9%(+17.6)#2,903 |
| 83. | St Clair | 28.2% | 8.7%(+19.5)#83 | 10.9%(+17.3)#2,933 |
| 84. | La Plata | 28.2% | 8.7%(+19.5)#84 | 10.9%(+17.3)#2,941 |
| 85. | Freeburg | 27.7% | 8.7%(+19.0)#85 | 10.9%(+16.8)#3,014 |
| 86. | Lamar | 27.2% | 8.7%(+18.5)#86 | 10.9%(+16.3)#3,067 |
| 87. | Branson West | 27.2% | 8.7%(+18.5)#87 | 10.9%(+16.3)#3,082 |
| 88. | Jasper | 26.8% | 8.7%(+18.1)#88 | 10.9%(+15.9)#3,148 |
| 89. | North Kansas City | 26.6% | 8.7%(+17.9)#89 | 10.9%(+15.7)#3,171 |
| 90. | Clarksburg | 26.6% | 8.7%(+17.9)#90 | 10.9%(+15.7)#3,188 |
| 91. | Lilbourn | 26.4% | 8.7%(+17.7)#91 | 10.9%(+15.5)#3,223 |
| 92. | Excelsior Estates | 26.4% | 8.7%(+17.7)#92 | 10.9%(+15.5)#3,227 |
| 93. | Diamond | 26.2% | 8.7%(+17.5)#93 | 10.9%(+15.3)#3,274 |
| 94. | Clinton | 25.9% | 8.7%(+17.2)#94 | 10.9%(+15.0)#3,316 |
| 95. | Sappington | 25.8% | 8.7%(+17.1)#95 | 10.9%(+14.9)#3,335 |
| 96. | Spanish Lake | 25.7% | 8.7%(+17.0)#96 | 10.9%(+14.8)#3,351 |
| 97. | Sunset Hills | 25.7% | 8.7%(+17.0)#97 | 10.9%(+14.8)#3,353 |
| 98. | Lathrop | 25.6% | 8.7%(+16.9)#98 | 10.9%(+14.7)#3,377 |
| 99. | West Sullivan | 25.5% | 8.7%(+16.8)#99 | 10.9%(+14.6)#3,395 |
| 100. | Peaceful Village | 25.0% | 8.7%(+16.3)#100 | 10.9%(+14.1)#3,505 |
Common Questions
What are the Top 10 Cities with the Highest Unemployment Rate Amomg Youth Under the Age of 25 in Missouri?
Top 10 Cities with the Highest Unemployment Rate Amomg Youth Under the Age of 25 in Missouri are:
#1
100.0%
#2
100.0%
#3
100.0%
#4
100.0%
#5
100.0%
#6
100.0%
#7
100.0%
#8
99.9%
#9
94.4%
#10
88.8%
What city has the Highest Unemployment Rate Amomg Youth Under the Age of 25 in Missouri?
Diehlstadt has the Highest Unemployment Rate Amomg Youth Under the Age of 25 in Missouri with 100.0%.
What is the Unemployment Rate Amomg Youth Under the Age of 25 in the State of Missouri?
Unemployment Rate Amomg Youth Under the Age of 25 in Missouri is 8.7%.
What is the Unemployment Rate Amomg Youth Under the Age of 25 in the United States?
Unemployment Rate Amomg Youth Under the Age of 25 in the United States is 10.9%.