Harbison Canyon, CA Map & Demographics
Harbison Canyon Map
Harbison Canyon Overview
$55,307
PER CAPITA INCOME
$116,300
AVG FAMILY INCOME
$111,689
AVG HOUSEHOLD INCOME
44.8%
WAGE / INCOME GAP [ % ]
55.2¢/ $1
WAGE / INCOME GAP [ $ ]
0.49
INEQUALITY / GINI INDEX
4,137
TOTAL POPULATION
1,937
MALE POPULATION
2,200
FEMALE POPULATION
88.05
MALES / 100 FEMALES
113.58
FEMALES / 100 MALES
44.2
MEDIAN AGE
3.1
AVG FAMILY SIZE
2.9
AVG HOUSEHOLD SIZE
2,245
LABOR FORCE [ PEOPLE ]
60.1%
PERCENT IN LABOR FORCE
9.3%
UNEMPLOYMENT RATE
Income in Harbison Canyon
Income Overview in Harbison Canyon
Per Capita Income in Harbison Canyon is $55,307, while median incomes of families and households are $116,300 and $111,689 respectively.
| Characteristic | Number | Measure |
| Per Capita Income | 4,137 | $55,307 |
| Median Family Income | 1,122 | $116,300 |
| Mean Family Income | 1,122 | $171,048 |
| Median Household Income | 1,434 | $111,689 |
| Mean Household Income | 1,434 | $155,666 |
| Income Deficit | 1,122 | $0 |
| Wage / Income Gap (%) | 4,137 | 44.79% |
| Wage / Income Gap ($) | 4,137 | 55.21¢ per $1 |
| Gini / Inequality Index | 4,137 | 0.49 |
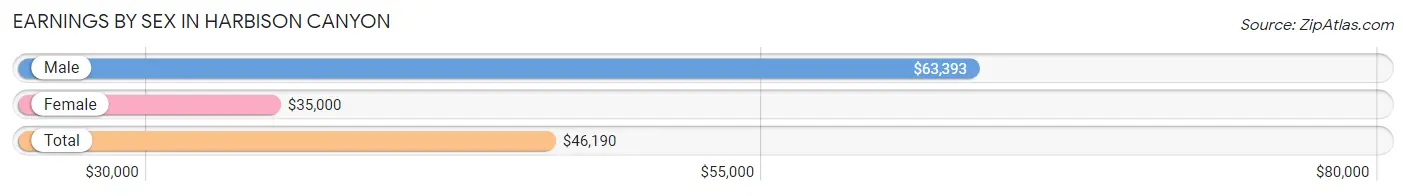
Earnings by Sex in Harbison Canyon
Average Earnings in Harbison Canyon are $46,190, $63,393 for men and $35,000 for women, a difference of 44.8%.
| Sex | Number | Average Earnings |
| Male | 1,110 (47.9%) | $63,393 |
| Female | 1,206 (52.1%) | $35,000 |
| Total | 2,316 (100.0%) | $46,190 |
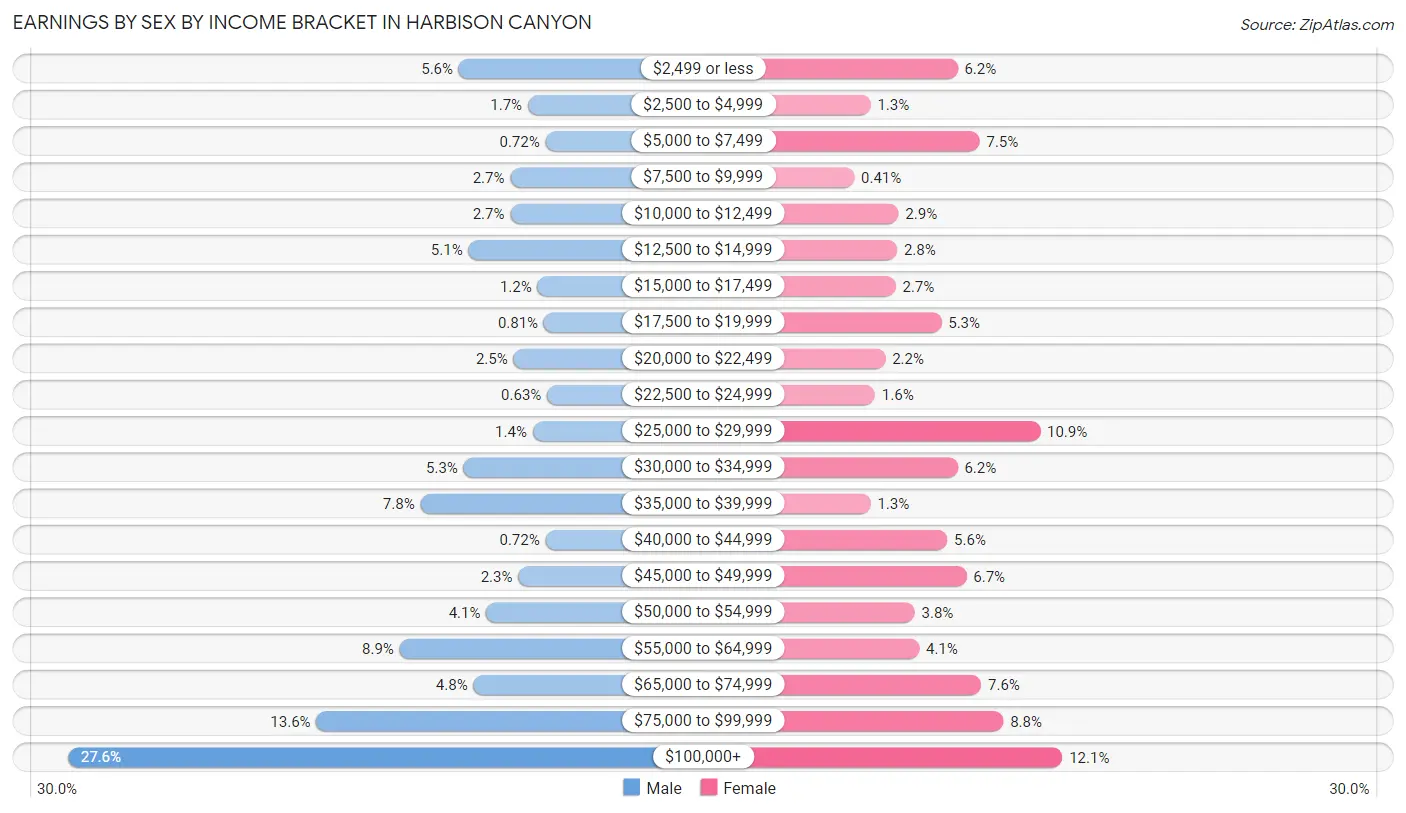
Earnings by Sex by Income Bracket in Harbison Canyon
The most common earnings brackets in Harbison Canyon are $100,000+ for men (306 | 27.6%) and $100,000+ for women (146 | 12.1%).
| Income | Male | Female |
| $2,499 or less | 62 (5.6%) | 75 (6.2%) |
| $2,500 to $4,999 | 19 (1.7%) | 16 (1.3%) |
| $5,000 to $7,499 | 8 (0.7%) | 90 (7.5%) |
| $7,500 to $9,999 | 30 (2.7%) | 5 (0.4%) |
| $10,000 to $12,499 | 30 (2.7%) | 35 (2.9%) |
| $12,500 to $14,999 | 56 (5.1%) | 34 (2.8%) |
| $15,000 to $17,499 | 13 (1.2%) | 33 (2.7%) |
| $17,500 to $19,999 | 9 (0.8%) | 64 (5.3%) |
| $20,000 to $22,499 | 28 (2.5%) | 26 (2.2%) |
| $22,500 to $24,999 | 7 (0.6%) | 19 (1.6%) |
| $25,000 to $29,999 | 16 (1.4%) | 131 (10.9%) |
| $30,000 to $34,999 | 59 (5.3%) | 75 (6.2%) |
| $35,000 to $39,999 | 86 (7.7%) | 16 (1.3%) |
| $40,000 to $44,999 | 8 (0.7%) | 68 (5.6%) |
| $45,000 to $49,999 | 25 (2.2%) | 81 (6.7%) |
| $50,000 to $54,999 | 45 (4.1%) | 46 (3.8%) |
| $55,000 to $64,999 | 99 (8.9%) | 49 (4.1%) |
| $65,000 to $74,999 | 53 (4.8%) | 91 (7.5%) |
| $75,000 to $99,999 | 151 (13.6%) | 106 (8.8%) |
| $100,000+ | 306 (27.6%) | 146 (12.1%) |
| Total | 1,110 (100.0%) | 1,206 (100.0%) |
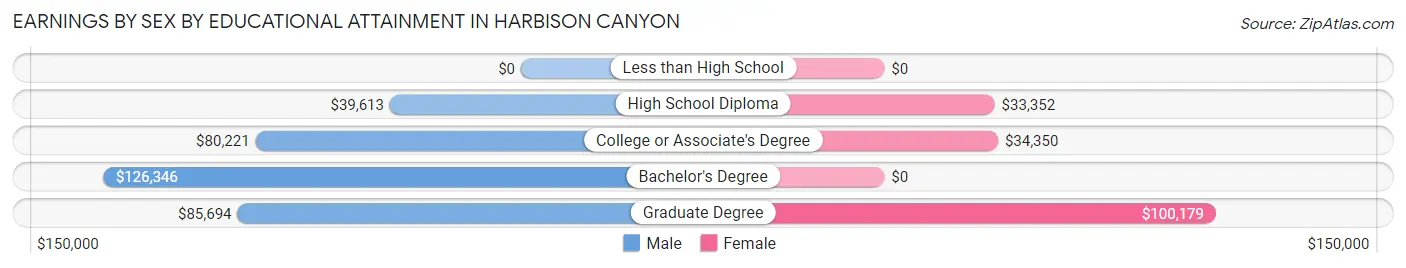
Earnings by Sex by Educational Attainment in Harbison Canyon
Average earnings in Harbison Canyon are $71,367 for men and $45,000 for women, a difference of 36.9%. Men with an educational attainment of bachelor's degree enjoy the highest average annual earnings of $126,346, while those with high school diploma education earn the least with $39,613. Women with an educational attainment of graduate degree earn the most with the average annual earnings of $100,179, while those with high school diploma education have the smallest earnings of $33,352.
| Educational Attainment | Male Income | Female Income |
| Less than High School | - | - |
| High School Diploma | $39,613 | $33,352 |
| College or Associate's Degree | $80,221 | $34,350 |
| Bachelor's Degree | $126,346 | $0 |
| Graduate Degree | $85,694 | $100,179 |
| Total | $71,367 | $45,000 |
Family Income in Harbison Canyon
Family Income Brackets in Harbison Canyon
According to the Harbison Canyon family income data, there are 269 families falling into the $50,000 to $74,999 income range, which is the most common income bracket and makes up 24.0% of all families.
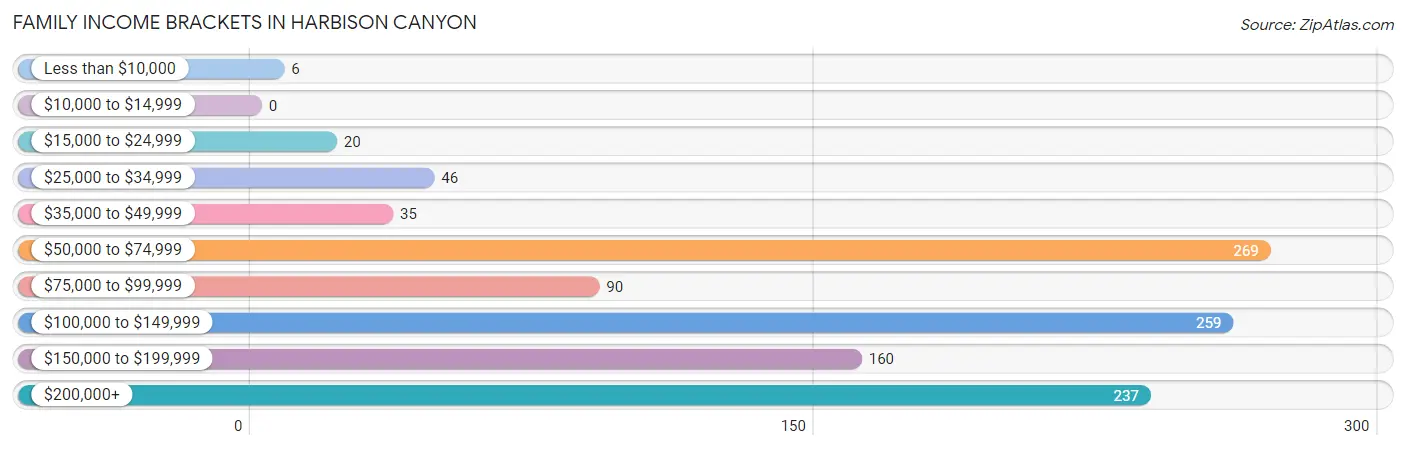
| Income Bracket | # Families | % Families |
| Less than $10,000 | 6 | 0.5% |
| $10,000 to $14,999 | 0 | 0.0% |
| $15,000 to $24,999 | 20 | 1.8% |
| $25,000 to $34,999 | 46 | 4.1% |
| $35,000 to $49,999 | 35 | 3.1% |
| $50,000 to $74,999 | 269 | 24.0% |
| $75,000 to $99,999 | 90 | 8.0% |
| $100,000 to $149,999 | 259 | 23.1% |
| $150,000 to $199,999 | 160 | 14.3% |
| $200,000+ | 237 | 21.1% |
Family Income by Famaliy Size in Harbison Canyon
4-person families (203 | 18.1%) account for the highest median family income in Harbison Canyon with $158,631 per family, while 2-person families (575 | 51.2%) have the highest median income of $51,489 per family member.
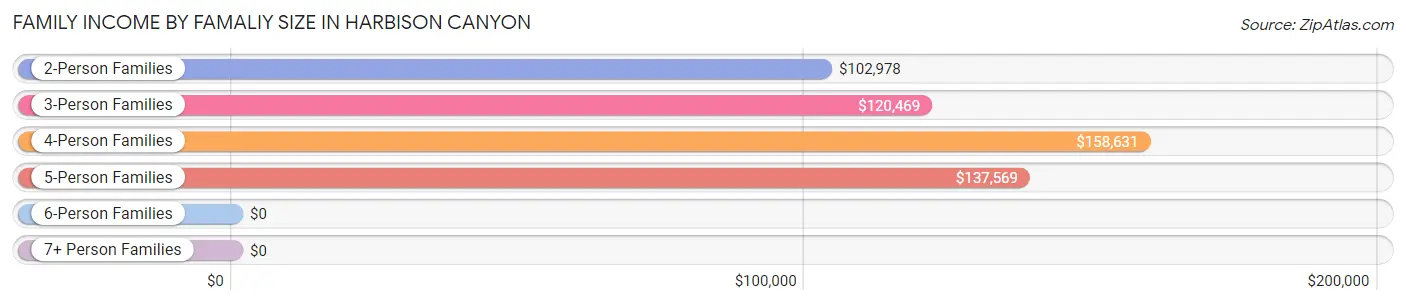
| Income Bracket | # Families | Median Income |
| 2-Person Families | 575 (51.2%) | $102,978 |
| 3-Person Families | 265 (23.6%) | $120,469 |
| 4-Person Families | 203 (18.1%) | $158,631 |
| 5-Person Families | 61 (5.4%) | $137,569 |
| 6-Person Families | 0 (0.0%) | $0 |
| 7+ Person Families | 18 (1.6%) | $0 |
| Total | 1,122 (100.0%) | $116,300 |
Family Income by Number of Earners in Harbison Canyon
The median family income in Harbison Canyon is $116,300, with families comprising 2 earners (426) having the highest median family income of $173,182, while families with 1 earner (354) have the lowest median family income of $72,372, accounting for 38.0% and 31.6% of families, respectively.
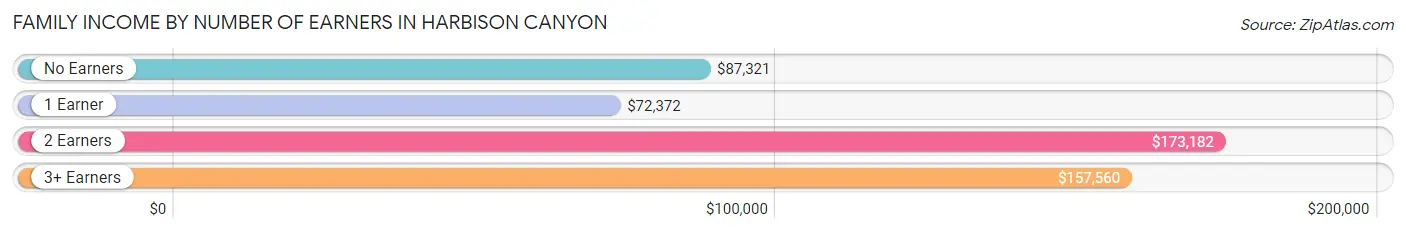
| Number of Earners | # Families | Median Income |
| No Earners | 149 (13.3%) | $87,321 |
| 1 Earner | 354 (31.6%) | $72,372 |
| 2 Earners | 426 (38.0%) | $173,182 |
| 3+ Earners | 193 (17.2%) | $157,560 |
| Total | 1,122 (100.0%) | $116,300 |
Household Income in Harbison Canyon
Household Income Brackets in Harbison Canyon
With 313 households falling in the category, the $100,000 to $149,999 income range is the most frequent in Harbison Canyon, accounting for 21.8% of all households. In contrast, only 6 households (0.4%) fall into the $15,000 to $24,999 income bracket, making it the least populous group.
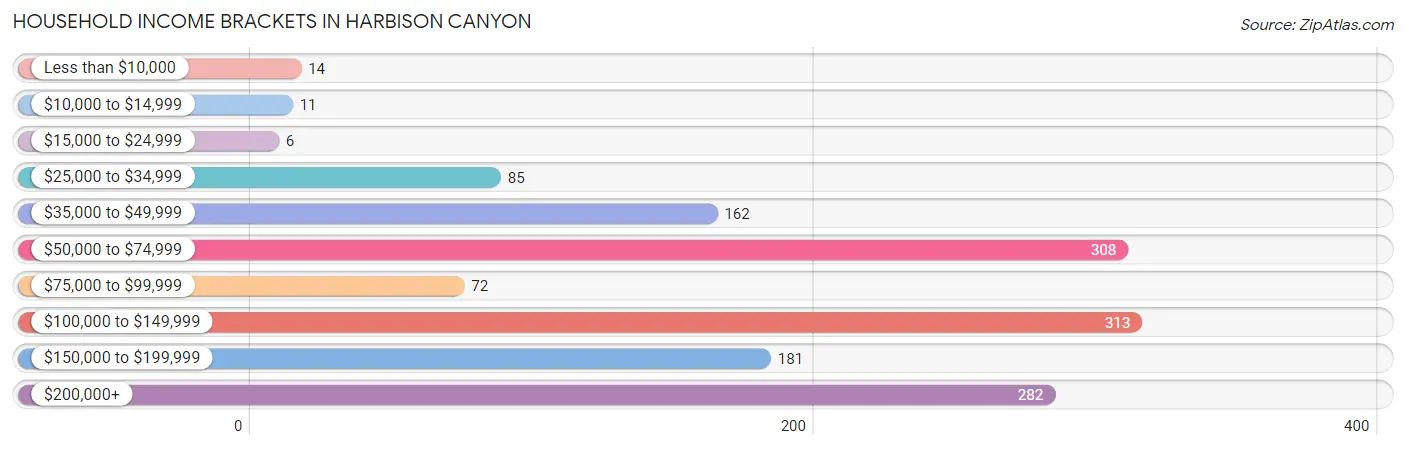
| Income Bracket | # Households | % Households |
| Less than $10,000 | 14 | 1.0% |
| $10,000 to $14,999 | 11 | 0.8% |
| $15,000 to $24,999 | 6 | 0.4% |
| $25,000 to $34,999 | 85 | 5.9% |
| $35,000 to $49,999 | 162 | 11.3% |
| $50,000 to $74,999 | 308 | 21.5% |
| $75,000 to $99,999 | 72 | 5.0% |
| $100,000 to $149,999 | 313 | 21.8% |
| $150,000 to $199,999 | 181 | 12.6% |
| $200,000+ | 282 | 19.7% |
Household Income by Householder Age in Harbison Canyon
The median household income in Harbison Canyon is $111,689, with the highest median household income of $115,636 found in the 45 to 64 years age bracket for the primary householder. A total of 616 households (43.0%) fall into this category.
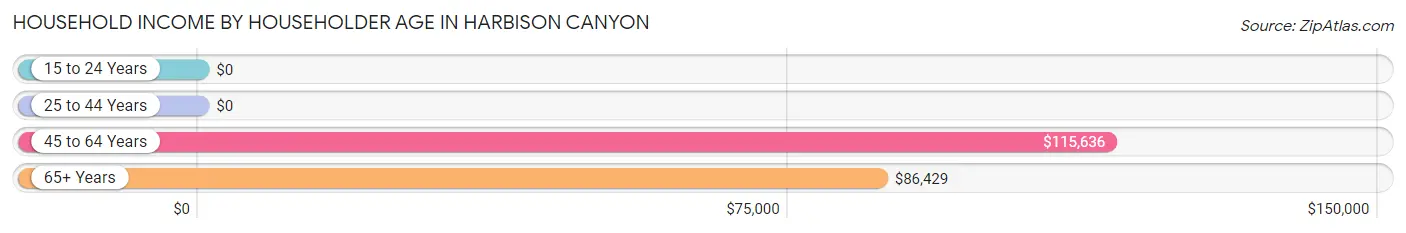
| Income Bracket | # Households | Median Income |
| 15 to 24 Years | 0 (0.0%) | $0 |
| 25 to 44 Years | 410 (28.6%) | $0 |
| 45 to 64 Years | 616 (43.0%) | $115,636 |
| 65+ Years | 408 (28.4%) | $86,429 |
| Total | 1,434 (100.0%) | $111,689 |
Poverty in Harbison Canyon
Income Below Poverty by Sex and Age in Harbison Canyon
With 5.0% poverty level for males and 7.2% for females among the residents of Harbison Canyon, 16 and 17 year old males and 6 to 11 year old females are the most vulnerable to poverty, with 11 males (12.5%) and 11 females (47.8%) in their respective age groups living below the poverty level.
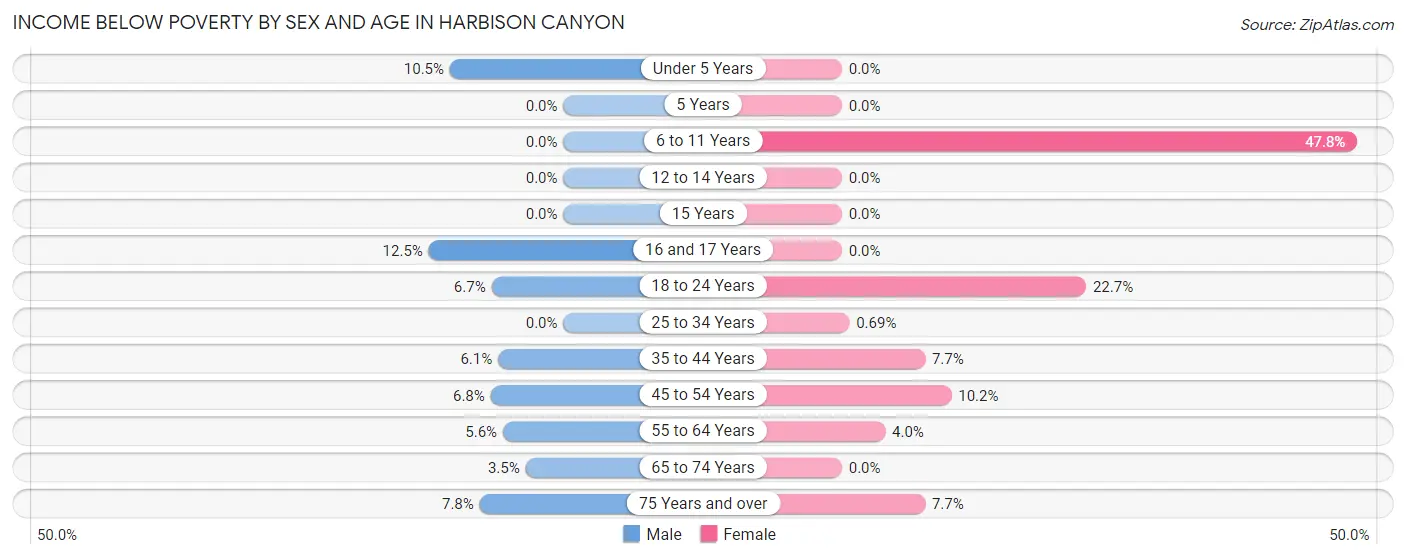
| Age Bracket | Male | Female |
| Under 5 Years | 4 (10.5%) | 0 (0.0%) |
| 5 Years | 0 (0.0%) | 0 (0.0%) |
| 6 to 11 Years | 0 (0.0%) | 11 (47.8%) |
| 12 to 14 Years | 0 (0.0%) | 0 (0.0%) |
| 15 Years | 0 (0.0%) | 0 (0.0%) |
| 16 and 17 Years | 11 (12.5%) | 0 (0.0%) |
| 18 to 24 Years | 18 (6.7%) | 63 (22.7%) |
| 25 to 34 Years | 0 (0.0%) | 2 (0.7%) |
| 35 to 44 Years | 10 (6.1%) | 21 (7.7%) |
| 45 to 54 Years | 11 (6.8%) | 19 (10.2%) |
| 55 to 64 Years | 29 (5.6%) | 19 (4.0%) |
| 65 to 74 Years | 6 (3.5%) | 0 (0.0%) |
| 75 Years and over | 8 (7.8%) | 21 (7.7%) |
| Total | 97 (5.0%) | 156 (7.2%) |
Income Above Poverty by Sex and Age in Harbison Canyon
According to the poverty statistics in Harbison Canyon, males aged 5 years and females aged under 5 years are the age groups that are most secure financially, with 100.0% of males and 100.0% of females in these age groups living above the poverty line.
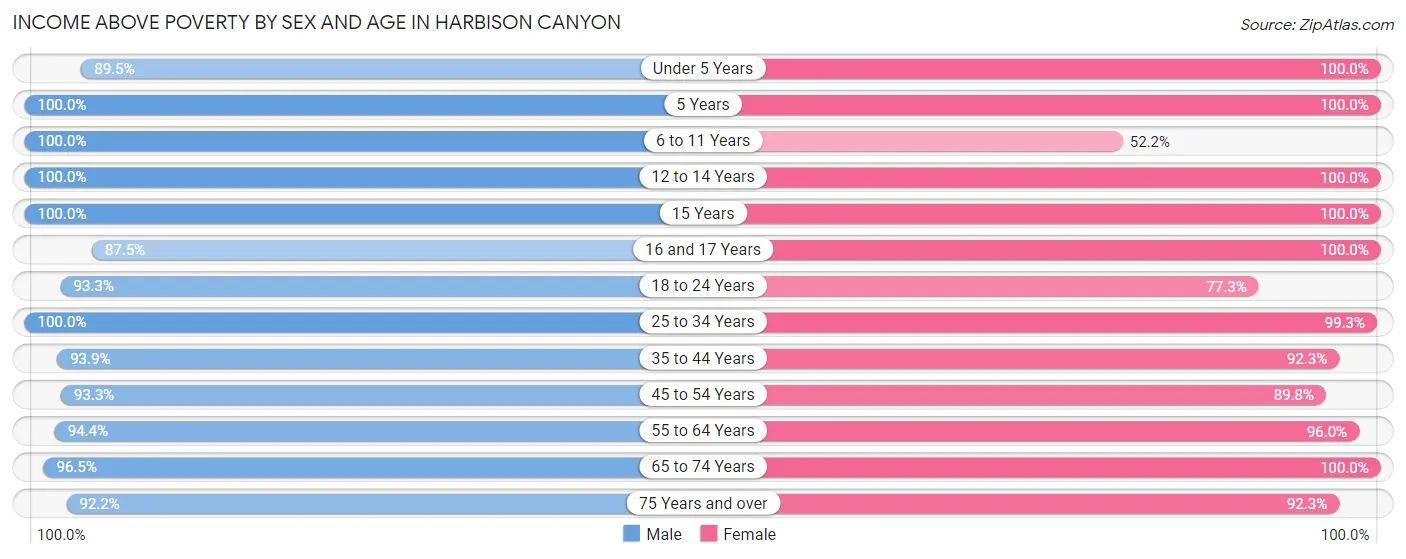
| Age Bracket | Male | Female |
| Under 5 Years | 34 (89.5%) | 54 (100.0%) |
| 5 Years | 12 (100.0%) | 21 (100.0%) |
| 6 to 11 Years | 70 (100.0%) | 12 (52.2%) |
| 12 to 14 Years | 58 (100.0%) | 40 (100.0%) |
| 15 Years | 24 (100.0%) | 15 (100.0%) |
| 16 and 17 Years | 77 (87.5%) | 111 (100.0%) |
| 18 to 24 Years | 252 (93.3%) | 215 (77.3%) |
| 25 to 34 Years | 251 (100.0%) | 287 (99.3%) |
| 35 to 44 Years | 155 (93.9%) | 251 (92.3%) |
| 45 to 54 Years | 152 (93.2%) | 168 (89.8%) |
| 55 to 64 Years | 488 (94.4%) | 454 (96.0%) |
| 65 to 74 Years | 165 (96.5%) | 125 (100.0%) |
| 75 Years and over | 95 (92.2%) | 251 (92.3%) |
| Total | 1,833 (95.0%) | 2,004 (92.8%) |
Income Below Poverty Among Married-Couple Families in Harbison Canyon
The poverty statistics for married-couple families in Harbison Canyon show that 2.5% or 20 of the total 803 families live below the poverty line. Families with 1 or 2 children have the highest poverty rate of 5.5%, comprising of 10 families. On the other hand, families with 3 or 4 children have the lowest poverty rate of 0.0%, which includes 0 families.
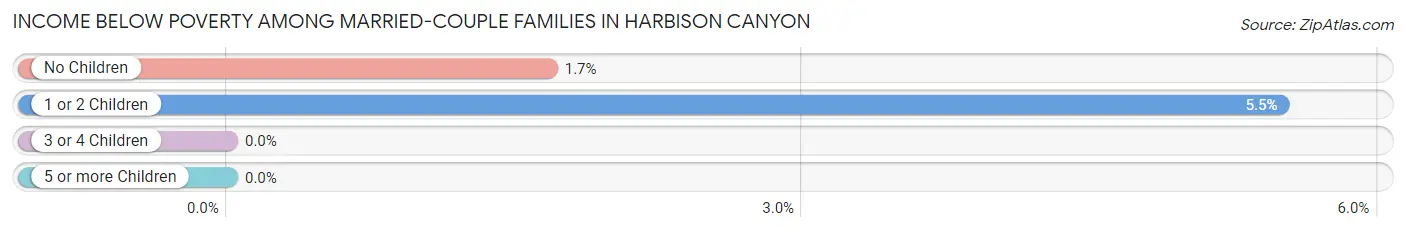
| Children | Above Poverty | Below Poverty |
| No Children | 589 (98.3%) | 10 (1.7%) |
| 1 or 2 Children | 172 (94.5%) | 10 (5.5%) |
| 3 or 4 Children | 22 (100.0%) | 0 (0.0%) |
| 5 or more Children | 0 (0.0%) | 0 (0.0%) |
| Total | 783 (97.5%) | 20 (2.5%) |
Income Below Poverty Among Single-Parent Households in Harbison Canyon
According to the poverty data in Harbison Canyon, 14.3% or 8 single-father households and 0.8% or 2 single-mother households are living below the poverty line. Among single-father households, those with no children have the highest poverty rate, with 8 households (14.3%) experiencing poverty. Likewise, among single-mother households, those with 1 or 2 children have the highest poverty rate, with 2 households (5.1%) falling below the poverty line.
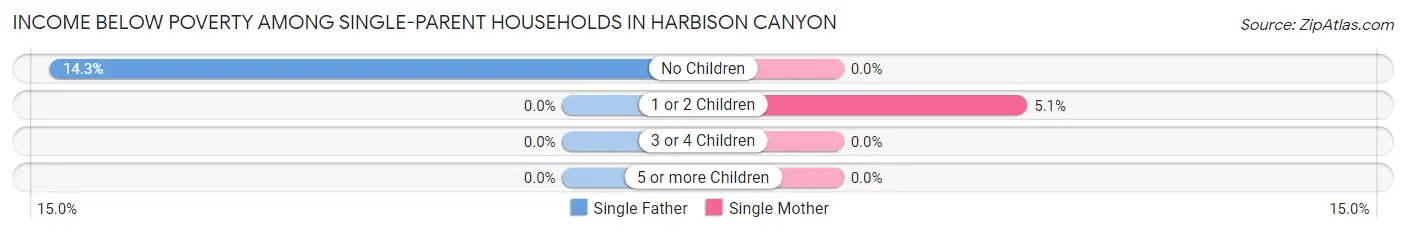
| Children | Single Father | Single Mother |
| No Children | 8 (14.3%) | 0 (0.0%) |
| 1 or 2 Children | 0 (0.0%) | 2 (5.1%) |
| 3 or 4 Children | 0 (0.0%) | 0 (0.0%) |
| 5 or more Children | 0 (0.0%) | 0 (0.0%) |
| Total | 8 (14.3%) | 2 (0.8%) |
Income Below Poverty Among Married-Couple vs Single-Parent Households in Harbison Canyon
The poverty data for Harbison Canyon shows that 20 of the married-couple family households (2.5%) and 10 of the single-parent households (3.1%) are living below the poverty level. Within the married-couple family households, those with 1 or 2 children have the highest poverty rate, with 10 households (5.5%) falling below the poverty line. Among the single-parent households, those with 1 or 2 children have the highest poverty rate, with 2 household (5.1%) living below poverty.
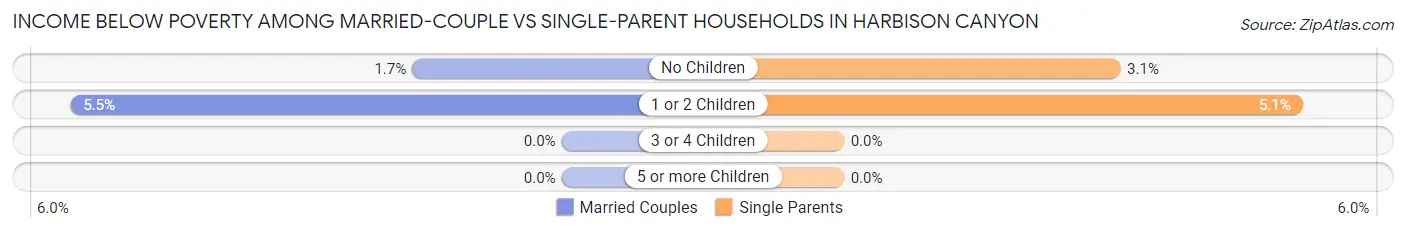
| Children | Married-Couple Families | Single-Parent Households |
| No Children | 10 (1.7%) | 8 (3.1%) |
| 1 or 2 Children | 10 (5.5%) | 2 (5.1%) |
| 3 or 4 Children | 0 (0.0%) | 0 (0.0%) |
| 5 or more Children | 0 (0.0%) | 0 (0.0%) |
| Total | 20 (2.5%) | 10 (3.1%) |
Race in Harbison Canyon
The most populous races in Harbison Canyon are White / Caucasian (3,395 | 82.1%), Hispanic or Latino (765 | 18.5%), and Two or more Races (555 | 13.4%).
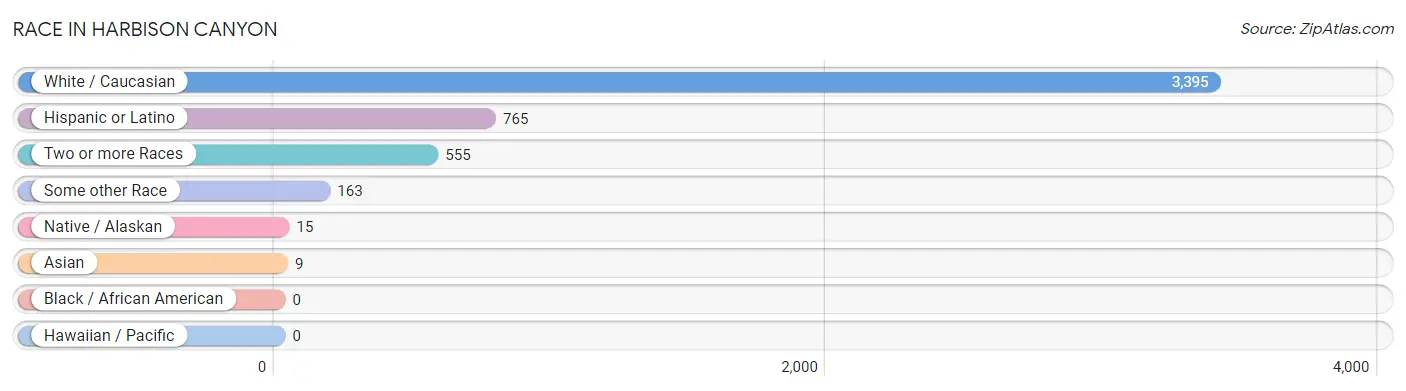
| Race | # Population | % Population |
| Asian | 9 | 0.2% |
| Black / African American | 0 | 0.0% |
| Hawaiian / Pacific | 0 | 0.0% |
| Hispanic or Latino | 765 | 18.5% |
| Native / Alaskan | 15 | 0.4% |
| White / Caucasian | 3,395 | 82.1% |
| Two or more Races | 555 | 13.4% |
| Some other Race | 163 | 3.9% |
| Total | 4,137 | 100.0% |
Ancestry in Harbison Canyon
The most populous ancestries reported in Harbison Canyon are Mexican (705 | 17.0%), Irish (682 | 16.5%), German (639 | 15.4%), English (627 | 15.2%), and European (304 | 7.3%), together accounting for 71.5% of all Harbison Canyon residents.
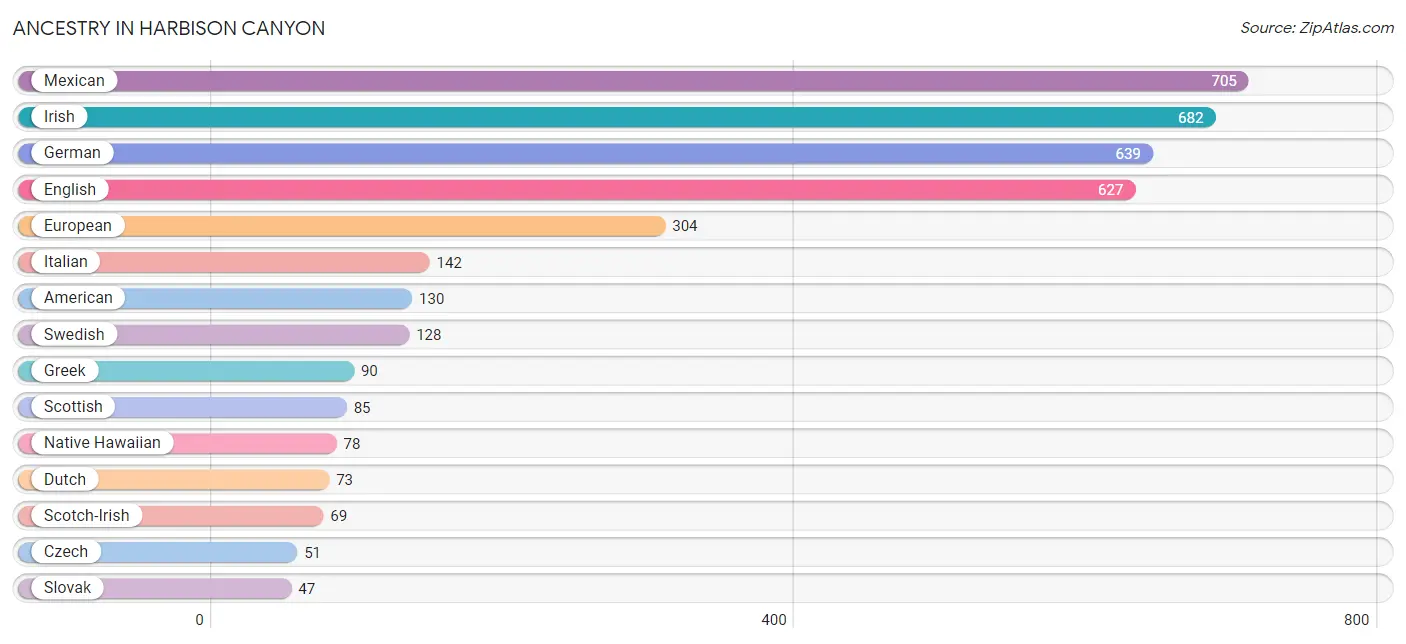
| Ancestry | # Population | % Population |
| African | 6 | 0.2% |
| American | 130 | 3.1% |
| Austrian | 18 | 0.4% |
| Brazilian | 30 | 0.7% |
| British | 36 | 0.9% |
| Burmese | 10 | 0.2% |
| Central American | 24 | 0.6% |
| Cherokee | 4 | 0.1% |
| Costa Rican | 24 | 0.6% |
| Croatian | 14 | 0.3% |
| Czech | 51 | 1.2% |
| Dutch | 73 | 1.8% |
| Eastern European | 4 | 0.1% |
| English | 627 | 15.2% |
| European | 304 | 7.3% |
| French | 35 | 0.9% |
| French Canadian | 34 | 0.8% |
| German | 639 | 15.4% |
| Greek | 90 | 2.2% |
| Hungarian | 14 | 0.3% |
| Irish | 682 | 16.5% |
| Italian | 142 | 3.4% |
| Korean | 12 | 0.3% |
| Lithuanian | 8 | 0.2% |
| Mexican | 705 | 17.0% |
| Native Hawaiian | 78 | 1.9% |
| Norwegian | 41 | 1.0% |
| Pennsylvania German | 8 | 0.2% |
| Polish | 28 | 0.7% |
| Puerto Rican | 25 | 0.6% |
| Russian | 36 | 0.9% |
| Scotch-Irish | 69 | 1.7% |
| Scottish | 85 | 2.1% |
| Slavic | 40 | 1.0% |
| Slovak | 47 | 1.1% |
| Spaniard | 7 | 0.2% |
| Spanish American | 4 | 0.1% |
| Subsaharan African | 6 | 0.2% |
| Swedish | 128 | 3.1% |
| Swiss | 14 | 0.3% |
| Ukrainian | 13 | 0.3% |
| Welsh | 12 | 0.3% | View All 42 Rows |
Immigrants in Harbison Canyon
The most numerous immigrant groups reported in Harbison Canyon came from Latin America (59 | 1.4%), Central America (54 | 1.3%), Mexico (54 | 1.3%), Europe (48 | 1.2%), and Northern Europe (34 | 0.8%), together accounting for 6.0% of all Harbison Canyon residents.
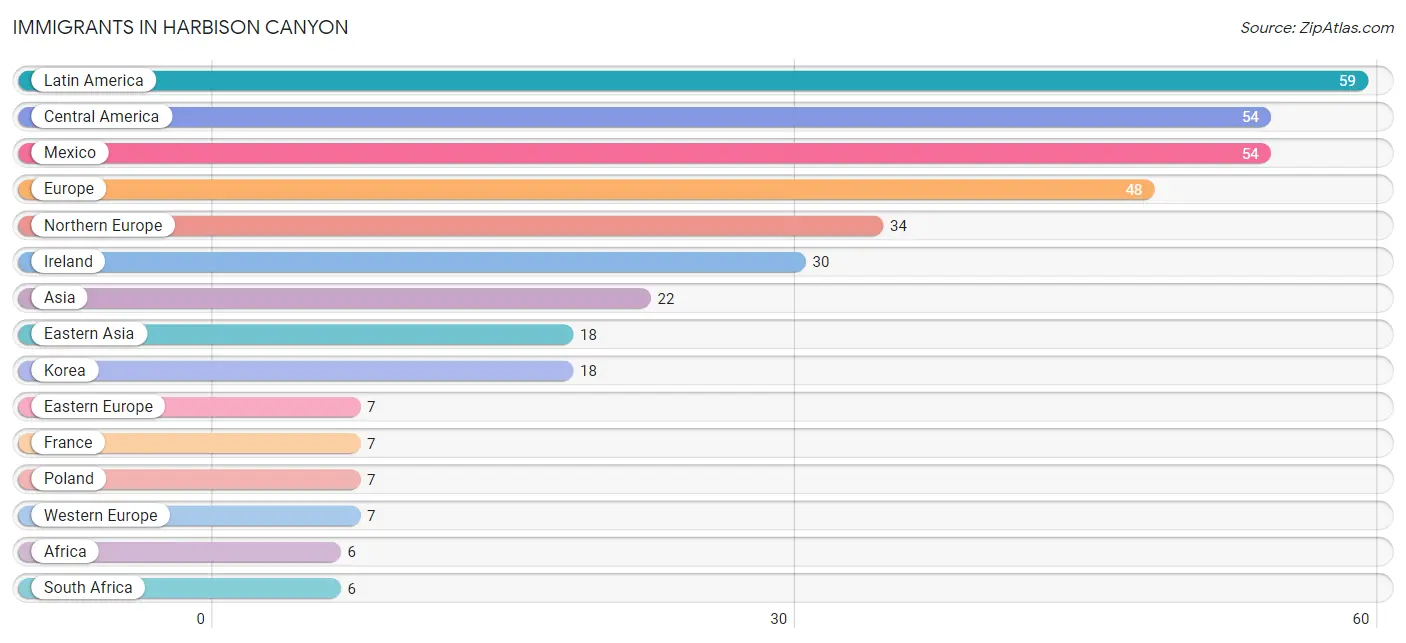
| Immigration Origin | # Population | % Population |
| Africa | 6 | 0.2% |
| Asia | 22 | 0.5% |
| Central America | 54 | 1.3% |
| Eastern Asia | 18 | 0.4% |
| Eastern Europe | 7 | 0.2% |
| Europe | 48 | 1.2% |
| France | 7 | 0.2% |
| Indonesia | 4 | 0.1% |
| Ireland | 30 | 0.7% |
| Korea | 18 | 0.4% |
| Latin America | 59 | 1.4% |
| Mexico | 54 | 1.3% |
| Northern Europe | 34 | 0.8% |
| Poland | 7 | 0.2% |
| South Africa | 6 | 0.2% |
| South America | 5 | 0.1% |
| South Eastern Asia | 4 | 0.1% |
| Uruguay | 5 | 0.1% |
| Western Europe | 7 | 0.2% | View All 19 Rows |
Sex and Age in Harbison Canyon
Sex and Age in Harbison Canyon
The most populous age groups in Harbison Canyon are 55 to 59 Years (283 | 14.6%) for men and 60 to 64 Years (260 | 11.8%) for women.
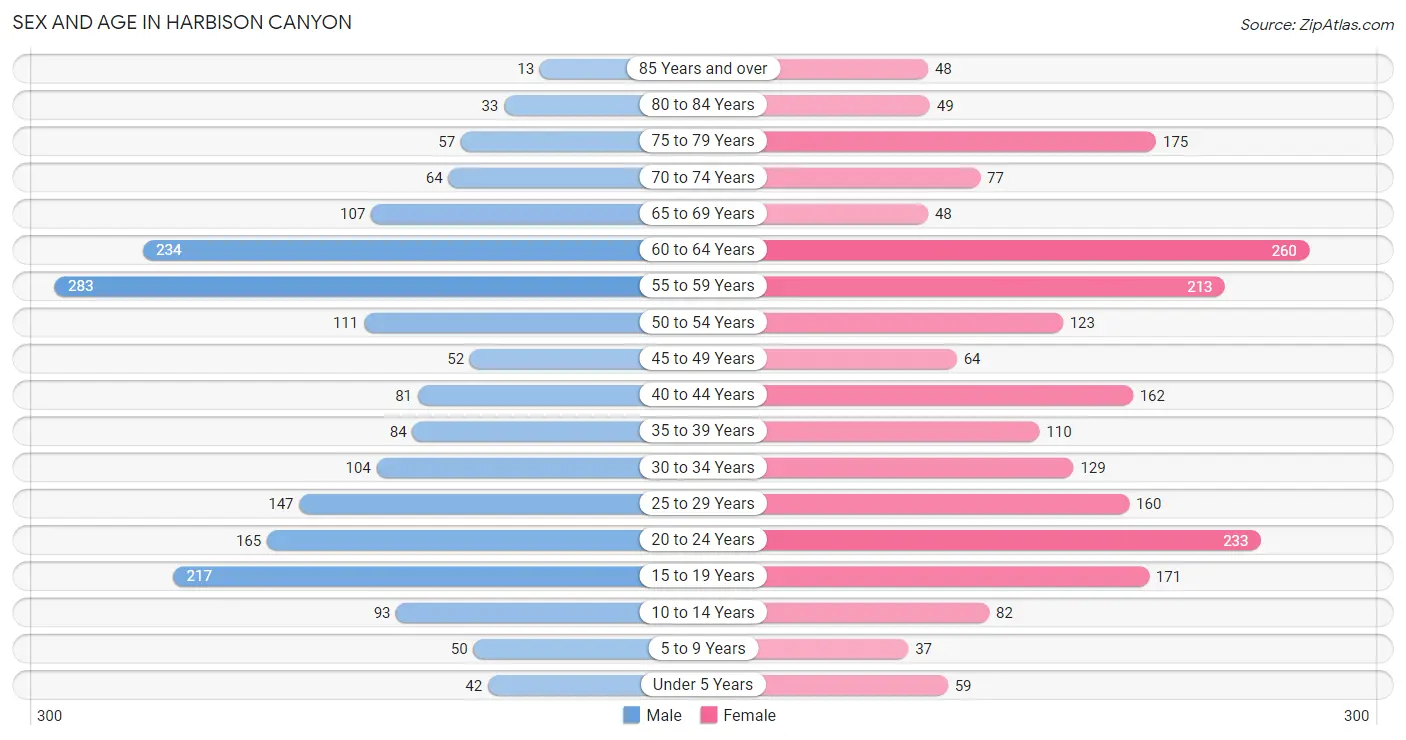
| Age Bracket | Male | Female |
| Under 5 Years | 42 (2.2%) | 59 (2.7%) |
| 5 to 9 Years | 50 (2.6%) | 37 (1.7%) |
| 10 to 14 Years | 93 (4.8%) | 82 (3.7%) |
| 15 to 19 Years | 217 (11.2%) | 171 (7.8%) |
| 20 to 24 Years | 165 (8.5%) | 233 (10.6%) |
| 25 to 29 Years | 147 (7.6%) | 160 (7.3%) |
| 30 to 34 Years | 104 (5.4%) | 129 (5.9%) |
| 35 to 39 Years | 84 (4.3%) | 110 (5.0%) |
| 40 to 44 Years | 81 (4.2%) | 162 (7.4%) |
| 45 to 49 Years | 52 (2.7%) | 64 (2.9%) |
| 50 to 54 Years | 111 (5.7%) | 123 (5.6%) |
| 55 to 59 Years | 283 (14.6%) | 213 (9.7%) |
| 60 to 64 Years | 234 (12.1%) | 260 (11.8%) |
| 65 to 69 Years | 107 (5.5%) | 48 (2.2%) |
| 70 to 74 Years | 64 (3.3%) | 77 (3.5%) |
| 75 to 79 Years | 57 (2.9%) | 175 (8.0%) |
| 80 to 84 Years | 33 (1.7%) | 49 (2.2%) |
| 85 Years and over | 13 (0.7%) | 48 (2.2%) |
| Total | 1,937 (100.0%) | 2,200 (100.0%) |
Families and Households in Harbison Canyon
Median Family Size in Harbison Canyon
The median family size in Harbison Canyon is 3.06 persons per family, with single female/mother families (263 | 23.4%) accounting for the largest median family size of 3.19 persons per family. On the other hand, single male/father families (56 | 5.0%) represent the smallest median family size with 2.61 persons per family.
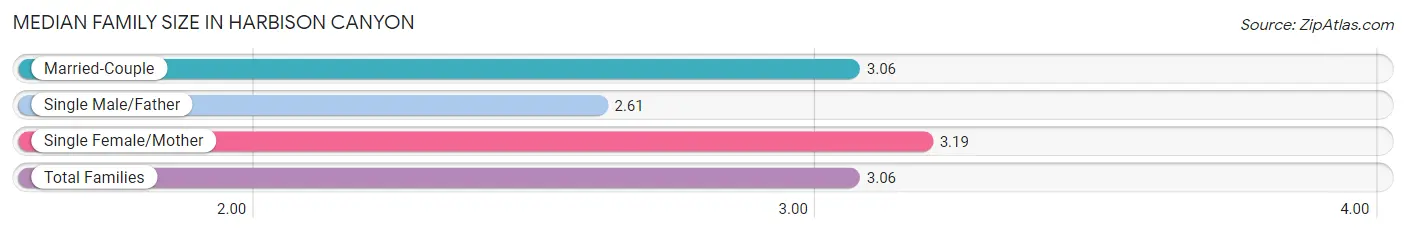
| Family Type | # Families | Family Size |
| Married-Couple | 803 (71.6%) | 3.06 |
| Single Male/Father | 56 (5.0%) | 2.61 |
| Single Female/Mother | 263 (23.4%) | 3.19 |
| Total Families | 1,122 (100.0%) | 3.06 |
Median Household Size in Harbison Canyon
The median household size in Harbison Canyon is 2.88 persons per household, with single female/mother households (263 | 18.3%) accounting for the largest median household size of 3.83 persons per household. non-family households (312 | 21.8%) represent the smallest median household size with 1.23 persons per household.
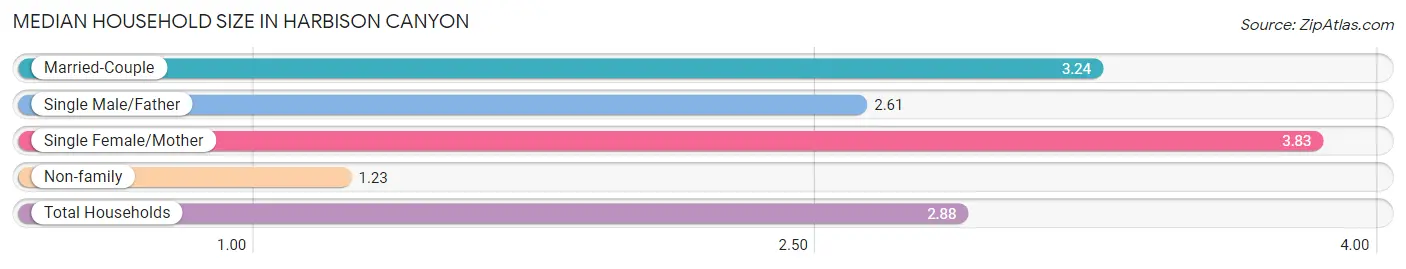
| Household Type | # Households | Household Size |
| Married-Couple | 803 (56.0%) | 3.24 |
| Single Male/Father | 56 (3.9%) | 2.61 |
| Single Female/Mother | 263 (18.3%) | 3.83 |
| Non-family | 312 (21.8%) | 1.23 |
| Total Households | 1,434 (100.0%) | 2.88 |
Household Size by Marriage Status in Harbison Canyon
Out of a total of 1,434 households in Harbison Canyon, 1,122 (78.2%) are family households, while 312 (21.8%) are nonfamily households. The most numerous type of family households are 2-person households, comprising 490, and the most common type of nonfamily households are 1-person households, comprising 264.
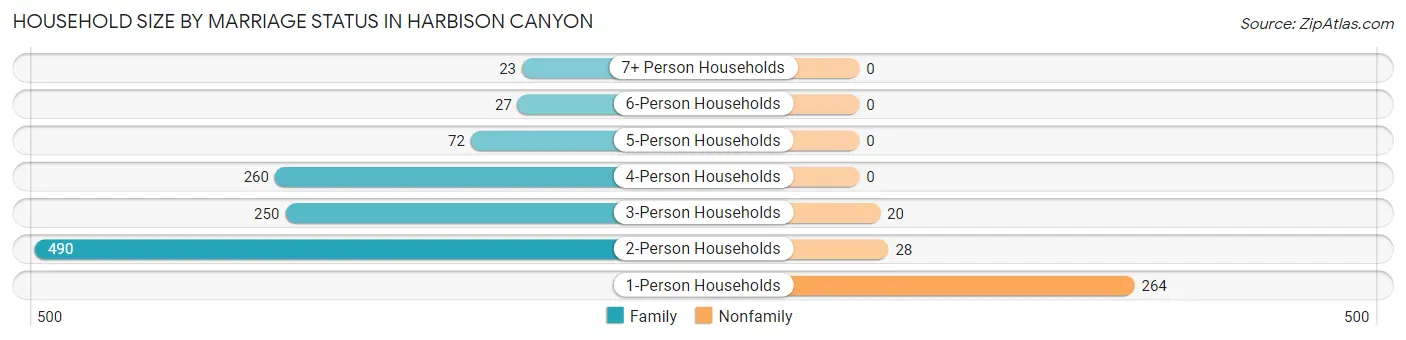
| Household Size | Family Households | Nonfamily Households |
| 1-Person Households | - | 264 (18.4%) |
| 2-Person Households | 490 (34.2%) | 28 (1.9%) |
| 3-Person Households | 250 (17.4%) | 20 (1.4%) |
| 4-Person Households | 260 (18.1%) | 0 (0.0%) |
| 5-Person Households | 72 (5.0%) | 0 (0.0%) |
| 6-Person Households | 27 (1.9%) | 0 (0.0%) |
| 7+ Person Households | 23 (1.6%) | 0 (0.0%) |
| Total | 1,122 (78.2%) | 312 (21.8%) |
Female Fertility in Harbison Canyon
Fertility by Age in Harbison Canyon
Average fertility rate in Harbison Canyon is 36.0 births per 1,000 women. Women in the age bracket of 35 to 50 years have the highest fertility rate with 106.0 births per 1,000 women. Women in the age bracket of 35 to 50 years acount for 100.0% of all women with births.
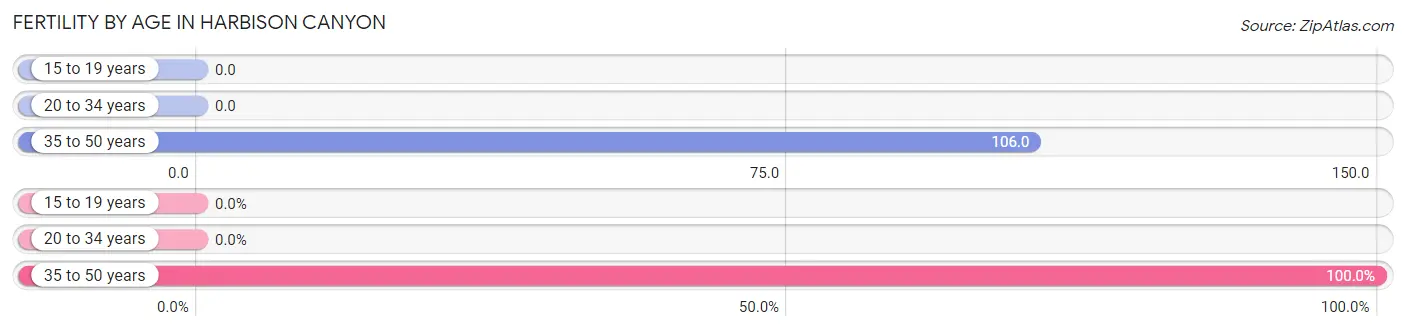
| Age Bracket | Women with Births | Births / 1,000 Women |
| 15 to 19 years | 0 (0.0%) | 0.0 |
| 20 to 34 years | 0 (0.0%) | 0.0 |
| 35 to 50 years | 38 (100.0%) | 106.0 |
| Total | 38 (100.0%) | 36.0 |
Fertility by Age by Marriage Status in Harbison Canyon
18.4% of women with births (38) in Harbison Canyon are married. The highest percentage of unmarried women with births falls into 35 to 50 years age bracket with 81.6% of them unmarried at the time of birth, while the lowest percentage of unmarried women with births belong to 35 to 50 years age bracket with 81.6% of them unmarried.
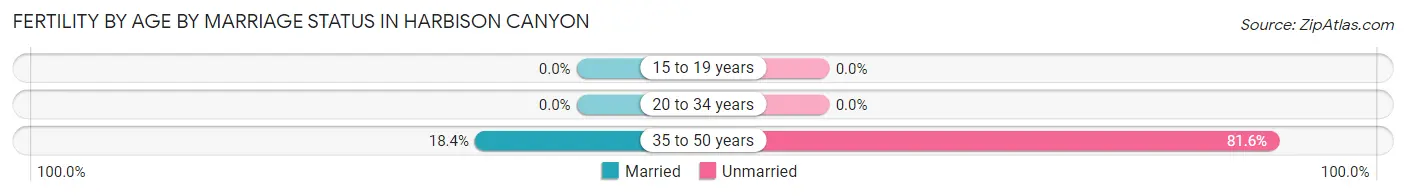
| Age Bracket | Married | Unmarried |
| 15 to 19 years | 0 (0.0%) | 0 (0.0%) |
| 20 to 34 years | 0 (0.0%) | 0 (0.0%) |
| 35 to 50 years | 7 (18.4%) | 31 (81.6%) |
| Total | 7 (18.4%) | 31 (81.6%) |
Fertility by Education in Harbison Canyon
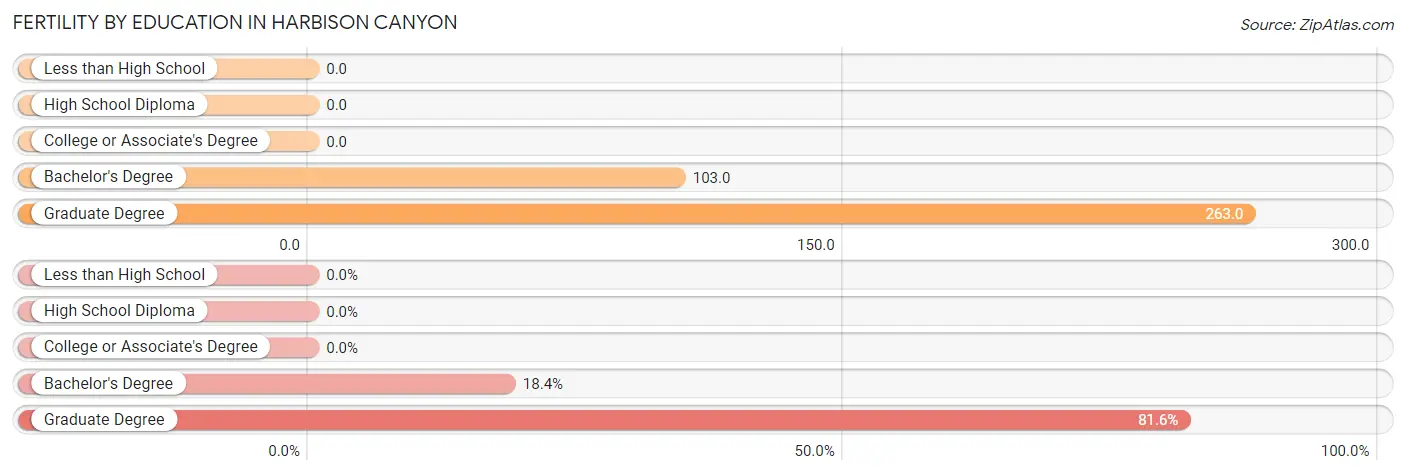
| Educational Attainment | Women with Births | Births / 1,000 Women |
| Less than High School | 0 (0.0%) | 0.0 |
| High School Diploma | 0 (0.0%) | 0.0 |
| College or Associate's Degree | 0 (0.0%) | 0.0 |
| Bachelor's Degree | 7 (18.4%) | 103.0 |
| Graduate Degree | 31 (81.6%) | 263.0 |
| Total | 38 (100.0%) | 36.0 |
Fertility by Education by Marriage Status in Harbison Canyon
81.6% of women with births in Harbison Canyon are unmarried. Women with the educational attainment of bachelor's degree are most likely to be married with 100.0% of them married at childbirth, while women with the educational attainment of graduate degree are least likely to be married with 100.0% of them unmarried at childbirth.
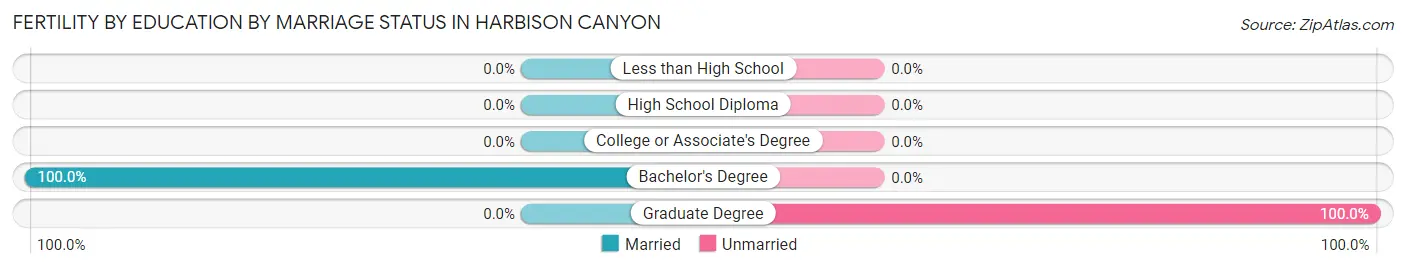
| Educational Attainment | Married | Unmarried |
| Less than High School | 0 (0.0%) | 0 (0.0%) |
| High School Diploma | 0 (0.0%) | 0 (0.0%) |
| College or Associate's Degree | 0 (0.0%) | 0 (0.0%) |
| Bachelor's Degree | 7 (100.0%) | 0 (0.0%) |
| Graduate Degree | 0 (0.0%) | 31 (100.0%) |
| Total | 7 (18.4%) | 31 (81.6%) |
Employment Characteristics in Harbison Canyon
Employment by Class of Employer in Harbison Canyon
Among the 1,996 employed individuals in Harbison Canyon, private company employees (1,236 | 61.9%), not-for-profit organizations (233 | 11.7%), and local government employees (187 | 9.4%) make up the most common classes of employment.
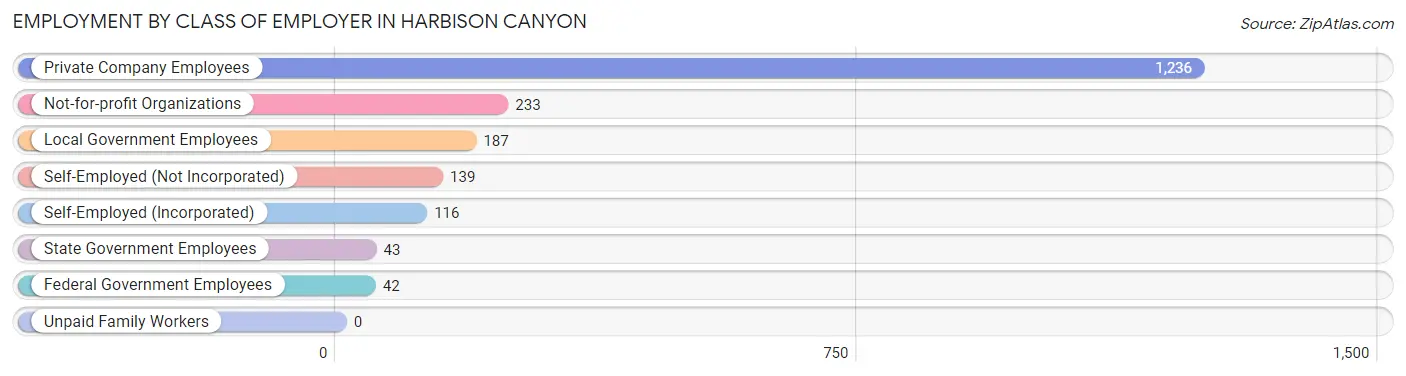
| Employer Class | # Employees | % Employees |
| Private Company Employees | 1,236 | 61.9% |
| Self-Employed (Incorporated) | 116 | 5.8% |
| Self-Employed (Not Incorporated) | 139 | 7.0% |
| Not-for-profit Organizations | 233 | 11.7% |
| Local Government Employees | 187 | 9.4% |
| State Government Employees | 43 | 2.1% |
| Federal Government Employees | 42 | 2.1% |
| Unpaid Family Workers | 0 | 0.0% |
| Total | 1,996 | 100.0% |
Employment Status by Age in Harbison Canyon
According to the labor force statistics for Harbison Canyon, out of the total population over 16 years of age (3,735), 60.1% or 2,245 individuals are in the labor force, with 9.3% or 209 of them unemployed. The age group with the highest labor force participation rate is 35 to 44 years, with 90.6% or 396 individuals in the labor force. Within the labor force, the 16 to 19 years age range has the highest percentage of unemployed individuals, with 80.9% or 72 of them being unemployed.
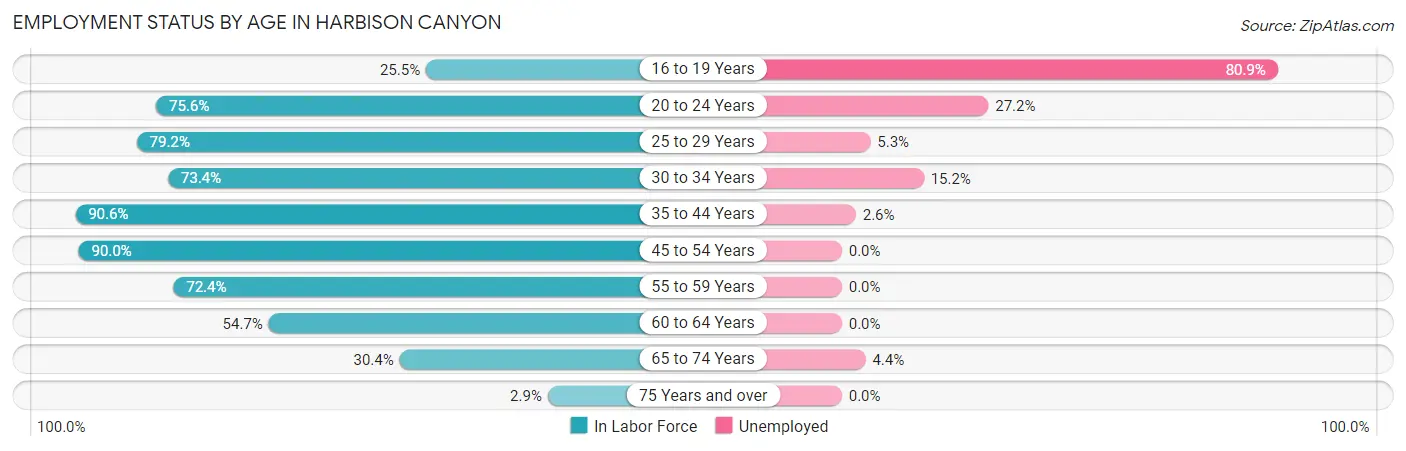
| Age Bracket | In Labor Force | Unemployed |
| 16 to 19 Years | 89 (25.5%) | 72 (80.9%) |
| 20 to 24 Years | 301 (75.6%) | 82 (27.2%) |
| 25 to 29 Years | 243 (79.2%) | 13 (5.3%) |
| 30 to 34 Years | 171 (73.4%) | 26 (15.2%) |
| 35 to 44 Years | 396 (90.6%) | 10 (2.6%) |
| 45 to 54 Years | 315 (90.0%) | 0 (0.0%) |
| 55 to 59 Years | 359 (72.4%) | 0 (0.0%) |
| 60 to 64 Years | 270 (54.7%) | 0 (0.0%) |
| 65 to 74 Years | 90 (30.4%) | 4 (4.4%) |
| 75 Years and over | 11 (2.9%) | 0 (0.0%) |
| Total | 2,245 (60.1%) | 209 (9.3%) |
Employment Status by Educational Attainment in Harbison Canyon
According to labor force statistics for Harbison Canyon, 75.7% of individuals (1,754) out of the total population between 25 and 64 years of age (2,317) are in the labor force, with 2.8% or 49 of them being unemployed. The group with the highest labor force participation rate are those with the educational attainment of bachelor's degree or higher, with 87.8% or 641 individuals in the labor force. Within the labor force, individuals with less than high school education have the highest percentage of unemployment, with 17.6% or 12 of them being unemployed.
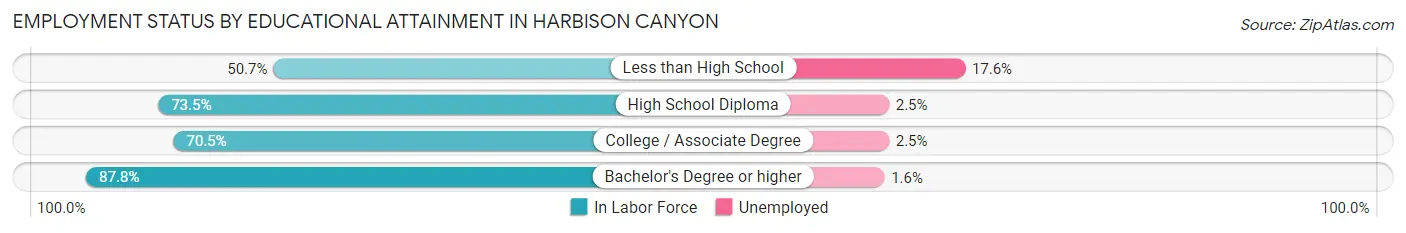
| Educational Attainment | In Labor Force | Unemployed |
| Less than High School | 68 (50.7%) | 24 (17.6%) |
| High School Diploma | 512 (73.5%) | 17 (2.5%) |
| College / Associate Degree | 533 (70.5%) | 19 (2.5%) |
| Bachelor's Degree or higher | 641 (87.8%) | 12 (1.6%) |
| Total | 1,754 (75.7%) | 65 (2.8%) |
Employment Occupations by Sex in Harbison Canyon
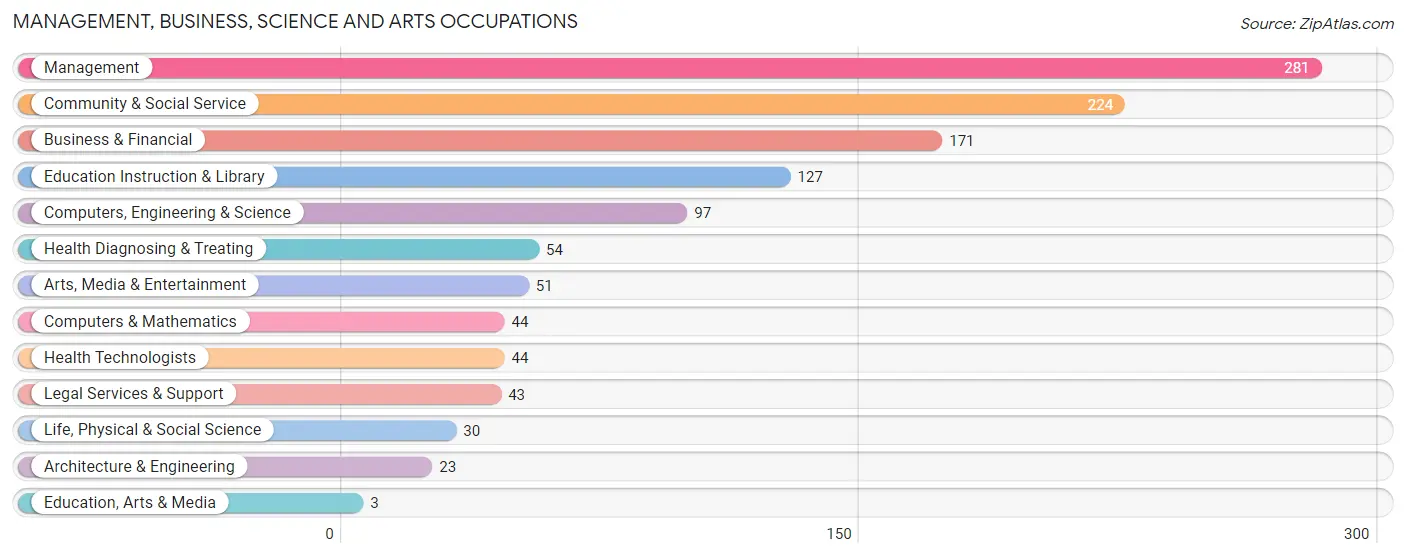
Management, Business, Science and Arts Occupations
The most common Management, Business, Science and Arts occupations in Harbison Canyon are Management (281 | 13.9%), Community & Social Service (224 | 11.1%), Business & Financial (171 | 8.5%), Education Instruction & Library (127 | 6.3%), and Computers, Engineering & Science (97 | 4.8%).
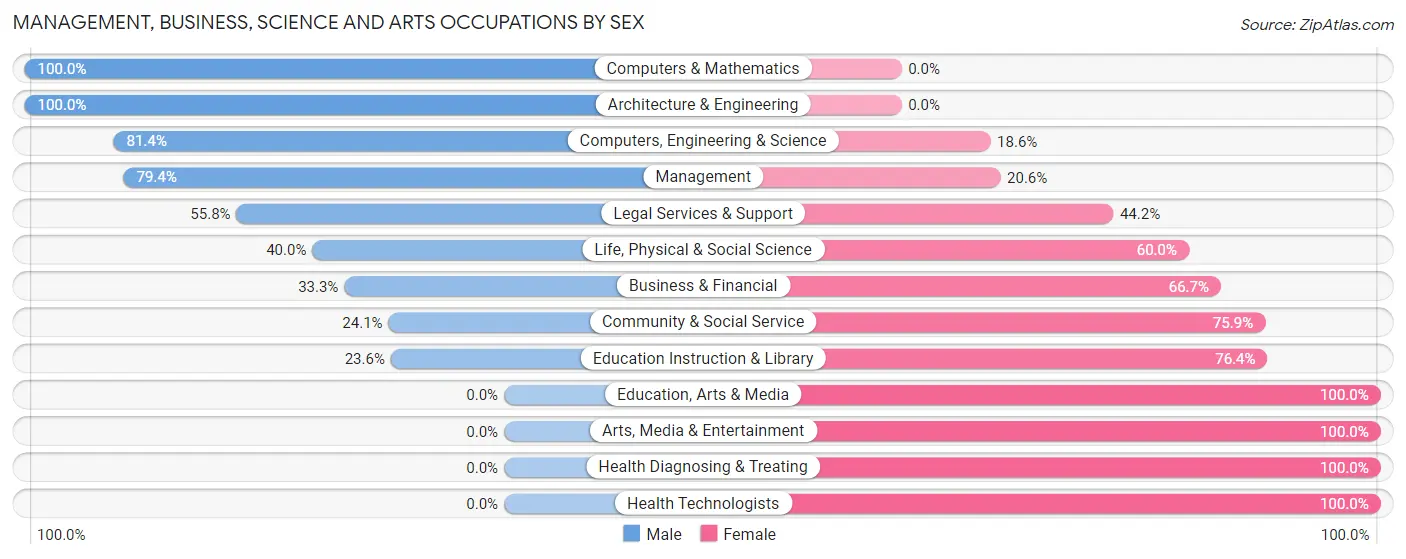
Management, Business, Science and Arts Occupations by Sex
Within the Management, Business, Science and Arts occupations in Harbison Canyon, the most male-oriented occupations are Computers & Mathematics (100.0%), Architecture & Engineering (100.0%), and Computers, Engineering & Science (81.4%), while the most female-oriented occupations are Education, Arts & Media (100.0%), Arts, Media & Entertainment (100.0%), and Health Diagnosing & Treating (100.0%).
| Occupation | Male | Female |
| Management | 223 (79.4%) | 58 (20.6%) |
| Business & Financial | 57 (33.3%) | 114 (66.7%) |
| Computers, Engineering & Science | 79 (81.4%) | 18 (18.6%) |
| Computers & Mathematics | 44 (100.0%) | 0 (0.0%) |
| Architecture & Engineering | 23 (100.0%) | 0 (0.0%) |
| Life, Physical & Social Science | 12 (40.0%) | 18 (60.0%) |
| Community & Social Service | 54 (24.1%) | 170 (75.9%) |
| Education, Arts & Media | 0 (0.0%) | 3 (100.0%) |
| Legal Services & Support | 24 (55.8%) | 19 (44.2%) |
| Education Instruction & Library | 30 (23.6%) | 97 (76.4%) |
| Arts, Media & Entertainment | 0 (0.0%) | 51 (100.0%) |
| Health Diagnosing & Treating | 0 (0.0%) | 54 (100.0%) |
| Health Technologists | 0 (0.0%) | 44 (100.0%) |
| Total (Category) | 413 (49.9%) | 414 (50.1%) |
| Total (Overall) | 1,007 (49.9%) | 1,011 (50.1%) |
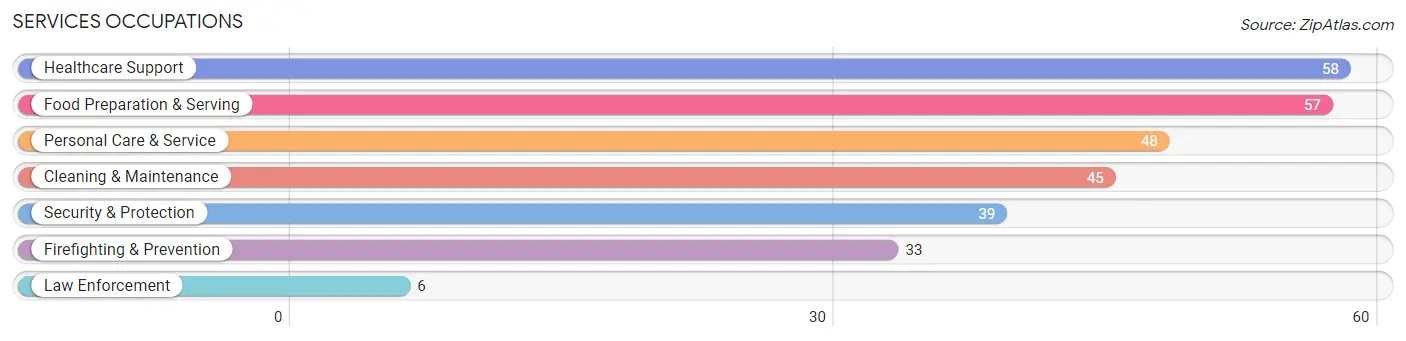
Services Occupations
The most common Services occupations in Harbison Canyon are Healthcare Support (58 | 2.9%), Food Preparation & Serving (57 | 2.8%), Personal Care & Service (48 | 2.4%), Cleaning & Maintenance (45 | 2.2%), and Security & Protection (39 | 1.9%).
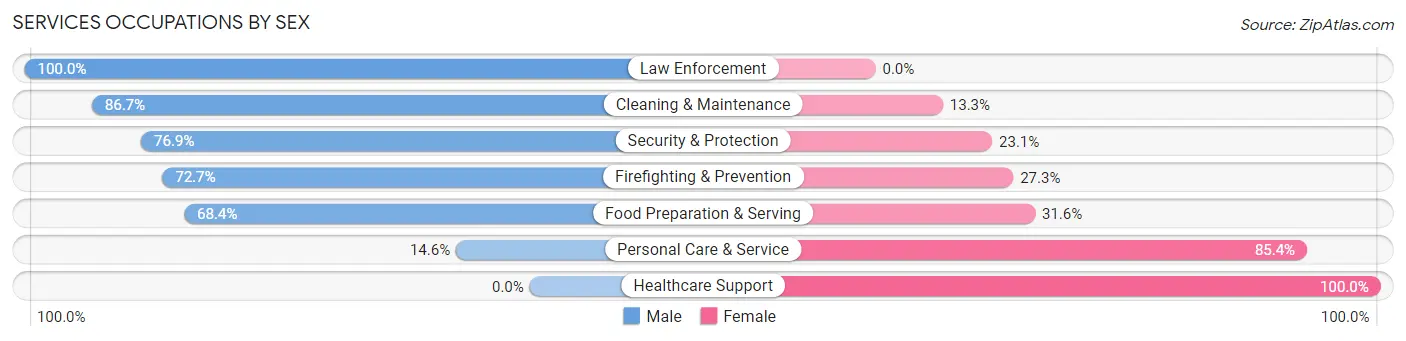
Services Occupations by Sex
Within the Services occupations in Harbison Canyon, the most male-oriented occupations are Law Enforcement (100.0%), Cleaning & Maintenance (86.7%), and Security & Protection (76.9%), while the most female-oriented occupations are Healthcare Support (100.0%), Personal Care & Service (85.4%), and Food Preparation & Serving (31.6%).
| Occupation | Male | Female |
| Healthcare Support | 0 (0.0%) | 58 (100.0%) |
| Security & Protection | 30 (76.9%) | 9 (23.1%) |
| Firefighting & Prevention | 24 (72.7%) | 9 (27.3%) |
| Law Enforcement | 6 (100.0%) | 0 (0.0%) |
| Food Preparation & Serving | 39 (68.4%) | 18 (31.6%) |
| Cleaning & Maintenance | 39 (86.7%) | 6 (13.3%) |
| Personal Care & Service | 7 (14.6%) | 41 (85.4%) |
| Total (Category) | 115 (46.6%) | 132 (53.4%) |
| Total (Overall) | 1,007 (49.9%) | 1,011 (50.1%) |
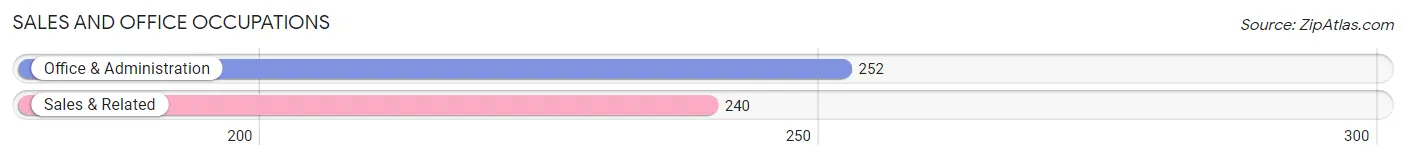
Sales and Office Occupations
The most common Sales and Office occupations in Harbison Canyon are Office & Administration (252 | 12.5%), and Sales & Related (240 | 11.9%).
Sales and Office Occupations by Sex
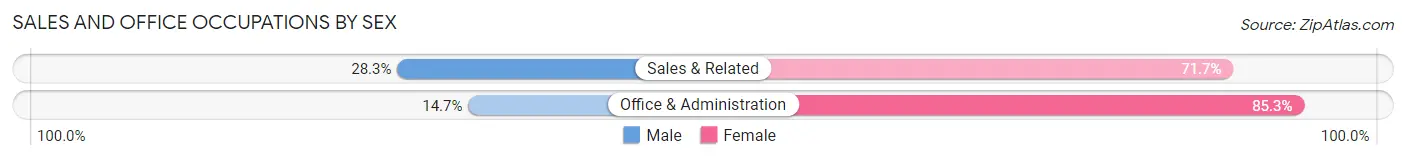
| Occupation | Male | Female |
| Sales & Related | 68 (28.3%) | 172 (71.7%) |
| Office & Administration | 37 (14.7%) | 215 (85.3%) |
| Total (Category) | 105 (21.3%) | 387 (78.7%) |
| Total (Overall) | 1,007 (49.9%) | 1,011 (50.1%) |
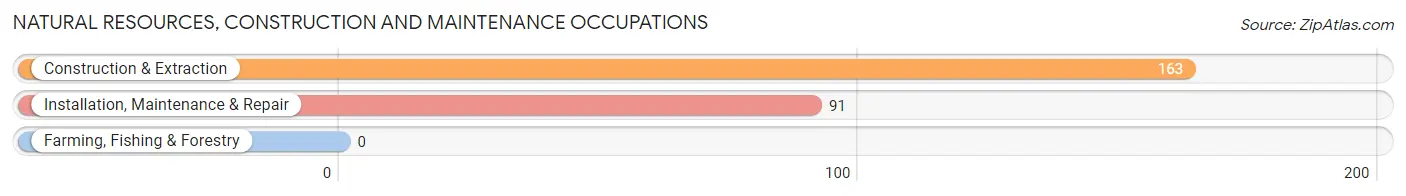
Natural Resources, Construction and Maintenance Occupations
The most common Natural Resources, Construction and Maintenance occupations in Harbison Canyon are Construction & Extraction (163 | 8.1%), and Installation, Maintenance & Repair (91 | 4.5%).
Natural Resources, Construction and Maintenance Occupations by Sex
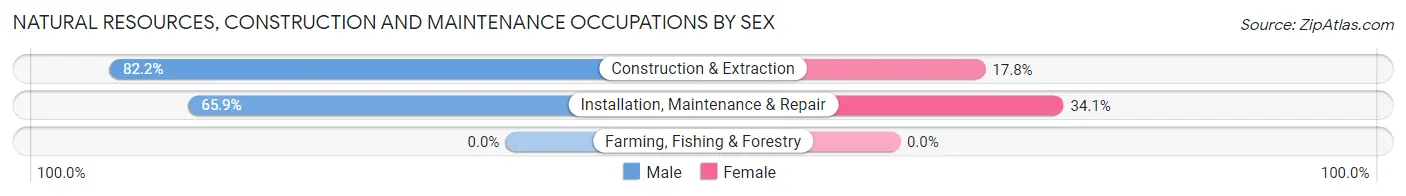
| Occupation | Male | Female |
| Farming, Fishing & Forestry | 0 (0.0%) | 0 (0.0%) |
| Construction & Extraction | 134 (82.2%) | 29 (17.8%) |
| Installation, Maintenance & Repair | 60 (65.9%) | 31 (34.1%) |
| Total (Category) | 194 (76.4%) | 60 (23.6%) |
| Total (Overall) | 1,007 (49.9%) | 1,011 (50.1%) |
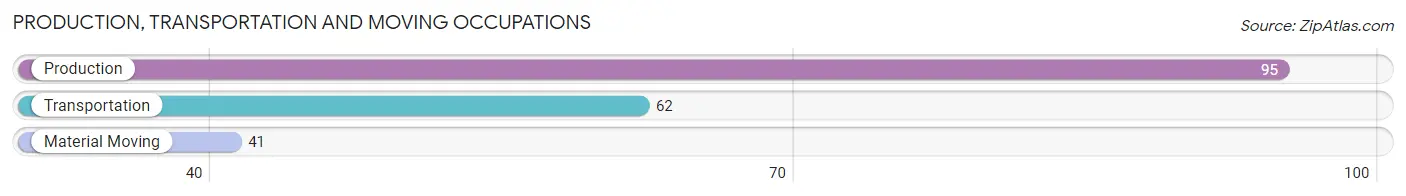
Production, Transportation and Moving Occupations
The most common Production, Transportation and Moving occupations in Harbison Canyon are Production (95 | 4.7%), Transportation (62 | 3.1%), and Material Moving (41 | 2.0%).
Production, Transportation and Moving Occupations by Sex
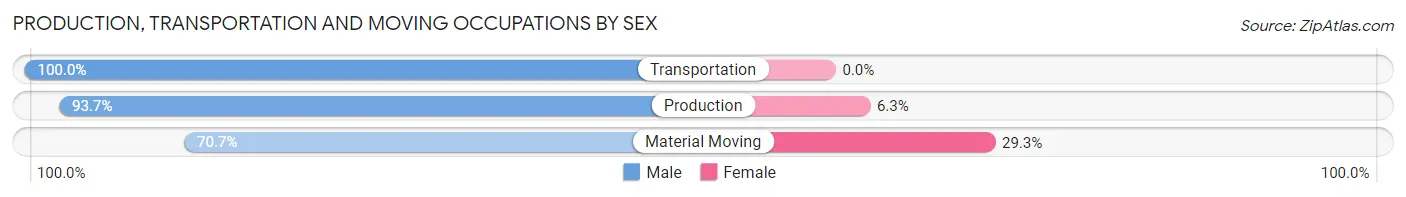
| Occupation | Male | Female |
| Production | 89 (93.7%) | 6 (6.3%) |
| Transportation | 62 (100.0%) | 0 (0.0%) |
| Material Moving | 29 (70.7%) | 12 (29.3%) |
| Total (Category) | 180 (90.9%) | 18 (9.1%) |
| Total (Overall) | 1,007 (49.9%) | 1,011 (50.1%) |
Employment Industries by Sex in Harbison Canyon
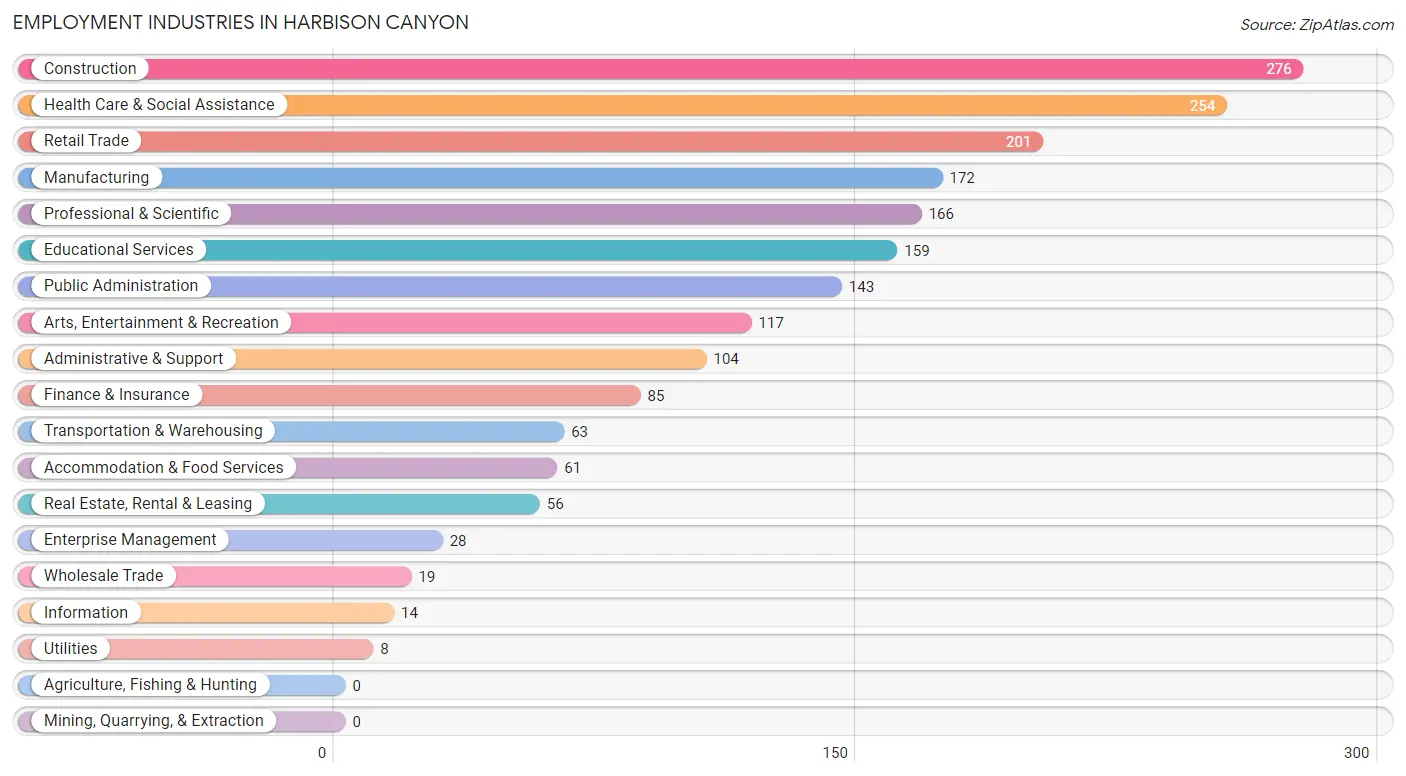
Employment Industries in Harbison Canyon
The major employment industries in Harbison Canyon include Construction (276 | 13.7%), Health Care & Social Assistance (254 | 12.6%), Retail Trade (201 | 10.0%), Manufacturing (172 | 8.5%), and Professional & Scientific (166 | 8.2%).
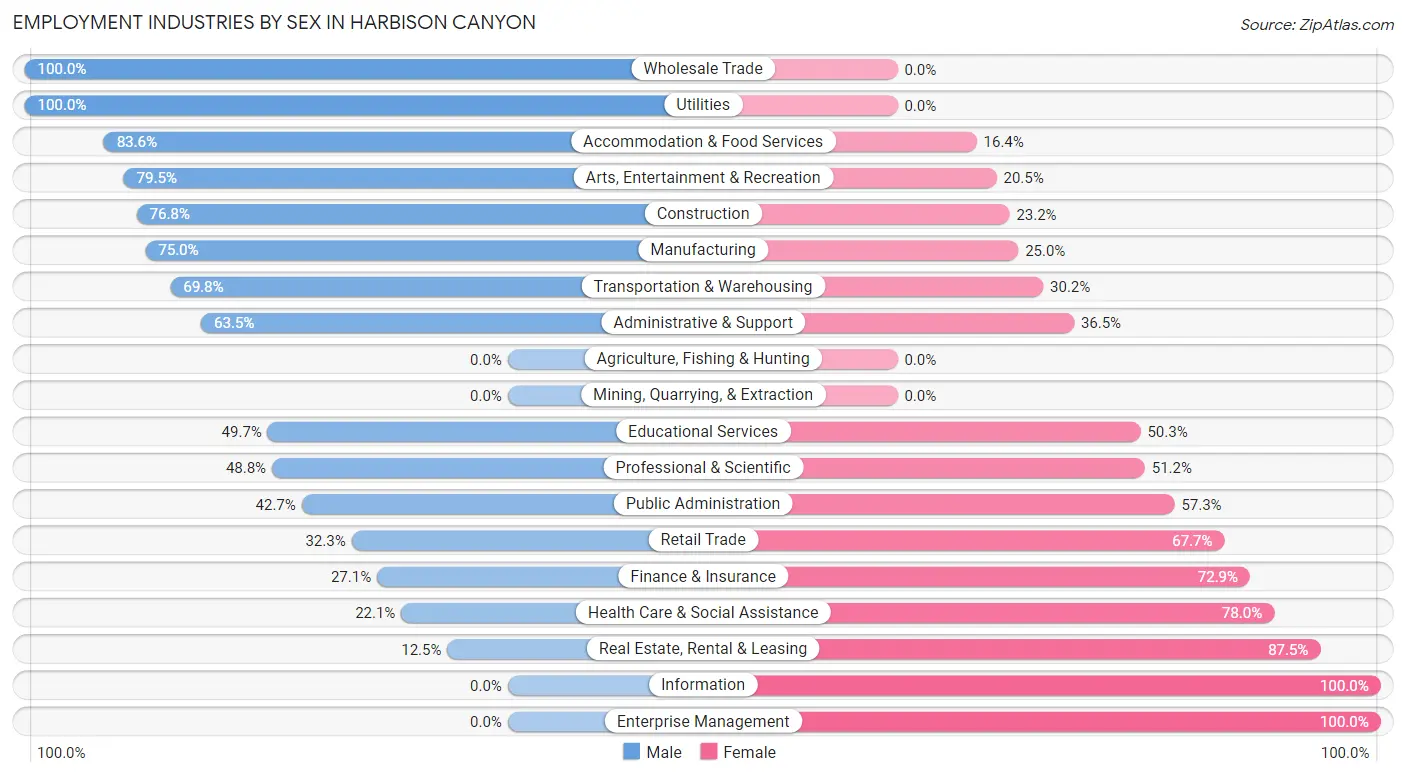
Employment Industries by Sex in Harbison Canyon
The Harbison Canyon industries that see more men than women are Wholesale Trade (100.0%), Utilities (100.0%), and Accommodation & Food Services (83.6%), whereas the industries that tend to have a higher number of women are Information (100.0%), Enterprise Management (100.0%), and Real Estate, Rental & Leasing (87.5%).
| Industry | Male | Female |
| Agriculture, Fishing & Hunting | 0 (0.0%) | 0 (0.0%) |
| Mining, Quarrying, & Extraction | 0 (0.0%) | 0 (0.0%) |
| Construction | 212 (76.8%) | 64 (23.2%) |
| Manufacturing | 129 (75.0%) | 43 (25.0%) |
| Wholesale Trade | 19 (100.0%) | 0 (0.0%) |
| Retail Trade | 65 (32.3%) | 136 (67.7%) |
| Transportation & Warehousing | 44 (69.8%) | 19 (30.2%) |
| Utilities | 8 (100.0%) | 0 (0.0%) |
| Information | 0 (0.0%) | 14 (100.0%) |
| Finance & Insurance | 23 (27.1%) | 62 (72.9%) |
| Real Estate, Rental & Leasing | 7 (12.5%) | 49 (87.5%) |
| Professional & Scientific | 81 (48.8%) | 85 (51.2%) |
| Enterprise Management | 0 (0.0%) | 28 (100.0%) |
| Administrative & Support | 66 (63.5%) | 38 (36.5%) |
| Educational Services | 79 (49.7%) | 80 (50.3%) |
| Health Care & Social Assistance | 56 (22.1%) | 198 (77.9%) |
| Arts, Entertainment & Recreation | 93 (79.5%) | 24 (20.5%) |
| Accommodation & Food Services | 51 (83.6%) | 10 (16.4%) |
| Public Administration | 61 (42.7%) | 82 (57.3%) |
| Total | 1,007 (49.9%) | 1,011 (50.1%) |
Education in Harbison Canyon
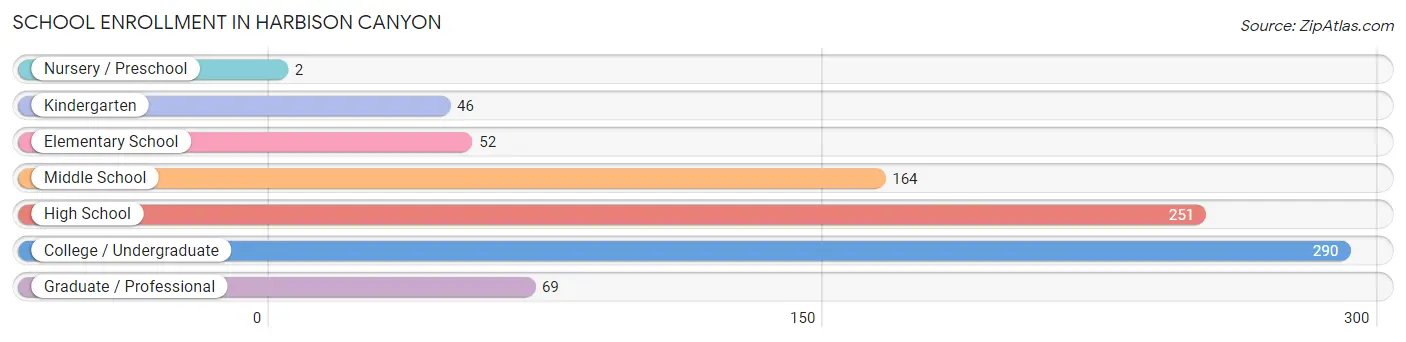
School Enrollment in Harbison Canyon
The most common levels of schooling among the 874 students in Harbison Canyon are college / undergraduate (290 | 33.2%), high school (251 | 28.7%), and middle school (164 | 18.8%).
| School Level | # Students | % Students |
| Nursery / Preschool | 2 | 0.2% |
| Kindergarten | 46 | 5.3% |
| Elementary School | 52 | 5.9% |
| Middle School | 164 | 18.8% |
| High School | 251 | 28.7% |
| College / Undergraduate | 290 | 33.2% |
| Graduate / Professional | 69 | 7.9% |
| Total | 874 | 100.0% |
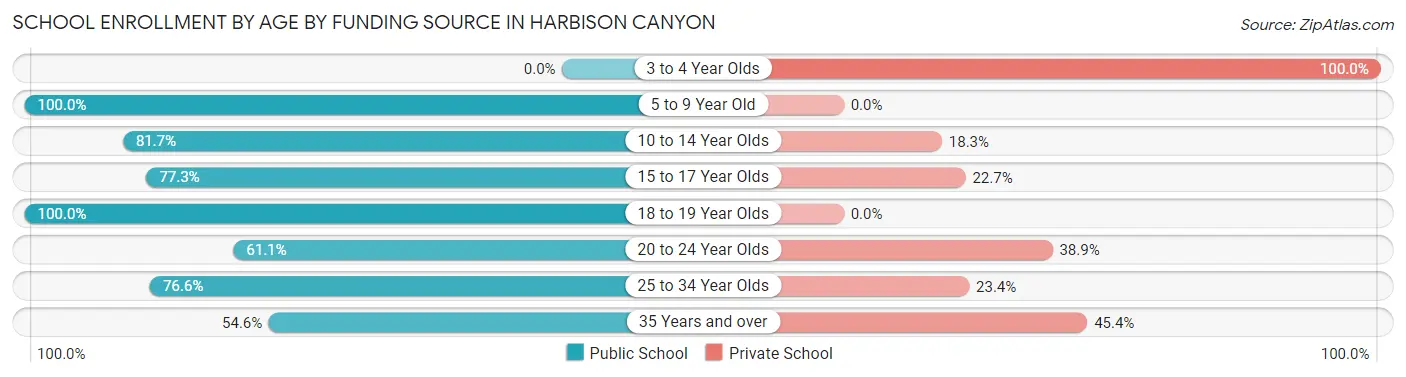
School Enrollment by Age by Funding Source in Harbison Canyon
Out of a total of 874 students who are enrolled in schools in Harbison Canyon, 206 (23.6%) attend a private institution, while the remaining 668 (76.4%) are enrolled in public schools. The age group of 3 to 4 year olds has the highest likelihood of being enrolled in private schools, with 2 (100.0% in the age bracket) enrolled. Conversely, the age group of 5 to 9 year old has the lowest likelihood of being enrolled in a private school, with 87 (100.0% in the age bracket) attending a public institution.
| Age Bracket | Public School | Private School |
| 3 to 4 Year Olds | 0 (0.0%) | 2 (100.0%) |
| 5 to 9 Year Old | 87 (100.0%) | 0 (0.0%) |
| 10 to 14 Year Olds | 143 (81.7%) | 32 (18.3%) |
| 15 to 17 Year Olds | 184 (77.3%) | 54 (22.7%) |
| 18 to 19 Year Olds | 42 (100.0%) | 0 (0.0%) |
| 20 to 24 Year Olds | 77 (61.1%) | 49 (38.9%) |
| 25 to 34 Year Olds | 82 (76.6%) | 25 (23.4%) |
| 35 Years and over | 53 (54.6%) | 44 (45.4%) |
| Total | 668 (76.4%) | 206 (23.6%) |
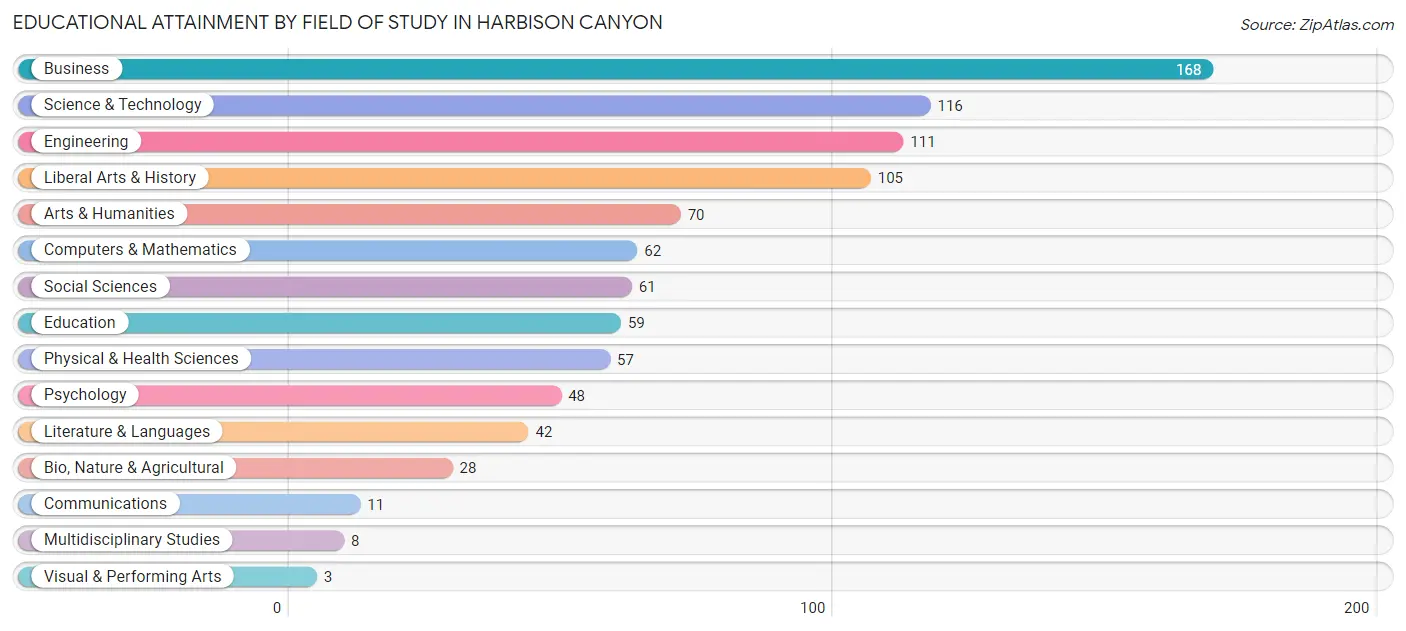
Educational Attainment by Field of Study in Harbison Canyon
Business (168 | 17.7%), science & technology (116 | 12.2%), engineering (111 | 11.7%), liberal arts & history (105 | 11.1%), and arts & humanities (70 | 7.4%) are the most common fields of study among 949 individuals in Harbison Canyon who have obtained a bachelor's degree or higher.
| Field of Study | # Graduates | % Graduates |
| Computers & Mathematics | 62 | 6.5% |
| Bio, Nature & Agricultural | 28 | 2.9% |
| Physical & Health Sciences | 57 | 6.0% |
| Psychology | 48 | 5.1% |
| Social Sciences | 61 | 6.4% |
| Engineering | 111 | 11.7% |
| Multidisciplinary Studies | 8 | 0.8% |
| Science & Technology | 116 | 12.2% |
| Business | 168 | 17.7% |
| Education | 59 | 6.2% |
| Literature & Languages | 42 | 4.4% |
| Liberal Arts & History | 105 | 11.1% |
| Visual & Performing Arts | 3 | 0.3% |
| Communications | 11 | 1.2% |
| Arts & Humanities | 70 | 7.4% |
| Total | 949 | 100.0% |
Transportation & Commute in Harbison Canyon
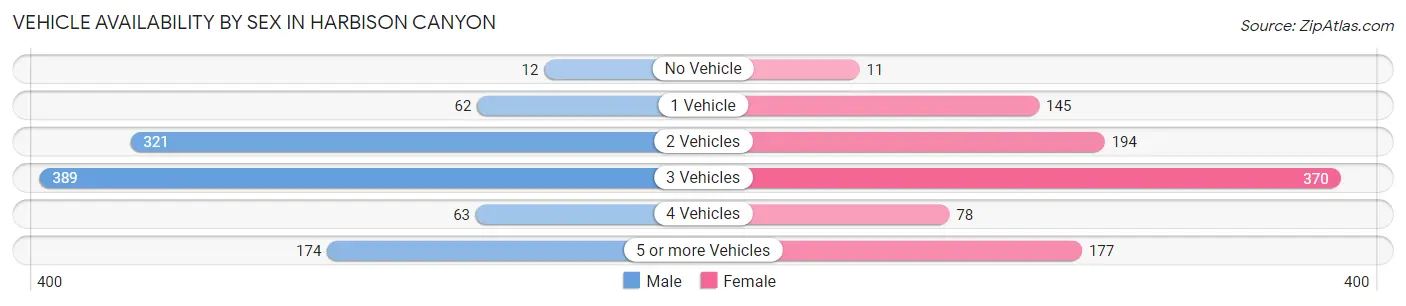
Vehicle Availability by Sex in Harbison Canyon
The most prevalent vehicle ownership categories in Harbison Canyon are males with 3 vehicles (389, accounting for 38.1%) and females with 3 vehicles (370, making up 39.9%).
| Vehicles Available | Male | Female |
| No Vehicle | 12 (1.2%) | 11 (1.1%) |
| 1 Vehicle | 62 (6.1%) | 145 (14.9%) |
| 2 Vehicles | 321 (31.4%) | 194 (19.9%) |
| 3 Vehicles | 389 (38.1%) | 370 (38.0%) |
| 4 Vehicles | 63 (6.2%) | 78 (8.0%) |
| 5 or more Vehicles | 174 (17.0%) | 177 (18.1%) |
| Total | 1,021 (100.0%) | 975 (100.0%) |
Commute Time in Harbison Canyon
The most frequently occuring commute durations in Harbison Canyon are 30 to 34 minutes (421 commuters, 24.2%), 20 to 24 minutes (349 commuters, 20.1%), and 35 to 39 minutes (203 commuters, 11.7%).
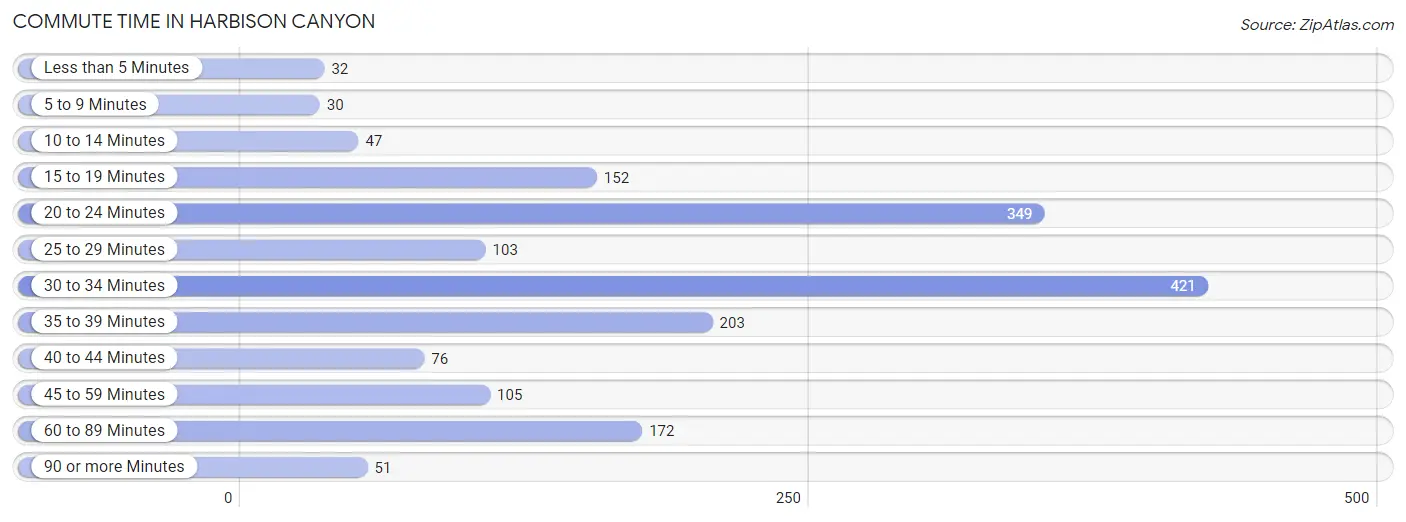
| Commute Time | # Commuters | % Commuters |
| Less than 5 Minutes | 32 | 1.8% |
| 5 to 9 Minutes | 30 | 1.7% |
| 10 to 14 Minutes | 47 | 2.7% |
| 15 to 19 Minutes | 152 | 8.7% |
| 20 to 24 Minutes | 349 | 20.1% |
| 25 to 29 Minutes | 103 | 5.9% |
| 30 to 34 Minutes | 421 | 24.2% |
| 35 to 39 Minutes | 203 | 11.7% |
| 40 to 44 Minutes | 76 | 4.4% |
| 45 to 59 Minutes | 105 | 6.0% |
| 60 to 89 Minutes | 172 | 9.9% |
| 90 or more Minutes | 51 | 2.9% |
Commute Time by Sex in Harbison Canyon
The most common commute times in Harbison Canyon are 30 to 34 minutes (269 commuters, 29.3%) for males and 20 to 24 minutes (220 commuters, 26.7%) for females.
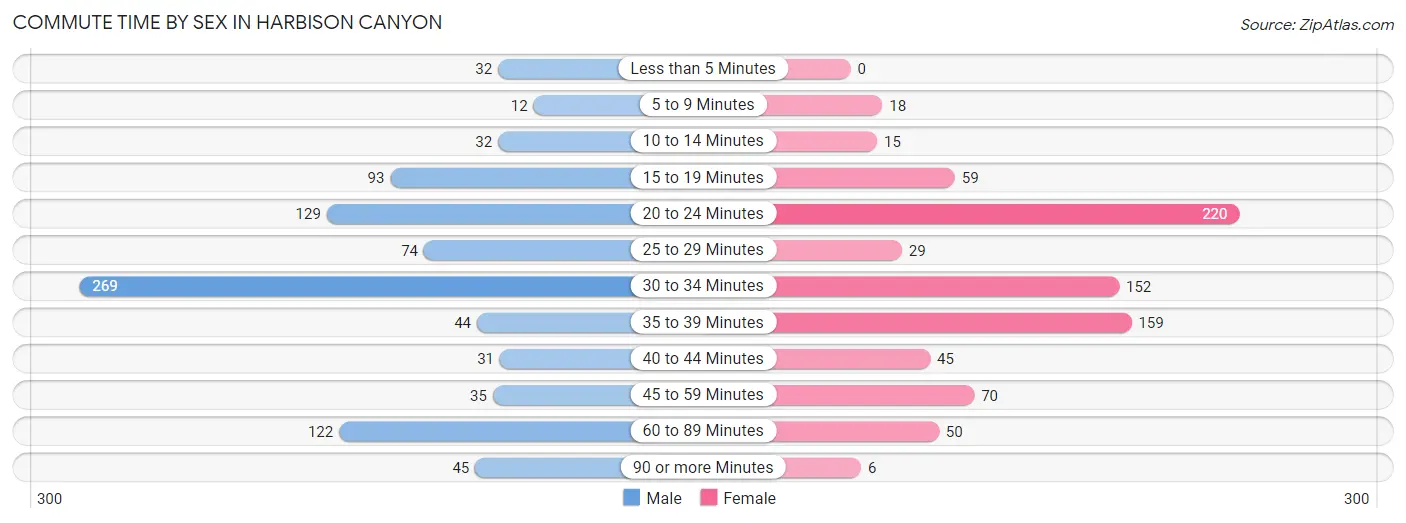
| Commute Time | Male | Female |
| Less than 5 Minutes | 32 (3.5%) | 0 (0.0%) |
| 5 to 9 Minutes | 12 (1.3%) | 18 (2.2%) |
| 10 to 14 Minutes | 32 (3.5%) | 15 (1.8%) |
| 15 to 19 Minutes | 93 (10.1%) | 59 (7.2%) |
| 20 to 24 Minutes | 129 (14.1%) | 220 (26.7%) |
| 25 to 29 Minutes | 74 (8.1%) | 29 (3.5%) |
| 30 to 34 Minutes | 269 (29.3%) | 152 (18.5%) |
| 35 to 39 Minutes | 44 (4.8%) | 159 (19.3%) |
| 40 to 44 Minutes | 31 (3.4%) | 45 (5.5%) |
| 45 to 59 Minutes | 35 (3.8%) | 70 (8.5%) |
| 60 to 89 Minutes | 122 (13.3%) | 50 (6.1%) |
| 90 or more Minutes | 45 (4.9%) | 6 (0.7%) |
Time of Departure to Work by Sex in Harbison Canyon
The most frequent times of departure to work in Harbison Canyon are 6:30 AM to 6:59 AM (182, 19.8%) for males and 7:00 AM to 7:29 AM (160, 19.4%) for females.
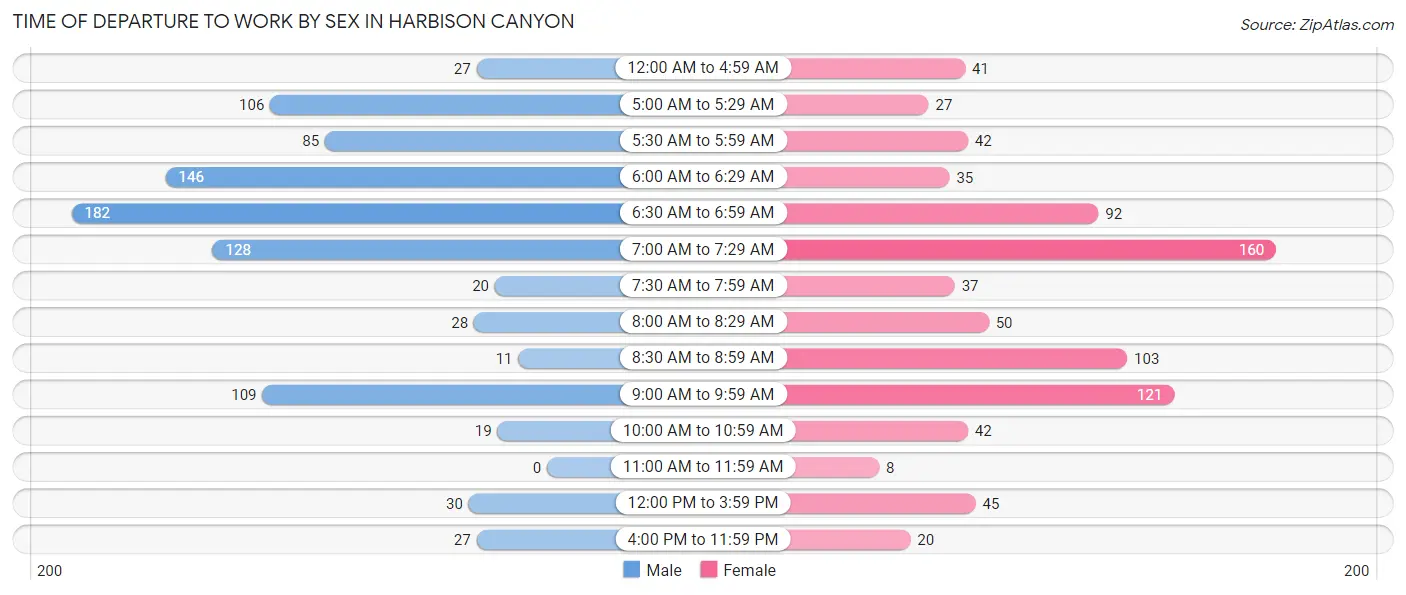
| Time of Departure | Male | Female |
| 12:00 AM to 4:59 AM | 27 (2.9%) | 41 (5.0%) |
| 5:00 AM to 5:29 AM | 106 (11.6%) | 27 (3.3%) |
| 5:30 AM to 5:59 AM | 85 (9.3%) | 42 (5.1%) |
| 6:00 AM to 6:29 AM | 146 (15.9%) | 35 (4.3%) |
| 6:30 AM to 6:59 AM | 182 (19.8%) | 92 (11.2%) |
| 7:00 AM to 7:29 AM | 128 (13.9%) | 160 (19.4%) |
| 7:30 AM to 7:59 AM | 20 (2.2%) | 37 (4.5%) |
| 8:00 AM to 8:29 AM | 28 (3.0%) | 50 (6.1%) |
| 8:30 AM to 8:59 AM | 11 (1.2%) | 103 (12.5%) |
| 9:00 AM to 9:59 AM | 109 (11.9%) | 121 (14.7%) |
| 10:00 AM to 10:59 AM | 19 (2.1%) | 42 (5.1%) |
| 11:00 AM to 11:59 AM | 0 (0.0%) | 8 (1.0%) |
| 12:00 PM to 3:59 PM | 30 (3.3%) | 45 (5.5%) |
| 4:00 PM to 11:59 PM | 27 (2.9%) | 20 (2.4%) |
| Total | 918 (100.0%) | 823 (100.0%) |
Housing Occupancy in Harbison Canyon
Occupancy by Ownership in Harbison Canyon
Of the total 1,434 dwellings in Harbison Canyon, owner-occupied units account for 1,271 (88.6%), while renter-occupied units make up 163 (11.4%).
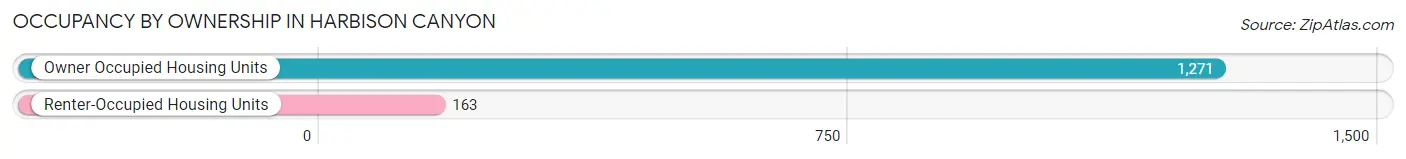
| Occupancy | # Housing Units | % Housing Units |
| Owner Occupied Housing Units | 1,271 | 88.6% |
| Renter-Occupied Housing Units | 163 | 11.4% |
| Total Occupied Housing Units | 1,434 | 100.0% |
Occupancy by Household Size in Harbison Canyon
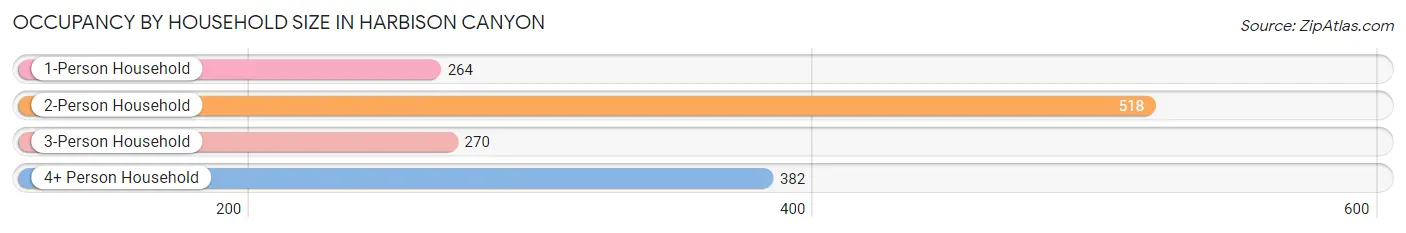
| Household Size | # Housing Units | % Housing Units |
| 1-Person Household | 264 | 18.4% |
| 2-Person Household | 518 | 36.1% |
| 3-Person Household | 270 | 18.8% |
| 4+ Person Household | 382 | 26.6% |
| Total Housing Units | 1,434 | 100.0% |
Occupancy by Ownership by Household Size in Harbison Canyon
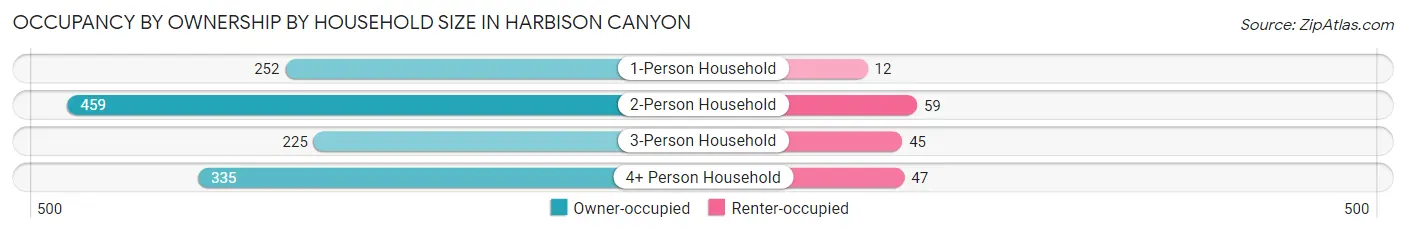
| Household Size | Owner-occupied | Renter-occupied |
| 1-Person Household | 252 (95.5%) | 12 (4.5%) |
| 2-Person Household | 459 (88.6%) | 59 (11.4%) |
| 3-Person Household | 225 (83.3%) | 45 (16.7%) |
| 4+ Person Household | 335 (87.7%) | 47 (12.3%) |
| Total Housing Units | 1,271 (88.6%) | 163 (11.4%) |
Occupancy by Educational Attainment in Harbison Canyon
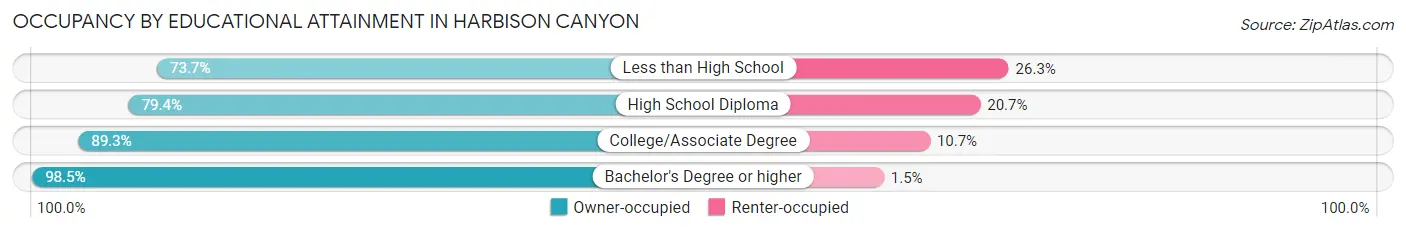
| Household Size | Owner-occupied | Renter-occupied |
| Less than High School | 87 (73.7%) | 31 (26.3%) |
| High School Diploma | 269 (79.3%) | 70 (20.6%) |
| College/Associate Degree | 461 (89.3%) | 55 (10.7%) |
| Bachelor's Degree or higher | 454 (98.5%) | 7 (1.5%) |
Occupancy by Age of Householder in Harbison Canyon
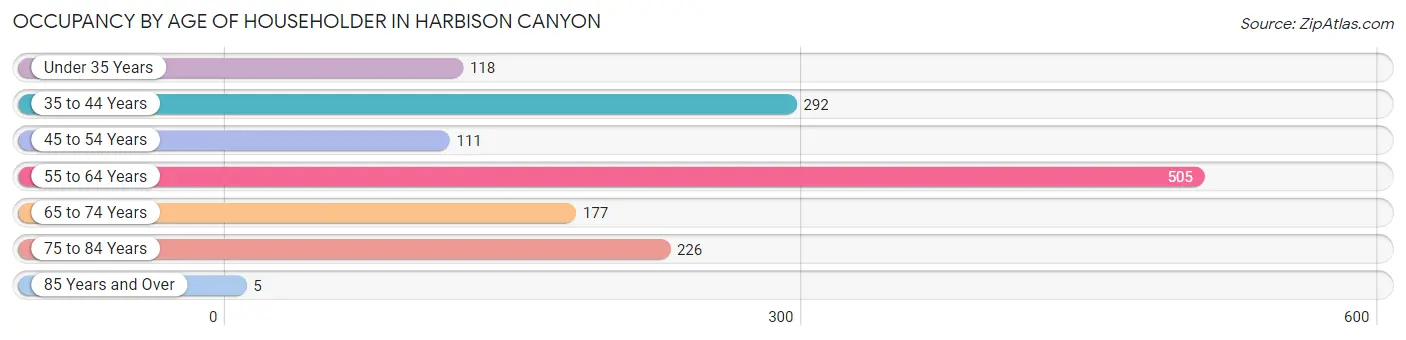
| Age Bracket | # Households | % Households |
| Under 35 Years | 118 | 8.2% |
| 35 to 44 Years | 292 | 20.4% |
| 45 to 54 Years | 111 | 7.7% |
| 55 to 64 Years | 505 | 35.2% |
| 65 to 74 Years | 177 | 12.3% |
| 75 to 84 Years | 226 | 15.8% |
| 85 Years and Over | 5 | 0.4% |
| Total | 1,434 | 100.0% |
Housing Finances in Harbison Canyon
Median Income by Occupancy in Harbison Canyon
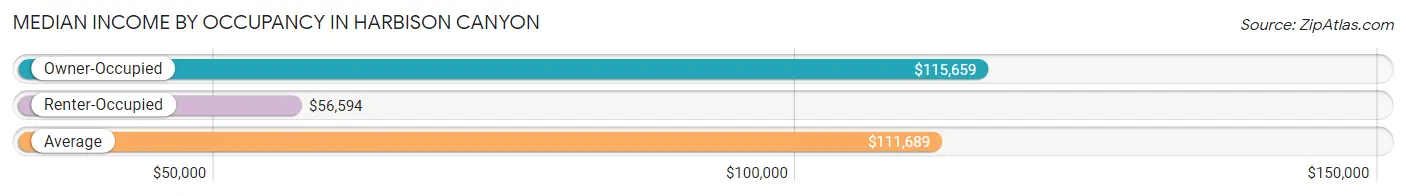
| Occupancy Type | # Households | Median Income |
| Owner-Occupied | 1,271 (88.6%) | $115,659 |
| Renter-Occupied | 163 (11.4%) | $56,594 |
| Average | 1,434 (100.0%) | $111,689 |
Occupancy by Householder Income Bracket in Harbison Canyon
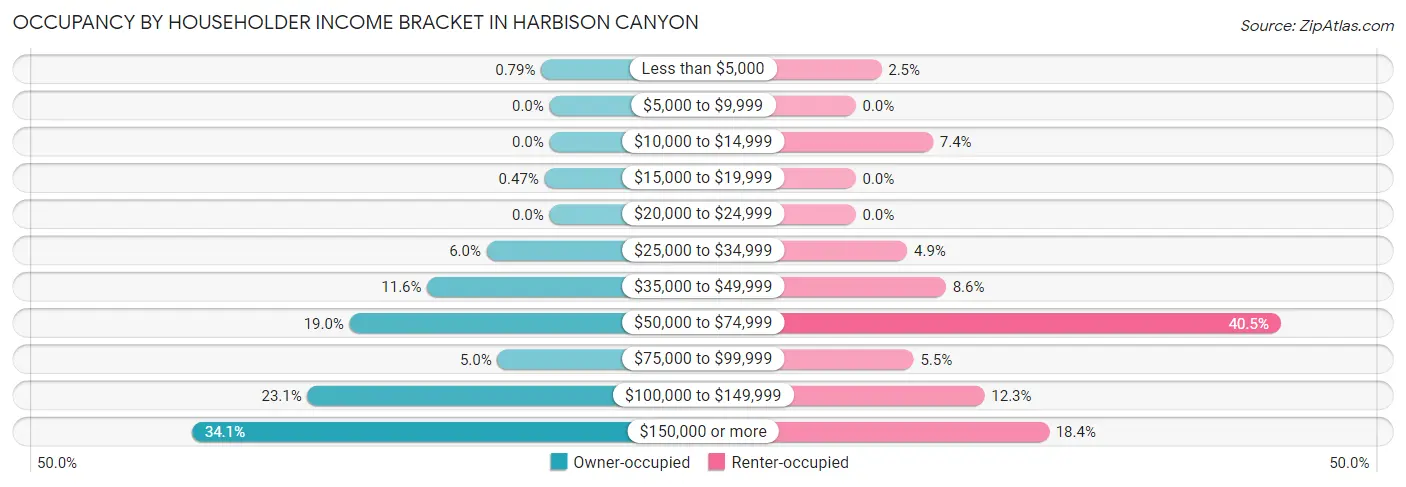
| Income Bracket | Owner-occupied | Renter-occupied |
| Less than $5,000 | 10 (0.8%) | 4 (2.5%) |
| $5,000 to $9,999 | 0 (0.0%) | 0 (0.0%) |
| $10,000 to $14,999 | 0 (0.0%) | 12 (7.4%) |
| $15,000 to $19,999 | 6 (0.5%) | 0 (0.0%) |
| $20,000 to $24,999 | 0 (0.0%) | 0 (0.0%) |
| $25,000 to $34,999 | 76 (6.0%) | 8 (4.9%) |
| $35,000 to $49,999 | 148 (11.6%) | 14 (8.6%) |
| $50,000 to $74,999 | 242 (19.0%) | 66 (40.5%) |
| $75,000 to $99,999 | 63 (5.0%) | 9 (5.5%) |
| $100,000 to $149,999 | 293 (23.1%) | 20 (12.3%) |
| $150,000 or more | 433 (34.1%) | 30 (18.4%) |
| Total | 1,271 (100.0%) | 163 (100.0%) |
Monthly Housing Cost Tiers in Harbison Canyon
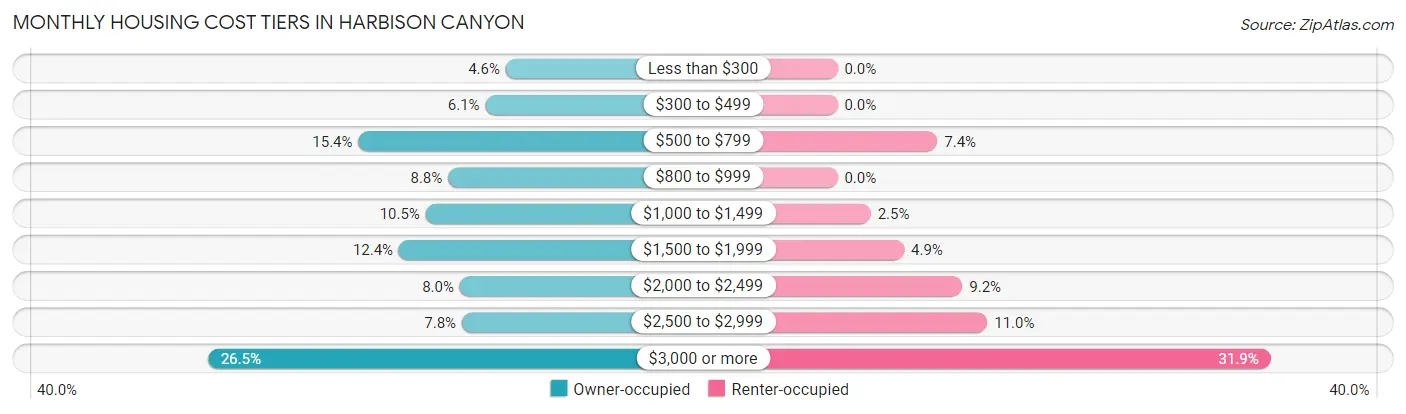
| Monthly Cost | Owner-occupied | Renter-occupied |
| Less than $300 | 58 (4.6%) | 0 (0.0%) |
| $300 to $499 | 77 (6.1%) | 0 (0.0%) |
| $500 to $799 | 196 (15.4%) | 12 (7.4%) |
| $800 to $999 | 112 (8.8%) | 0 (0.0%) |
| $1,000 to $1,499 | 133 (10.5%) | 4 (2.5%) |
| $1,500 to $1,999 | 158 (12.4%) | 8 (4.9%) |
| $2,000 to $2,499 | 101 (8.0%) | 15 (9.2%) |
| $2,500 to $2,999 | 99 (7.8%) | 18 (11.0%) |
| $3,000 or more | 337 (26.5%) | 52 (31.9%) |
| Total | 1,271 (100.0%) | 163 (100.0%) |
Physical Housing Characteristics in Harbison Canyon
Housing Structures in Harbison Canyon
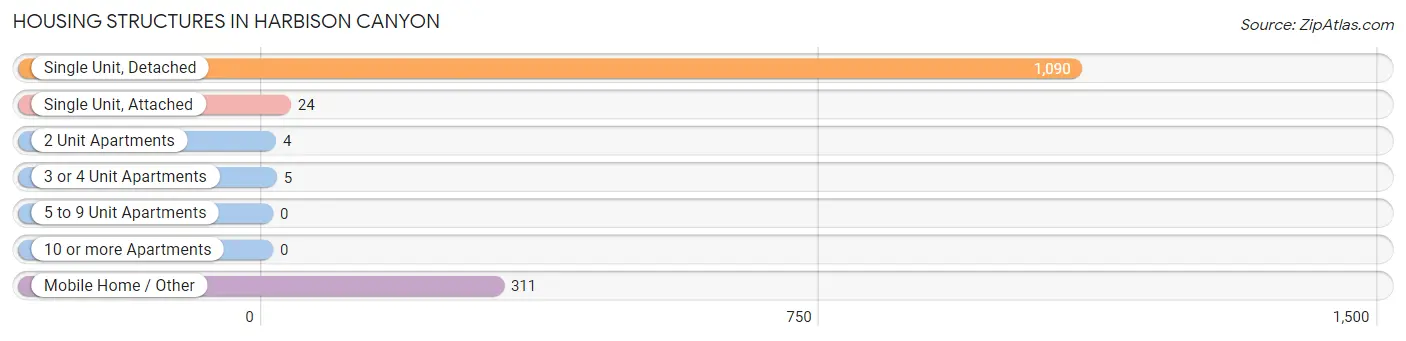
| Structure Type | # Housing Units | % Housing Units |
| Single Unit, Detached | 1,090 | 76.0% |
| Single Unit, Attached | 24 | 1.7% |
| 2 Unit Apartments | 4 | 0.3% |
| 3 or 4 Unit Apartments | 5 | 0.4% |
| 5 to 9 Unit Apartments | 0 | 0.0% |
| 10 or more Apartments | 0 | 0.0% |
| Mobile Home / Other | 311 | 21.7% |
| Total | 1,434 | 100.0% |
Housing Structures by Occupancy in Harbison Canyon
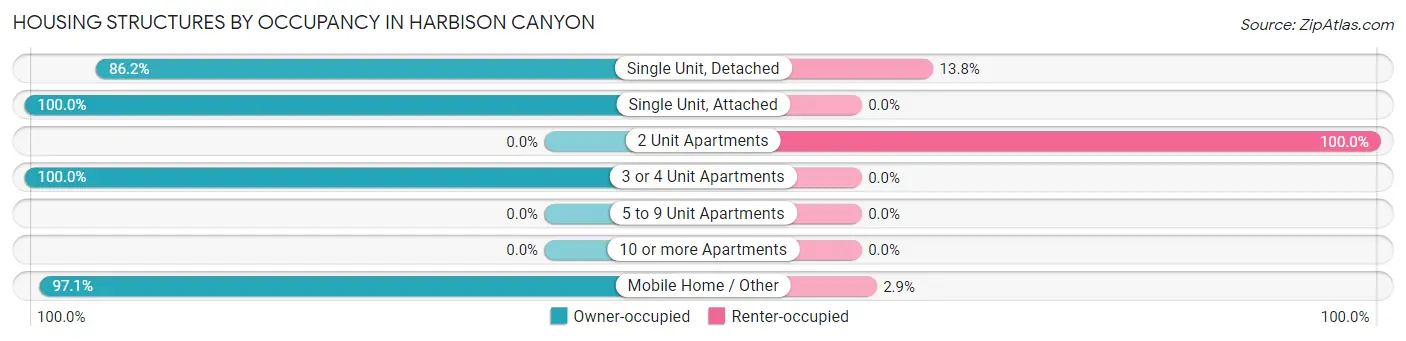
| Structure Type | Owner-occupied | Renter-occupied |
| Single Unit, Detached | 940 (86.2%) | 150 (13.8%) |
| Single Unit, Attached | 24 (100.0%) | 0 (0.0%) |
| 2 Unit Apartments | 0 (0.0%) | 4 (100.0%) |
| 3 or 4 Unit Apartments | 5 (100.0%) | 0 (0.0%) |
| 5 to 9 Unit Apartments | 0 (0.0%) | 0 (0.0%) |
| 10 or more Apartments | 0 (0.0%) | 0 (0.0%) |
| Mobile Home / Other | 302 (97.1%) | 9 (2.9%) |
| Total | 1,271 (88.6%) | 163 (11.4%) |
Housing Structures by Number of Rooms in Harbison Canyon
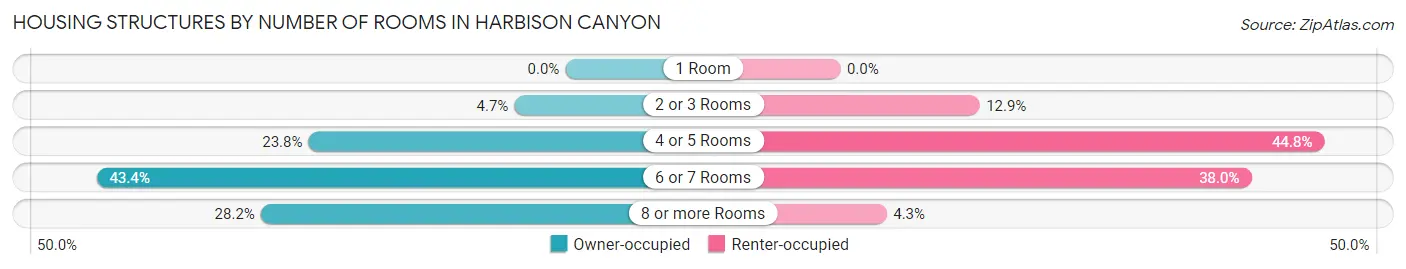
| Number of Rooms | Owner-occupied | Renter-occupied |
| 1 Room | 0 (0.0%) | 0 (0.0%) |
| 2 or 3 Rooms | 60 (4.7%) | 21 (12.9%) |
| 4 or 5 Rooms | 302 (23.8%) | 73 (44.8%) |
| 6 or 7 Rooms | 551 (43.3%) | 62 (38.0%) |
| 8 or more Rooms | 358 (28.2%) | 7 (4.3%) |
| Total | 1,271 (100.0%) | 163 (100.0%) |
Housing Structure by Heating Type in Harbison Canyon
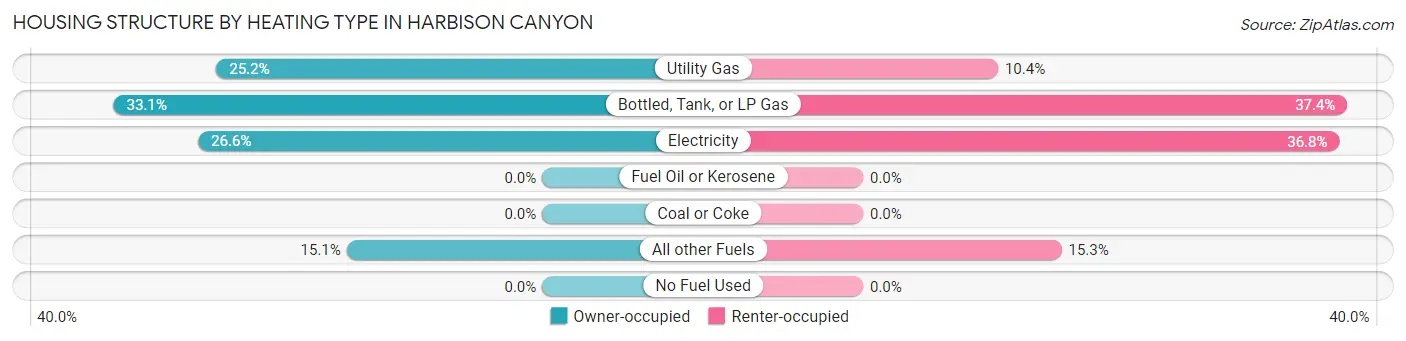
| Heating Type | Owner-occupied | Renter-occupied |
| Utility Gas | 320 (25.2%) | 17 (10.4%) |
| Bottled, Tank, or LP Gas | 421 (33.1%) | 61 (37.4%) |
| Electricity | 338 (26.6%) | 60 (36.8%) |
| Fuel Oil or Kerosene | 0 (0.0%) | 0 (0.0%) |
| Coal or Coke | 0 (0.0%) | 0 (0.0%) |
| All other Fuels | 192 (15.1%) | 25 (15.3%) |
| No Fuel Used | 0 (0.0%) | 0 (0.0%) |
| Total | 1,271 (100.0%) | 163 (100.0%) |
Household Vehicle Usage in Harbison Canyon
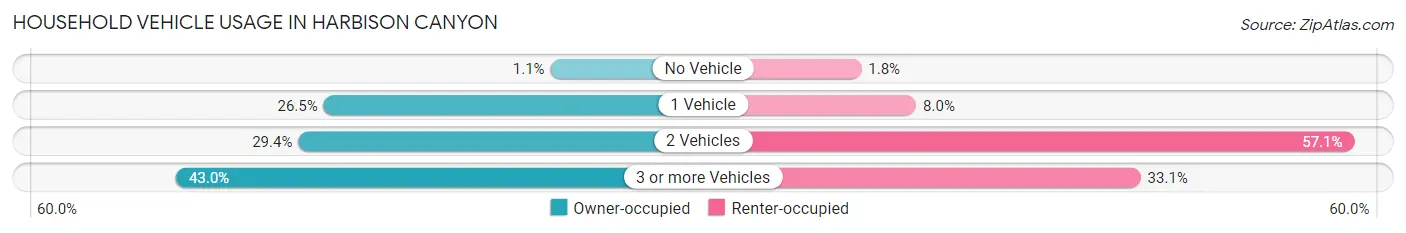
| Vehicles per Household | Owner-occupied | Renter-occupied |
| No Vehicle | 14 (1.1%) | 3 (1.8%) |
| 1 Vehicle | 337 (26.5%) | 13 (8.0%) |
| 2 Vehicles | 373 (29.3%) | 93 (57.1%) |
| 3 or more Vehicles | 547 (43.0%) | 54 (33.1%) |
| Total | 1,271 (100.0%) | 163 (100.0%) |
Real Estate & Mortgages in Harbison Canyon
Real Estate and Mortgage Overview in Harbison Canyon
| Characteristic | Without Mortgage | With Mortgage |
| Housing Units | 571 | 700 |
| Median Property Value | $421,600 | $680,900 |
| Median Household Income | $67,313 | $343 |
| Monthly Housing Costs | $723 | $337 |
| Real Estate Taxes | $1,849 | $24 |
Property Value by Mortgage Status in Harbison Canyon
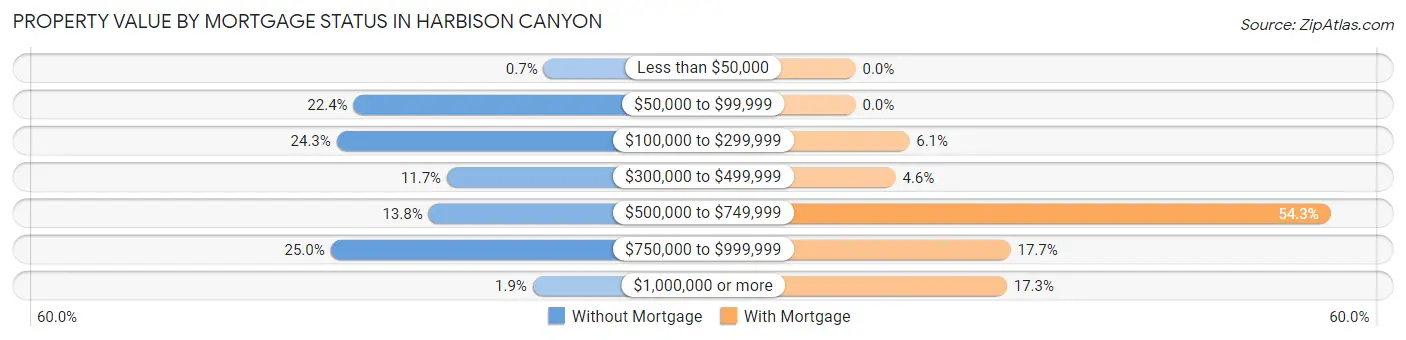
| Property Value | Without Mortgage | With Mortgage |
| Less than $50,000 | 4 (0.7%) | 0 (0.0%) |
| $50,000 to $99,999 | 128 (22.4%) | 0 (0.0%) |
| $100,000 to $299,999 | 139 (24.3%) | 43 (6.1%) |
| $300,000 to $499,999 | 67 (11.7%) | 32 (4.6%) |
| $500,000 to $749,999 | 79 (13.8%) | 380 (54.3%) |
| $750,000 to $999,999 | 143 (25.0%) | 124 (17.7%) |
| $1,000,000 or more | 11 (1.9%) | 121 (17.3%) |
| Total | 571 (100.0%) | 700 (100.0%) |
Household Income by Mortgage Status in Harbison Canyon
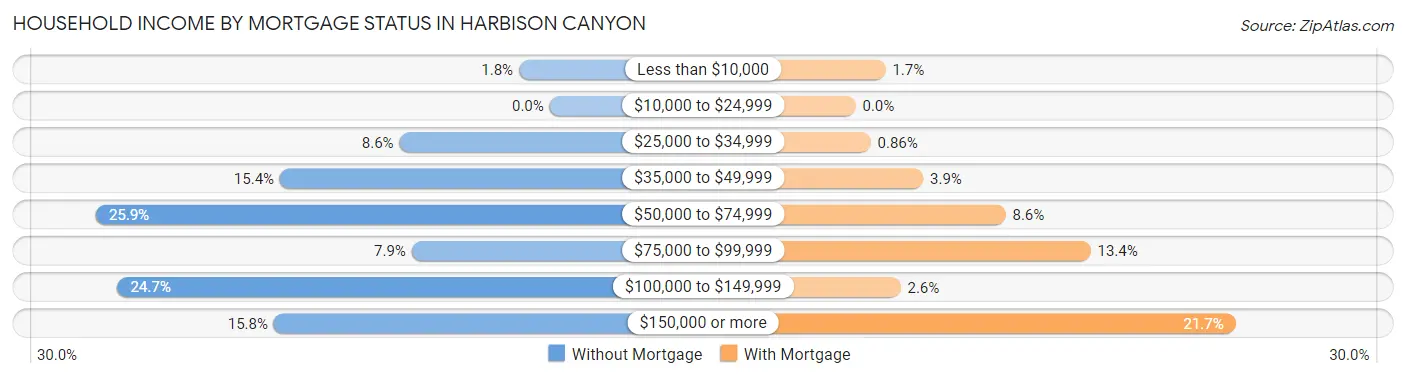
| Household Income | Without Mortgage | With Mortgage |
| Less than $10,000 | 10 (1.8%) | 12 (1.7%) |
| $10,000 to $24,999 | 0 (0.0%) | 0 (0.0%) |
| $25,000 to $34,999 | 49 (8.6%) | 6 (0.9%) |
| $35,000 to $49,999 | 88 (15.4%) | 27 (3.9%) |
| $50,000 to $74,999 | 148 (25.9%) | 60 (8.6%) |
| $75,000 to $99,999 | 45 (7.9%) | 94 (13.4%) |
| $100,000 to $149,999 | 141 (24.7%) | 18 (2.6%) |
| $150,000 or more | 90 (15.8%) | 152 (21.7%) |
| Total | 571 (100.0%) | 700 (100.0%) |
Property Value to Household Income Ratio in Harbison Canyon
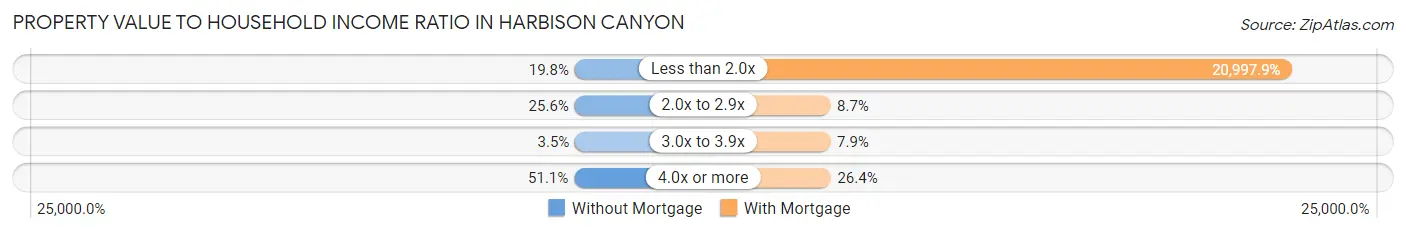
| Value-to-Income Ratio | Without Mortgage | With Mortgage |
| Less than 2.0x | 113 (19.8%) | 146,985 (20,997.9%) |
| 2.0x to 2.9x | 146 (25.6%) | 61 (8.7%) |
| 3.0x to 3.9x | 20 (3.5%) | 55 (7.9%) |
| 4.0x or more | 292 (51.1%) | 185 (26.4%) |
| Total | 571 (100.0%) | 700 (100.0%) |
Real Estate Taxes by Mortgage Status in Harbison Canyon
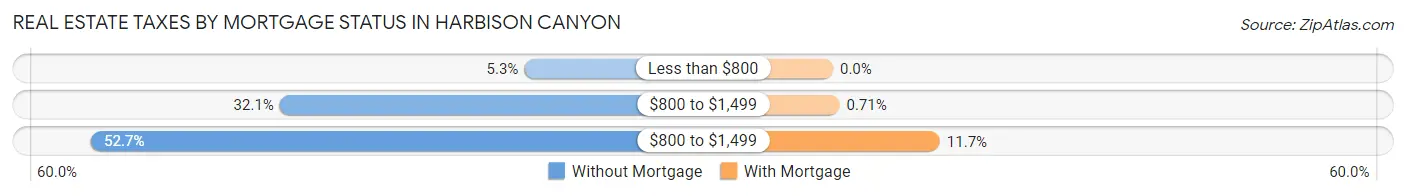
| Property Taxes | Without Mortgage | With Mortgage |
| Less than $800 | 30 (5.2%) | 0 (0.0%) |
| $800 to $1,499 | 183 (32.1%) | 5 (0.7%) |
| $800 to $1,499 | 301 (52.7%) | 82 (11.7%) |
| Total | 571 (100.0%) | 700 (100.0%) |
Health & Disability in Harbison Canyon
Health Insurance Coverage by Age in Harbison Canyon
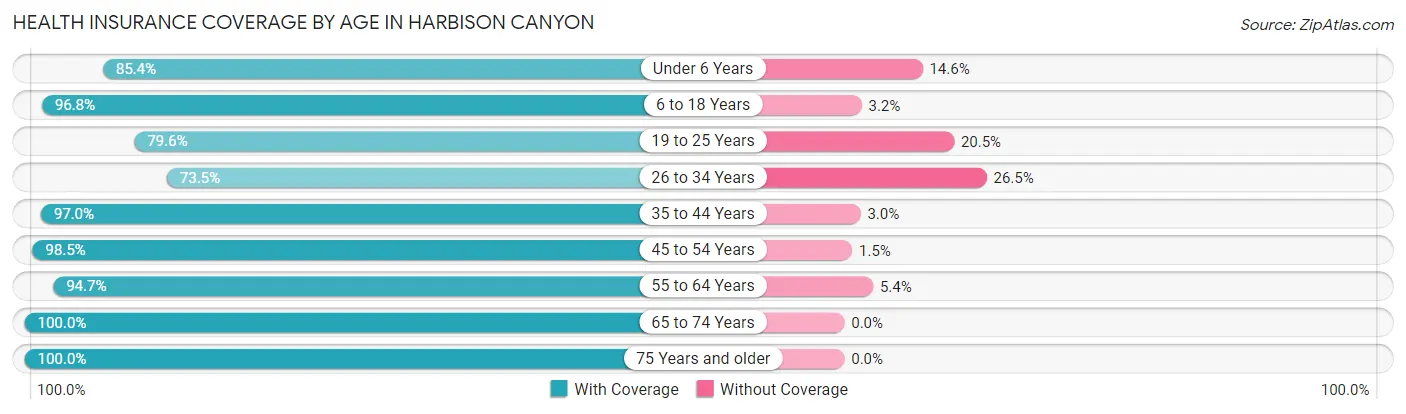
| Age Bracket | With Coverage | Without Coverage |
| Under 6 Years | 123 (85.4%) | 21 (14.6%) |
| 6 to 18 Years | 513 (96.8%) | 17 (3.2%) |
| 19 to 25 Years | 424 (79.5%) | 109 (20.4%) |
| 26 to 34 Years | 349 (73.5%) | 126 (26.5%) |
| 35 to 44 Years | 417 (97.0%) | 13 (3.0%) |
| 45 to 54 Years | 338 (98.5%) | 5 (1.5%) |
| 55 to 64 Years | 937 (94.7%) | 53 (5.3%) |
| 65 to 74 Years | 296 (100.0%) | 0 (0.0%) |
| 75 Years and older | 375 (100.0%) | 0 (0.0%) |
| Total | 3,772 (91.6%) | 344 (8.4%) |
Health Insurance Coverage by Citizenship Status in Harbison Canyon
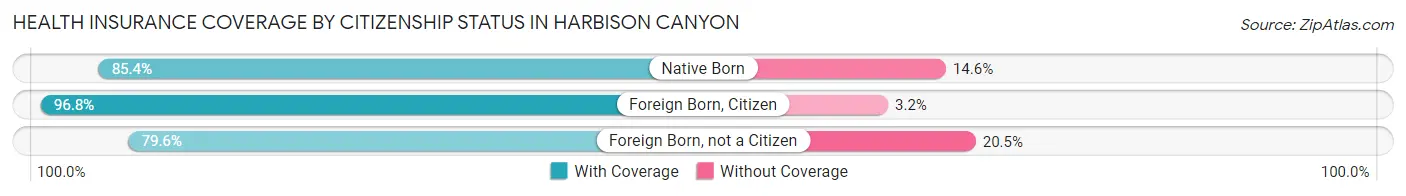
| Citizenship Status | With Coverage | Without Coverage |
| Native Born | 123 (85.4%) | 21 (14.6%) |
| Foreign Born, Citizen | 513 (96.8%) | 17 (3.2%) |
| Foreign Born, not a Citizen | 424 (79.5%) | 109 (20.4%) |
Health Insurance Coverage by Household Income in Harbison Canyon
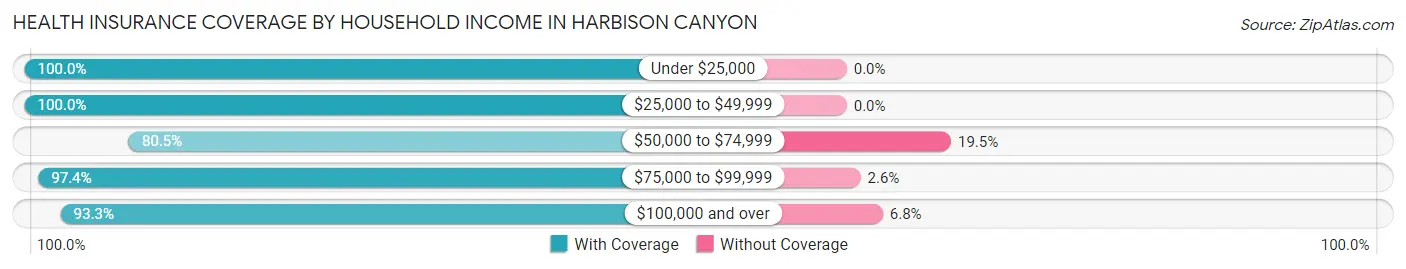
| Household Income | With Coverage | Without Coverage |
| Under $25,000 | 47 (100.0%) | 0 (0.0%) |
| $25,000 to $49,999 | 509 (100.0%) | 0 (0.0%) |
| $50,000 to $74,999 | 704 (80.5%) | 171 (19.5%) |
| $75,000 to $99,999 | 189 (97.4%) | 5 (2.6%) |
| $100,000 and over | 2,321 (93.2%) | 168 (6.8%) |
Public vs Private Health Insurance Coverage by Age in Harbison Canyon
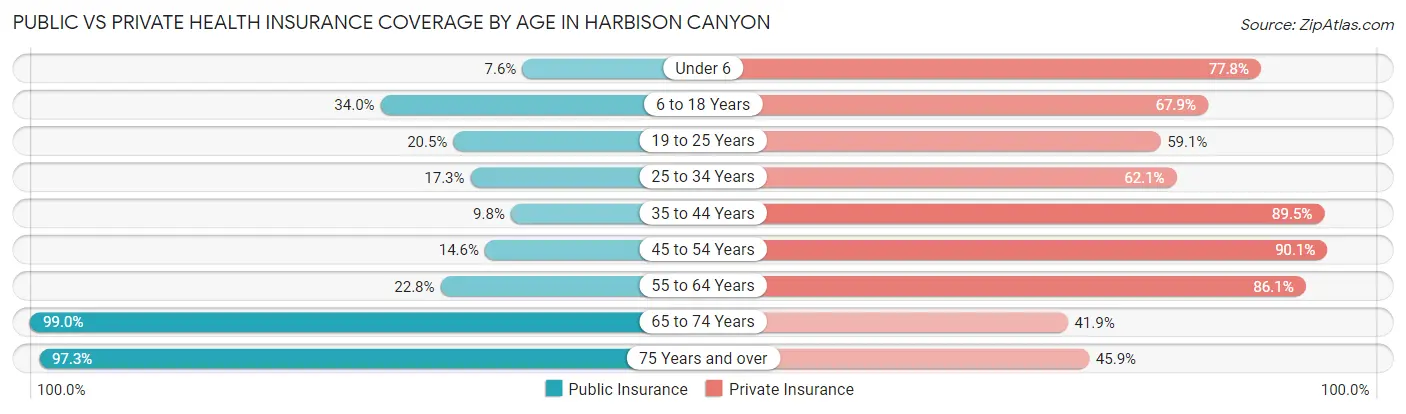
| Age Bracket | Public Insurance | Private Insurance |
| Under 6 | 11 (7.6%) | 112 (77.8%) |
| 6 to 18 Years | 180 (34.0%) | 360 (67.9%) |
| 19 to 25 Years | 109 (20.4%) | 315 (59.1%) |
| 25 to 34 Years | 82 (17.3%) | 295 (62.1%) |
| 35 to 44 Years | 42 (9.8%) | 385 (89.5%) |
| 45 to 54 Years | 50 (14.6%) | 309 (90.1%) |
| 55 to 64 Years | 226 (22.8%) | 852 (86.1%) |
| 65 to 74 Years | 293 (99.0%) | 124 (41.9%) |
| 75 Years and over | 365 (97.3%) | 172 (45.9%) |
| Total | 1,358 (33.0%) | 2,924 (71.0%) |
Disability Status by Sex by Age in Harbison Canyon
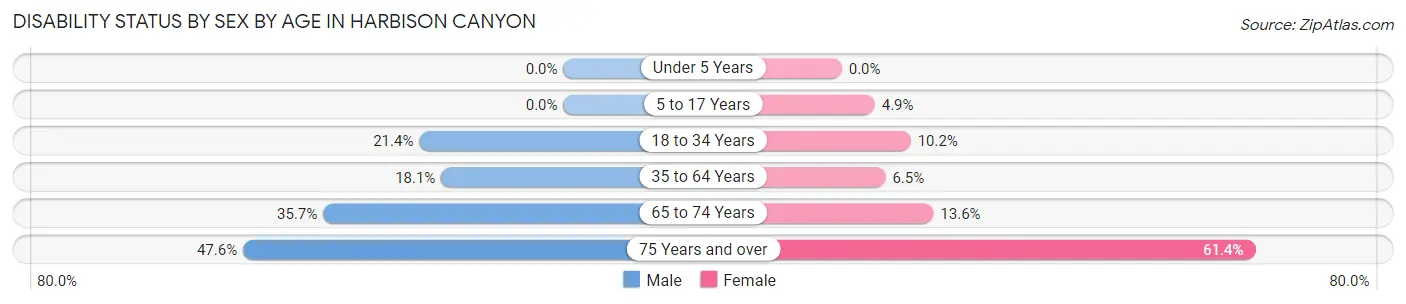
| Age Bracket | Male | Female |
| Under 5 Years | 0 (0.0%) | 0 (0.0%) |
| 5 to 17 Years | 0 (0.0%) | 12 (4.9%) |
| 18 to 34 Years | 110 (21.4%) | 58 (10.2%) |
| 35 to 64 Years | 152 (18.1%) | 60 (6.5%) |
| 65 to 74 Years | 61 (35.7%) | 17 (13.6%) |
| 75 Years and over | 49 (47.6%) | 167 (61.4%) |
Disability Class by Sex by Age in Harbison Canyon
Disability Class: Hearing Difficulty
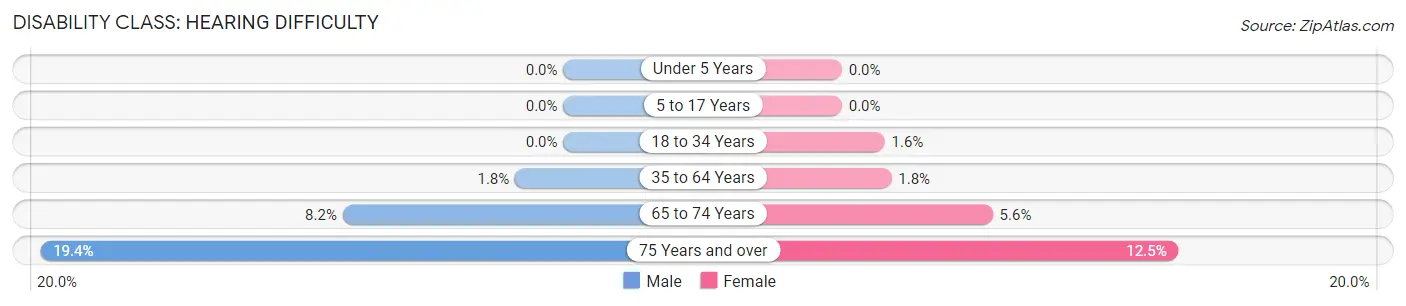
| Age Bracket | Male | Female |
| Under 5 Years | 0 (0.0%) | 0 (0.0%) |
| 5 to 17 Years | 0 (0.0%) | 0 (0.0%) |
| 18 to 34 Years | 0 (0.0%) | 9 (1.6%) |
| 35 to 64 Years | 15 (1.8%) | 17 (1.8%) |
| 65 to 74 Years | 14 (8.2%) | 7 (5.6%) |
| 75 Years and over | 20 (19.4%) | 34 (12.5%) |
Disability Class: Vision Difficulty
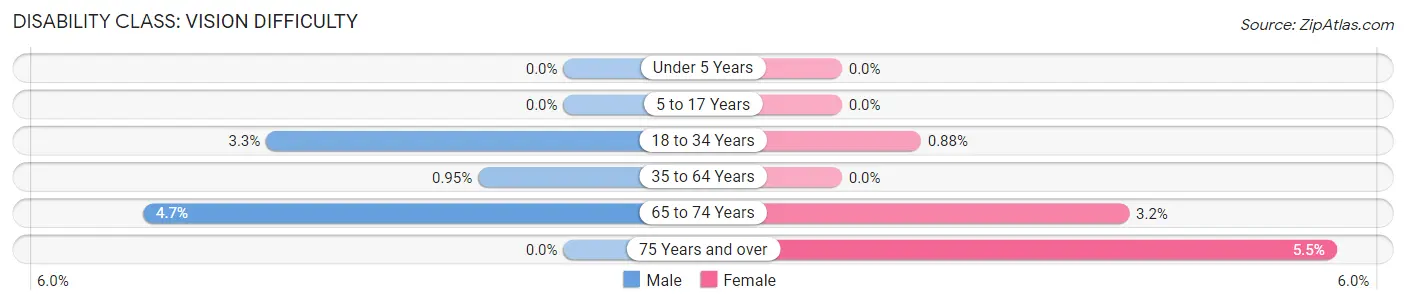
| Age Bracket | Male | Female |
| Under 5 Years | 0 (0.0%) | 0 (0.0%) |
| 5 to 17 Years | 0 (0.0%) | 0 (0.0%) |
| 18 to 34 Years | 17 (3.3%) | 5 (0.9%) |
| 35 to 64 Years | 8 (0.9%) | 0 (0.0%) |
| 65 to 74 Years | 8 (4.7%) | 4 (3.2%) |
| 75 Years and over | 0 (0.0%) | 15 (5.5%) |
Disability Class: Cognitive Difficulty
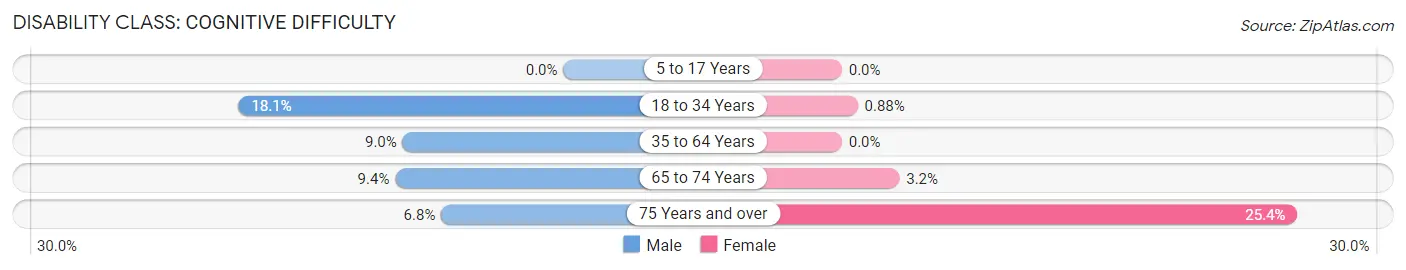
| Age Bracket | Male | Female |
| 5 to 17 Years | 0 (0.0%) | 0 (0.0%) |
| 18 to 34 Years | 93 (18.1%) | 5 (0.9%) |
| 35 to 64 Years | 75 (8.9%) | 0 (0.0%) |
| 65 to 74 Years | 16 (9.4%) | 4 (3.2%) |
| 75 Years and over | 7 (6.8%) | 69 (25.4%) |
Disability Class: Ambulatory Difficulty
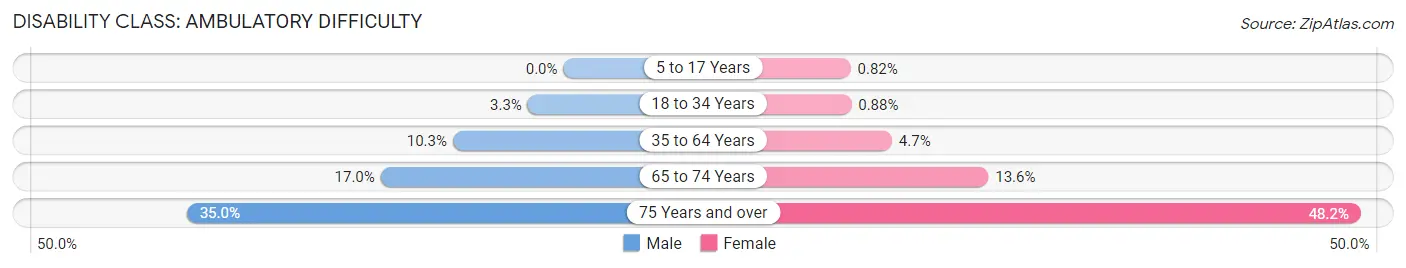
| Age Bracket | Male | Female |
| 5 to 17 Years | 0 (0.0%) | 2 (0.8%) |
| 18 to 34 Years | 17 (3.3%) | 5 (0.9%) |
| 35 to 64 Years | 86 (10.3%) | 43 (4.6%) |
| 65 to 74 Years | 29 (17.0%) | 17 (13.6%) |
| 75 Years and over | 36 (34.9%) | 131 (48.2%) |
Disability Class: Self-Care Difficulty
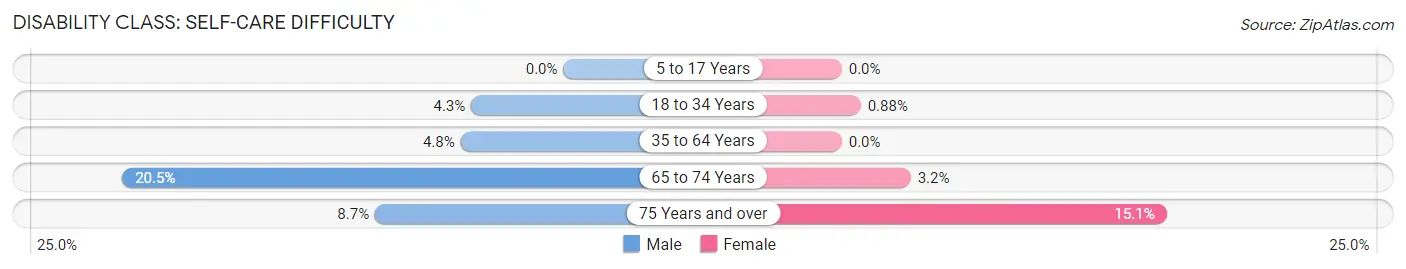
| Age Bracket | Male | Female |
| 5 to 17 Years | 0 (0.0%) | 0 (0.0%) |
| 18 to 34 Years | 22 (4.3%) | 5 (0.9%) |
| 35 to 64 Years | 40 (4.8%) | 0 (0.0%) |
| 65 to 74 Years | 35 (20.5%) | 4 (3.2%) |
| 75 Years and over | 9 (8.7%) | 41 (15.1%) |
Technology Access in Harbison Canyon
Computing Device Access in Harbison Canyon
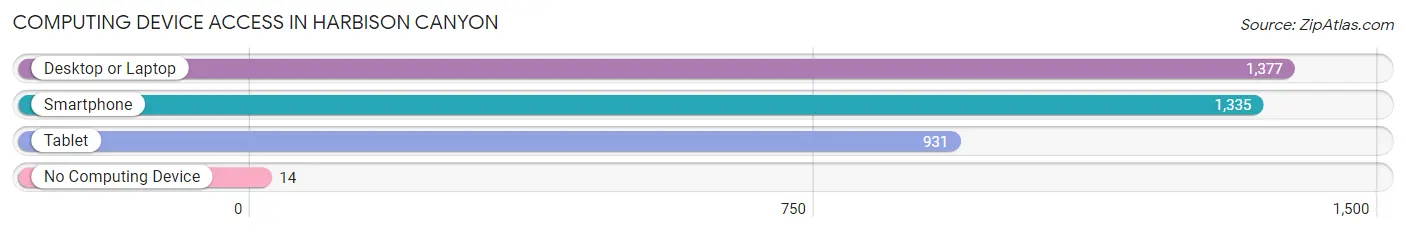
| Device Type | # Households | % Households |
| Desktop or Laptop | 1,377 | 96.0% |
| Smartphone | 1,335 | 93.1% |
| Tablet | 931 | 64.9% |
| No Computing Device | 14 | 1.0% |
| Total | 1,434 | 100.0% |
Internet Access in Harbison Canyon
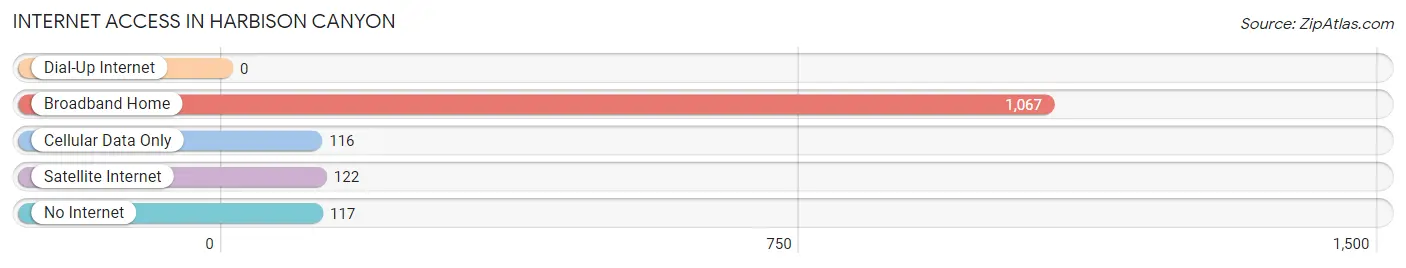
| Internet Type | # Households | % Households |
| Dial-Up Internet | 0 | 0.0% |
| Broadband Home | 1,067 | 74.4% |
| Cellular Data Only | 116 | 8.1% |
| Satellite Internet | 122 | 8.5% |
| No Internet | 117 | 8.2% |
| Total | 1,434 | 100.0% |
Harbison Canyon Summary
Harbison Canyon is a small unincorporated community located in the foothills of the Cuyamaca Mountains in San Diego County, California. It is situated in the East County region of San Diego, approximately 25 miles east of downtown San Diego. The community is located in a rural area, surrounded by rolling hills and open space.
History
Harbison Canyon was originally inhabited by the Kumeyaay people, who were the original inhabitants of the area. The Kumeyaay were hunter-gatherers who lived in the area for thousands of years before the arrival of Europeans.
The first Europeans to settle in the area were Spanish missionaries, who established a mission in the area in 1769. The mission was abandoned in 1821, and the area was later settled by ranchers and farmers. The area was named after John Harbison, who was one of the first settlers in the area.
In the late 19th century, the area was used for cattle ranching and farming. The area was also used for mining, and several gold and silver mines were established in the area.
Geography
Harbison Canyon is located in the foothills of the Cuyamaca Mountains in San Diego County, California. It is situated in the East County region of San Diego, approximately 25 miles east of downtown San Diego. The community is located in a rural area, surrounded by rolling hills and open space.
The area is characterized by a Mediterranean climate, with hot, dry summers and mild, wet winters. The average annual temperature is around 70 degrees Fahrenheit, and the average annual precipitation is around 15 inches.
Economy
The economy of Harbison Canyon is largely based on agriculture and ranching. The area is home to several farms and ranches, which produce a variety of crops and livestock. The area is also home to several wineries, which produce a variety of wines.
The area is also home to several businesses, including a gas station, a grocery store, a post office, and a few restaurants.
Demographics
As of the 2010 census, the population of Harbison Canyon was 1,845. The population is largely white (90.2%), with a small Hispanic population (7.2%). The median household income is $68,750, and the median home value is $521,000.
The area is largely rural, with a small population density. The majority of the population is employed in the agricultural and ranching industries. The area is also home to several small businesses, including a gas station, a grocery store, a post office, and a few restaurants.
Common Questions
What is Per Capita Income in Harbison Canyon?
Per Capita income in Harbison Canyon is $55,307.
What is the Median Family Income in Harbison Canyon?
Median Family Income in Harbison Canyon is $116,300.
What is the Median Household income in Harbison Canyon?
Median Household Income in Harbison Canyon is $111,689.
What is Income or Wage Gap in Harbison Canyon?
Income or Wage Gap in Harbison Canyon is 44.8%.
Women in Harbison Canyon earn 55.2 cents for every dollar earned by a man.
What is Inequality or Gini Index in Harbison Canyon?
Inequality or Gini Index in Harbison Canyon is 0.49.
What is the Total Population of Harbison Canyon?
Total Population of Harbison Canyon is 4,137.
What is the Total Male Population of Harbison Canyon?
Total Male Population of Harbison Canyon is 1,937.
What is the Total Female Population of Harbison Canyon?
Total Female Population of Harbison Canyon is 2,200.
What is the Ratio of Males per 100 Females in Harbison Canyon?
There are 88.05 Males per 100 Females in Harbison Canyon.
What is the Ratio of Females per 100 Males in Harbison Canyon?
There are 113.58 Females per 100 Males in Harbison Canyon.
What is the Median Population Age in Harbison Canyon?
Median Population Age in Harbison Canyon is 44.2 Years.
What is the Average Family Size in Harbison Canyon
Average Family Size in Harbison Canyon is 3.1 People.
What is the Average Household Size in Harbison Canyon
Average Household Size in Harbison Canyon is 2.9 People.
How Large is the Labor Force in Harbison Canyon?
There are 2,245 People in the Labor Forcein in Harbison Canyon.
What is the Percentage of People in the Labor Force in Harbison Canyon?
60.1% of People are in the Labor Force in Harbison Canyon.
What is the Unemployment Rate in Harbison Canyon?
Unemployment Rate in Harbison Canyon is 9.3%.