Cities with the Highest Unemployment Rate Amomg Youth Under the Age of 25 in Maryland
RELATED REPORTS & OPTIONS
Highest Unemployment | Youth < 25
Maryland
Compare Cities
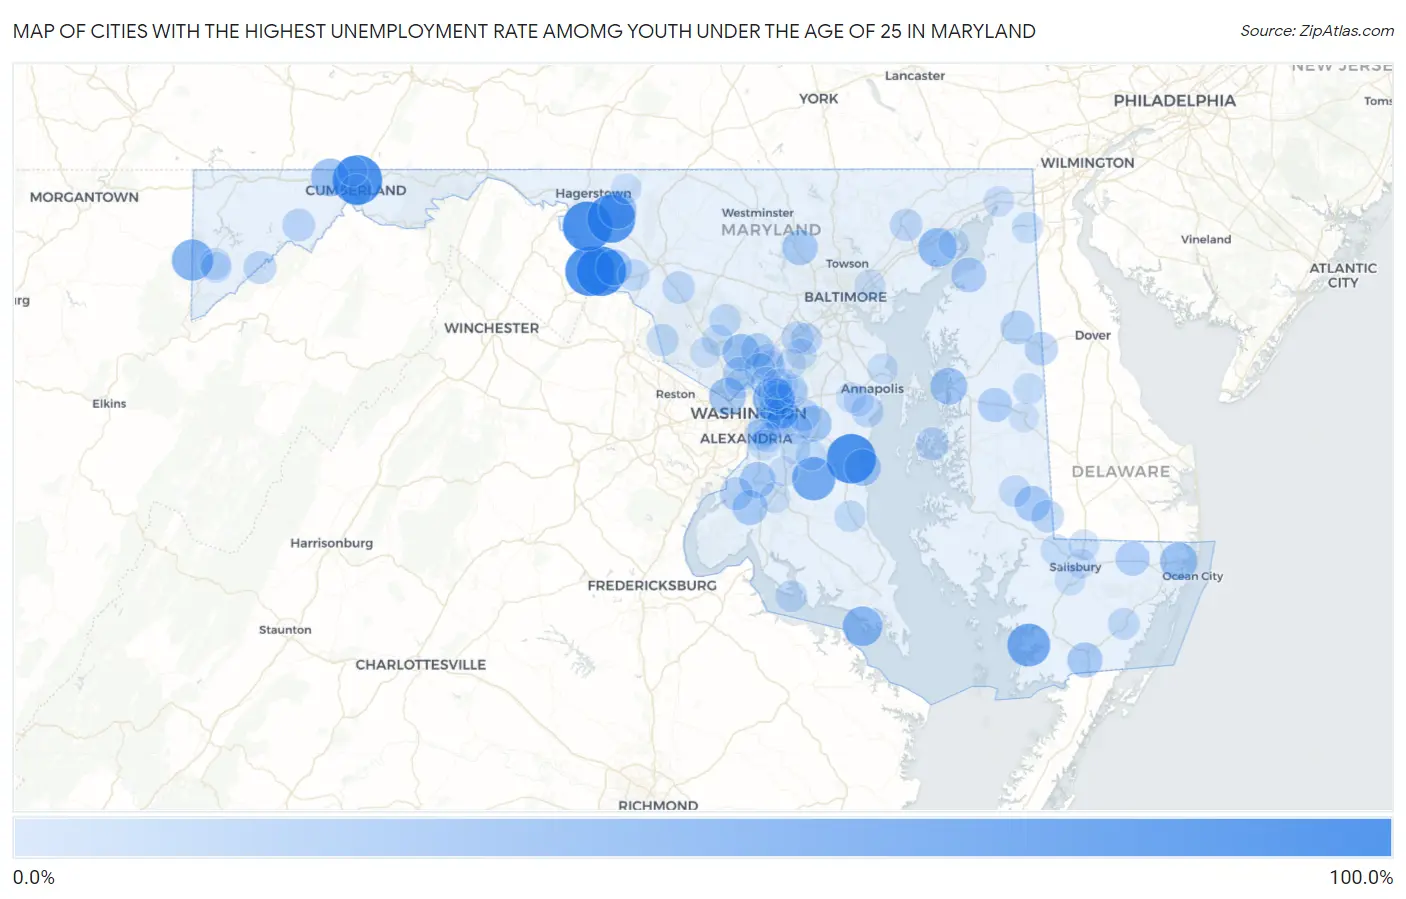
Map of Cities with the Highest Unemployment Rate Amomg Youth Under the Age of 25 in Maryland
0.0%
100.0%
Cities with the Highest Unemployment Rate Amomg Youth Under the Age of 25 in Maryland
| City | Youth Unemployment | vs State | vs National | |
| 1. | Bowmans Addition | 100.0% | 12.3%(+87.7)#1 | 10.9%(+89.1)#81 |
| 2. | Dargan | 100.0% | 12.3%(+87.7)#2 | 10.9%(+89.1)#192 |
| 3. | Yarrowsburg | 100.0% | 12.3%(+87.7)#3 | 10.9%(+89.1)#208 |
| 4. | Tilghmanton | 99.9% | 12.3%(+87.6)#4 | 10.9%(+89.0)#348 |
| 5. | Friendship | 99.9% | 12.3%(+87.6)#5 | 10.9%(+89.0)#351 |
| 6. | San Mar | 93.7% | 12.3%(+81.4)#6 | 10.9%(+82.8)#391 |
| 7. | Baden | 72.9% | 12.3%(+60.6)#7 | 10.9%(+62.0)#544 |
| 8. | Fairmount | 71.4% | 12.3%(+59.1)#8 | 10.9%(+60.5)#564 |
| 9. | Bladensburg | 67.6% | 12.3%(+55.3)#9 | 10.9%(+56.7)#618 |
| 10. | Hutton | 64.4% | 12.3%(+52.1)#10 | 10.9%(+53.5)#681 |
| 11. | Tall Timbers | 57.3% | 12.3%(+45.0)#11 | 10.9%(+46.4)#845 |
| 12. | Perryman | 52.9% | 12.3%(+40.6)#12 | 10.9%(+42.0)#994 |
| 13. | Bagtown | 50.0% | 12.3%(+37.7)#13 | 10.9%(+39.1)#1,097 |
| 14. | Mount Savage | 49.9% | 12.3%(+37.6)#14 | 10.9%(+39.0)#1,167 |
| 15. | Ocean Pines | 47.8% | 12.3%(+35.5)#15 | 10.9%(+36.9)#1,245 |
| 16. | Brookmont | 46.1% | 12.3%(+33.8)#16 | 10.9%(+35.2)#1,299 |
| 17. | Leisure World | 46.0% | 12.3%(+33.7)#17 | 10.9%(+35.1)#1,314 |
| 18. | Queenstown | 45.0% | 12.3%(+32.7)#18 | 10.9%(+34.1)#1,363 |
| 19. | North Beach | 44.7% | 12.3%(+32.4)#19 | 10.9%(+33.8)#1,379 |
| 20. | Burkittsville | 42.8% | 12.3%(+30.5)#20 | 10.9%(+31.9)#1,525 |
| 21. | Brock Hall | 41.7% | 12.3%(+29.4)#21 | 10.9%(+30.8)#1,578 |
| 22. | Accokeek | 41.3% | 12.3%(+29.0)#22 | 10.9%(+30.4)#1,617 |
| 23. | Fairmount Heights | 40.7% | 12.3%(+28.4)#23 | 10.9%(+29.8)#1,655 |
| 24. | Eldorado | 40.0% | 12.3%(+27.7)#24 | 10.9%(+29.1)#1,717 |
| 25. | Reisterstown | 38.4% | 12.3%(+26.1)#25 | 10.9%(+27.5)#1,811 |
| 26. | Pomfret | 38.2% | 12.3%(+25.9)#26 | 10.9%(+27.3)#1,837 |
| 27. | Pocomoke City | 38.1% | 12.3%(+25.8)#27 | 10.9%(+27.2)#1,840 |
| 28. | Betterton | 37.5% | 12.3%(+25.2)#28 | 10.9%(+26.6)#1,892 |
| 29. | Seat Pleasant | 36.9% | 12.3%(+24.6)#29 | 10.9%(+26.0)#1,940 |
| 30. | Hillcrest Heights | 34.3% | 12.3%(+22.0)#30 | 10.9%(+23.4)#2,168 |
| 31. | Queen Anne | 34.3% | 12.3%(+22.0)#31 | 10.9%(+23.4)#2,174 |
| 32. | Willards | 33.6% | 12.3%(+21.3)#32 | 10.9%(+22.7)#2,230 |
| 33. | Sudlersville | 33.3% | 12.3%(+21.0)#33 | 10.9%(+22.4)#2,283 |
| 34. | Woodlawn Cdp Prince George S County | 32.4% | 12.3%(+20.1)#34 | 10.9%(+21.5)#2,405 |
| 35. | Kensington | 32.3% | 12.3%(+20.0)#35 | 10.9%(+21.4)#2,419 |
| 36. | Burnt Mills | 31.7% | 12.3%(+19.4)#36 | 10.9%(+20.8)#2,481 |
| 37. | Marydel | 31.5% | 12.3%(+19.2)#37 | 10.9%(+20.6)#2,515 |
| 38. | Cloverly | 31.2% | 12.3%(+18.9)#38 | 10.9%(+20.3)#2,535 |
| 39. | Bryans Road | 30.1% | 12.3%(+17.8)#39 | 10.9%(+19.2)#2,662 |
| 40. | Kettering | 28.7% | 12.3%(+16.4)#40 | 10.9%(+17.8)#2,844 |
| 41. | District Heights | 28.5% | 12.3%(+16.2)#41 | 10.9%(+17.6)#2,864 |
| 42. | St Michaels | 28.5% | 12.3%(+16.2)#42 | 10.9%(+17.6)#2,869 |
| 43. | Kitzmiller | 28.5% | 12.3%(+16.2)#43 | 10.9%(+17.6)#2,892 |
| 44. | Barton | 28.0% | 12.3%(+15.7)#44 | 10.9%(+17.1)#2,965 |
| 45. | Bel Air | 27.8% | 12.3%(+15.5)#45 | 10.9%(+16.9)#2,984 |
| 46. | Sharptown | 27.7% | 12.3%(+15.4)#46 | 10.9%(+16.8)#3,010 |
| 47. | Urbana | 27.3% | 12.3%(+15.0)#47 | 10.9%(+16.4)#3,057 |
| 48. | Mayo | 26.9% | 12.3%(+14.6)#48 | 10.9%(+16.0)#3,128 |
| 49. | Calverton | 26.0% | 12.3%(+13.7)#49 | 10.9%(+15.1)#3,295 |
| 50. | Peppermill Village | 25.8% | 12.3%(+13.5)#50 | 10.9%(+14.9)#3,337 |
| 51. | Poolesville | 25.7% | 12.3%(+13.4)#51 | 10.9%(+14.8)#3,355 |
| 52. | Savage | 25.3% | 12.3%(+13.0)#52 | 10.9%(+14.4)#3,416 |
| 53. | Fairland | 25.2% | 12.3%(+12.9)#53 | 10.9%(+14.3)#3,428 |
| 54. | Snow Hill | 25.0% | 12.3%(+12.7)#54 | 10.9%(+14.1)#3,458 |
| 55. | Laytonsville | 24.9% | 12.3%(+12.6)#55 | 10.9%(+14.0)#3,530 |
| 56. | Hurlock | 24.6% | 12.3%(+12.3)#56 | 10.9%(+13.7)#3,586 |
| 57. | Mountain Lake Park | 24.5% | 12.3%(+12.2)#57 | 10.9%(+13.6)#3,602 |
| 58. | Cumberland | 24.4% | 12.3%(+12.1)#58 | 10.9%(+13.5)#3,618 |
| 59. | Glassmanor | 24.3% | 12.3%(+12.0)#59 | 10.9%(+13.4)#3,636 |
| 60. | Cobb Island | 24.3% | 12.3%(+12.0)#60 | 10.9%(+13.4)#3,648 |
| 61. | Jefferson | 24.1% | 12.3%(+11.8)#61 | 10.9%(+13.2)#3,684 |
| 62. | Jessup | 23.8% | 12.3%(+11.5)#62 | 10.9%(+12.9)#3,731 |
| 63. | Prince Frederick | 23.4% | 12.3%(+11.1)#63 | 10.9%(+12.5)#3,835 |
| 64. | White Oak | 22.9% | 12.3%(+10.6)#64 | 10.9%(+12.0)#3,955 |
| 65. | Washington Grove | 22.8% | 12.3%(+10.5)#65 | 10.9%(+11.9)#3,993 |
| 66. | Adelphi | 22.5% | 12.3%(+10.2)#66 | 10.9%(+11.6)#4,035 |
| 67. | Westphalia | 22.4% | 12.3%(+10.1)#67 | 10.9%(+11.5)#4,060 |
| 68. | Croom | 22.3% | 12.3%(+10.00)#68 | 10.9%(+11.4)#4,098 |
| 69. | Greensboro | 22.2% | 12.3%(+9.90)#69 | 10.9%(+11.3)#4,118 |
| 70. | Hebron | 22.2% | 12.3%(+9.90)#70 | 10.9%(+11.3)#4,133 |
| 71. | Chesapeake City | 22.2% | 12.3%(+9.90)#71 | 10.9%(+11.3)#4,143 |
| 72. | Rosaryville | 21.7% | 12.3%(+9.40)#72 | 10.9%(+10.8)#4,244 |
| 73. | Lanham | 21.2% | 12.3%(+8.90)#73 | 10.9%(+10.3)#4,380 |
| 74. | Edmonston | 21.1% | 12.3%(+8.80)#74 | 10.9%(+10.2)#4,415 |
| 75. | Loch Lynn Heights | 21.0% | 12.3%(+8.70)#75 | 10.9%(+10.1)#4,454 |
| 76. | Waldorf | 20.8% | 12.3%(+8.50)#76 | 10.9%(+9.90)#4,484 |
| 77. | Greenbelt | 20.8% | 12.3%(+8.50)#77 | 10.9%(+9.90)#4,486 |
| 78. | Cape St Claire | 20.8% | 12.3%(+8.50)#78 | 10.9%(+9.90)#4,492 |
| 79. | Delmar | 20.8% | 12.3%(+8.50)#79 | 10.9%(+9.90)#4,496 |
| 80. | Riva | 20.4% | 12.3%(+8.10)#80 | 10.9%(+9.50)#4,592 |
| 81. | Landover Hills | 20.4% | 12.3%(+8.10)#81 | 10.9%(+9.50)#4,598 |
| 82. | Rosedale | 20.3% | 12.3%(+8.00)#82 | 10.9%(+9.40)#4,613 |
| 83. | Oxon Hill | 19.9% | 12.3%(+7.60)#83 | 10.9%(+9.00)#4,747 |
| 84. | Maryland City | 19.9% | 12.3%(+7.60)#84 | 10.9%(+9.00)#4,748 |
| 85. | Fruitland | 19.8% | 12.3%(+7.50)#85 | 10.9%(+8.90)#4,810 |
| 86. | Aberdeen Proving Ground | 19.8% | 12.3%(+7.50)#86 | 10.9%(+8.90)#4,816 |
| 87. | North East | 19.6% | 12.3%(+7.30)#87 | 10.9%(+8.70)#4,846 |
| 88. | Edgewater | 19.4% | 12.3%(+7.10)#88 | 10.9%(+8.50)#4,893 |
| 89. | East Riverdale | 18.8% | 12.3%(+6.50)#89 | 10.9%(+7.90)#5,095 |
| 90. | Smithsburg | 18.7% | 12.3%(+6.40)#90 | 10.9%(+7.80)#5,137 |
| 91. | North Potomac | 18.5% | 12.3%(+6.20)#91 | 10.9%(+7.60)#5,194 |
| 92. | Seabrook | 18.2% | 12.3%(+5.90)#92 | 10.9%(+7.30)#5,278 |
| 93. | Brandywine | 18.2% | 12.3%(+5.90)#93 | 10.9%(+7.30)#5,284 |
| 94. | Temple Hills | 18.1% | 12.3%(+5.80)#94 | 10.9%(+7.20)#5,305 |
| 95. | Denton | 18.1% | 12.3%(+5.80)#95 | 10.9%(+7.20)#5,309 |
| 96. | Berwyn Heights | 18.0% | 12.3%(+5.70)#96 | 10.9%(+7.10)#5,379 |
| 97. | South Laurel | 17.8% | 12.3%(+5.50)#97 | 10.9%(+6.90)#5,439 |
| 98. | Ellerslie | 17.7% | 12.3%(+5.40)#98 | 10.9%(+6.80)#5,512 |
| 99. | Salisbury | 17.6% | 12.3%(+5.30)#99 | 10.9%(+6.70)#5,522 |
| 100. | Chevy Chase | 17.6% | 12.3%(+5.30)#100 | 10.9%(+6.70)#5,536 |
Common Questions
What are the Top 10 Cities with the Highest Unemployment Rate Amomg Youth Under the Age of 25 in Maryland?
Top 10 Cities with the Highest Unemployment Rate Amomg Youth Under the Age of 25 in Maryland are:
#1
100.0%
#2
100.0%
#3
100.0%
#4
99.9%
#5
99.9%
#6
93.7%
#7
72.9%
#8
71.4%
#9
67.6%
#10
64.4%
What city has the Highest Unemployment Rate Amomg Youth Under the Age of 25 in Maryland?
Bowmans Addition has the Highest Unemployment Rate Amomg Youth Under the Age of 25 in Maryland with 100.0%.
What is the Unemployment Rate Amomg Youth Under the Age of 25 in the State of Maryland?
Unemployment Rate Amomg Youth Under the Age of 25 in Maryland is 12.3%.
What is the Unemployment Rate Amomg Youth Under the Age of 25 in the United States?
Unemployment Rate Amomg Youth Under the Age of 25 in the United States is 10.9%.