Cities with the Highest Unemployment Rate Amomg Youth Under the Age of 25 in New Hampshire

RELATED REPORTS & OPTIONS

Highest Unemployment | Youth < 25
Population
Families and Households
Female Fertility
Female Fertility (Unmarried)
Race (Community Size)
Race (Percentage)
Ancestry (Community Size)
AfghanAfricanAlaska NativeAlaskan AthabascanAlbanianAleutAlsatianAmericanApacheArabArapahoArgentineanArmenianAssyrian / Chaldean / SyriacAustralianAustrianBahamianBangladeshiBarbadianBasqueBelgianBelizeanBermudanBhutaneseBlackfeetBolivianBrazilianBritishBritish West IndianBulgarianBurmeseCajunCambodianCanadianCape VerdeanCarpatho RusynCelticCentral AmericanCentral American IndianCherokeeCheyenneChickasawChileanChineseChippewaChoctawColombianColvilleComancheCosta RicanCreeCreekCroatianCrowCubanCypriotCzechCzechoslovakianDanishDelawareDominicanDutchDutch West IndianEastern EuropeanEcuadorianEgyptianEnglishEstonianEthiopianEuropeanFijianFilipinoFinnishFrenchFrench American IndianFrench CanadianGermanGerman RussianGhanaianGreekGuamanian / ChamorroGuatemalanGuyaneseHaitianHmongHonduranHopiHoumaHungarianIcelanderIndian (Asian)IndonesianInupiatIranianIraqiIrishIroquoisIsraeliItalianJamaicanJapaneseJordanianKenyanKiowaKoreanLaotianLatvianLebaneseLiberianLithuanianLumbeeLuxembourgerMacedonianMalaysianMalteseMarshalleseMenomineeMexicanMexican American IndianMongolianMoroccanNative HawaiianNavajoNepaleseNew ZealanderNicaraguanNigerianNorthern EuropeanNorwegianOkinawanOsageOttawaPaiutePakistaniPalestinianPanamanianParaguayanPennsylvania GermanPeruvianPimaPolishPortuguesePotawatomiPuebloPuerto RicanPuget Sound SalishRomanianRussianSalvadoranSamoanScandinavianScotch-IrishScottishSeminoleSenegaleseSerbianShoshoneSierra LeoneanSiouxSlavicSlovakSloveneSomaliSouth AfricanSouth AmericanSouth American IndianSoviet UnionSpaniardSpanishSpanish AmericanSpanish American IndianSri LankanSubsaharan AfricanSudaneseSwedishSwissSyrianTaiwaneseThaiTlingit-HaidaTohono O'OdhamTonganTrinidadian and TobagonianTsimshianTurkishU.S. Virgin IslanderUgandanUkrainianUruguayanUteVenezuelanVietnameseWelshWest IndianYakamaYaquiYugoslavianYumanYup'ikZimbabwean
Ancestry (Percentage)
AfghanAfricanAlaska NativeAlaskan AthabascanAlbanianAleutAlsatianAmericanApacheArabArapahoArgentineanArmenianAssyrian / Chaldean / SyriacAustralianAustrianBahamianBangladeshiBarbadianBasqueBelgianBelizeanBermudanBhutaneseBlackfeetBolivianBrazilianBritishBritish West IndianBulgarianBurmeseCajunCambodianCanadianCape VerdeanCarpatho RusynCelticCentral AmericanCentral American IndianCherokeeCheyenneChickasawChileanChineseChippewaChoctawColombianColvilleComancheCosta RicanCreeCreekCroatianCrowCubanCypriotCzechCzechoslovakianDanishDelawareDominicanDutchDutch West IndianEastern EuropeanEcuadorianEgyptianEnglishEstonianEthiopianEuropeanFijianFilipinoFinnishFrenchFrench American IndianFrench CanadianGermanGerman RussianGhanaianGreekGuamanian / ChamorroGuatemalanGuyaneseHaitianHmongHonduranHopiHoumaHungarianIcelanderIndian (Asian)IndonesianInupiatIranianIraqiIrishIroquoisIsraeliItalianJamaicanJapaneseJordanianKenyanKiowaKoreanLaotianLatvianLebaneseLiberianLithuanianLumbeeLuxembourgerMacedonianMalaysianMalteseMarshalleseMenomineeMexicanMexican American IndianMongolianMoroccanNative HawaiianNavajoNepaleseNew ZealanderNicaraguanNigerianNorthern EuropeanNorwegianOkinawanOsageOttawaPaiutePakistaniPalestinianPanamanianParaguayanPennsylvania GermanPeruvianPimaPolishPortuguesePotawatomiPuebloPuerto RicanPuget Sound SalishRomanianRussianSalvadoranSamoanScandinavianScotch-IrishScottishSeminoleSenegaleseSerbianShoshoneSierra LeoneanSiouxSlavicSlovakSloveneSomaliSouth AfricanSouth AmericanSouth American IndianSoviet UnionSpaniardSpanishSpanish AmericanSpanish American IndianSri LankanSubsaharan AfricanSudaneseSwedishSwissSyrianTaiwaneseThaiTlingit-HaidaTohono O'OdhamTonganTrinidadian and TobagonianTsimshianTurkishU.S. Virgin IslanderUgandanUkrainianUruguayanUteVenezuelanVietnameseWelshWest IndianYakamaYaquiYugoslavianYumanYup'ikZimbabwean
Immigrant Origin (Total)
AfghanistanAfricaAlbaniaArgentinaArmeniaAsiaAustraliaAustriaAzoresBahamasBangladeshBarbadosBelarusBelgiumBelizeBoliviaBosnia and HerzegovinaBrazilBulgariaBurma / MyanmarCabo VerdeCambodiaCameroonCanadaCaribbeanCentral AmericaChileChinaColombiaCongoCosta RicaCroatiaCubaCzechoslovakiaDenmarkDominicaDominican RepublicEastern AfricaEastern AsiaEastern EuropeEcuadorEgyptEl SalvadorEnglandEritreaEthiopiaEuropeFijiFranceGermanyGhanaGreeceGrenadaGuatemalaGuyanaHaitiHondurasHong KongHungaryIndiaIndonesiaIranIraqIrelandIsraelItalyJamaicaJapanJordanKazakhstanKenyaKoreaKuwaitLaosLatin AmericaLatviaLebanonLiberiaLithuaniaMalaysiaMexicoMicronesiaMiddle AfricaMoldovaMoroccoNepalNetherlandsNicaraguaNigeriaNorth MacedoniaNorthern AfricaNorthern EuropeNorwayOceaniaPakistanPanamaPeruPhilippinesPolandPortugalRomaniaRussiaSaudi ArabiaScotlandSenegalSerbiaSierra LeoneSingaporeSomaliaSouth AfricaSouth AmericaSouth Central AsiaSouth Eastern AsiaSouthern EuropeSpainSri LankaSt. Vincent and the GrenadinesSudanSwedenSwitzerlandSyriaTaiwanThailandTrinidad and TobagoTurkeyUgandaUkraineUruguayUzbekistanVenezuelaVietnamWest IndiesWestern AfricaWestern AsiaWestern EuropeYemenZaireZimbabwe
Immigrant Origin (Percentage)
AfghanistanAfricaAlbaniaArgentinaArmeniaAsiaAustraliaAustriaAzoresBahamasBangladeshBarbadosBelarusBelgiumBelizeBoliviaBosnia and HerzegovinaBrazilBulgariaBurma / MyanmarCabo VerdeCambodiaCameroonCanadaCaribbeanCentral AmericaChileChinaColombiaCongoCosta RicaCroatiaCubaCzechoslovakiaDenmarkDominicaDominican RepublicEastern AfricaEastern AsiaEastern EuropeEcuadorEgyptEl SalvadorEnglandEritreaEthiopiaEuropeFijiFranceGermanyGhanaGreeceGrenadaGuatemalaGuyanaHaitiHondurasHong KongHungaryIndiaIndonesiaIranIraqIrelandIsraelItalyJamaicaJapanJordanKazakhstanKenyaKoreaKuwaitLaosLatin AmericaLatviaLebanonLiberiaLithuaniaMalaysiaMexicoMicronesiaMiddle AfricaMoldovaMoroccoNepalNetherlandsNicaraguaNigeriaNorth MacedoniaNorthern AfricaNorthern EuropeNorwayOceaniaPakistanPanamaPeruPhilippinesPolandPortugalRomaniaRussiaSaudi ArabiaScotlandSenegalSerbiaSierra LeoneSingaporeSomaliaSouth AfricaSouth AmericaSouth Central AsiaSouth Eastern AsiaSouthern EuropeSpainSri LankaSt. Vincent and the GrenadinesSudanSwedenSwitzerlandSyriaTaiwanThailandTrinidad and TobagoTurkeyUgandaUkraineUruguayUzbekistanVenezuelaVietnamWest IndiesWestern AfricaWestern AsiaWestern EuropeYemenZaireZimbabwe
Income
Income (Families)
Income (Households)
Poverty
Poverty (Families)
Unemployment
Employment Occupations
Employment Industries
Employer Class
Commute Time
Commute Means
School Enrollment
Education by Degree Field
Occupancy
Finances
Physical Characteristics
New Hampshire
Compare Cities
Comparison Subject

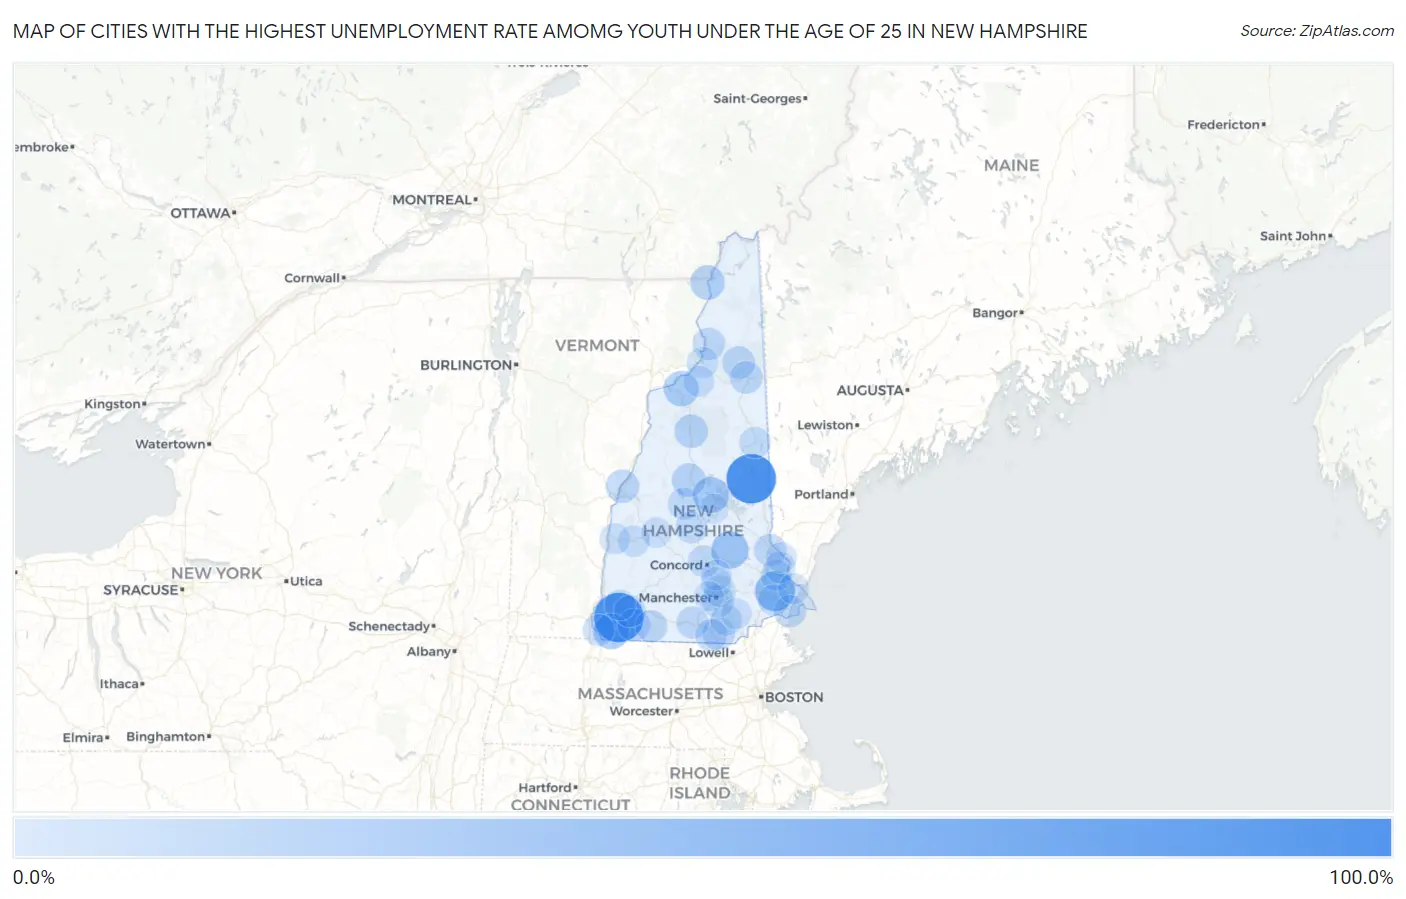
Map of Cities with the Highest Unemployment Rate Amomg Youth Under the Age of 25 in New Hampshire

0.0%
100.0%
Cities with the Highest Unemployment Rate Amomg Youth Under the Age of 25 in New Hampshire Map

Cities with the Highest Unemployment Rate Amomg Youth Under the Age of 25 in New Hampshire

City Youth Unemployment vs State vs National
1.Center Ossipee100.0%7.0%(+93.0)#110.9%(+89.1)#83
2.New Boston100.0%7.0%(+93.0)#210.9%(+89.1)#182
3.West Swanzey99.9%7.0%(+92.9)#310.9%(+89.0)#330
4.Newfields50.0%7.0%(+43.0)#410.9%(+39.1)#1,107
5.Pittsfield35.8%7.0%(+28.8)#510.9%(+24.9)#2,029
6.Meredith28.6%7.0%(+21.6)#610.9%(+17.7)#2,857
7.Winchester28.2%7.0%(+21.2)#710.9%(+17.3)#2,940
8.Littleton25.7%7.0%(+18.7)#810.9%(+14.8)#3,357
9.West Stewartstown21.4%7.0%(+14.4)#910.9%(+10.5)#4,349
10.Plymouth17.0%7.0%(+10.00)#1010.9%(+6.10)#5,797
11.Lincoln16.4%7.0%(+9.40)#1110.9%(+5.50)#6,071
12.Hanover15.9%7.0%(+8.90)#1210.9%(+5.00)#6,263
13.Troy13.3%7.0%(+6.30)#1310.9%(+2.40)#7,653
14.Berlin12.4%7.0%(+5.40)#1410.9%(+1.50)#8,183
15.Gorham11.8%7.0%(+4.80)#1510.9%(+0.900)#8,543
16.Rochester11.1%7.0%(+4.10)#1610.9%(+0.200)#8,955
17.Hudson11.0%7.0%(+4.00)#1710.9%(+0.100)#9,085
18.Groveton10.8%7.0%(+3.80)#1810.9%(-0.100)#9,220
19.Milford10.3%7.0%(+3.30)#1910.9%(-0.600)#9,570
20.Jaffrey10.2%7.0%(+3.20)#2010.9%(-0.700)#9,670
21.Manchester9.9%7.0%(+2.90)#2110.9%(-1.000)#9,861
22.Hampton Beach9.7%7.0%(+2.70)#2210.9%(-1.20)#10,065
23.Nashua9.6%7.0%(+2.60)#2310.9%(-1.30)#10,093
24.Bristol9.3%7.0%(+2.30)#2410.9%(-1.60)#10,369
25.Marlborough9.3%7.0%(+2.30)#2510.9%(-1.60)#10,388
26.Franklin8.4%7.0%(+1.40)#2610.9%(-2.50)#11,107
27.Concord8.3%7.0%(+1.30)#2710.9%(-2.60)#11,169
28.Hinsdale8.1%7.0%(+1.10)#2810.9%(-2.80)#11,372
29.Londonderry7.3%7.0%(+0.300)#2910.9%(-3.60)#11,972
30.South Hooksett6.9%7.0%(-0.100)#3010.9%(-4.00)#12,268
31.Conway6.8%7.0%(-0.200)#3110.9%(-4.10)#12,347
32.Dover6.2%7.0%(-0.800)#3210.9%(-4.70)#12,780
33.Lancaster6.0%7.0%(-1.00)#3310.9%(-4.90)#12,989
34.Newport5.7%7.0%(-1.30)#3410.9%(-5.20)#13,219
35.Durham4.9%7.0%(-2.10)#3510.9%(-6.00)#13,806
36.Whitefield4.9%7.0%(-2.10)#3610.9%(-6.00)#13,838
37.Exeter4.8%7.0%(-2.20)#3710.9%(-6.10)#13,876
38.Portsmouth4.4%7.0%(-2.60)#3810.9%(-6.50)#14,177
39.Derry4.0%7.0%(-3.00)#3910.9%(-6.90)#14,444
40.Claremont4.0%7.0%(-3.00)#4010.9%(-6.90)#14,452
41.Keene3.6%7.0%(-3.40)#4110.9%(-7.30)#14,725
42.Hooksett3.5%7.0%(-3.50)#4210.9%(-7.40)#14,794
43.Somersworth3.0%7.0%(-4.00)#4310.9%(-7.90)#15,130
44.Suncook2.0%7.0%(-5.00)#4410.9%(-8.90)#15,731
45.New London1.7%7.0%(-5.30)#4510.9%(-9.20)#15,879
46.Laconia0.40%7.0%(-6.60)#4610.9%(-10.5)#16,154
47.Pinardville0.40%7.0%(-6.60)#4710.9%(-10.5)#16,161

Common Questions

What are the Top 10 Cities with the Highest Unemployment Rate Amomg Youth Under the Age of 25 in New Hampshire?
Top 10 Cities with the Highest Unemployment Rate Amomg Youth Under the Age of 25 in New Hampshire are:
#1
100.0%
#2
99.9%
#3
50.0%
#4
35.8%
#5
28.6%
#6
28.2%
#7
25.7%
#8
21.4%
#9
17.0%
#10
16.4%
What city has the Highest Unemployment Rate Amomg Youth Under the Age of 25 in New Hampshire?
Center Ossipee has the Highest Unemployment Rate Amomg Youth Under the Age of 25 in New Hampshire with 100.0%.
What is the Unemployment Rate Amomg Youth Under the Age of 25 in the State of New Hampshire?
Unemployment Rate Amomg Youth Under the Age of 25 in New Hampshire is 7.0%.
What is the Unemployment Rate Amomg Youth Under the Age of 25 in the United States?
Unemployment Rate Amomg Youth Under the Age of 25 in the United States is 10.9%.