Patterson Tract, CA Map & Demographics
Patterson Tract Map
Patterson Tract Overview
$29,408
PER CAPITA INCOME
$72,237
AVG FAMILY INCOME
$83,750
AVG HOUSEHOLD INCOME
35.2%
WAGE / INCOME GAP [ % ]
64.8¢/ $1
WAGE / INCOME GAP [ $ ]
0.38
INEQUALITY / GINI INDEX
1,645
TOTAL POPULATION
868
MALE POPULATION
777
FEMALE POPULATION
111.71
MALES / 100 FEMALES
89.52
FEMALES / 100 MALES
36.2
MEDIAN AGE
3.1
AVG FAMILY SIZE
3.1
AVG HOUSEHOLD SIZE
722
LABOR FORCE [ PEOPLE ]
56.4%
PERCENT IN LABOR FORCE
4.0%
UNEMPLOYMENT RATE
Income in Patterson Tract
Income Overview in Patterson Tract
Per Capita Income in Patterson Tract is $29,408, while median incomes of families and households are $72,237 and $83,750 respectively.
| Characteristic | Number | Measure |
| Per Capita Income | 1,645 | $29,408 |
| Median Family Income | 476 | $72,237 |
| Mean Family Income | 476 | $91,468 |
| Median Household Income | 523 | $83,750 |
| Mean Household Income | 523 | $90,531 |
| Income Deficit | 476 | $0 |
| Wage / Income Gap (%) | 1,645 | 35.21% |
| Wage / Income Gap ($) | 1,645 | 64.79¢ per $1 |
| Gini / Inequality Index | 1,645 | 0.38 |
Earnings by Sex in Patterson Tract
Average Earnings in Patterson Tract are $32,141, $35,781 for men and $23,182 for women, a difference of 35.2%.
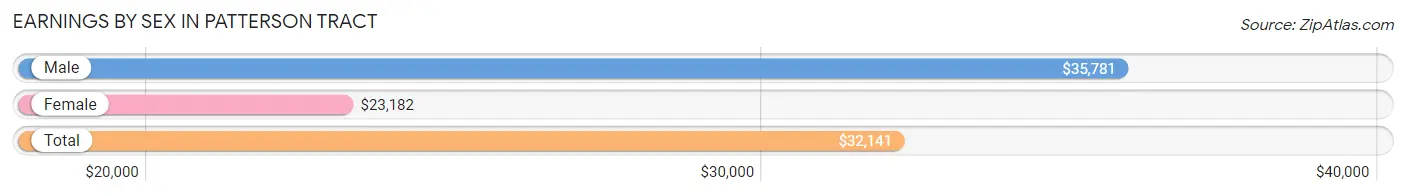
| Sex | Number | Average Earnings |
| Male | 449 (60.0%) | $35,781 |
| Female | 300 (40.1%) | $23,182 |
| Total | 749 (100.0%) | $32,141 |
Earnings by Sex by Income Bracket in Patterson Tract
The most common earnings brackets in Patterson Tract are $100,000+ for men (114 | 25.4%) and $20,000 to $22,499 for women (62 | 20.7%).
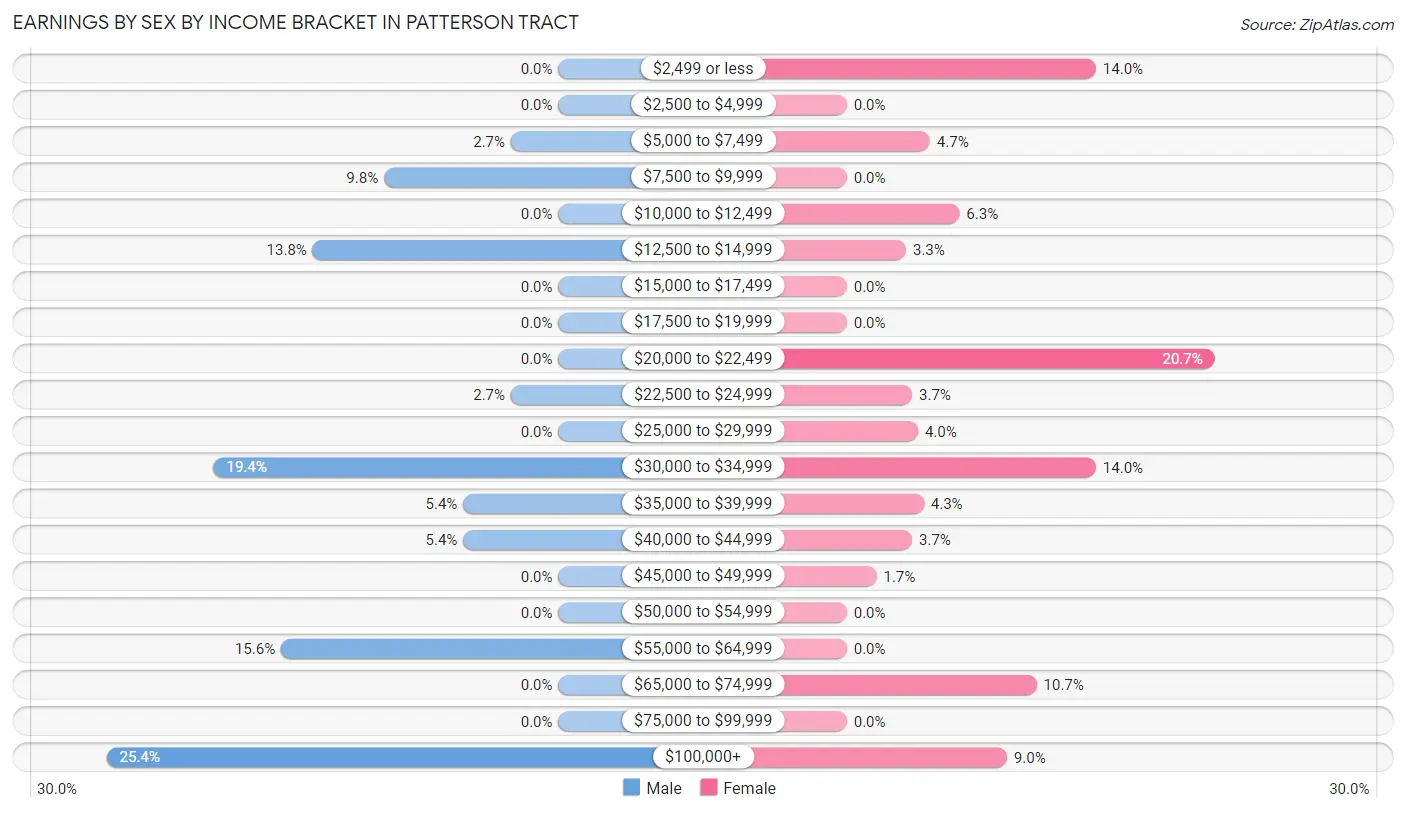
| Income | Male | Female |
| $2,499 or less | 0 (0.0%) | 42 (14.0%) |
| $2,500 to $4,999 | 0 (0.0%) | 0 (0.0%) |
| $5,000 to $7,499 | 12 (2.7%) | 14 (4.7%) |
| $7,500 to $9,999 | 44 (9.8%) | 0 (0.0%) |
| $10,000 to $12,499 | 0 (0.0%) | 19 (6.3%) |
| $12,500 to $14,999 | 62 (13.8%) | 10 (3.3%) |
| $15,000 to $17,499 | 0 (0.0%) | 0 (0.0%) |
| $17,500 to $19,999 | 0 (0.0%) | 0 (0.0%) |
| $20,000 to $22,499 | 0 (0.0%) | 62 (20.7%) |
| $22,500 to $24,999 | 12 (2.7%) | 11 (3.7%) |
| $25,000 to $29,999 | 0 (0.0%) | 12 (4.0%) |
| $30,000 to $34,999 | 87 (19.4%) | 42 (14.0%) |
| $35,000 to $39,999 | 24 (5.3%) | 13 (4.3%) |
| $40,000 to $44,999 | 24 (5.3%) | 11 (3.7%) |
| $45,000 to $49,999 | 0 (0.0%) | 5 (1.7%) |
| $50,000 to $54,999 | 0 (0.0%) | 0 (0.0%) |
| $55,000 to $64,999 | 70 (15.6%) | 0 (0.0%) |
| $65,000 to $74,999 | 0 (0.0%) | 32 (10.7%) |
| $75,000 to $99,999 | 0 (0.0%) | 0 (0.0%) |
| $100,000+ | 114 (25.4%) | 27 (9.0%) |
| Total | 449 (100.0%) | 300 (100.0%) |
Earnings by Sex by Educational Attainment in Patterson Tract
Average earnings in Patterson Tract are $36,406 for men and $23,182 for women, a difference of 36.3%. Men with an educational attainment of bachelor's degree enjoy the highest average annual earnings of $117,700, while those with high school diploma education earn the least with $9,655. Women with an educational attainment of college or associate's degree earn the most with the average annual earnings of $30,863, while those with less than high school education have the smallest earnings of $20,231.
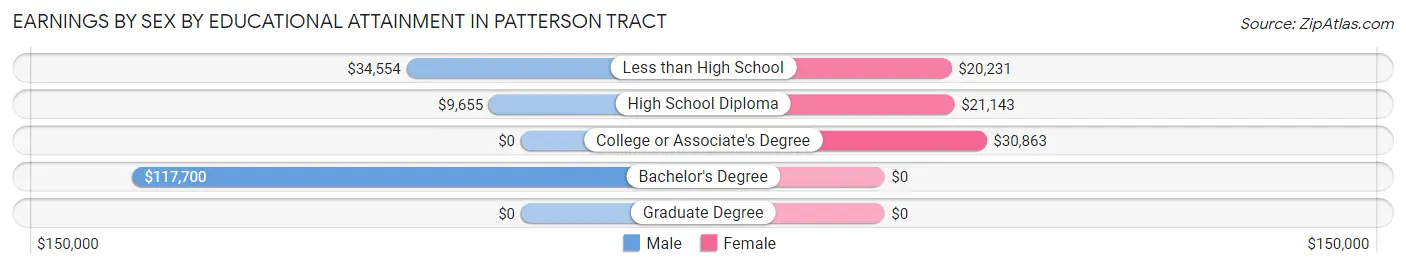
| Educational Attainment | Male Income | Female Income |
| Less than High School | $34,554 | $20,231 |
| High School Diploma | $9,655 | $21,143 |
| College or Associate's Degree | - | - |
| Bachelor's Degree | $117,700 | $0 |
| Graduate Degree | - | - |
| Total | $36,406 | $23,182 |
Family Income in Patterson Tract
Family Income Brackets in Patterson Tract
According to the Patterson Tract family income data, there are 133 families falling into the $50,000 to $74,999 income range, which is the most common income bracket and makes up 27.9% of all families. Conversely, the $15,000 to $24,999 income bracket is the least frequent group with only 5 families (1.1%) belonging to this category.
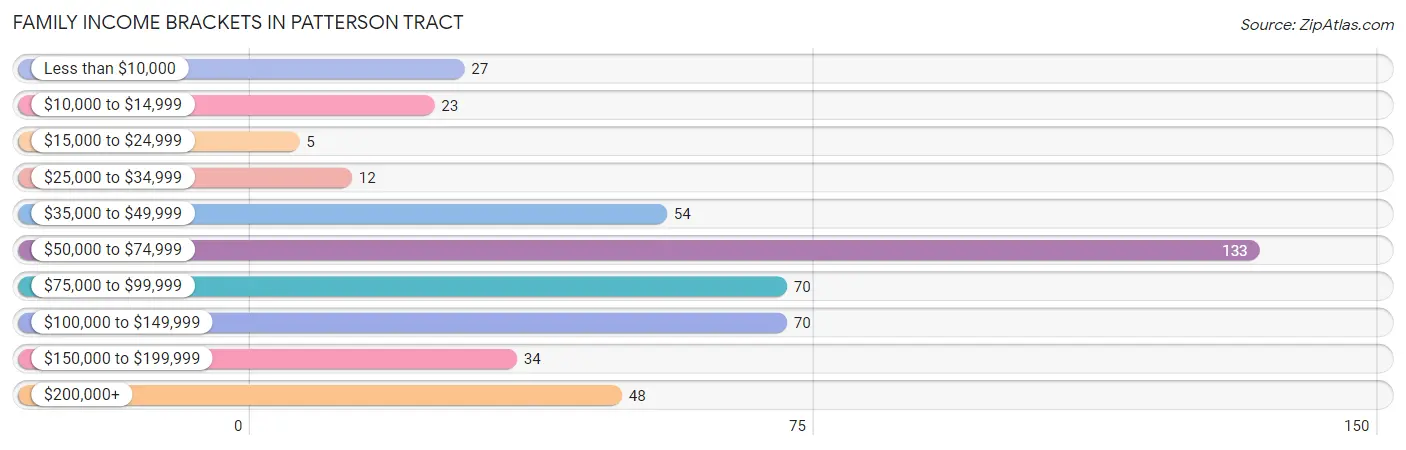
| Income Bracket | # Families | % Families |
| Less than $10,000 | 27 | 5.7% |
| $10,000 to $14,999 | 23 | 4.8% |
| $15,000 to $24,999 | 5 | 1.1% |
| $25,000 to $34,999 | 12 | 2.5% |
| $35,000 to $49,999 | 54 | 11.3% |
| $50,000 to $74,999 | 133 | 27.9% |
| $75,000 to $99,999 | 70 | 14.7% |
| $100,000 to $149,999 | 70 | 14.7% |
| $150,000 to $199,999 | 34 | 7.1% |
| $200,000+ | 48 | 10.1% |
Family Income by Famaliy Size in Patterson Tract
2-person families (155 | 32.6%) account for the highest median family income in Patterson Tract with $74,018 per family, while 2-person families (155 | 32.6%) have the highest median income of $37,009 per family member.
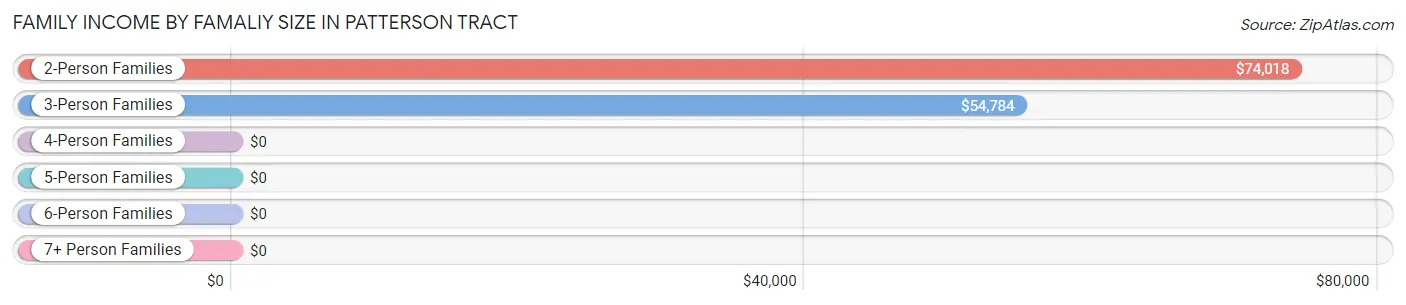
| Income Bracket | # Families | Median Income |
| 2-Person Families | 155 (32.6%) | $74,018 |
| 3-Person Families | 177 (37.2%) | $54,784 |
| 4-Person Families | 110 (23.1%) | $0 |
| 5-Person Families | 34 (7.1%) | $0 |
| 6-Person Families | 0 (0.0%) | $0 |
| 7+ Person Families | 0 (0.0%) | $0 |
| Total | 476 (100.0%) | $72,237 |
Family Income by Number of Earners in Patterson Tract
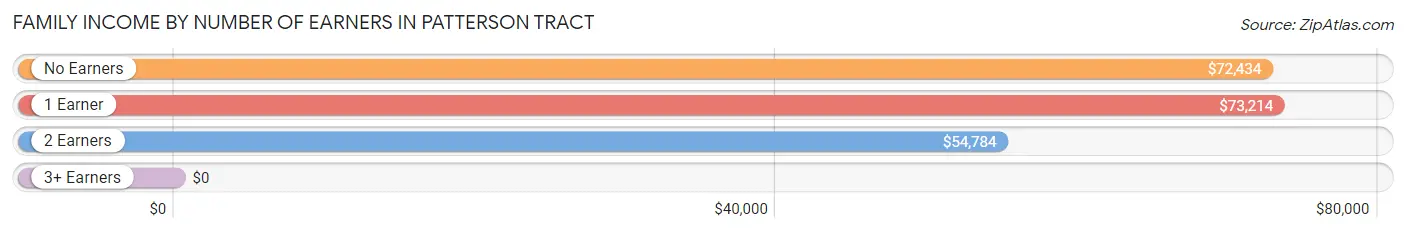
| Number of Earners | # Families | Median Income |
| No Earners | 47 (9.9%) | $72,434 |
| 1 Earner | 254 (53.4%) | $73,214 |
| 2 Earners | 155 (32.6%) | $54,784 |
| 3+ Earners | 20 (4.2%) | $0 |
| Total | 476 (100.0%) | $72,237 |
Household Income in Patterson Tract
Household Income Brackets in Patterson Tract
With 121 households falling in the category, the $75,000 to $99,999 income range is the most frequent in Patterson Tract, accounting for 23.1% of all households.
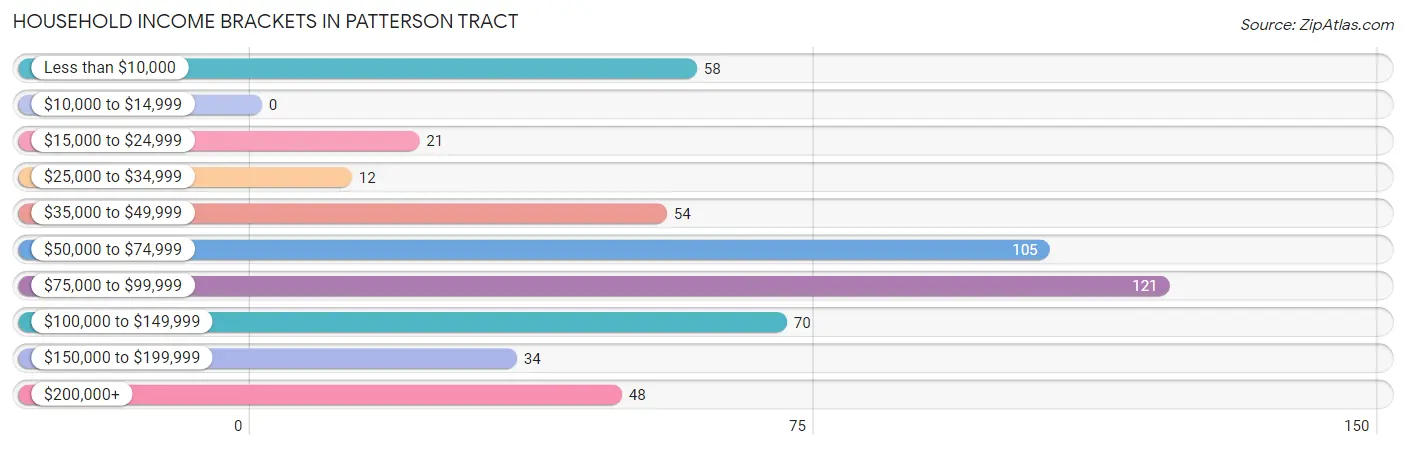
| Income Bracket | # Households | % Households |
| Less than $10,000 | 58 | 11.1% |
| $10,000 to $14,999 | 0 | 0.0% |
| $15,000 to $24,999 | 21 | 4.0% |
| $25,000 to $34,999 | 12 | 2.3% |
| $35,000 to $49,999 | 54 | 10.3% |
| $50,000 to $74,999 | 105 | 20.1% |
| $75,000 to $99,999 | 121 | 23.1% |
| $100,000 to $149,999 | 70 | 13.4% |
| $150,000 to $199,999 | 34 | 6.5% |
| $200,000+ | 48 | 9.2% |
Household Income by Householder Age in Patterson Tract
The median household income in Patterson Tract is $83,750, with the highest median household income of $94,375 found in the 25 to 44 years age bracket for the primary householder. A total of 192 households (36.7%) fall into this category.
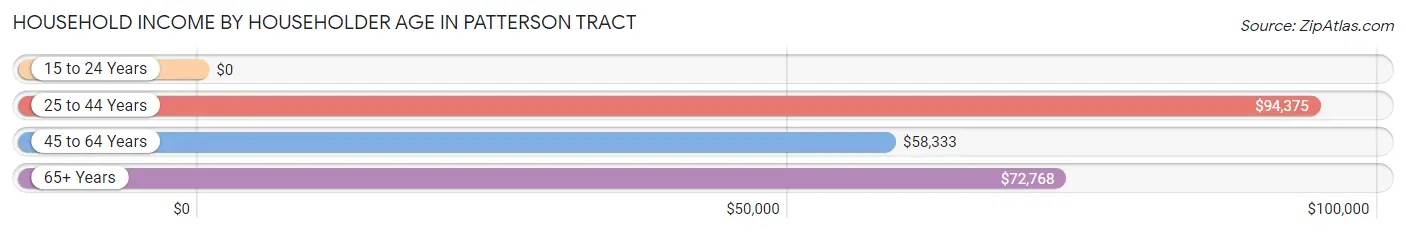
| Income Bracket | # Households | Median Income |
| 15 to 24 Years | 0 (0.0%) | $0 |
| 25 to 44 Years | 192 (36.7%) | $94,375 |
| 45 to 64 Years | 166 (31.7%) | $58,333 |
| 65+ Years | 165 (31.6%) | $72,768 |
| Total | 523 (100.0%) | $83,750 |
Poverty in Patterson Tract
Income Below Poverty by Sex and Age in Patterson Tract
With 9.5% poverty level for males and 19.6% for females among the residents of Patterson Tract, 16 and 17 year old males and 16 and 17 year old females are the most vulnerable to poverty, with 25 males (47.2%) and 25 females (100.0%) in their respective age groups living below the poverty level.
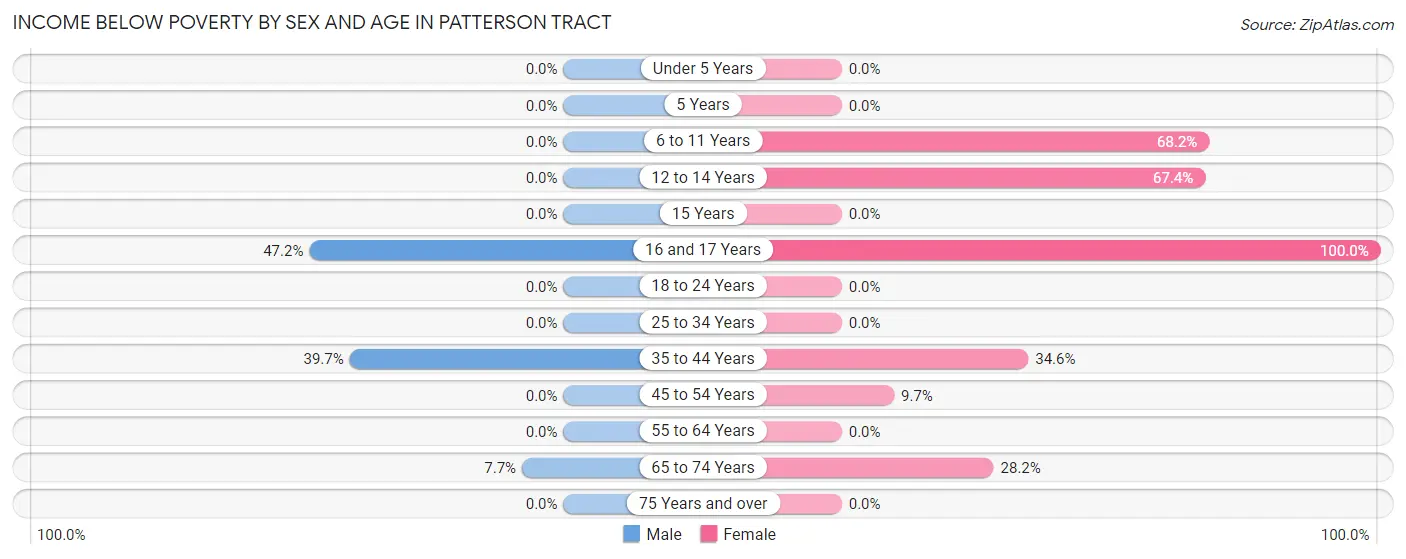
| Age Bracket | Male | Female |
| Under 5 Years | 0 (0.0%) | 0 (0.0%) |
| 5 Years | 0 (0.0%) | 0 (0.0%) |
| 6 to 11 Years | 0 (0.0%) | 30 (68.2%) |
| 12 to 14 Years | 0 (0.0%) | 29 (67.4%) |
| 15 Years | 0 (0.0%) | 0 (0.0%) |
| 16 and 17 Years | 25 (47.2%) | 25 (100.0%) |
| 18 to 24 Years | 0 (0.0%) | 0 (0.0%) |
| 25 to 34 Years | 0 (0.0%) | 0 (0.0%) |
| 35 to 44 Years | 52 (39.7%) | 27 (34.6%) |
| 45 to 54 Years | 0 (0.0%) | 10 (9.7%) |
| 55 to 64 Years | 0 (0.0%) | 0 (0.0%) |
| 65 to 74 Years | 5 (7.7%) | 31 (28.2%) |
| 75 Years and over | 0 (0.0%) | 0 (0.0%) |
| Total | 82 (9.5%) | 152 (19.6%) |
Income Above Poverty by Sex and Age in Patterson Tract
According to the poverty statistics in Patterson Tract, males aged under 5 years and females aged under 5 years are the age groups that are most secure financially, with 100.0% of males and 100.0% of females in these age groups living above the poverty line.
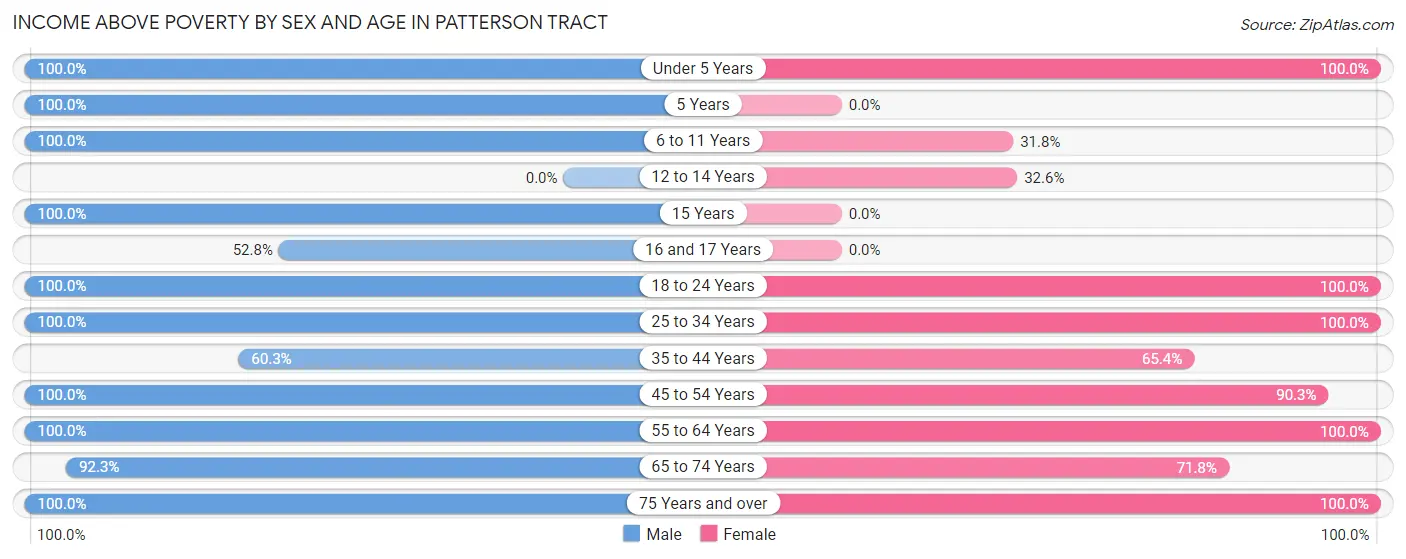
| Age Bracket | Male | Female |
| Under 5 Years | 87 (100.0%) | 71 (100.0%) |
| 5 Years | 32 (100.0%) | 0 (0.0%) |
| 6 to 11 Years | 44 (100.0%) | 14 (31.8%) |
| 12 to 14 Years | 0 (0.0%) | 14 (32.6%) |
| 15 Years | 43 (100.0%) | 0 (0.0%) |
| 16 and 17 Years | 28 (52.8%) | 0 (0.0%) |
| 18 to 24 Years | 12 (100.0%) | 25 (100.0%) |
| 25 to 34 Years | 106 (100.0%) | 146 (100.0%) |
| 35 to 44 Years | 79 (60.3%) | 51 (65.4%) |
| 45 to 54 Years | 108 (100.0%) | 93 (90.3%) |
| 55 to 64 Years | 93 (100.0%) | 101 (100.0%) |
| 65 to 74 Years | 60 (92.3%) | 79 (71.8%) |
| 75 Years and over | 94 (100.0%) | 31 (100.0%) |
| Total | 786 (90.5%) | 625 (80.4%) |
Income Below Poverty Among Married-Couple Families in Patterson Tract
The poverty statistics for married-couple families in Patterson Tract show that 7.8% or 27 of the total 348 families live below the poverty line. Families with 1 or 2 children have the highest poverty rate of 16.7%, comprising of 27 families. On the other hand, families with no children have the lowest poverty rate of 0.0%, which includes 0 families.
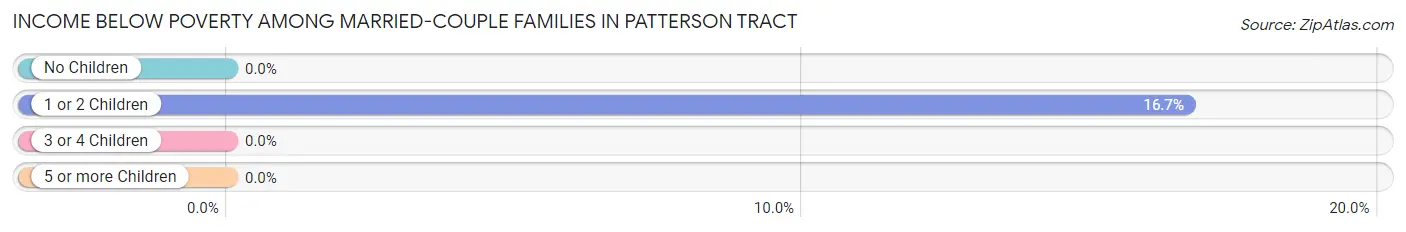
| Children | Above Poverty | Below Poverty |
| No Children | 186 (100.0%) | 0 (0.0%) |
| 1 or 2 Children | 135 (83.3%) | 27 (16.7%) |
| 3 or 4 Children | 0 (0.0%) | 0 (0.0%) |
| 5 or more Children | 0 (0.0%) | 0 (0.0%) |
| Total | 321 (92.2%) | 27 (7.8%) |
Income Below Poverty Among Single-Parent Households in Patterson Tract
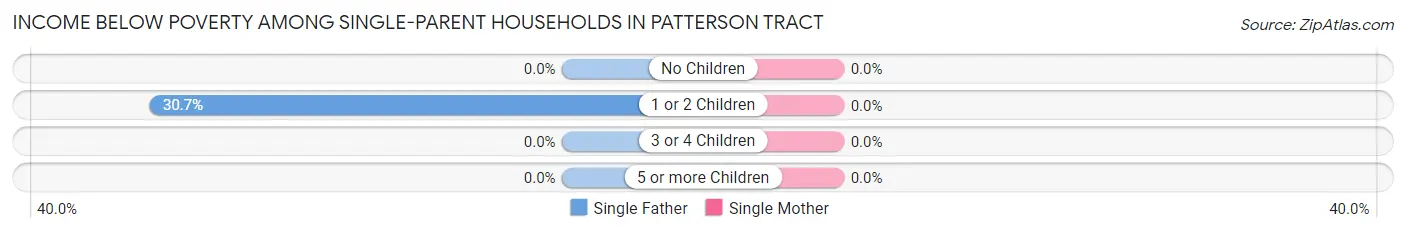
| Children | Single Father | Single Mother |
| No Children | 0 (0.0%) | 0 (0.0%) |
| 1 or 2 Children | 23 (30.7%) | 0 (0.0%) |
| 3 or 4 Children | 0 (0.0%) | 0 (0.0%) |
| 5 or more Children | 0 (0.0%) | 0 (0.0%) |
| Total | 23 (25.6%) | 0 (0.0%) |
Income Below Poverty Among Married-Couple vs Single-Parent Households in Patterson Tract
The poverty data for Patterson Tract shows that 27 of the married-couple family households (7.8%) and 23 of the single-parent households (18.0%) are living below the poverty level. Within the married-couple family households, those with 1 or 2 children have the highest poverty rate, with 27 households (16.7%) falling below the poverty line. Among the single-parent households, those with 1 or 2 children have the highest poverty rate, with 23 household (22.3%) living below poverty.
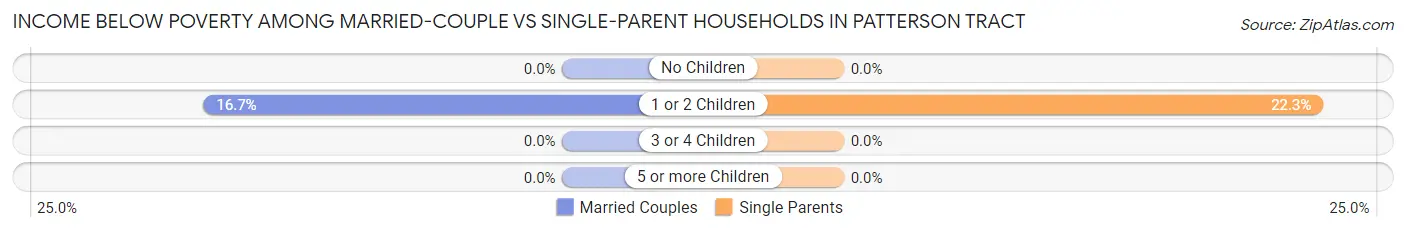
| Children | Married-Couple Families | Single-Parent Households |
| No Children | 0 (0.0%) | 0 (0.0%) |
| 1 or 2 Children | 27 (16.7%) | 23 (22.3%) |
| 3 or 4 Children | 0 (0.0%) | 0 (0.0%) |
| 5 or more Children | 0 (0.0%) | 0 (0.0%) |
| Total | 27 (7.8%) | 23 (18.0%) |
Race in Patterson Tract
The most populous races in Patterson Tract are Hispanic or Latino (1,409 | 85.7%), White / Caucasian (748 | 45.5%), and Some other Race (534 | 32.5%).
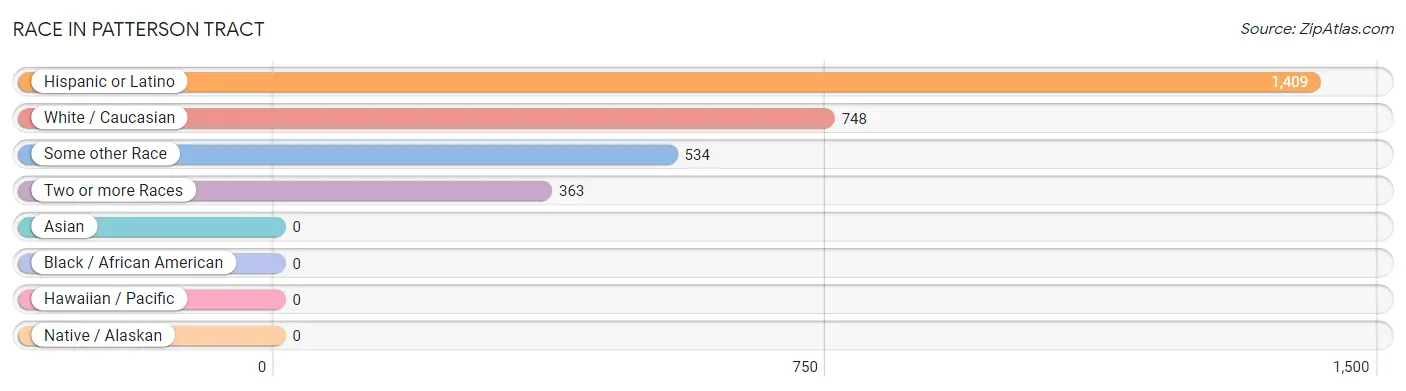
| Race | # Population | % Population |
| Asian | 0 | 0.0% |
| Black / African American | 0 | 0.0% |
| Hawaiian / Pacific | 0 | 0.0% |
| Hispanic or Latino | 1,409 | 85.7% |
| Native / Alaskan | 0 | 0.0% |
| White / Caucasian | 748 | 45.5% |
| Two or more Races | 363 | 22.1% |
| Some other Race | 534 | 32.5% |
| Total | 1,645 | 100.0% |
Ancestry in Patterson Tract
The most populous ancestries reported in Patterson Tract are Mexican (1,327 | 80.7%), English (141 | 8.6%), Colombian (46 | 2.8%), South American (46 | 2.8%), and Mexican American Indian (39 | 2.4%), together accounting for 97.2% of all Patterson Tract residents.
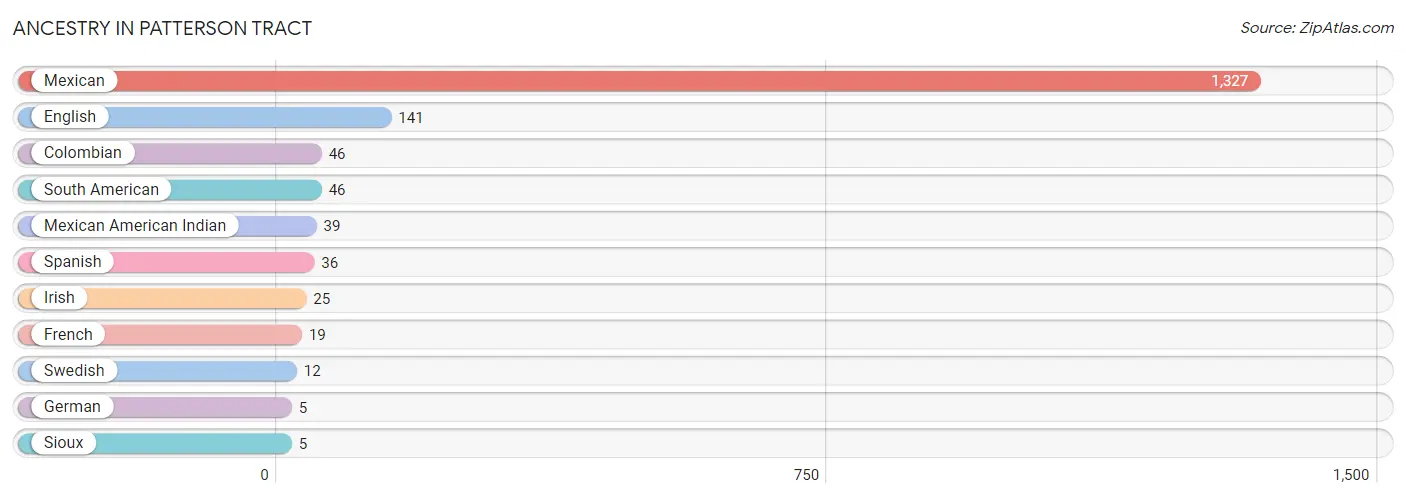
| Ancestry | # Population | % Population |
| Colombian | 46 | 2.8% |
| English | 141 | 8.6% |
| French | 19 | 1.2% |
| German | 5 | 0.3% |
| Irish | 25 | 1.5% |
| Mexican | 1,327 | 80.7% |
| Mexican American Indian | 39 | 2.4% |
| Sioux | 5 | 0.3% |
| South American | 46 | 2.8% |
| Spanish | 36 | 2.2% |
| Swedish | 12 | 0.7% | View All 11 Rows |
Immigrants in Patterson Tract
The most numerous immigrant groups reported in Patterson Tract came from Central America (339 | 20.6%), Latin America (339 | 20.6%), and Mexico (339 | 20.6%), together accounting for 61.8% of all Patterson Tract residents.
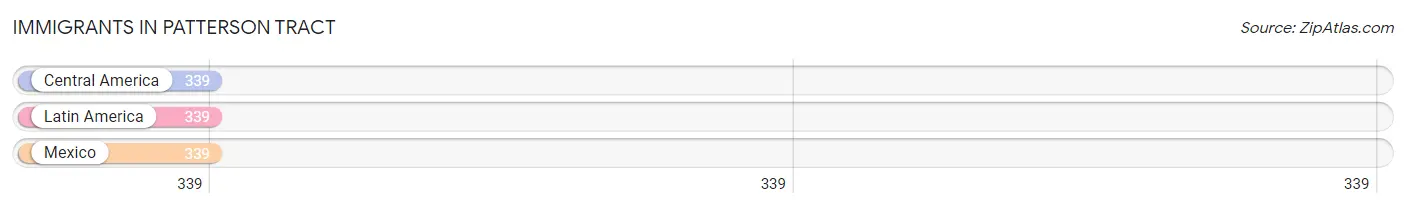
| Immigration Origin | # Population | % Population |
| Central America | 339 | 20.6% |
| Latin America | 339 | 20.6% |
| Mexico | 339 | 20.6% | View All 3 Rows |
Sex and Age in Patterson Tract
Sex and Age in Patterson Tract
The most populous age groups in Patterson Tract are 15 to 19 Years (96 | 11.1%) for men and 10 to 14 Years (87 | 11.2%) for women.
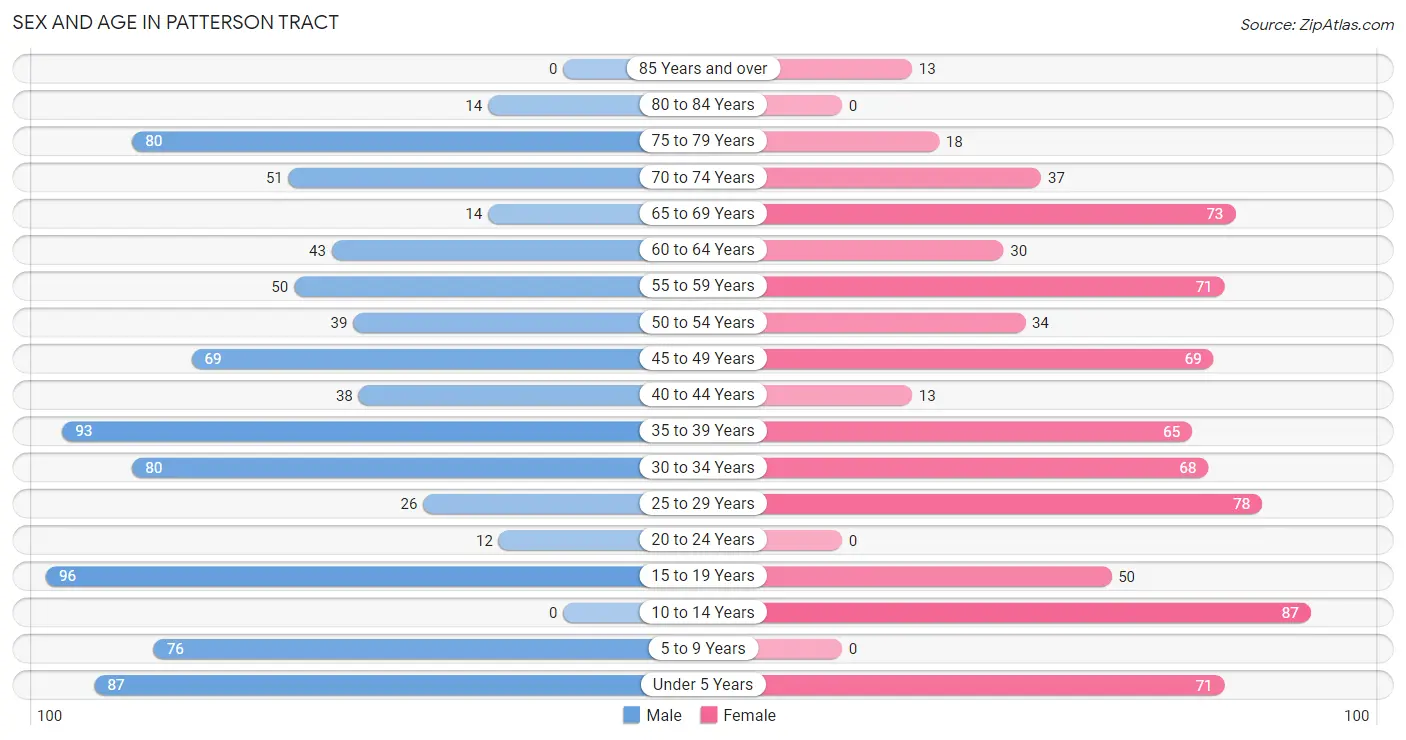
| Age Bracket | Male | Female |
| Under 5 Years | 87 (10.0%) | 71 (9.1%) |
| 5 to 9 Years | 76 (8.8%) | 0 (0.0%) |
| 10 to 14 Years | 0 (0.0%) | 87 (11.2%) |
| 15 to 19 Years | 96 (11.1%) | 50 (6.4%) |
| 20 to 24 Years | 12 (1.4%) | 0 (0.0%) |
| 25 to 29 Years | 26 (3.0%) | 78 (10.0%) |
| 30 to 34 Years | 80 (9.2%) | 68 (8.7%) |
| 35 to 39 Years | 93 (10.7%) | 65 (8.4%) |
| 40 to 44 Years | 38 (4.4%) | 13 (1.7%) |
| 45 to 49 Years | 69 (8.0%) | 69 (8.9%) |
| 50 to 54 Years | 39 (4.5%) | 34 (4.4%) |
| 55 to 59 Years | 50 (5.8%) | 71 (9.1%) |
| 60 to 64 Years | 43 (5.0%) | 30 (3.9%) |
| 65 to 69 Years | 14 (1.6%) | 73 (9.4%) |
| 70 to 74 Years | 51 (5.9%) | 37 (4.8%) |
| 75 to 79 Years | 80 (9.2%) | 18 (2.3%) |
| 80 to 84 Years | 14 (1.6%) | 0 (0.0%) |
| 85 Years and over | 0 (0.0%) | 13 (1.7%) |
| Total | 868 (100.0%) | 777 (100.0%) |
Families and Households in Patterson Tract
Median Family Size in Patterson Tract
The median family size in Patterson Tract is 3.11 persons per family, with single female/mother families (38 | 8.0%) accounting for the largest median family size of 3.45 persons per family. On the other hand, single male/father families (90 | 18.9%) represent the smallest median family size with 3.00 persons per family.
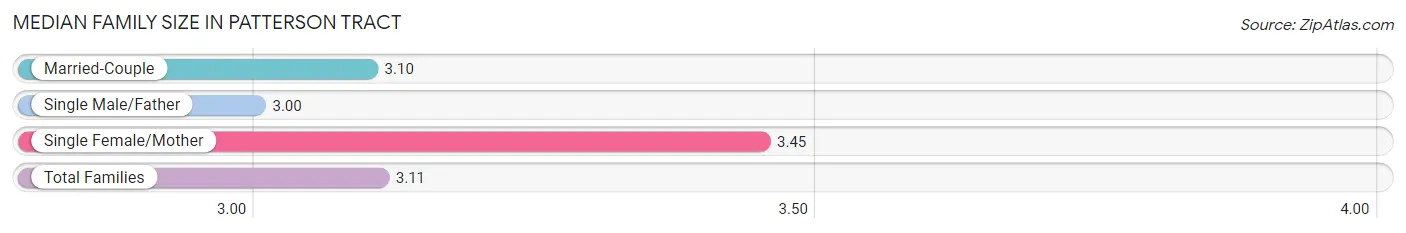
| Family Type | # Families | Family Size |
| Married-Couple | 348 (73.1%) | 3.10 |
| Single Male/Father | 90 (18.9%) | 3.00 |
| Single Female/Mother | 38 (8.0%) | 3.45 |
| Total Families | 476 (100.0%) | 3.11 |
Median Household Size in Patterson Tract
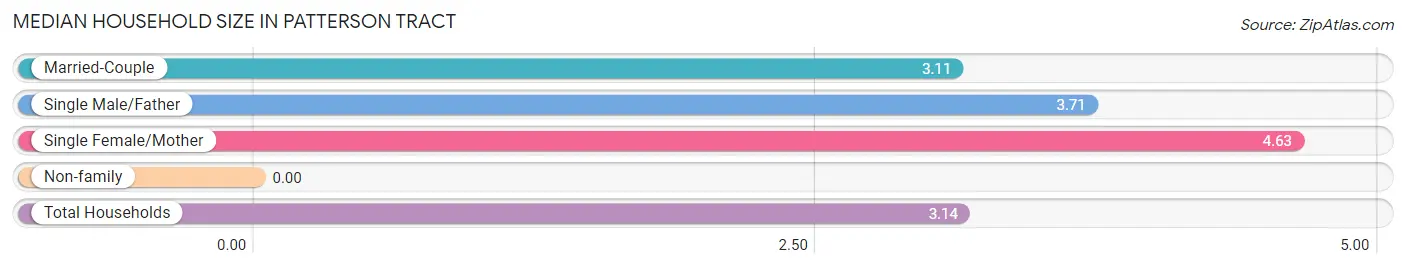
| Household Type | # Households | Household Size |
| Married-Couple | 348 (66.5%) | 3.11 |
| Single Male/Father | 90 (17.2%) | 3.71 |
| Single Female/Mother | 38 (7.3%) | 4.63 |
| Non-family | 47 (9.0%) | - |
| Total Households | 523 (100.0%) | 3.14 |
Household Size by Marriage Status in Patterson Tract
Out of a total of 523 households in Patterson Tract, 476 (91.0%) are family households, while 47 (9.0%) are nonfamily households. The most numerous type of family households are 4-person households, comprising 195, and the most common type of nonfamily households are 1-person households, comprising 47.
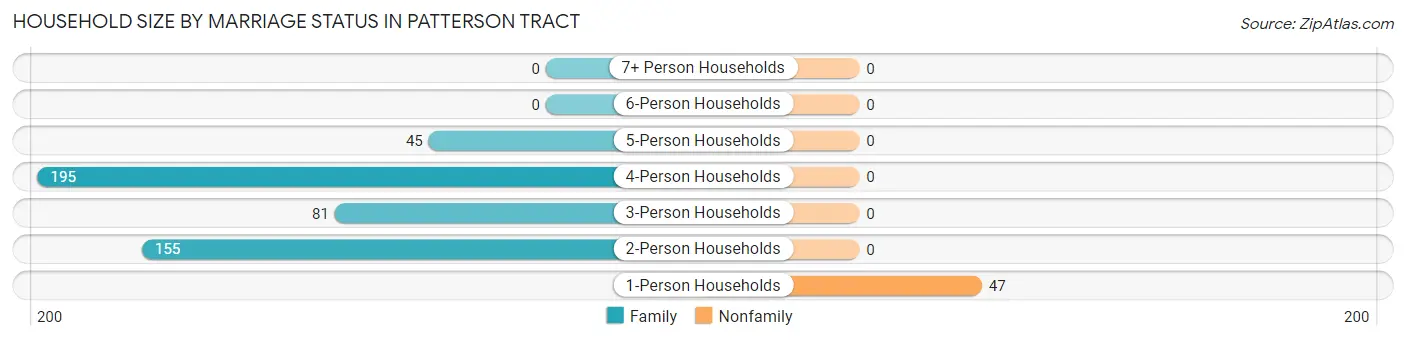
| Household Size | Family Households | Nonfamily Households |
| 1-Person Households | - | 47 (9.0%) |
| 2-Person Households | 155 (29.6%) | 0 (0.0%) |
| 3-Person Households | 81 (15.5%) | 0 (0.0%) |
| 4-Person Households | 195 (37.3%) | 0 (0.0%) |
| 5-Person Households | 45 (8.6%) | 0 (0.0%) |
| 6-Person Households | 0 (0.0%) | 0 (0.0%) |
| 7+ Person Households | 0 (0.0%) | 0 (0.0%) |
| Total | 476 (91.0%) | 47 (9.0%) |
Female Fertility in Patterson Tract
Fertility by Age in Patterson Tract
Average fertility rate in Patterson Tract is 31.0 births per 1,000 women. Women in the age bracket of 35 to 50 years have the highest fertility rate with 70.0 births per 1,000 women. Women in the age bracket of 35 to 50 years acount for 100.0% of all women with births.
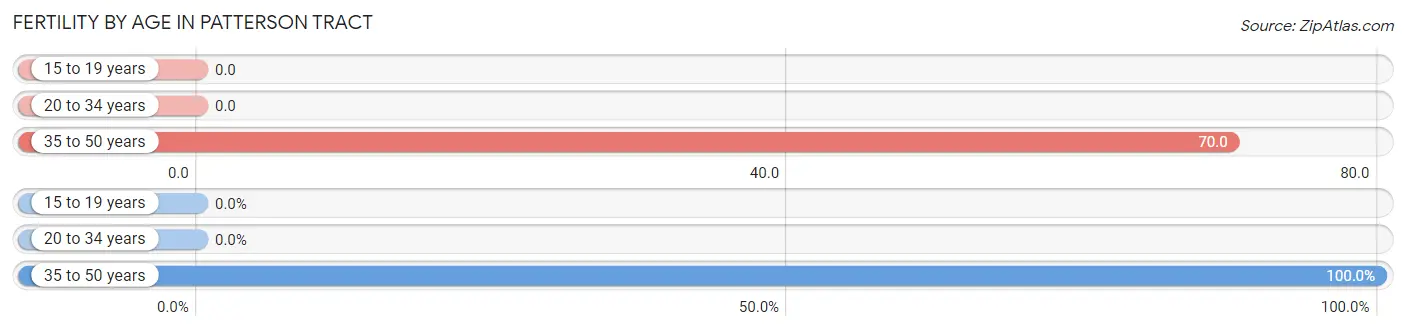
| Age Bracket | Women with Births | Births / 1,000 Women |
| 15 to 19 years | 0 (0.0%) | 0.0 |
| 20 to 34 years | 0 (0.0%) | 0.0 |
| 35 to 50 years | 11 (100.0%) | 70.0 |
| Total | 11 (100.0%) | 31.0 |
Fertility by Age by Marriage Status in Patterson Tract
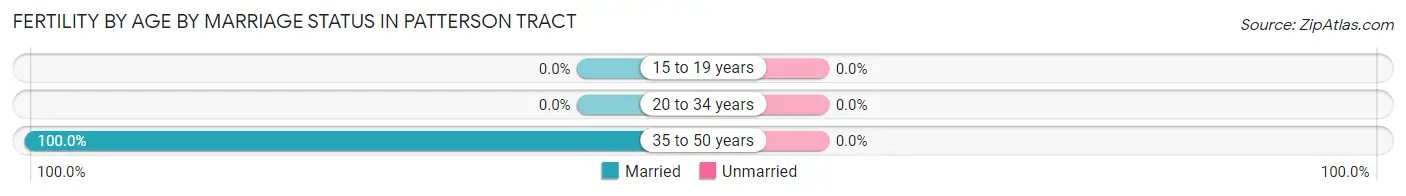
| Age Bracket | Married | Unmarried |
| 15 to 19 years | 0 (0.0%) | 0 (0.0%) |
| 20 to 34 years | 0 (0.0%) | 0 (0.0%) |
| 35 to 50 years | 11 (100.0%) | 0 (0.0%) |
| Total | 11 (100.0%) | 0 (0.0%) |
Fertility by Education in Patterson Tract
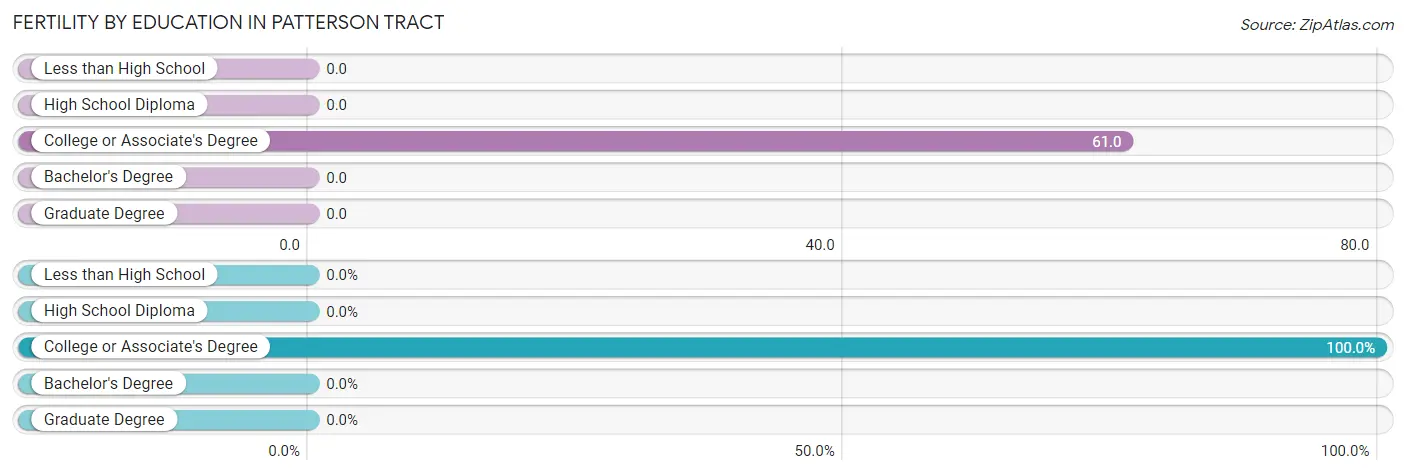
| Educational Attainment | Women with Births | Births / 1,000 Women |
| Less than High School | 0 (0.0%) | 0.0 |
| High School Diploma | 0 (0.0%) | 0.0 |
| College or Associate's Degree | 11 (100.0%) | 61.0 |
| Bachelor's Degree | 0 (0.0%) | 0.0 |
| Graduate Degree | 0 (0.0%) | 0.0 |
| Total | 11 (100.0%) | 31.0 |
Fertility by Education by Marriage Status in Patterson Tract
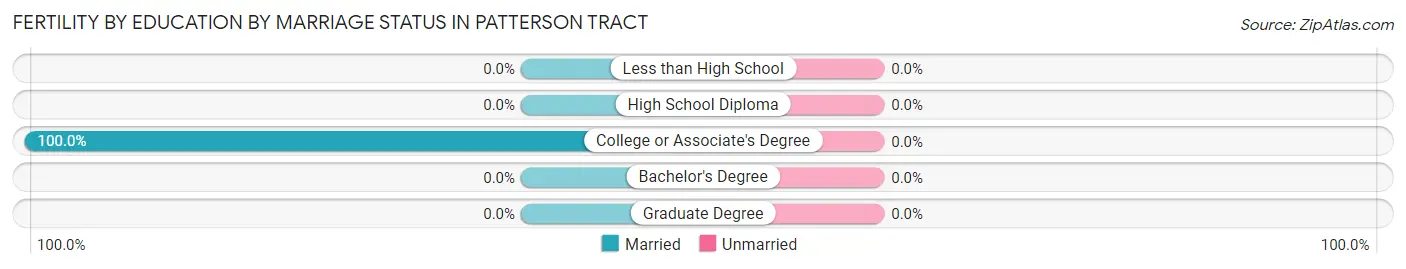
| Educational Attainment | Married | Unmarried |
| Less than High School | 0 (0.0%) | 0 (0.0%) |
| High School Diploma | 0 (0.0%) | 0 (0.0%) |
| College or Associate's Degree | 11 (100.0%) | 0 (0.0%) |
| Bachelor's Degree | 0 (0.0%) | 0 (0.0%) |
| Graduate Degree | 0 (0.0%) | 0 (0.0%) |
| Total | 11 (100.0%) | 0 (0.0%) |
Employment Characteristics in Patterson Tract
Employment by Class of Employer in Patterson Tract
Among the 666 employed individuals in Patterson Tract, private company employees (441 | 66.2%), not-for-profit organizations (91 | 13.7%), and local government employees (65 | 9.8%) make up the most common classes of employment.
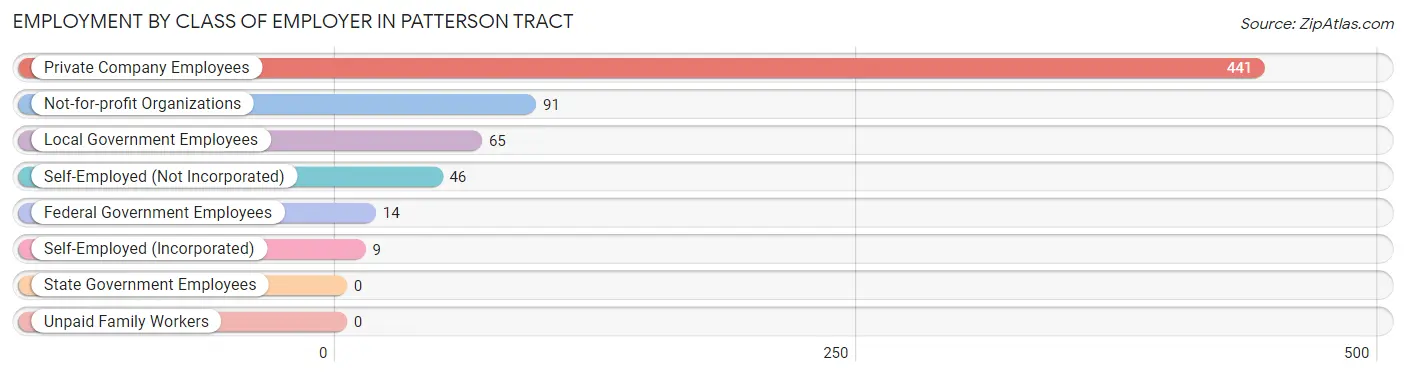
| Employer Class | # Employees | % Employees |
| Private Company Employees | 441 | 66.2% |
| Self-Employed (Incorporated) | 9 | 1.3% |
| Self-Employed (Not Incorporated) | 46 | 6.9% |
| Not-for-profit Organizations | 91 | 13.7% |
| Local Government Employees | 65 | 9.8% |
| State Government Employees | 0 | 0.0% |
| Federal Government Employees | 14 | 2.1% |
| Unpaid Family Workers | 0 | 0.0% |
| Total | 666 | 100.0% |
Employment Status by Age in Patterson Tract
According to the labor force statistics for Patterson Tract, out of the total population over 16 years of age (1,281), 56.4% or 722 individuals are in the labor force, with 4.0% or 29 of them unemployed. The age group with the highest labor force participation rate is 20 to 24 years, with 100.0% or 12 individuals in the labor force. Within the labor force, the 16 to 19 years age range has the highest percentage of unemployed individuals, with 100.0% or 14 of them being unemployed.
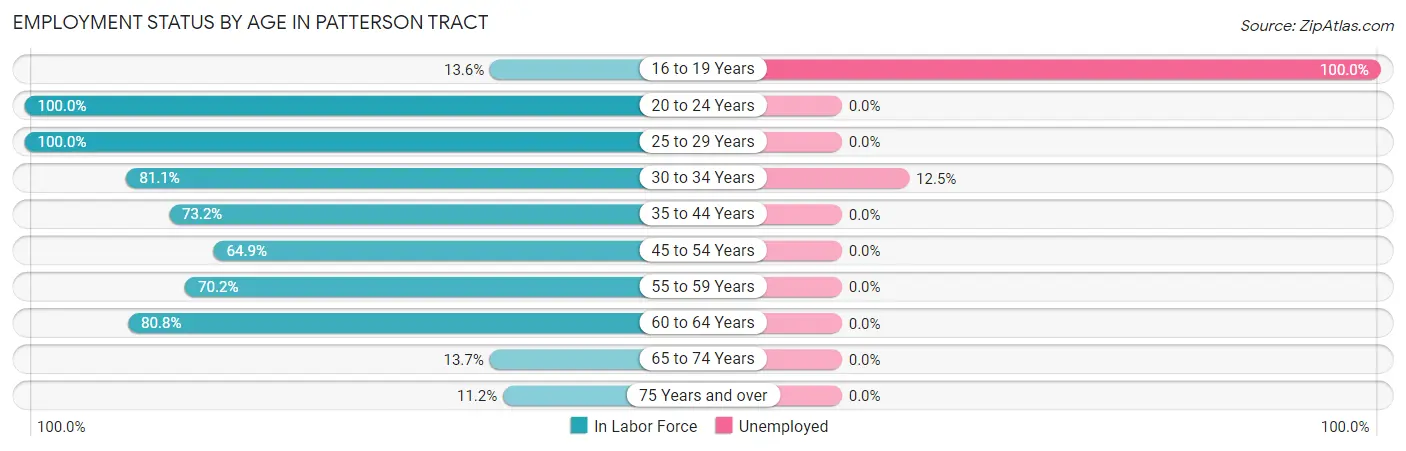
| Age Bracket | In Labor Force | Unemployed |
| 16 to 19 Years | 14 (13.6%) | 14 (100.0%) |
| 20 to 24 Years | 12 (100.0%) | 0 (0.0%) |
| 25 to 29 Years | 104 (100.0%) | 0 (0.0%) |
| 30 to 34 Years | 120 (81.1%) | 15 (12.5%) |
| 35 to 44 Years | 153 (73.2%) | 0 (0.0%) |
| 45 to 54 Years | 137 (64.9%) | 0 (0.0%) |
| 55 to 59 Years | 85 (70.2%) | 0 (0.0%) |
| 60 to 64 Years | 59 (80.8%) | 0 (0.0%) |
| 65 to 74 Years | 24 (13.7%) | 0 (0.0%) |
| 75 Years and over | 14 (11.2%) | 0 (0.0%) |
| Total | 722 (56.4%) | 29 (4.0%) |
Employment Status by Educational Attainment in Patterson Tract
According to labor force statistics for Patterson Tract, 76.0% of individuals (658) out of the total population between 25 and 64 years of age (866) are in the labor force, with 2.3% or 15 of them being unemployed. The group with the highest labor force participation rate are those with the educational attainment of bachelor's degree or higher, with 100.0% or 126 individuals in the labor force. Within the labor force, individuals with college / associate degree education have the highest percentage of unemployment, with 5.6% or 15 of them being unemployed.
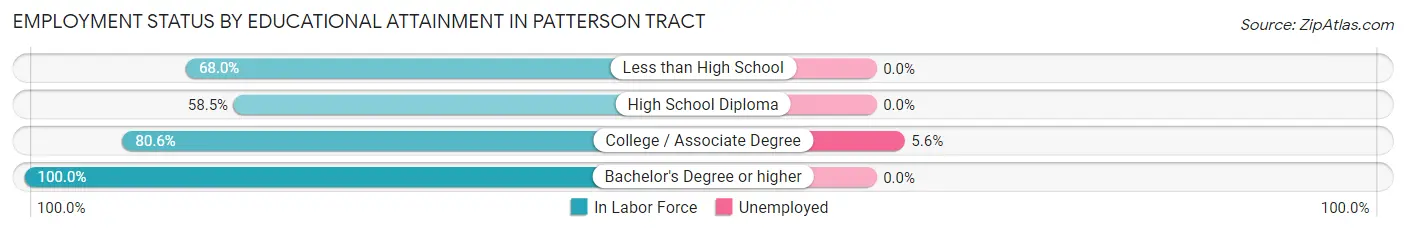
| Educational Attainment | In Labor Force | Unemployed |
| Less than High School | 187 (68.0%) | 0 (0.0%) |
| High School Diploma | 79 (58.5%) | 0 (0.0%) |
| College / Associate Degree | 266 (80.6%) | 18 (5.6%) |
| Bachelor's Degree or higher | 126 (100.0%) | 0 (0.0%) |
| Total | 658 (76.0%) | 20 (2.3%) |
Employment Occupations by Sex in Patterson Tract
Management, Business, Science and Arts Occupations
The most common Management, Business, Science and Arts occupations in Patterson Tract are Management (133 | 19.2%), Community & Social Service (46 | 6.6%), Arts, Media & Entertainment (46 | 6.6%), Health Diagnosing & Treating (40 | 5.8%), and Health Technologists (40 | 5.8%).
Management, Business, Science and Arts Occupations by Sex
Within the Management, Business, Science and Arts occupations in Patterson Tract, the most male-oriented occupations are Business & Financial (100.0%), Community & Social Service (100.0%), and Arts, Media & Entertainment (100.0%), while the most female-oriented occupations are Health Diagnosing & Treating (67.5%), Health Technologists (67.5%), and Management (9.8%).
| Occupation | Male | Female |
| Management | 120 (90.2%) | 13 (9.8%) |
| Business & Financial | 12 (100.0%) | 0 (0.0%) |
| Computers, Engineering & Science | 0 (0.0%) | 0 (0.0%) |
| Computers & Mathematics | 0 (0.0%) | 0 (0.0%) |
| Architecture & Engineering | 0 (0.0%) | 0 (0.0%) |
| Life, Physical & Social Science | 0 (0.0%) | 0 (0.0%) |
| Community & Social Service | 46 (100.0%) | 0 (0.0%) |
| Education, Arts & Media | 0 (0.0%) | 0 (0.0%) |
| Legal Services & Support | 0 (0.0%) | 0 (0.0%) |
| Education Instruction & Library | 0 (0.0%) | 0 (0.0%) |
| Arts, Media & Entertainment | 46 (100.0%) | 0 (0.0%) |
| Health Diagnosing & Treating | 13 (32.5%) | 27 (67.5%) |
| Health Technologists | 13 (32.5%) | 27 (67.5%) |
| Total (Category) | 191 (82.7%) | 40 (17.3%) |
| Total (Overall) | 393 (56.7%) | 300 (43.3%) |
Services Occupations
The most common Services occupations in Patterson Tract are Healthcare Support (139 | 20.1%), Personal Care & Service (19 | 2.7%), Security & Protection (13 | 1.9%), and Law Enforcement (13 | 1.9%).
Services Occupations by Sex
Within the Services occupations in Patterson Tract, the most male-oriented occupations are Security & Protection (100.0%), and Law Enforcement (100.0%), while the most female-oriented occupations are Healthcare Support (100.0%), and Personal Care & Service (100.0%).
| Occupation | Male | Female |
| Healthcare Support | 0 (0.0%) | 139 (100.0%) |
| Security & Protection | 13 (100.0%) | 0 (0.0%) |
| Firefighting & Prevention | 0 (0.0%) | 0 (0.0%) |
| Law Enforcement | 13 (100.0%) | 0 (0.0%) |
| Food Preparation & Serving | 0 (0.0%) | 0 (0.0%) |
| Cleaning & Maintenance | 0 (0.0%) | 0 (0.0%) |
| Personal Care & Service | 0 (0.0%) | 19 (100.0%) |
| Total (Category) | 13 (7.6%) | 158 (92.4%) |
| Total (Overall) | 393 (56.7%) | 300 (43.3%) |
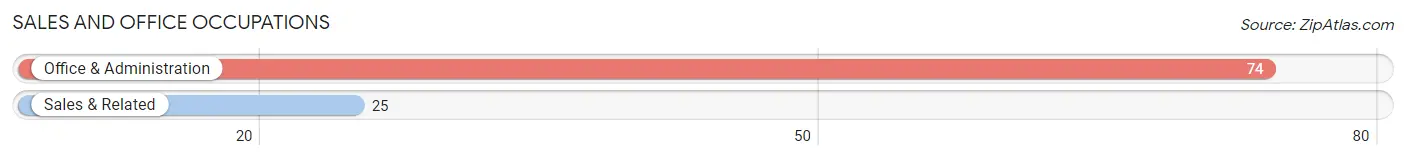
Sales and Office Occupations
The most common Sales and Office occupations in Patterson Tract are Office & Administration (74 | 10.7%), and Sales & Related (25 | 3.6%).
Sales and Office Occupations by Sex
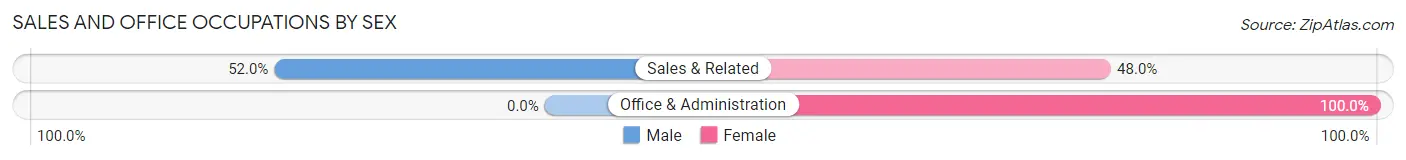
| Occupation | Male | Female |
| Sales & Related | 13 (52.0%) | 12 (48.0%) |
| Office & Administration | 0 (0.0%) | 74 (100.0%) |
| Total (Category) | 13 (13.1%) | 86 (86.9%) |
| Total (Overall) | 393 (56.7%) | 300 (43.3%) |
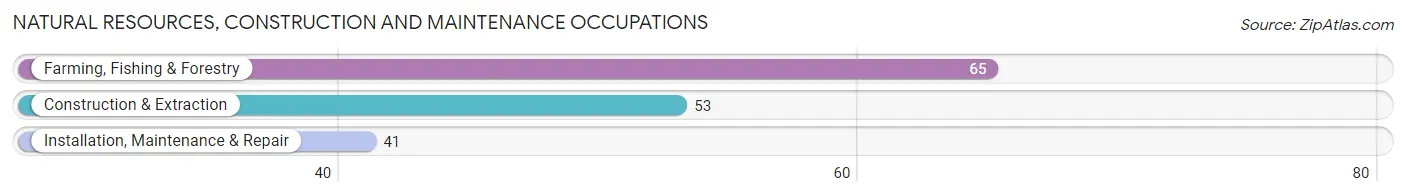
Natural Resources, Construction and Maintenance Occupations
The most common Natural Resources, Construction and Maintenance occupations in Patterson Tract are Farming, Fishing & Forestry (65 | 9.4%), Construction & Extraction (53 | 7.6%), and Installation, Maintenance & Repair (41 | 5.9%).
Natural Resources, Construction and Maintenance Occupations by Sex
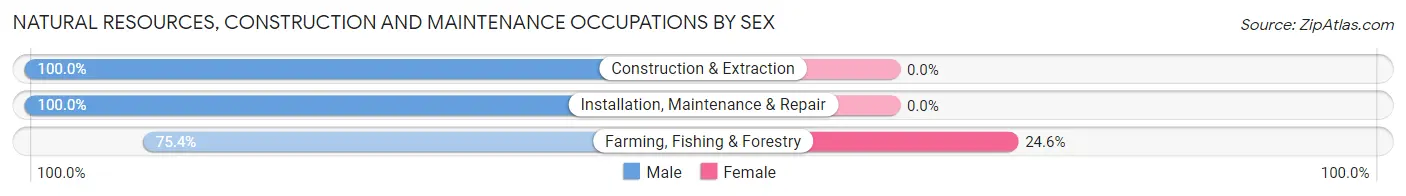
| Occupation | Male | Female |
| Farming, Fishing & Forestry | 49 (75.4%) | 16 (24.6%) |
| Construction & Extraction | 53 (100.0%) | 0 (0.0%) |
| Installation, Maintenance & Repair | 41 (100.0%) | 0 (0.0%) |
| Total (Category) | 143 (89.9%) | 16 (10.1%) |
| Total (Overall) | 393 (56.7%) | 300 (43.3%) |
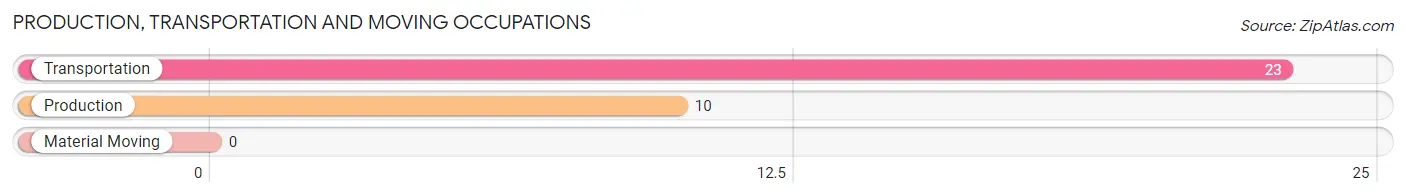
Production, Transportation and Moving Occupations
The most common Production, Transportation and Moving occupations in Patterson Tract are Transportation (23 | 3.3%), and Production (10 | 1.4%).
Production, Transportation and Moving Occupations by Sex
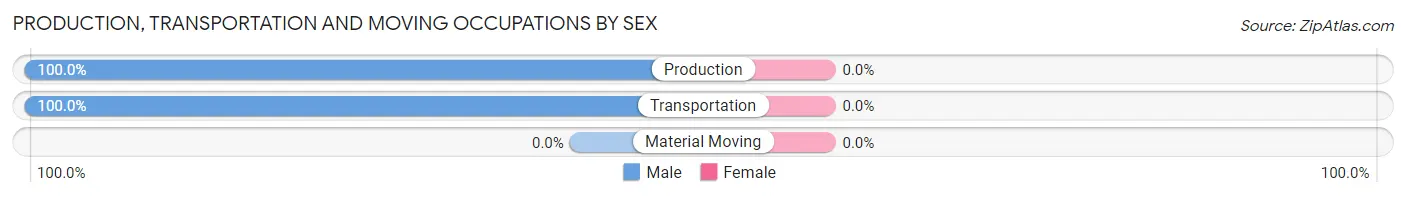
| Occupation | Male | Female |
| Production | 10 (100.0%) | 0 (0.0%) |
| Transportation | 23 (100.0%) | 0 (0.0%) |
| Material Moving | 0 (0.0%) | 0 (0.0%) |
| Total (Category) | 33 (100.0%) | 0 (0.0%) |
| Total (Overall) | 393 (56.7%) | 300 (43.3%) |
Employment Industries by Sex in Patterson Tract
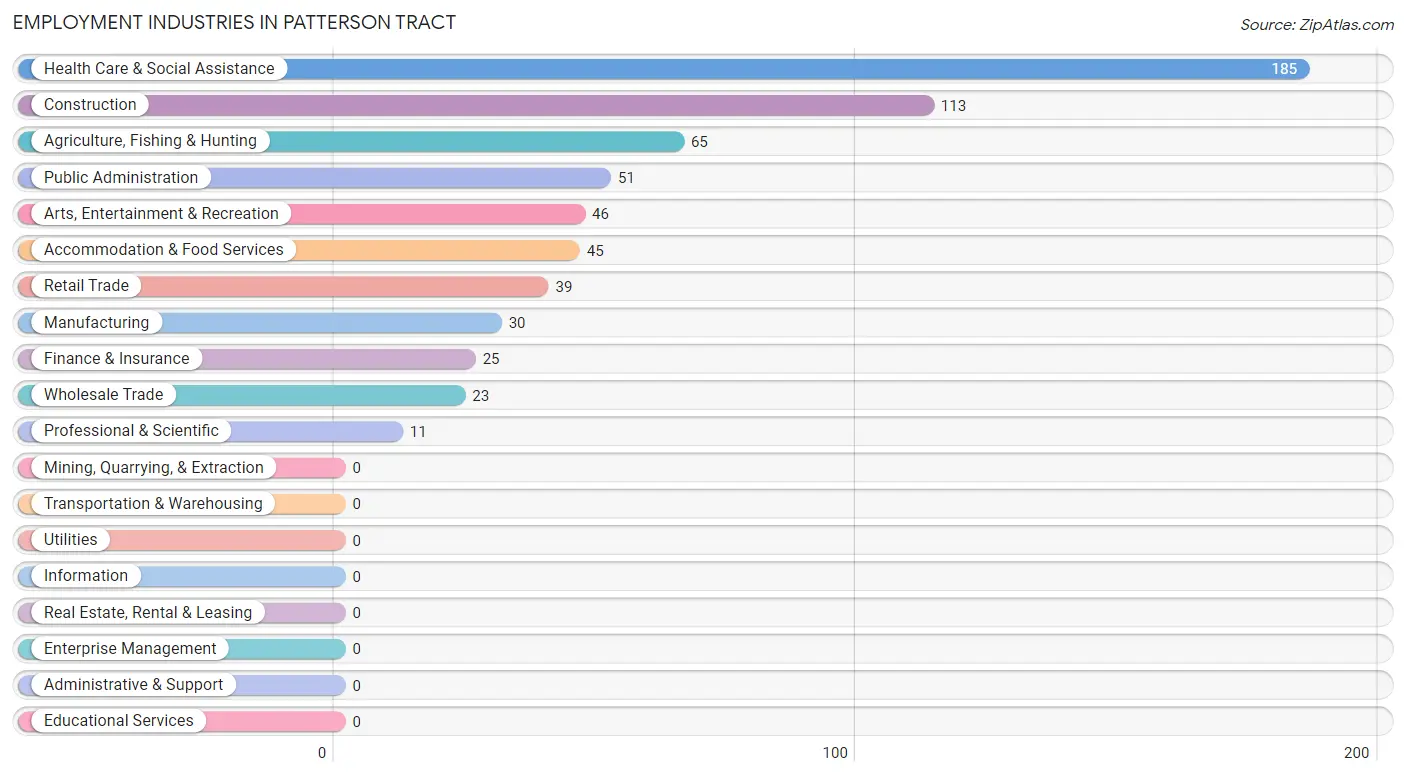
Employment Industries in Patterson Tract
The major employment industries in Patterson Tract include Health Care & Social Assistance (185 | 26.7%), Construction (113 | 16.3%), Agriculture, Fishing & Hunting (65 | 9.4%), Public Administration (51 | 7.4%), and Arts, Entertainment & Recreation (46 | 6.6%).
Employment Industries by Sex in Patterson Tract
The Patterson Tract industries that see more men than women are Manufacturing (100.0%), Wholesale Trade (100.0%), and Arts, Entertainment & Recreation (100.0%), whereas the industries that tend to have a higher number of women are Professional & Scientific (100.0%), Health Care & Social Assistance (93.0%), and Retail Trade (66.7%).
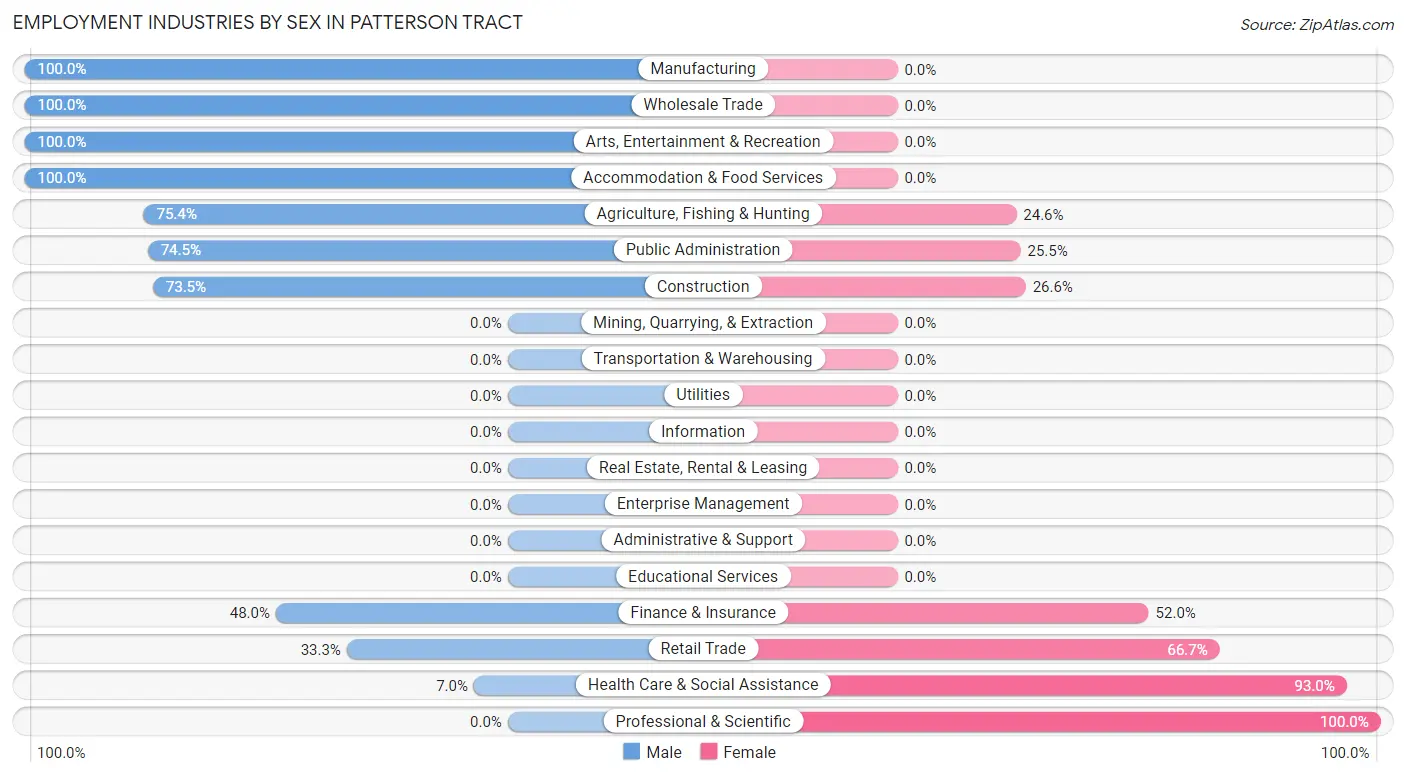
| Industry | Male | Female |
| Agriculture, Fishing & Hunting | 49 (75.4%) | 16 (24.6%) |
| Mining, Quarrying, & Extraction | 0 (0.0%) | 0 (0.0%) |
| Construction | 83 (73.5%) | 30 (26.6%) |
| Manufacturing | 30 (100.0%) | 0 (0.0%) |
| Wholesale Trade | 23 (100.0%) | 0 (0.0%) |
| Retail Trade | 13 (33.3%) | 26 (66.7%) |
| Transportation & Warehousing | 0 (0.0%) | 0 (0.0%) |
| Utilities | 0 (0.0%) | 0 (0.0%) |
| Information | 0 (0.0%) | 0 (0.0%) |
| Finance & Insurance | 12 (48.0%) | 13 (52.0%) |
| Real Estate, Rental & Leasing | 0 (0.0%) | 0 (0.0%) |
| Professional & Scientific | 0 (0.0%) | 11 (100.0%) |
| Enterprise Management | 0 (0.0%) | 0 (0.0%) |
| Administrative & Support | 0 (0.0%) | 0 (0.0%) |
| Educational Services | 0 (0.0%) | 0 (0.0%) |
| Health Care & Social Assistance | 13 (7.0%) | 172 (93.0%) |
| Arts, Entertainment & Recreation | 46 (100.0%) | 0 (0.0%) |
| Accommodation & Food Services | 45 (100.0%) | 0 (0.0%) |
| Public Administration | 38 (74.5%) | 13 (25.5%) |
| Total | 393 (56.7%) | 300 (43.3%) |
Education in Patterson Tract
School Enrollment in Patterson Tract
The most common levels of schooling among the 443 students in Patterson Tract are high school (135 | 30.5%), college / undergraduate (97 | 21.9%), and nursery / preschool (94 | 21.2%).
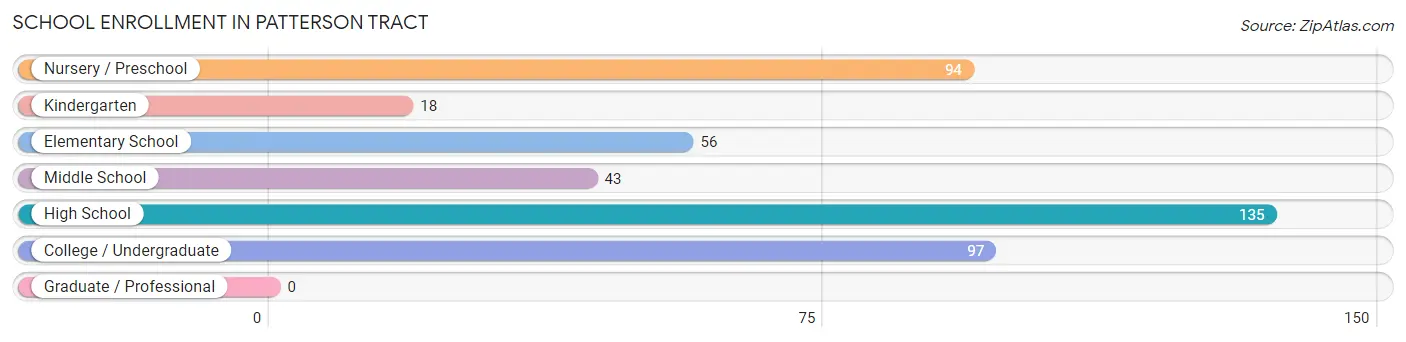
| School Level | # Students | % Students |
| Nursery / Preschool | 94 | 21.2% |
| Kindergarten | 18 | 4.1% |
| Elementary School | 56 | 12.6% |
| Middle School | 43 | 9.7% |
| High School | 135 | 30.5% |
| College / Undergraduate | 97 | 21.9% |
| Graduate / Professional | 0 | 0.0% |
| Total | 443 | 100.0% |
School Enrollment by Age by Funding Source in Patterson Tract
Out of a total of 443 students who are enrolled in schools in Patterson Tract, 13 (2.9%) attend a private institution, while the remaining 430 (97.1%) are enrolled in public schools. The age group of 15 to 17 year olds has the highest likelihood of being enrolled in private schools, with 13 (10.7% in the age bracket) enrolled. Conversely, the age group of 3 to 4 year olds has the lowest likelihood of being enrolled in a private school, with 62 (100.0% in the age bracket) attending a public institution.
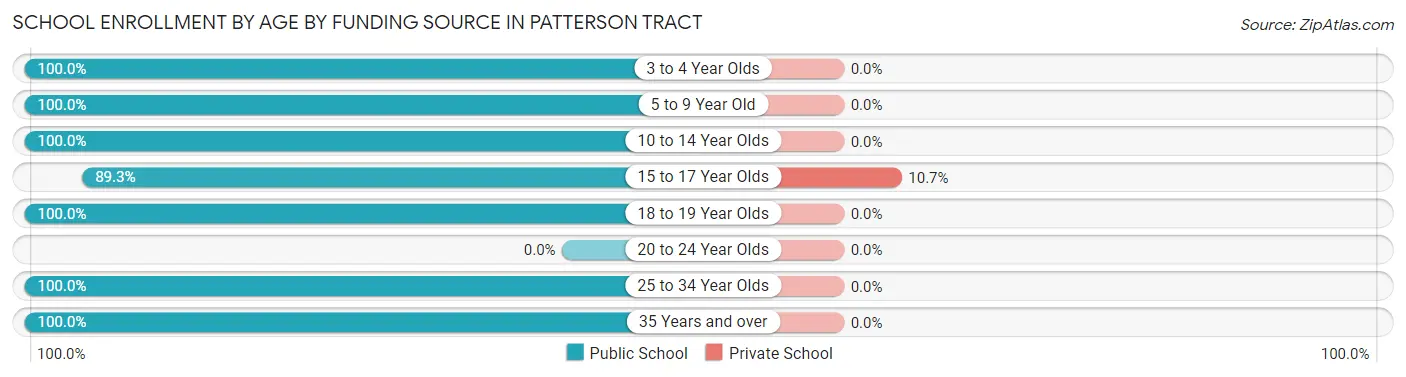
| Age Bracket | Public School | Private School |
| 3 to 4 Year Olds | 62 (100.0%) | 0 (0.0%) |
| 5 to 9 Year Old | 76 (100.0%) | 0 (0.0%) |
| 10 to 14 Year Olds | 87 (100.0%) | 0 (0.0%) |
| 15 to 17 Year Olds | 108 (89.3%) | 13 (10.7%) |
| 18 to 19 Year Olds | 25 (100.0%) | 0 (0.0%) |
| 20 to 24 Year Olds | 0 (0.0%) | 0 (0.0%) |
| 25 to 34 Year Olds | 42 (100.0%) | 0 (0.0%) |
| 35 Years and over | 30 (100.0%) | 0 (0.0%) |
| Total | 430 (97.1%) | 13 (2.9%) |
Educational Attainment by Field of Study in Patterson Tract
Business (38 | 24.2%), bio, nature & agricultural (33 | 21.0%), science & technology (27 | 17.2%), arts & humanities (15 | 9.6%), and psychology (14 | 8.9%) are the most common fields of study among 157 individuals in Patterson Tract who have obtained a bachelor's degree or higher.
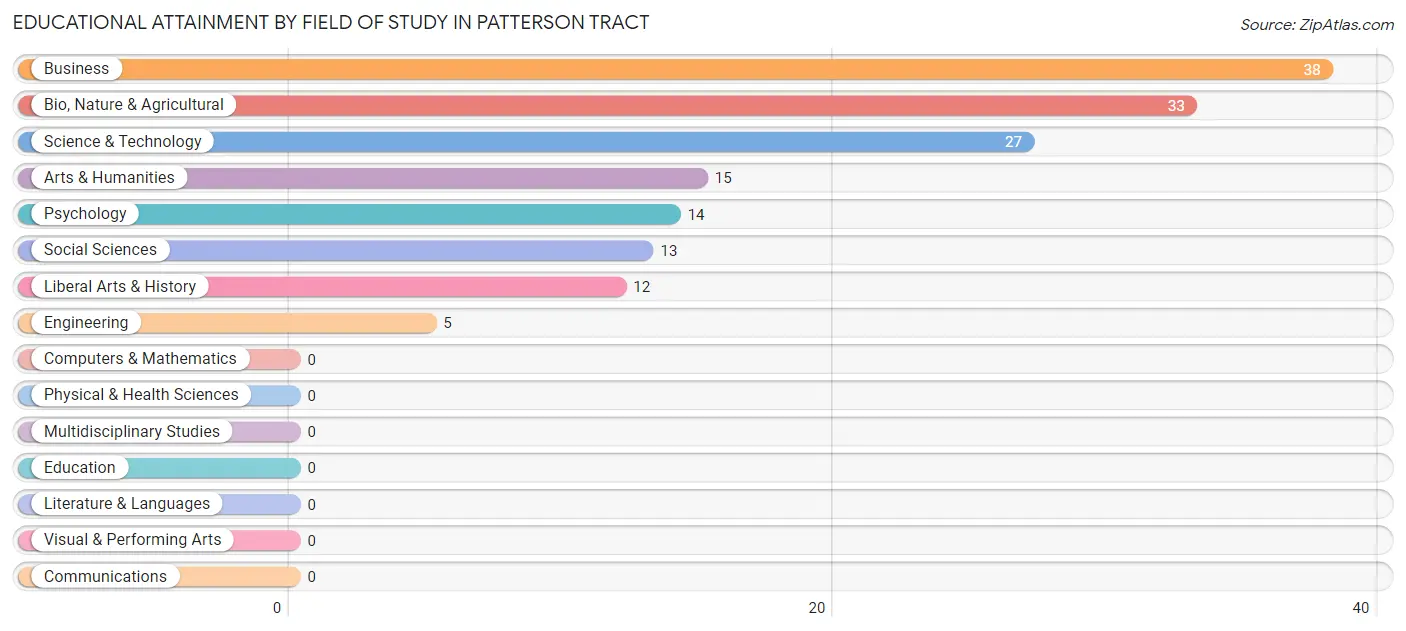
| Field of Study | # Graduates | % Graduates |
| Computers & Mathematics | 0 | 0.0% |
| Bio, Nature & Agricultural | 33 | 21.0% |
| Physical & Health Sciences | 0 | 0.0% |
| Psychology | 14 | 8.9% |
| Social Sciences | 13 | 8.3% |
| Engineering | 5 | 3.2% |
| Multidisciplinary Studies | 0 | 0.0% |
| Science & Technology | 27 | 17.2% |
| Business | 38 | 24.2% |
| Education | 0 | 0.0% |
| Literature & Languages | 0 | 0.0% |
| Liberal Arts & History | 12 | 7.6% |
| Visual & Performing Arts | 0 | 0.0% |
| Communications | 0 | 0.0% |
| Arts & Humanities | 15 | 9.6% |
| Total | 157 | 100.0% |
Transportation & Commute in Patterson Tract
Vehicle Availability by Sex in Patterson Tract
The most prevalent vehicle ownership categories in Patterson Tract are males with 2 vehicles (241, accounting for 61.3%) and females with 2 vehicles (166, making up 88.3%).
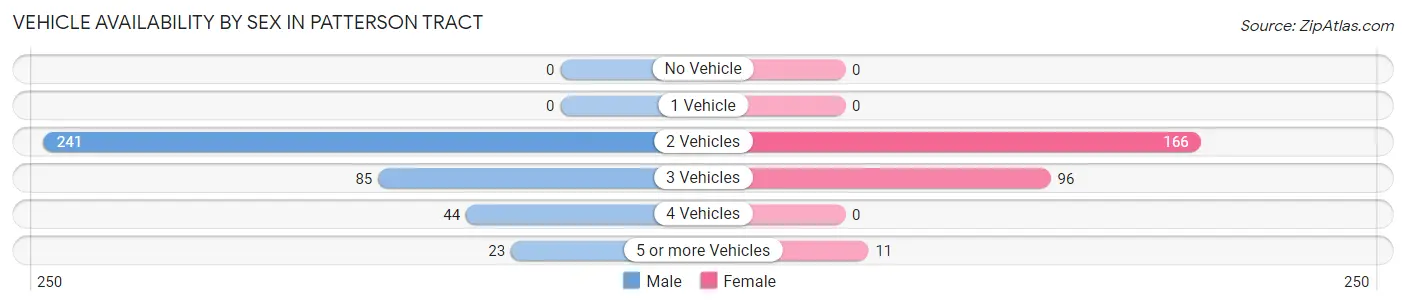
| Vehicles Available | Male | Female |
| No Vehicle | 0 (0.0%) | 0 (0.0%) |
| 1 Vehicle | 0 (0.0%) | 0 (0.0%) |
| 2 Vehicles | 241 (61.3%) | 166 (60.8%) |
| 3 Vehicles | 85 (21.6%) | 96 (35.2%) |
| 4 Vehicles | 44 (11.2%) | 0 (0.0%) |
| 5 or more Vehicles | 23 (5.9%) | 11 (4.0%) |
| Total | 393 (100.0%) | 273 (100.0%) |
Commute Time in Patterson Tract
The most frequently occuring commute durations in Patterson Tract are 10 to 14 minutes (160 commuters, 26.4%), 15 to 19 minutes (93 commuters, 15.3%), and 20 to 24 minutes (70 commuters, 11.5%).
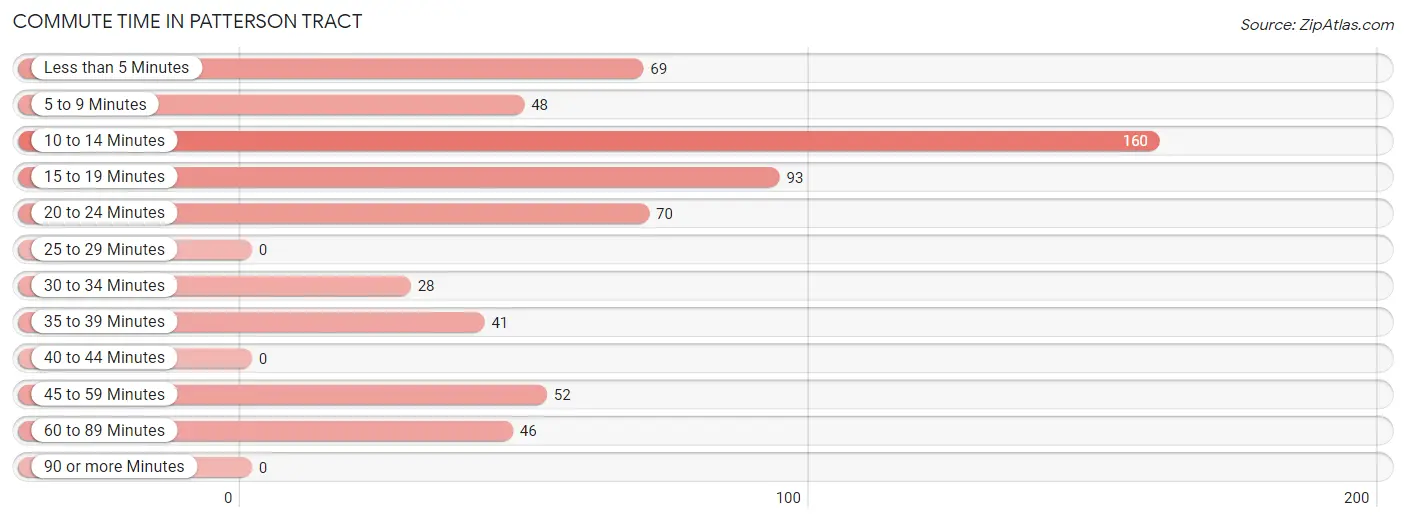
| Commute Time | # Commuters | % Commuters |
| Less than 5 Minutes | 69 | 11.4% |
| 5 to 9 Minutes | 48 | 7.9% |
| 10 to 14 Minutes | 160 | 26.4% |
| 15 to 19 Minutes | 93 | 15.3% |
| 20 to 24 Minutes | 70 | 11.5% |
| 25 to 29 Minutes | 0 | 0.0% |
| 30 to 34 Minutes | 28 | 4.6% |
| 35 to 39 Minutes | 41 | 6.8% |
| 40 to 44 Minutes | 0 | 0.0% |
| 45 to 59 Minutes | 52 | 8.6% |
| 60 to 89 Minutes | 46 | 7.6% |
| 90 or more Minutes | 0 | 0.0% |
Commute Time by Sex in Patterson Tract
The most common commute times in Patterson Tract are 10 to 14 minutes (54 commuters, 15.5%) for males and 10 to 14 minutes (106 commuters, 40.9%) for females.
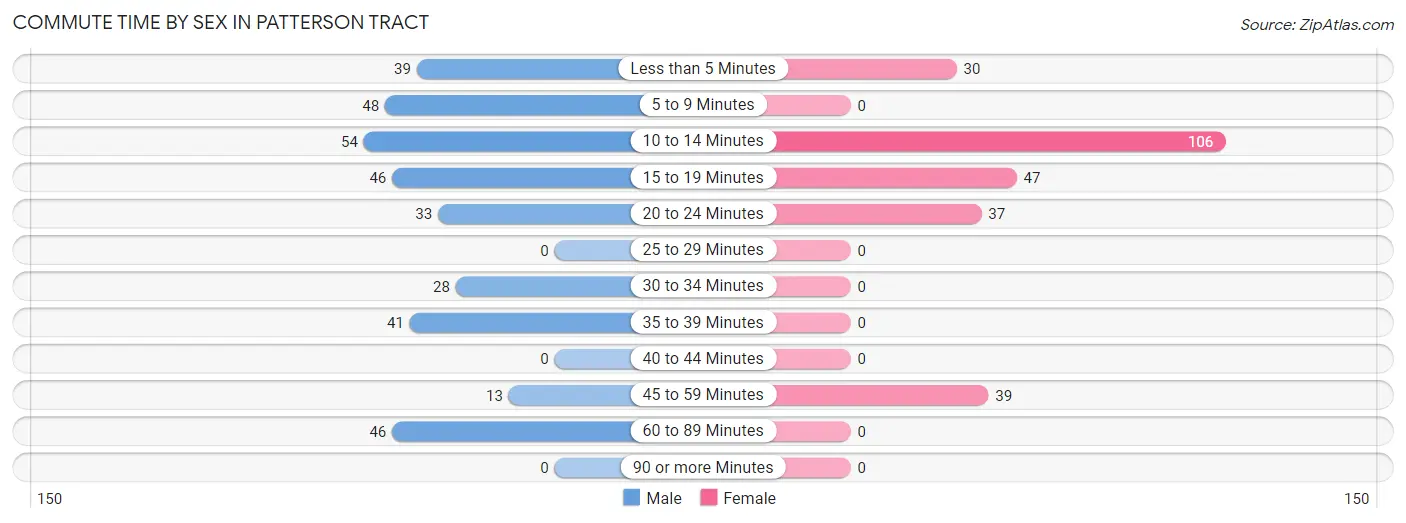
| Commute Time | Male | Female |
| Less than 5 Minutes | 39 (11.2%) | 30 (11.6%) |
| 5 to 9 Minutes | 48 (13.8%) | 0 (0.0%) |
| 10 to 14 Minutes | 54 (15.5%) | 106 (40.9%) |
| 15 to 19 Minutes | 46 (13.2%) | 47 (18.1%) |
| 20 to 24 Minutes | 33 (9.5%) | 37 (14.3%) |
| 25 to 29 Minutes | 0 (0.0%) | 0 (0.0%) |
| 30 to 34 Minutes | 28 (8.1%) | 0 (0.0%) |
| 35 to 39 Minutes | 41 (11.8%) | 0 (0.0%) |
| 40 to 44 Minutes | 0 (0.0%) | 0 (0.0%) |
| 45 to 59 Minutes | 13 (3.7%) | 39 (15.1%) |
| 60 to 89 Minutes | 46 (13.2%) | 0 (0.0%) |
| 90 or more Minutes | 0 (0.0%) | 0 (0.0%) |
Time of Departure to Work by Sex in Patterson Tract
The most frequent times of departure to work in Patterson Tract are 7:00 AM to 7:29 AM (128, 36.8%) for males and 7:00 AM to 7:29 AM (75, 29.0%) for females.
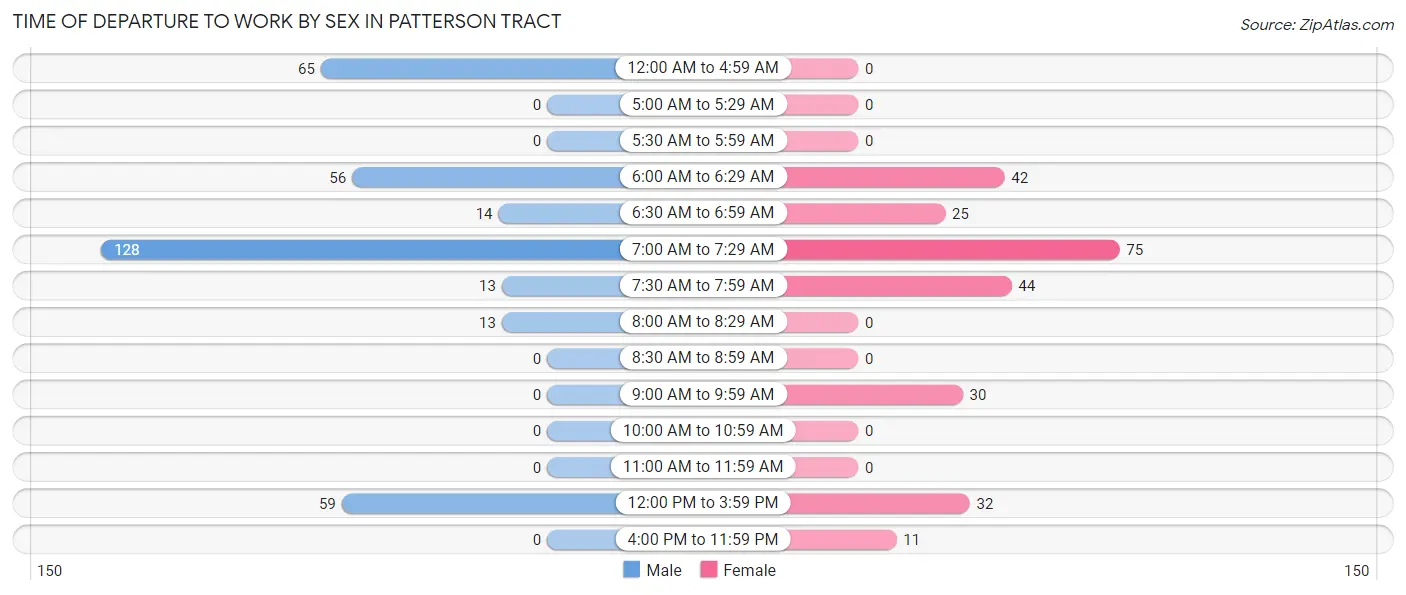
| Time of Departure | Male | Female |
| 12:00 AM to 4:59 AM | 65 (18.7%) | 0 (0.0%) |
| 5:00 AM to 5:29 AM | 0 (0.0%) | 0 (0.0%) |
| 5:30 AM to 5:59 AM | 0 (0.0%) | 0 (0.0%) |
| 6:00 AM to 6:29 AM | 56 (16.1%) | 42 (16.2%) |
| 6:30 AM to 6:59 AM | 14 (4.0%) | 25 (9.7%) |
| 7:00 AM to 7:29 AM | 128 (36.8%) | 75 (29.0%) |
| 7:30 AM to 7:59 AM | 13 (3.7%) | 44 (17.0%) |
| 8:00 AM to 8:29 AM | 13 (3.7%) | 0 (0.0%) |
| 8:30 AM to 8:59 AM | 0 (0.0%) | 0 (0.0%) |
| 9:00 AM to 9:59 AM | 0 (0.0%) | 30 (11.6%) |
| 10:00 AM to 10:59 AM | 0 (0.0%) | 0 (0.0%) |
| 11:00 AM to 11:59 AM | 0 (0.0%) | 0 (0.0%) |
| 12:00 PM to 3:59 PM | 59 (17.0%) | 32 (12.4%) |
| 4:00 PM to 11:59 PM | 0 (0.0%) | 11 (4.3%) |
| Total | 348 (100.0%) | 259 (100.0%) |
Housing Occupancy in Patterson Tract
Occupancy by Ownership in Patterson Tract
Of the total 523 dwellings in Patterson Tract, owner-occupied units account for 456 (87.2%), while renter-occupied units make up 67 (12.8%).
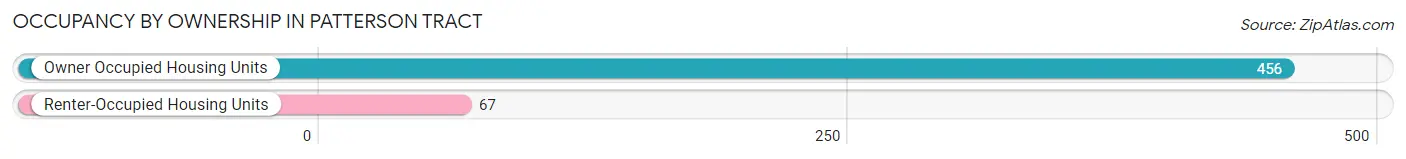
| Occupancy | # Housing Units | % Housing Units |
| Owner Occupied Housing Units | 456 | 87.2% |
| Renter-Occupied Housing Units | 67 | 12.8% |
| Total Occupied Housing Units | 523 | 100.0% |
Occupancy by Household Size in Patterson Tract
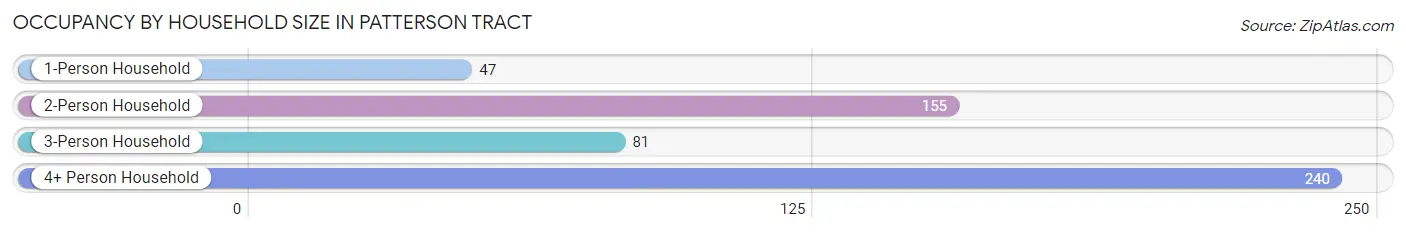
| Household Size | # Housing Units | % Housing Units |
| 1-Person Household | 47 | 9.0% |
| 2-Person Household | 155 | 29.6% |
| 3-Person Household | 81 | 15.5% |
| 4+ Person Household | 240 | 45.9% |
| Total Housing Units | 523 | 100.0% |
Occupancy by Ownership by Household Size in Patterson Tract
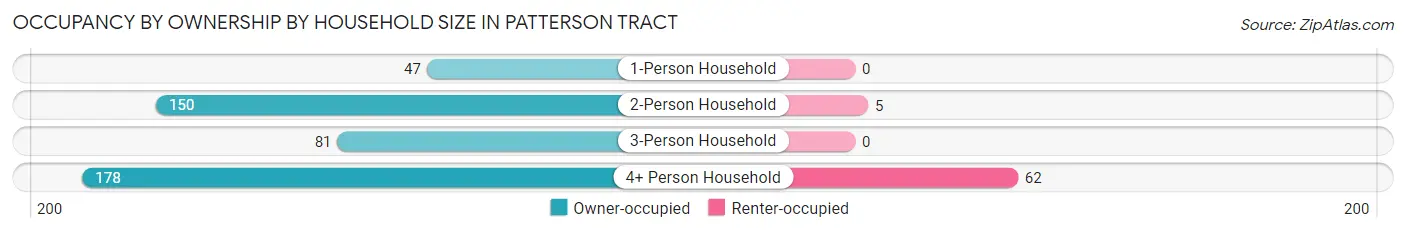
| Household Size | Owner-occupied | Renter-occupied |
| 1-Person Household | 47 (100.0%) | 0 (0.0%) |
| 2-Person Household | 150 (96.8%) | 5 (3.2%) |
| 3-Person Household | 81 (100.0%) | 0 (0.0%) |
| 4+ Person Household | 178 (74.2%) | 62 (25.8%) |
| Total Housing Units | 456 (87.2%) | 67 (12.8%) |
Occupancy by Educational Attainment in Patterson Tract
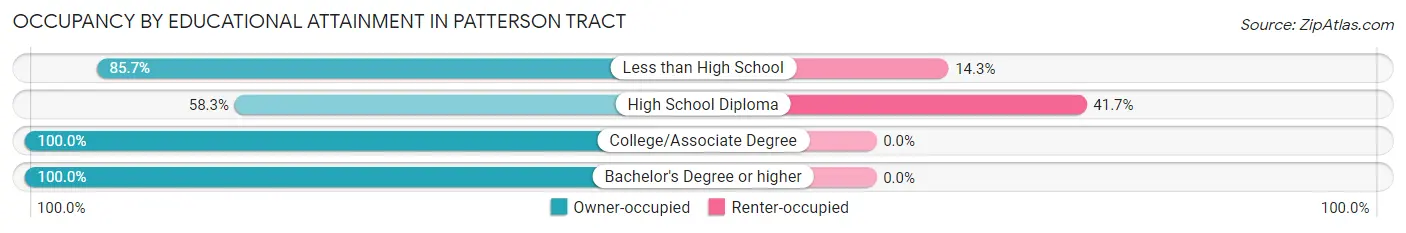
| Household Size | Owner-occupied | Renter-occupied |
| Less than High School | 102 (85.7%) | 17 (14.3%) |
| High School Diploma | 70 (58.3%) | 50 (41.7%) |
| College/Associate Degree | 198 (100.0%) | 0 (0.0%) |
| Bachelor's Degree or higher | 86 (100.0%) | 0 (0.0%) |
Occupancy by Age of Householder in Patterson Tract
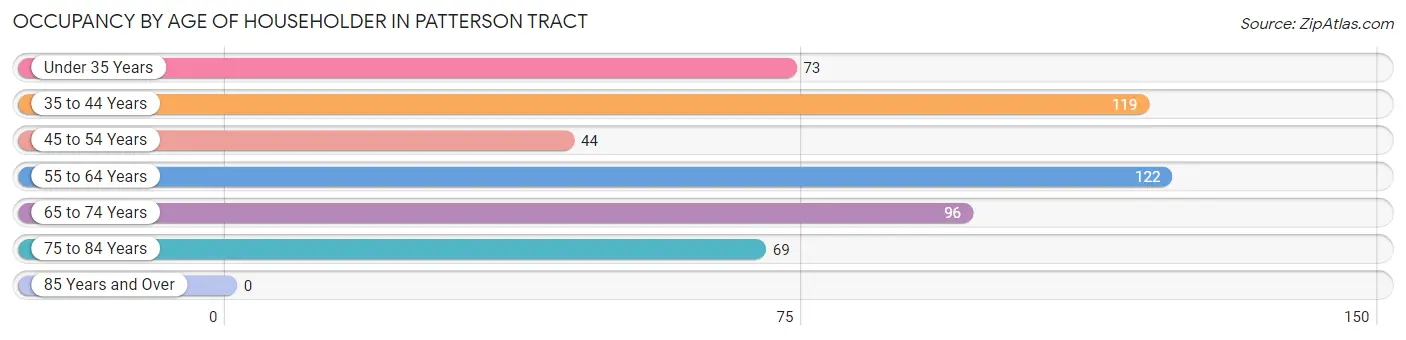
| Age Bracket | # Households | % Households |
| Under 35 Years | 73 | 14.0% |
| 35 to 44 Years | 119 | 22.8% |
| 45 to 54 Years | 44 | 8.4% |
| 55 to 64 Years | 122 | 23.3% |
| 65 to 74 Years | 96 | 18.4% |
| 75 to 84 Years | 69 | 13.2% |
| 85 Years and Over | 0 | 0.0% |
| Total | 523 | 100.0% |
Housing Finances in Patterson Tract
Median Income by Occupancy in Patterson Tract
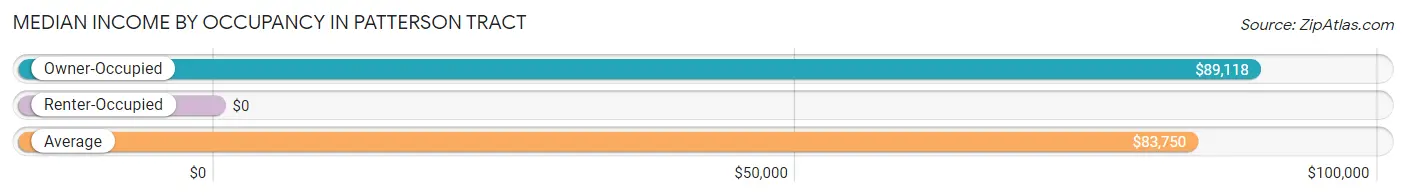
| Occupancy Type | # Households | Median Income |
| Owner-Occupied | 456 (87.2%) | $89,118 |
| Renter-Occupied | 67 (12.8%) | $0 |
| Average | 523 (100.0%) | $83,750 |
Occupancy by Householder Income Bracket in Patterson Tract
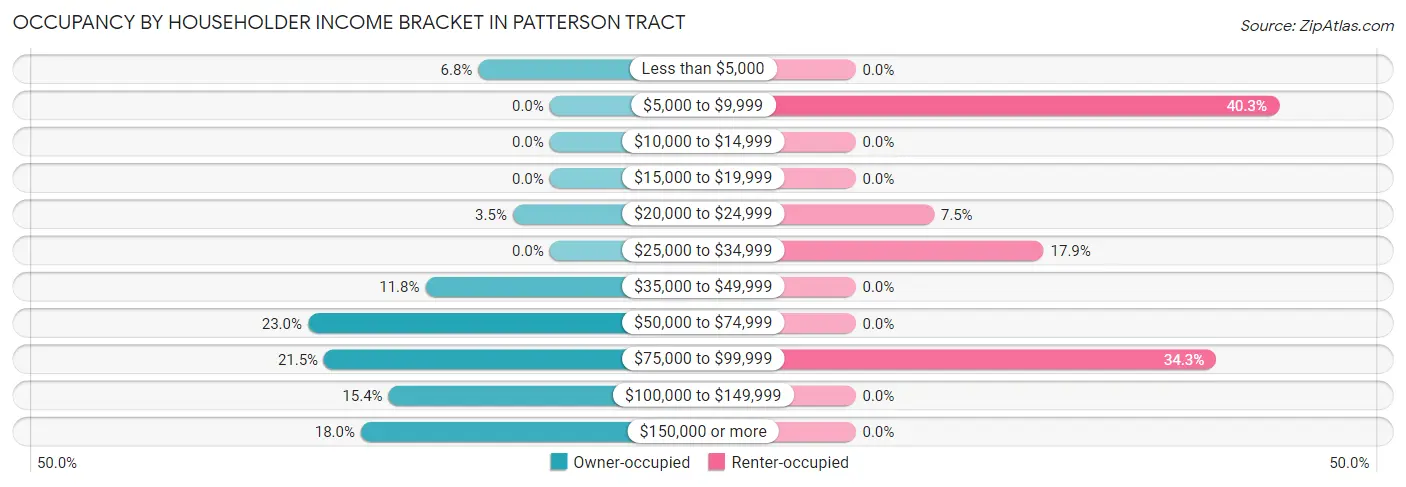
| Income Bracket | Owner-occupied | Renter-occupied |
| Less than $5,000 | 31 (6.8%) | 0 (0.0%) |
| $5,000 to $9,999 | 0 (0.0%) | 27 (40.3%) |
| $10,000 to $14,999 | 0 (0.0%) | 0 (0.0%) |
| $15,000 to $19,999 | 0 (0.0%) | 0 (0.0%) |
| $20,000 to $24,999 | 16 (3.5%) | 5 (7.5%) |
| $25,000 to $34,999 | 0 (0.0%) | 12 (17.9%) |
| $35,000 to $49,999 | 54 (11.8%) | 0 (0.0%) |
| $50,000 to $74,999 | 105 (23.0%) | 0 (0.0%) |
| $75,000 to $99,999 | 98 (21.5%) | 23 (34.3%) |
| $100,000 to $149,999 | 70 (15.3%) | 0 (0.0%) |
| $150,000 or more | 82 (18.0%) | 0 (0.0%) |
| Total | 456 (100.0%) | 67 (100.0%) |
Monthly Housing Cost Tiers in Patterson Tract
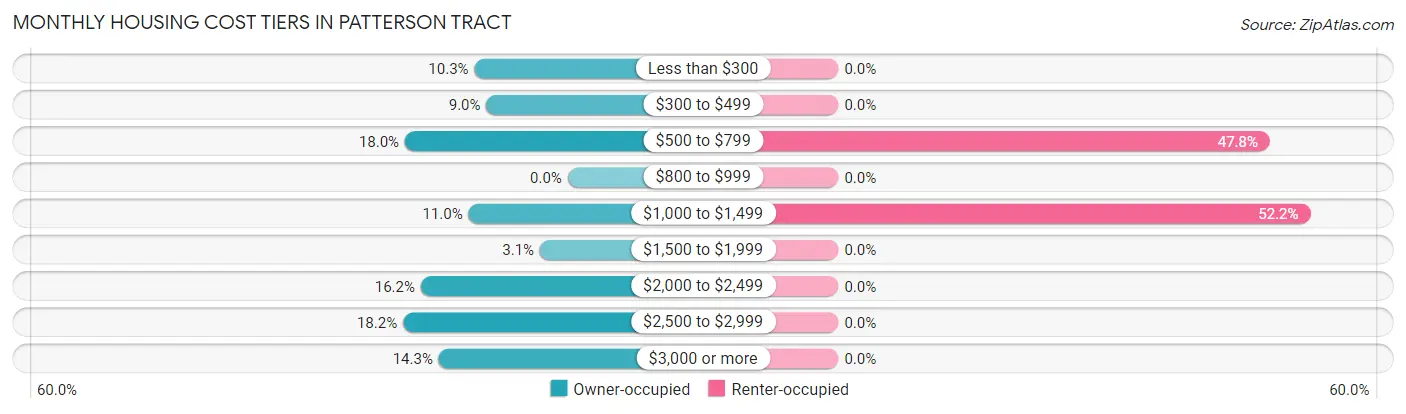
| Monthly Cost | Owner-occupied | Renter-occupied |
| Less than $300 | 47 (10.3%) | 0 (0.0%) |
| $300 to $499 | 41 (9.0%) | 0 (0.0%) |
| $500 to $799 | 82 (18.0%) | 32 (47.8%) |
| $800 to $999 | 0 (0.0%) | 0 (0.0%) |
| $1,000 to $1,499 | 50 (11.0%) | 35 (52.2%) |
| $1,500 to $1,999 | 14 (3.1%) | 0 (0.0%) |
| $2,000 to $2,499 | 74 (16.2%) | 0 (0.0%) |
| $2,500 to $2,999 | 83 (18.2%) | 0 (0.0%) |
| $3,000 or more | 65 (14.2%) | 0 (0.0%) |
| Total | 456 (100.0%) | 67 (100.0%) |
Physical Housing Characteristics in Patterson Tract
Housing Structures in Patterson Tract
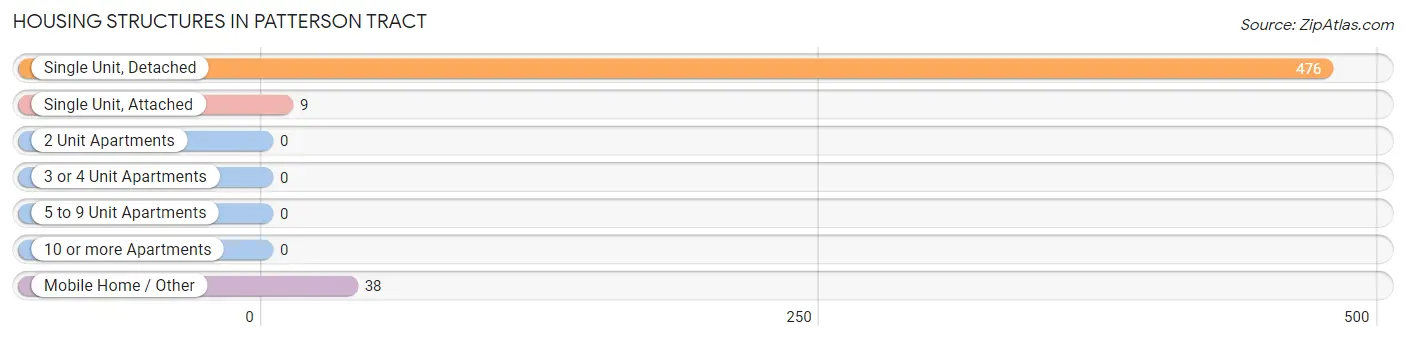
| Structure Type | # Housing Units | % Housing Units |
| Single Unit, Detached | 476 | 91.0% |
| Single Unit, Attached | 9 | 1.7% |
| 2 Unit Apartments | 0 | 0.0% |
| 3 or 4 Unit Apartments | 0 | 0.0% |
| 5 to 9 Unit Apartments | 0 | 0.0% |
| 10 or more Apartments | 0 | 0.0% |
| Mobile Home / Other | 38 | 7.3% |
| Total | 523 | 100.0% |
Housing Structures by Occupancy in Patterson Tract
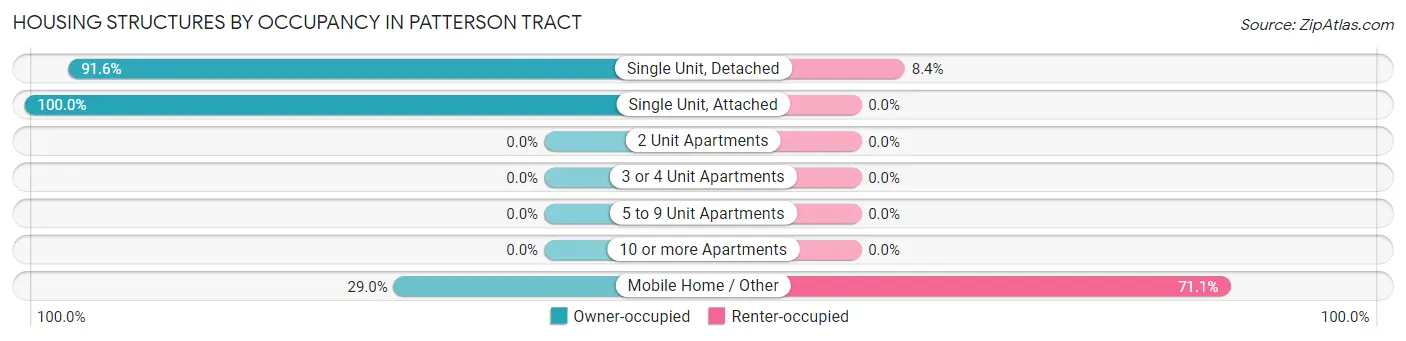
| Structure Type | Owner-occupied | Renter-occupied |
| Single Unit, Detached | 436 (91.6%) | 40 (8.4%) |
| Single Unit, Attached | 9 (100.0%) | 0 (0.0%) |
| 2 Unit Apartments | 0 (0.0%) | 0 (0.0%) |
| 3 or 4 Unit Apartments | 0 (0.0%) | 0 (0.0%) |
| 5 to 9 Unit Apartments | 0 (0.0%) | 0 (0.0%) |
| 10 or more Apartments | 0 (0.0%) | 0 (0.0%) |
| Mobile Home / Other | 11 (28.9%) | 27 (71.1%) |
| Total | 456 (87.2%) | 67 (12.8%) |
Housing Structures by Number of Rooms in Patterson Tract
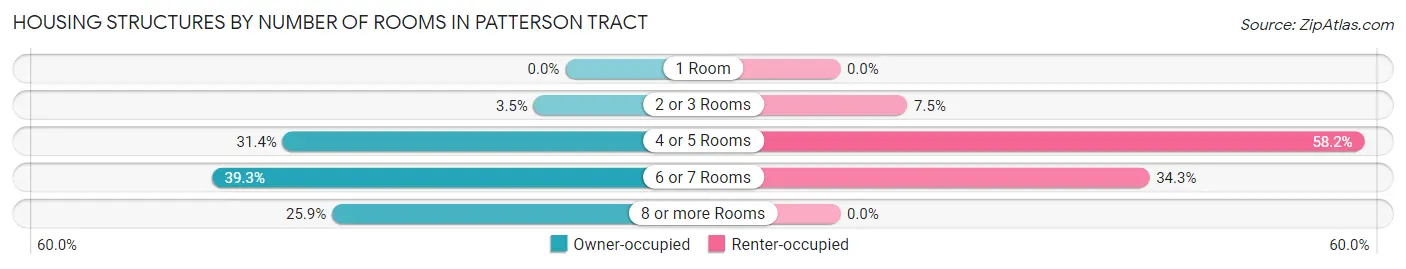
| Number of Rooms | Owner-occupied | Renter-occupied |
| 1 Room | 0 (0.0%) | 0 (0.0%) |
| 2 or 3 Rooms | 16 (3.5%) | 5 (7.5%) |
| 4 or 5 Rooms | 143 (31.4%) | 39 (58.2%) |
| 6 or 7 Rooms | 179 (39.3%) | 23 (34.3%) |
| 8 or more Rooms | 118 (25.9%) | 0 (0.0%) |
| Total | 456 (100.0%) | 67 (100.0%) |
Housing Structure by Heating Type in Patterson Tract
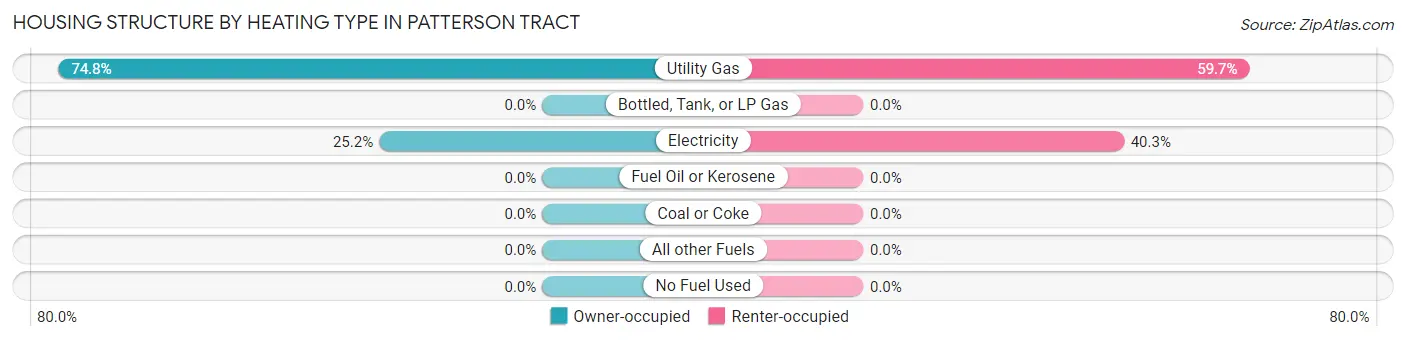
| Heating Type | Owner-occupied | Renter-occupied |
| Utility Gas | 341 (74.8%) | 40 (59.7%) |
| Bottled, Tank, or LP Gas | 0 (0.0%) | 0 (0.0%) |
| Electricity | 115 (25.2%) | 27 (40.3%) |
| Fuel Oil or Kerosene | 0 (0.0%) | 0 (0.0%) |
| Coal or Coke | 0 (0.0%) | 0 (0.0%) |
| All other Fuels | 0 (0.0%) | 0 (0.0%) |
| No Fuel Used | 0 (0.0%) | 0 (0.0%) |
| Total | 456 (100.0%) | 67 (100.0%) |
Household Vehicle Usage in Patterson Tract
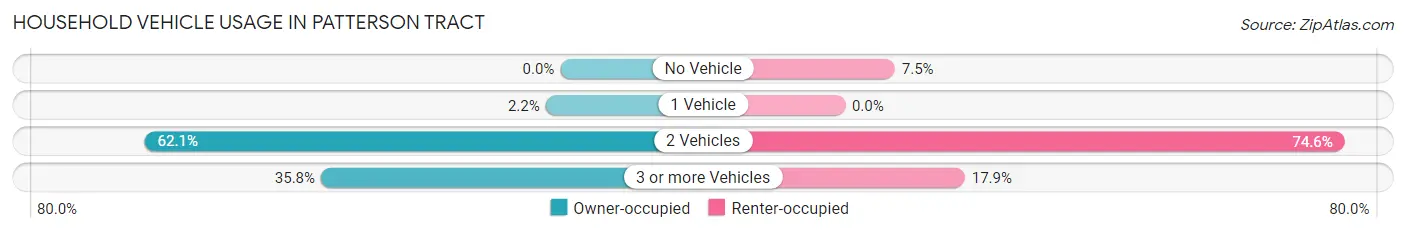
| Vehicles per Household | Owner-occupied | Renter-occupied |
| No Vehicle | 0 (0.0%) | 5 (7.5%) |
| 1 Vehicle | 10 (2.2%) | 0 (0.0%) |
| 2 Vehicles | 283 (62.1%) | 50 (74.6%) |
| 3 or more Vehicles | 163 (35.7%) | 12 (17.9%) |
| Total | 456 (100.0%) | 67 (100.0%) |
Real Estate & Mortgages in Patterson Tract
Real Estate and Mortgage Overview in Patterson Tract
| Characteristic | Without Mortgage | With Mortgage |
| Housing Units | 197 | 259 |
| Median Property Value | $328,300 | $508,100 |
| Median Household Income | $70,855 | $61 |
| Monthly Housing Costs | $612 | $50 |
| Real Estate Taxes | $3,243 | $15 |
Property Value by Mortgage Status in Patterson Tract
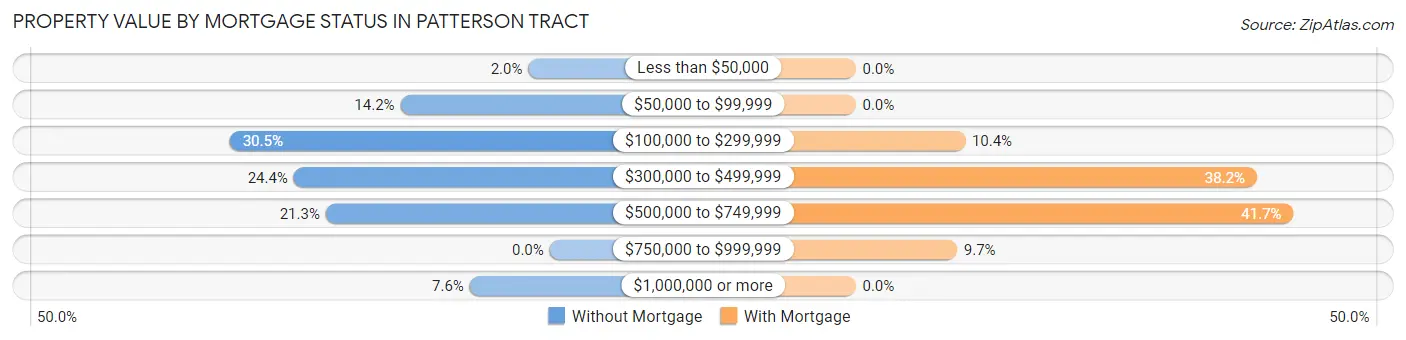
| Property Value | Without Mortgage | With Mortgage |
| Less than $50,000 | 4 (2.0%) | 0 (0.0%) |
| $50,000 to $99,999 | 28 (14.2%) | 0 (0.0%) |
| $100,000 to $299,999 | 60 (30.5%) | 27 (10.4%) |
| $300,000 to $499,999 | 48 (24.4%) | 99 (38.2%) |
| $500,000 to $749,999 | 42 (21.3%) | 108 (41.7%) |
| $750,000 to $999,999 | 0 (0.0%) | 25 (9.7%) |
| $1,000,000 or more | 15 (7.6%) | 0 (0.0%) |
| Total | 197 (100.0%) | 259 (100.0%) |
Household Income by Mortgage Status in Patterson Tract
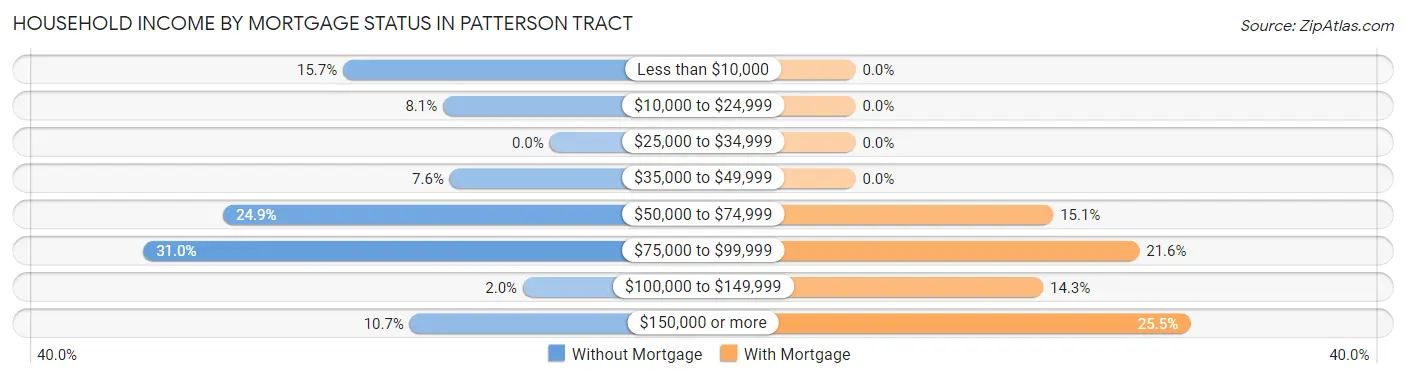
| Household Income | Without Mortgage | With Mortgage |
| Less than $10,000 | 31 (15.7%) | 0 (0.0%) |
| $10,000 to $24,999 | 16 (8.1%) | 0 (0.0%) |
| $25,000 to $34,999 | 0 (0.0%) | 0 (0.0%) |
| $35,000 to $49,999 | 15 (7.6%) | 0 (0.0%) |
| $50,000 to $74,999 | 49 (24.9%) | 39 (15.1%) |
| $75,000 to $99,999 | 61 (31.0%) | 56 (21.6%) |
| $100,000 to $149,999 | 4 (2.0%) | 37 (14.3%) |
| $150,000 or more | 21 (10.7%) | 66 (25.5%) |
| Total | 197 (100.0%) | 259 (100.0%) |
Property Value to Household Income Ratio in Patterson Tract
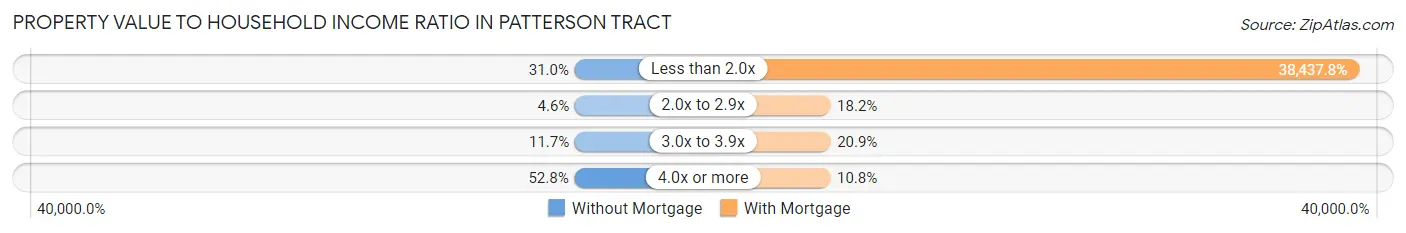
| Value-to-Income Ratio | Without Mortgage | With Mortgage |
| Less than 2.0x | 61 (31.0%) | 99,554 (38,437.8%) |
| 2.0x to 2.9x | 9 (4.6%) | 47 (18.1%) |
| 3.0x to 3.9x | 23 (11.7%) | 54 (20.8%) |
| 4.0x or more | 104 (52.8%) | 28 (10.8%) |
| Total | 197 (100.0%) | 259 (100.0%) |
Real Estate Taxes by Mortgage Status in Patterson Tract
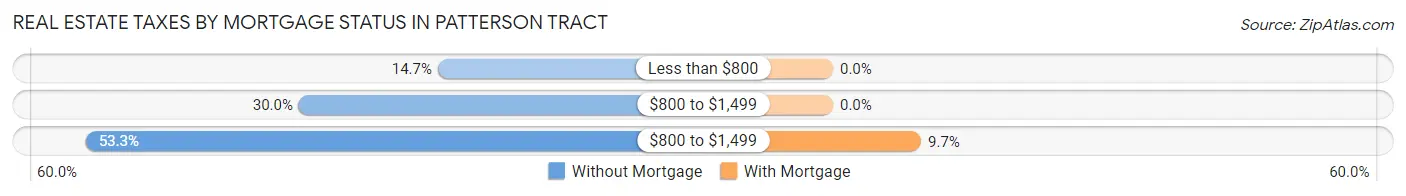
| Property Taxes | Without Mortgage | With Mortgage |
| Less than $800 | 29 (14.7%) | 0 (0.0%) |
| $800 to $1,499 | 59 (29.9%) | 0 (0.0%) |
| $800 to $1,499 | 105 (53.3%) | 25 (9.7%) |
| Total | 197 (100.0%) | 259 (100.0%) |
Health & Disability in Patterson Tract
Health Insurance Coverage by Age in Patterson Tract
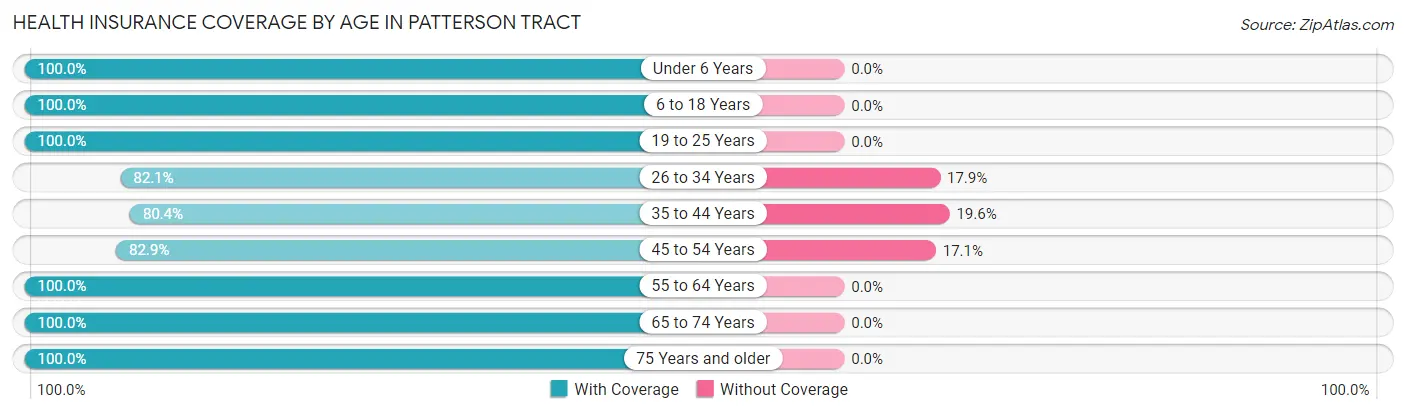
| Age Bracket | With Coverage | Without Coverage |
| Under 6 Years | 190 (100.0%) | 0 (0.0%) |
| 6 to 18 Years | 252 (100.0%) | 0 (0.0%) |
| 19 to 25 Years | 37 (100.0%) | 0 (0.0%) |
| 26 to 34 Years | 207 (82.1%) | 45 (17.9%) |
| 35 to 44 Years | 168 (80.4%) | 41 (19.6%) |
| 45 to 54 Years | 175 (82.9%) | 36 (17.1%) |
| 55 to 64 Years | 194 (100.0%) | 0 (0.0%) |
| 65 to 74 Years | 175 (100.0%) | 0 (0.0%) |
| 75 Years and older | 125 (100.0%) | 0 (0.0%) |
| Total | 1,523 (92.6%) | 122 (7.4%) |
Health Insurance Coverage by Citizenship Status in Patterson Tract
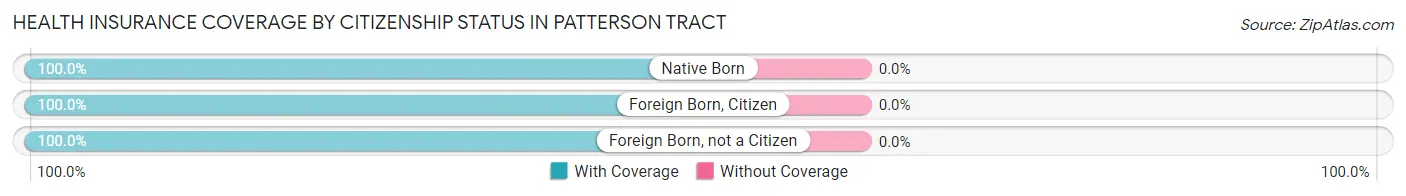
| Citizenship Status | With Coverage | Without Coverage |
| Native Born | 190 (100.0%) | 0 (0.0%) |
| Foreign Born, Citizen | 252 (100.0%) | 0 (0.0%) |
| Foreign Born, not a Citizen | 37 (100.0%) | 0 (0.0%) |
Health Insurance Coverage by Household Income in Patterson Tract
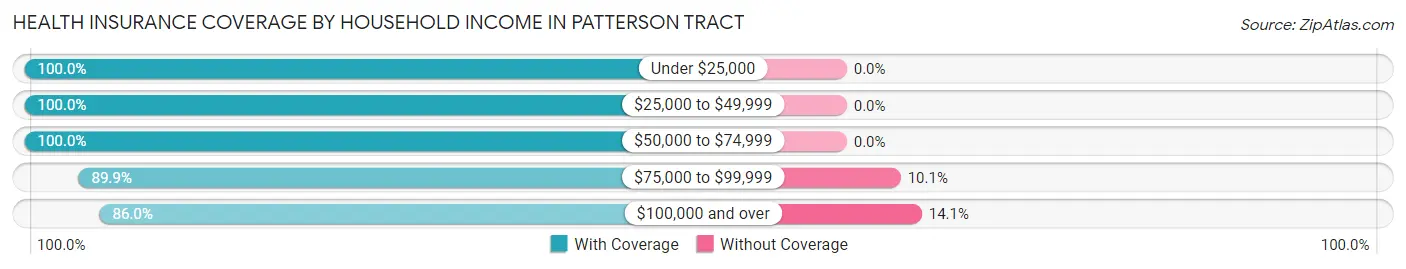
| Household Income | With Coverage | Without Coverage |
| Under $25,000 | 172 (100.0%) | 0 (0.0%) |
| $25,000 to $49,999 | 199 (100.0%) | 0 (0.0%) |
| $50,000 to $74,999 | 276 (100.0%) | 0 (0.0%) |
| $75,000 to $99,999 | 400 (89.9%) | 45 (10.1%) |
| $100,000 and over | 471 (86.0%) | 77 (14.1%) |
Public vs Private Health Insurance Coverage by Age in Patterson Tract

| Age Bracket | Public Insurance | Private Insurance |
| Under 6 | 127 (66.8%) | 63 (33.2%) |
| 6 to 18 Years | 165 (65.5%) | 87 (34.5%) |
| 19 to 25 Years | 37 (100.0%) | 0 (0.0%) |
| 25 to 34 Years | 112 (44.4%) | 108 (42.9%) |
| 35 to 44 Years | 79 (37.8%) | 89 (42.6%) |
| 45 to 54 Years | 84 (39.8%) | 91 (43.1%) |
| 55 to 64 Years | 89 (45.9%) | 119 (61.3%) |
| 65 to 74 Years | 175 (100.0%) | 82 (46.9%) |
| 75 Years and over | 125 (100.0%) | 67 (53.6%) |
| Total | 993 (60.4%) | 706 (42.9%) |
Disability Status by Sex by Age in Patterson Tract
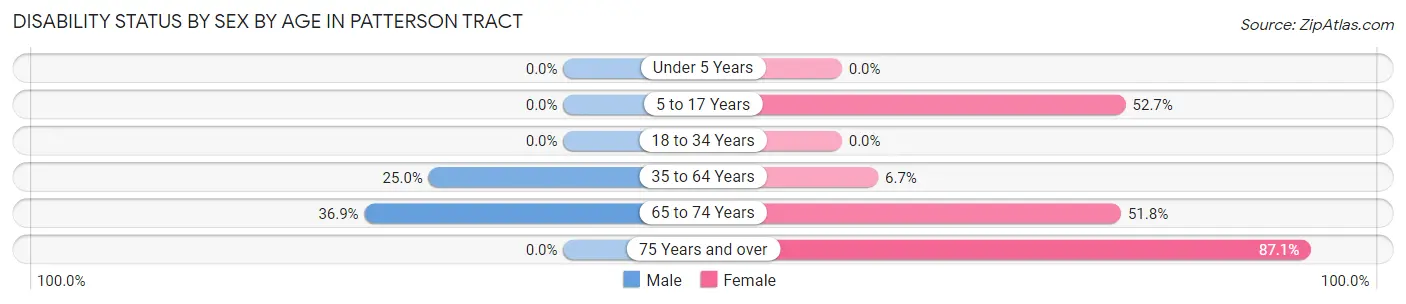
| Age Bracket | Male | Female |
| Under 5 Years | 0 (0.0%) | 0 (0.0%) |
| 5 to 17 Years | 0 (0.0%) | 59 (52.7%) |
| 18 to 34 Years | 0 (0.0%) | 0 (0.0%) |
| 35 to 64 Years | 83 (25.0%) | 19 (6.7%) |
| 65 to 74 Years | 24 (36.9%) | 57 (51.8%) |
| 75 Years and over | 0 (0.0%) | 27 (87.1%) |
Disability Class by Sex by Age in Patterson Tract
Disability Class: Hearing Difficulty
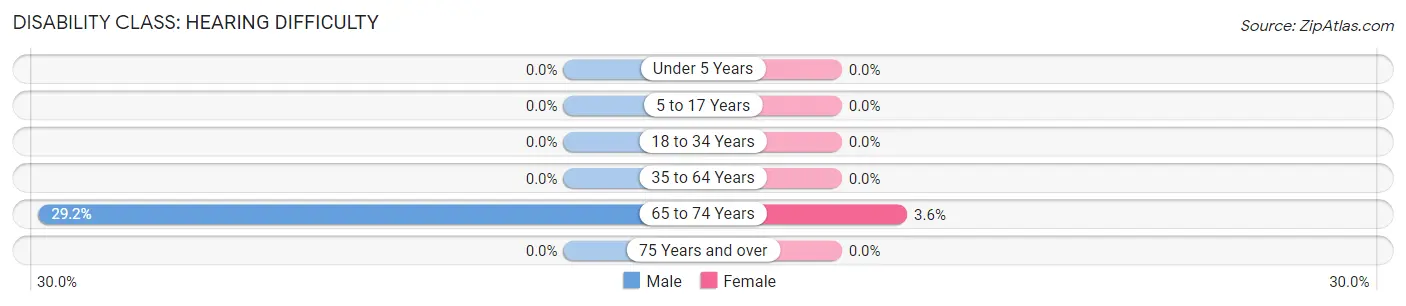
| Age Bracket | Male | Female |
| Under 5 Years | 0 (0.0%) | 0 (0.0%) |
| 5 to 17 Years | 0 (0.0%) | 0 (0.0%) |
| 18 to 34 Years | 0 (0.0%) | 0 (0.0%) |
| 35 to 64 Years | 0 (0.0%) | 0 (0.0%) |
| 65 to 74 Years | 19 (29.2%) | 4 (3.6%) |
| 75 Years and over | 0 (0.0%) | 0 (0.0%) |
Disability Class: Vision Difficulty
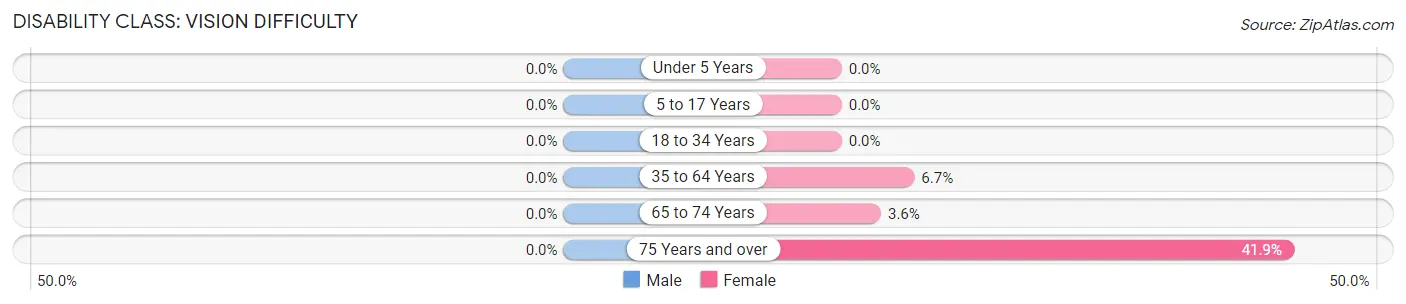
| Age Bracket | Male | Female |
| Under 5 Years | 0 (0.0%) | 0 (0.0%) |
| 5 to 17 Years | 0 (0.0%) | 0 (0.0%) |
| 18 to 34 Years | 0 (0.0%) | 0 (0.0%) |
| 35 to 64 Years | 0 (0.0%) | 19 (6.7%) |
| 65 to 74 Years | 0 (0.0%) | 4 (3.6%) |
| 75 Years and over | 0 (0.0%) | 13 (41.9%) |
Disability Class: Cognitive Difficulty
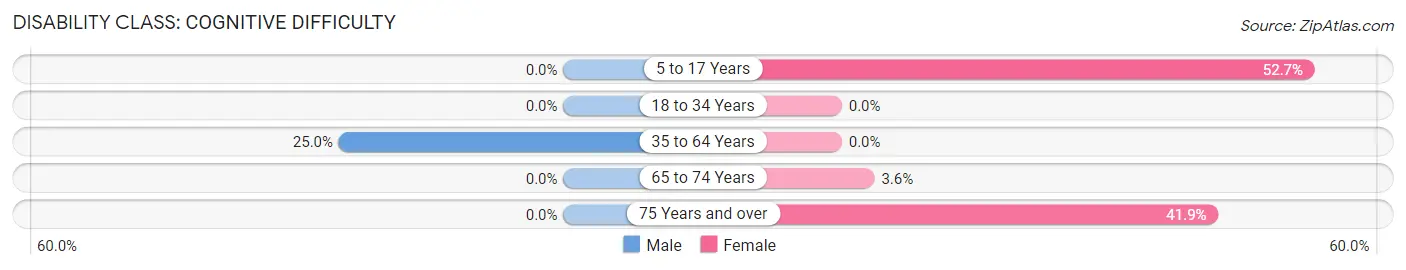
| Age Bracket | Male | Female |
| 5 to 17 Years | 0 (0.0%) | 59 (52.7%) |
| 18 to 34 Years | 0 (0.0%) | 0 (0.0%) |
| 35 to 64 Years | 83 (25.0%) | 0 (0.0%) |
| 65 to 74 Years | 0 (0.0%) | 4 (3.6%) |
| 75 Years and over | 0 (0.0%) | 13 (41.9%) |
Disability Class: Ambulatory Difficulty
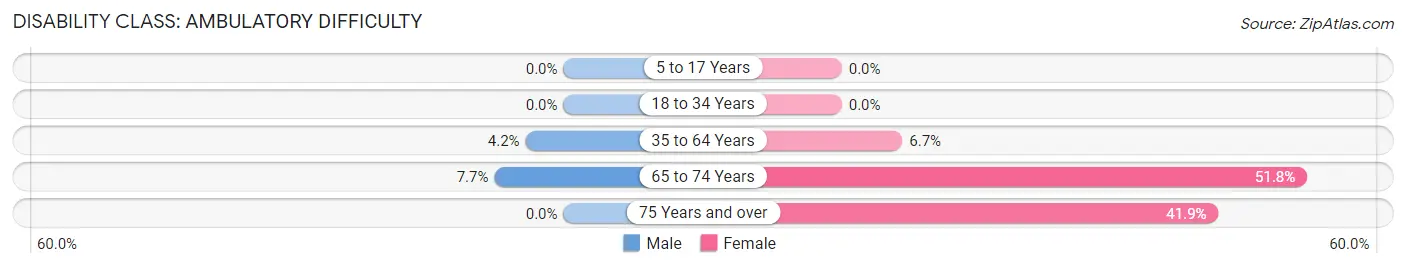
| Age Bracket | Male | Female |
| 5 to 17 Years | 0 (0.0%) | 0 (0.0%) |
| 18 to 34 Years | 0 (0.0%) | 0 (0.0%) |
| 35 to 64 Years | 14 (4.2%) | 19 (6.7%) |
| 65 to 74 Years | 5 (7.7%) | 57 (51.8%) |
| 75 Years and over | 0 (0.0%) | 13 (41.9%) |
Disability Class: Self-Care Difficulty
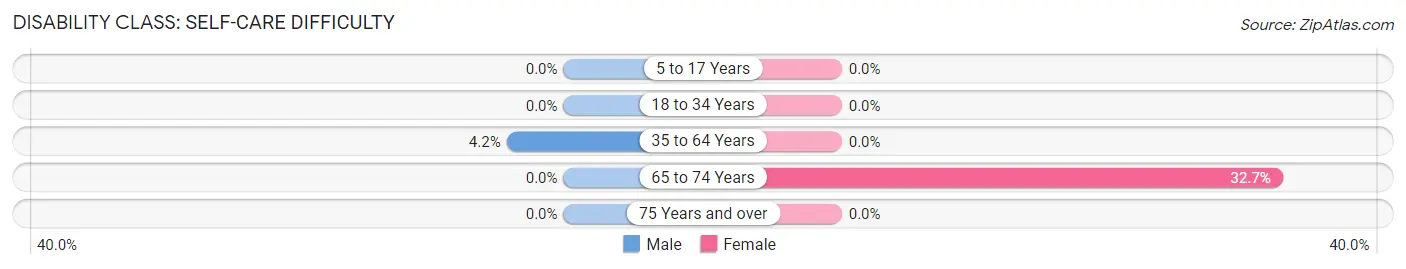
| Age Bracket | Male | Female |
| 5 to 17 Years | 0 (0.0%) | 0 (0.0%) |
| 18 to 34 Years | 0 (0.0%) | 0 (0.0%) |
| 35 to 64 Years | 14 (4.2%) | 0 (0.0%) |
| 65 to 74 Years | 0 (0.0%) | 36 (32.7%) |
| 75 Years and over | 0 (0.0%) | 0 (0.0%) |
Technology Access in Patterson Tract
Computing Device Access in Patterson Tract
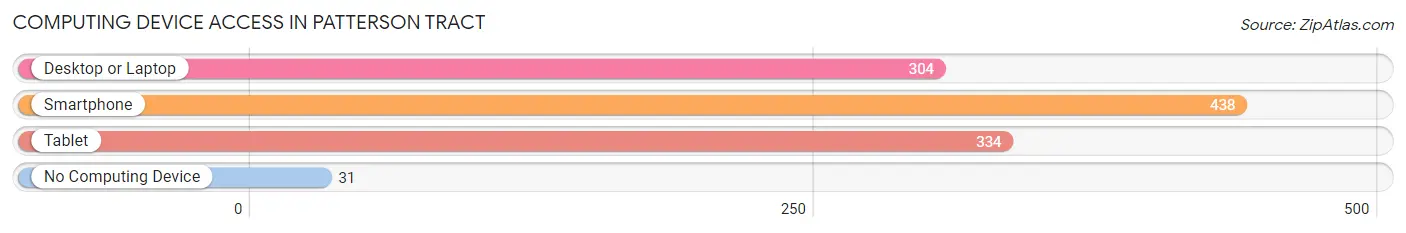
| Device Type | # Households | % Households |
| Desktop or Laptop | 304 | 58.1% |
| Smartphone | 438 | 83.8% |
| Tablet | 334 | 63.9% |
| No Computing Device | 31 | 5.9% |
| Total | 523 | 100.0% |
Internet Access in Patterson Tract
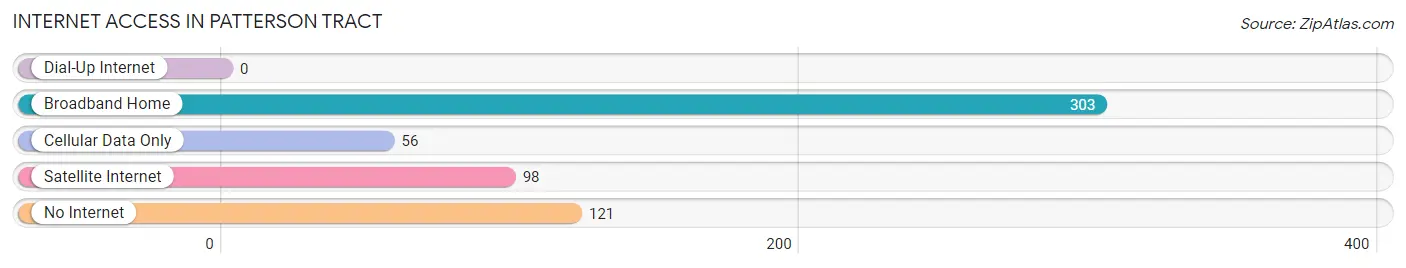
| Internet Type | # Households | % Households |
| Dial-Up Internet | 0 | 0.0% |
| Broadband Home | 303 | 57.9% |
| Cellular Data Only | 56 | 10.7% |
| Satellite Internet | 98 | 18.7% |
| No Internet | 121 | 23.1% |
| Total | 523 | 100.0% |
Patterson Tract Summary
Patterson Tract is a census-designated place (CDP) located in the San Joaquin Valley of California. It is situated in Fresno County, approximately 8 miles south of the city of Fresno. The population of Patterson Tract was 1,845 at the 2010 census.
Geography
Patterson Tract is located at 36°41'17" North, 119°45'17" West (36.688056, -119.754722). It has an area of 0.7 square miles, all of which is land.
The terrain of Patterson Tract is flat and mostly agricultural. The area is surrounded by orchards and vineyards, and is located in the heart of the San Joaquin Valley.
History
Patterson Tract was first settled in the late 19th century by the Patterson family, who were among the first settlers in the area. The family established a large ranch and farm in the area, which eventually became known as the Patterson Tract.
The area was officially recognized as a census designated place in the 1950s
Economy
The economy of Patterson Tract is largely based on agriculture. The area is home to numerous orchards and vineyards, as well as a variety of other agricultural businesses.
The area is also home to a number of small businesses, including restaurants, convenience stores, and other retail establishments.
Demographics
As of the 2010 census, the population of Patterson Tract was 1,845. The racial makeup of the area was 63.3% White, 0.7% African American, 0.7% Native American, 0.7% Asian, 0.1% Pacific Islander, 32.2% from other races, and 2.3% from two or more races. Hispanic or Latino of any race were 57.2% of the population.
The median household income in Patterson Tract was $37,917, and the median family income was $41,250. The per capita income was $14,945. About 18.2% of families and 22.2% of the population were below the poverty line, including 33.3% of those under age 18 and 10.2% of those age 65 or over.
Education
Patterson Tract is served by the Fresno Unified School District. The area is home to one elementary school, Patterson Elementary School, which serves students in grades K-5.
Conclusion
Patterson Tract is a small, rural community located in the San Joaquin Valley of California. The area is largely agricultural, and is home to numerous orchards and vineyards. The population of Patterson Tract was 1,845 at the 2010 census, and the area is served by the Fresno Unified School District. The economy of Patterson Tract is largely based on agriculture, and the area is also home to a number of small businesses.
Common Questions
What is Per Capita Income in Patterson Tract?
Per Capita income in Patterson Tract is $29,408.
What is the Median Family Income in Patterson Tract?
Median Family Income in Patterson Tract is $72,237.
What is the Median Household income in Patterson Tract?
Median Household Income in Patterson Tract is $83,750.
What is Income or Wage Gap in Patterson Tract?
Income or Wage Gap in Patterson Tract is 35.2%.
Women in Patterson Tract earn 64.8 cents for every dollar earned by a man.
What is Inequality or Gini Index in Patterson Tract?
Inequality or Gini Index in Patterson Tract is 0.38.
What is the Total Population of Patterson Tract?
Total Population of Patterson Tract is 1,645.
What is the Total Male Population of Patterson Tract?
Total Male Population of Patterson Tract is 868.
What is the Total Female Population of Patterson Tract?
Total Female Population of Patterson Tract is 777.
What is the Ratio of Males per 100 Females in Patterson Tract?
There are 111.71 Males per 100 Females in Patterson Tract.
What is the Ratio of Females per 100 Males in Patterson Tract?
There are 89.52 Females per 100 Males in Patterson Tract.
What is the Median Population Age in Patterson Tract?
Median Population Age in Patterson Tract is 36.2 Years.
What is the Average Family Size in Patterson Tract
Average Family Size in Patterson Tract is 3.1 People.
What is the Average Household Size in Patterson Tract
Average Household Size in Patterson Tract is 3.1 People.
How Large is the Labor Force in Patterson Tract?
There are 722 People in the Labor Forcein in Patterson Tract.
What is the Percentage of People in the Labor Force in Patterson Tract?
56.4% of People are in the Labor Force in Patterson Tract.
What is the Unemployment Rate in Patterson Tract?
Unemployment Rate in Patterson Tract is 4.0%.