Cities with the Highest Unemployment Rate Amomg Youth Under the Age of 25 in Indiana
RELATED REPORTS & OPTIONS
Highest Unemployment | Youth < 25
Indiana
Compare Cities
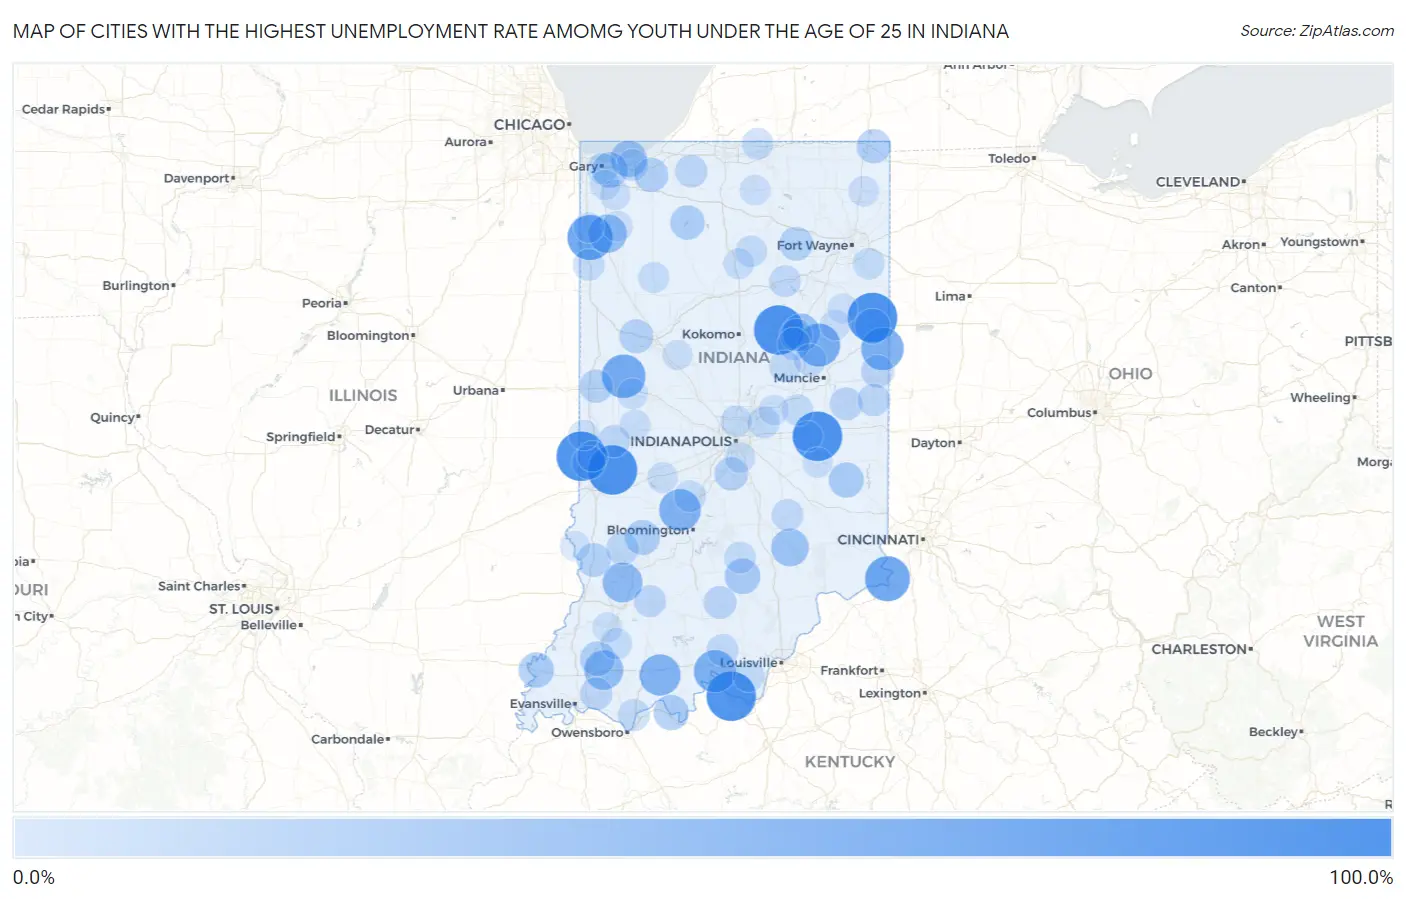
Map of Cities with the Highest Unemployment Rate Amomg Youth Under the Age of 25 in Indiana
0.0%
100.0%
Cities with the Highest Unemployment Rate Amomg Youth Under the Age of 25 in Indiana
| City | Youth Unemployment | vs State | vs National | |
| 1. | Herbst | 100.0% | 9.1%(+90.9)#1 | 10.9%(+89.1)#127 |
| 2. | Geneva | 100.0% | 9.1%(+90.9)#2 | 10.9%(+89.1)#151 |
| 3. | Dunreith | 100.0% | 9.1%(+90.9)#3 | 10.9%(+89.1)#188 |
| 4. | Blanford | 100.0% | 9.1%(+90.9)#4 | 10.9%(+89.1)#221 |
| 5. | Fontanet | 100.0% | 9.1%(+90.9)#5 | 10.9%(+89.1)#225 |
| 6. | Urbana | 100.0% | 9.1%(+90.9)#6 | 10.9%(+89.1)#248 |
| 7. | Boxley | 100.0% | 9.1%(+90.9)#7 | 10.9%(+89.1)#265 |
| 8. | Sardinia | 100.0% | 9.1%(+90.9)#8 | 10.9%(+89.1)#267 |
| 9. | Mauckport | 100.0% | 9.1%(+90.9)#9 | 10.9%(+89.1)#302 |
| 10. | Romney | 87.9% | 9.1%(+78.8)#10 | 10.9%(+77.0)#413 |
| 11. | Lake Village | 81.2% | 9.1%(+72.1)#11 | 10.9%(+70.3)#452 |
| 12. | Patriot | 80.0% | 9.1%(+70.9)#12 | 10.9%(+69.1)#459 |
| 13. | Thayer | 79.0% | 9.1%(+69.9)#13 | 10.9%(+68.1)#469 |
| 14. | Newtown | 75.0% | 9.1%(+65.9)#14 | 10.9%(+64.1)#511 |
| 15. | Shamrock Lakes | 72.3% | 9.1%(+63.2)#15 | 10.9%(+61.4)#550 |
| 16. | Salamonia | 70.0% | 9.1%(+60.9)#16 | 10.9%(+59.1)#584 |
| 17. | Leavenworth | 69.0% | 9.1%(+59.9)#17 | 10.9%(+58.1)#601 |
| 18. | Stinesville | 66.6% | 9.1%(+57.5)#18 | 10.9%(+55.7)#638 |
| 19. | St Meinrad | 64.7% | 9.1%(+55.6)#19 | 10.9%(+53.8)#674 |
| 20. | Plainville | 58.6% | 9.1%(+49.5)#20 | 10.9%(+47.7)#811 |
| 21. | Cree Lake | 58.6% | 9.1%(+49.5)#21 | 10.9%(+47.7)#812 |
| 22. | Lynnville | 55.9% | 9.1%(+46.8)#22 | 10.9%(+45.0)#886 |
| 23. | Roselawn | 53.6% | 9.1%(+44.5)#23 | 10.9%(+42.7)#968 |
| 24. | Gas City | 50.0% | 9.1%(+40.9)#24 | 10.9%(+39.1)#1,081 |
| 25. | Country Squire Lakes | 49.6% | 9.1%(+40.5)#25 | 10.9%(+38.7)#1,190 |
| 26. | Fairbanks | 45.8% | 9.1%(+36.7)#26 | 10.9%(+34.9)#1,326 |
| 27. | Dune Acres | 44.4% | 9.1%(+35.3)#27 | 10.9%(+33.5)#1,399 |
| 28. | Eden | 43.3% | 9.1%(+34.2)#28 | 10.9%(+32.4)#1,473 |
| 29. | Vallonia | 41.4% | 9.1%(+32.3)#29 | 10.9%(+30.5)#1,614 |
| 30. | Lake Station | 41.3% | 9.1%(+32.2)#30 | 10.9%(+30.4)#1,616 |
| 31. | Griffin | 40.0% | 9.1%(+30.9)#31 | 10.9%(+29.1)#1,712 |
| 32. | Cannelton | 39.9% | 9.1%(+30.8)#32 | 10.9%(+29.0)#1,721 |
| 33. | Bryant | 39.9% | 9.1%(+30.8)#33 | 10.9%(+29.0)#1,735 |
| 34. | Laurel | 39.5% | 9.1%(+30.4)#34 | 10.9%(+28.6)#1,750 |
| 35. | Worthington | 38.3% | 9.1%(+29.2)#35 | 10.9%(+27.4)#1,828 |
| 36. | Somerville | 37.5% | 9.1%(+28.4)#36 | 10.9%(+26.6)#1,896 |
| 37. | Bass Lake | 36.8% | 9.1%(+27.7)#37 | 10.9%(+25.9)#1,947 |
| 38. | Fremont | 36.0% | 9.1%(+26.9)#38 | 10.9%(+25.1)#2,013 |
| 39. | Keystone | 35.7% | 9.1%(+26.6)#39 | 10.9%(+24.8)#2,045 |
| 40. | Burney | 35.4% | 9.1%(+26.3)#40 | 10.9%(+24.5)#2,070 |
| 41. | Westville | 35.3% | 9.1%(+26.2)#41 | 10.9%(+24.4)#2,072 |
| 42. | Mineral Springs | 34.9% | 9.1%(+25.8)#42 | 10.9%(+24.0)#2,124 |
| 43. | Montmorenci | 34.6% | 9.1%(+25.5)#43 | 10.9%(+23.7)#2,148 |
| 44. | Carlisle | 34.4% | 9.1%(+25.3)#44 | 10.9%(+23.5)#2,166 |
| 45. | South Whitley | 34.0% | 9.1%(+24.9)#45 | 10.9%(+23.1)#2,199 |
| 46. | Bargersville | 33.4% | 9.1%(+24.3)#46 | 10.9%(+22.5)#2,237 |
| 47. | Universal | 33.3% | 9.1%(+24.2)#47 | 10.9%(+22.4)#2,306 |
| 48. | Covington | 32.8% | 9.1%(+23.7)#48 | 10.9%(+21.9)#2,370 |
| 49. | Saltillo | 30.7% | 9.1%(+21.6)#49 | 10.9%(+19.8)#2,605 |
| 50. | Losantville | 30.4% | 9.1%(+21.3)#50 | 10.9%(+19.5)#2,641 |
| 51. | Saratoga | 29.9% | 9.1%(+20.8)#51 | 10.9%(+19.0)#2,708 |
| 52. | Linton | 29.2% | 9.1%(+20.1)#52 | 10.9%(+18.3)#2,784 |
| 53. | Lynn | 29.1% | 9.1%(+20.0)#53 | 10.9%(+18.2)#2,802 |
| 54. | Chandler | 28.8% | 9.1%(+19.7)#54 | 10.9%(+17.9)#2,830 |
| 55. | Jonesboro | 28.7% | 9.1%(+19.6)#55 | 10.9%(+17.8)#2,848 |
| 56. | Fish Lake | 28.5% | 9.1%(+19.4)#56 | 10.9%(+17.6)#2,874 |
| 57. | Fairmount | 28.0% | 9.1%(+18.9)#57 | 10.9%(+17.1)#2,960 |
| 58. | Rockville | 27.2% | 9.1%(+18.1)#58 | 10.9%(+16.3)#3,071 |
| 59. | Loogootee | 27.1% | 9.1%(+18.0)#59 | 10.9%(+16.2)#3,099 |
| 60. | Gaston | 27.0% | 9.1%(+17.9)#60 | 10.9%(+16.1)#3,125 |
| 61. | Chesterton | 26.7% | 9.1%(+17.6)#61 | 10.9%(+15.8)#3,153 |
| 62. | Mccordsville | 26.4% | 9.1%(+17.3)#62 | 10.9%(+15.5)#3,216 |
| 63. | Rockport | 26.4% | 9.1%(+17.3)#63 | 10.9%(+15.5)#3,220 |
| 64. | Lagro | 26.3% | 9.1%(+17.2)#64 | 10.9%(+15.4)#3,249 |
| 65. | Hartsville | 26.3% | 9.1%(+17.2)#65 | 10.9%(+15.4)#3,254 |
| 66. | Milltown | 25.9% | 9.1%(+16.8)#66 | 10.9%(+15.0)#3,327 |
| 67. | Orestes | 25.6% | 9.1%(+16.5)#67 | 10.9%(+14.7)#3,384 |
| 68. | Paragon | 25.5% | 9.1%(+16.4)#68 | 10.9%(+14.6)#3,392 |
| 69. | Freetown | 25.5% | 9.1%(+16.4)#69 | 10.9%(+14.6)#3,396 |
| 70. | Hoagland | 25.4% | 9.1%(+16.3)#70 | 10.9%(+14.5)#3,408 |
| 71. | Morocco | 25.2% | 9.1%(+16.1)#71 | 10.9%(+14.3)#3,440 |
| 72. | Akron | 25.0% | 9.1%(+15.9)#72 | 10.9%(+14.1)#3,467 |
| 73. | New Middletown | 25.0% | 9.1%(+15.9)#73 | 10.9%(+14.1)#3,512 |
| 74. | Williams Creek | 24.9% | 9.1%(+15.8)#74 | 10.9%(+14.0)#3,539 |
| 75. | Simonton Lake | 24.6% | 9.1%(+15.5)#75 | 10.9%(+13.7)#3,582 |
| 76. | Markleville | 24.6% | 9.1%(+15.5)#76 | 10.9%(+13.7)#3,595 |
| 77. | Winslow | 24.3% | 9.1%(+15.2)#77 | 10.9%(+13.4)#3,652 |
| 78. | Gary | 23.9% | 9.1%(+14.8)#78 | 10.9%(+13.0)#3,705 |
| 79. | Monon | 23.0% | 9.1%(+13.9)#79 | 10.9%(+12.1)#3,926 |
| 80. | Waynetown | 22.8% | 9.1%(+13.7)#80 | 10.9%(+11.9)#3,991 |
| 81. | Macy | 22.7% | 9.1%(+13.6)#81 | 10.9%(+11.8)#4,014 |
| 82. | Waveland | 22.5% | 9.1%(+13.4)#82 | 10.9%(+11.6)#4,056 |
| 83. | Cloverdale | 21.9% | 9.1%(+12.8)#83 | 10.9%(+11.0)#4,214 |
| 84. | Southport | 21.6% | 9.1%(+12.5)#84 | 10.9%(+10.7)#4,281 |
| 85. | Waterloo | 21.5% | 9.1%(+12.4)#85 | 10.9%(+10.6)#4,311 |
| 86. | Lakes Of The Four Seasons | 21.4% | 9.1%(+12.3)#86 | 10.9%(+10.5)#4,323 |
| 87. | Clinton | 21.4% | 9.1%(+12.3)#87 | 10.9%(+10.5)#4,328 |
| 88. | Dana | 21.4% | 9.1%(+12.3)#88 | 10.9%(+10.5)#4,344 |
| 89. | Knightstown | 21.3% | 9.1%(+12.2)#89 | 10.9%(+10.4)#4,370 |
| 90. | De Motte | 21.1% | 9.1%(+12.0)#90 | 10.9%(+10.2)#4,411 |
| 91. | Montpelier | 21.1% | 9.1%(+12.0)#91 | 10.9%(+10.2)#4,418 |
| 92. | Schneider | 20.8% | 9.1%(+11.7)#92 | 10.9%(+9.90)#4,519 |
| 93. | Nappanee | 20.6% | 9.1%(+11.5)#93 | 10.9%(+9.70)#4,541 |
| 94. | Ingalls | 20.4% | 9.1%(+11.3)#94 | 10.9%(+9.50)#4,596 |
| 95. | Mulberry | 20.3% | 9.1%(+11.2)#95 | 10.9%(+9.40)#4,629 |
| 96. | Rushville | 20.2% | 9.1%(+11.1)#96 | 10.9%(+9.30)#4,644 |
| 97. | Merom | 20.0% | 9.1%(+10.9)#97 | 10.9%(+9.10)#4,730 |
| 98. | Poneto | 20.0% | 9.1%(+10.9)#98 | 10.9%(+9.10)#4,732 |
| 99. | Merrillville | 19.8% | 9.1%(+10.7)#99 | 10.9%(+8.90)#4,803 |
| 100. | Petersburg | 19.5% | 9.1%(+10.4)#100 | 10.9%(+8.60)#4,876 |
Common Questions
What are the Top 10 Cities with the Highest Unemployment Rate Amomg Youth Under the Age of 25 in Indiana?
Top 10 Cities with the Highest Unemployment Rate Amomg Youth Under the Age of 25 in Indiana are:
#1
100.0%
#2
100.0%
#3
100.0%
#4
100.0%
#5
100.0%
#6
100.0%
#7
81.2%
#8
80.0%
#9
75.0%
#10
72.3%
What city has the Highest Unemployment Rate Amomg Youth Under the Age of 25 in Indiana?
Herbst has the Highest Unemployment Rate Amomg Youth Under the Age of 25 in Indiana with 100.0%.
What is the Unemployment Rate Amomg Youth Under the Age of 25 in the State of Indiana?
Unemployment Rate Amomg Youth Under the Age of 25 in Indiana is 9.1%.
What is the Unemployment Rate Amomg Youth Under the Age of 25 in the United States?
Unemployment Rate Amomg Youth Under the Age of 25 in the United States is 10.9%.