Westley, CA Map & Demographics
Westley Map
Westley Overview
$10,642
PER CAPITA INCOME
$29,464
AVG HOUSEHOLD INCOME
0.36
INEQUALITY / GINI INDEX
602
TOTAL POPULATION
370
MALE POPULATION
232
FEMALE POPULATION
159.48
MALES / 100 FEMALES
62.70
FEMALES / 100 MALES
24.3
MEDIAN AGE
3.7
AVG FAMILY SIZE
3.8
AVG HOUSEHOLD SIZE
201
LABOR FORCE [ PEOPLE ]
56.5%
PERCENT IN LABOR FORCE
59.7%
UNEMPLOYMENT RATE
Westley Zip Codes
Westley Area Codes
Income in Westley
Income Overview in Westley
| Characteristic | Number | Measure |
| Per Capita Income | 602 | $10,642 |
| Median Family Income | 157 | $0 |
| Mean Family Income | 157 | $34,223 |
| Median Household Income | 157 | $29,464 |
| Mean Household Income | 157 | $38,074 |
| Income Deficit | 157 | $0 |
| Wage / Income Gap (%) | 602 | 0.00% |
| Wage / Income Gap ($) | 602 | 100.00¢ per $1 |
| Gini / Inequality Index | 602 | 0.36 |
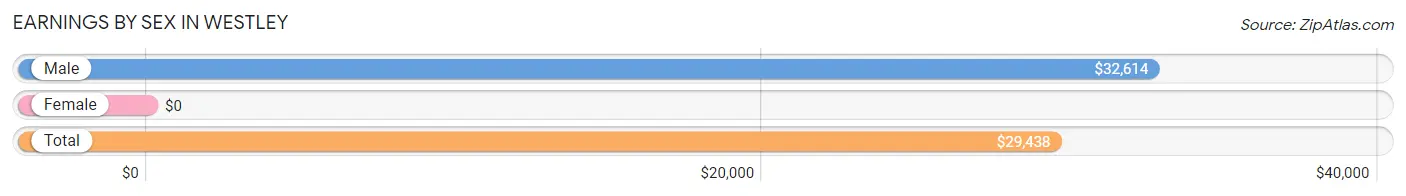
Earnings by Sex in Westley
| Sex | Number | Average Earnings |
| Male | 82 (45.6%) | $32,614 |
| Female | 98 (54.4%) | $0 |
| Total | 180 (100.0%) | $29,438 |
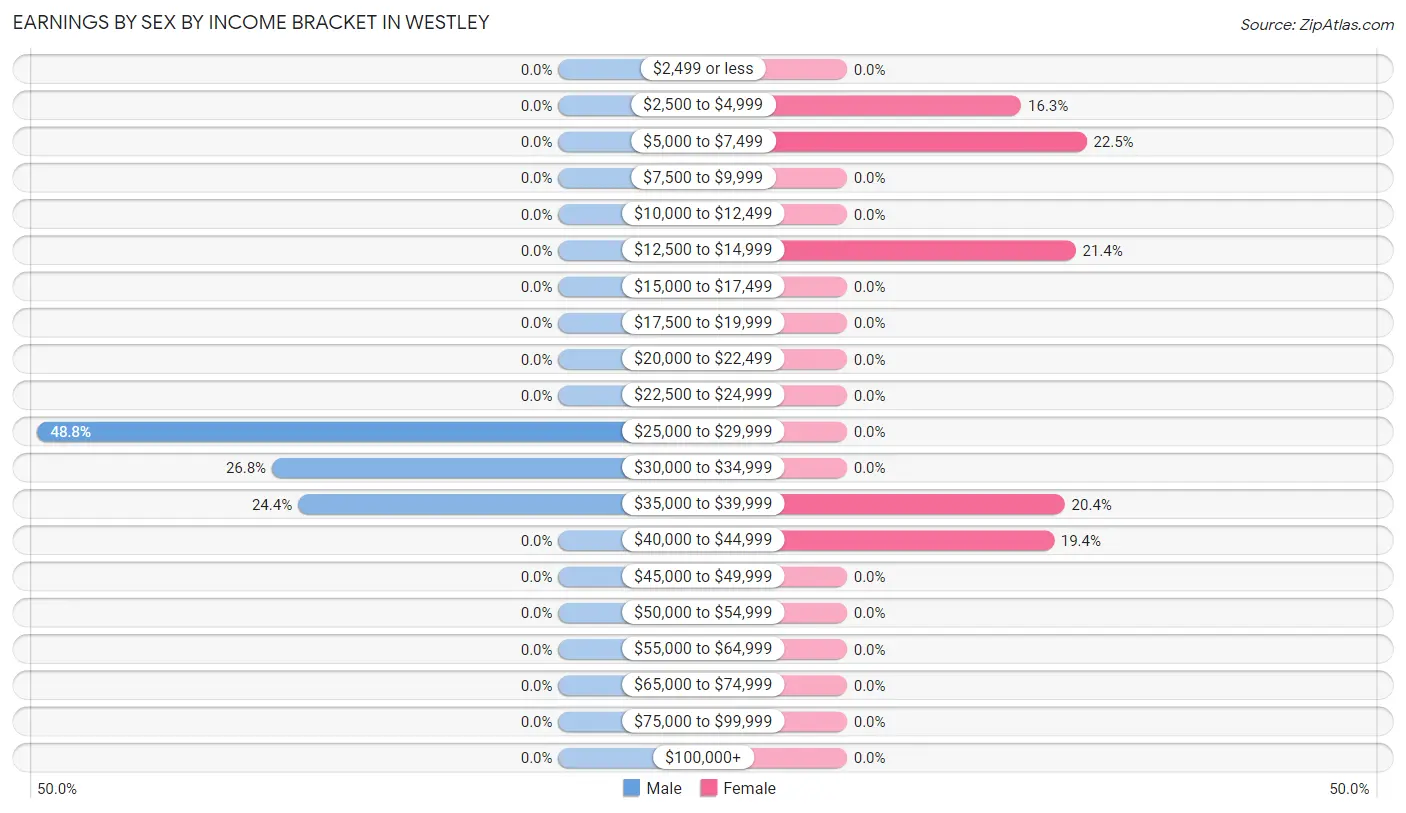
Earnings by Sex by Income Bracket in Westley
The most common earnings brackets in Westley are $25,000 to $29,999 for men (40 | 48.8%) and $5,000 to $7,499 for women (22 | 22.5%).
| Income | Male | Female |
| $2,499 or less | 0 (0.0%) | 0 (0.0%) |
| $2,500 to $4,999 | 0 (0.0%) | 16 (16.3%) |
| $5,000 to $7,499 | 0 (0.0%) | 22 (22.5%) |
| $7,500 to $9,999 | 0 (0.0%) | 0 (0.0%) |
| $10,000 to $12,499 | 0 (0.0%) | 0 (0.0%) |
| $12,500 to $14,999 | 0 (0.0%) | 21 (21.4%) |
| $15,000 to $17,499 | 0 (0.0%) | 0 (0.0%) |
| $17,500 to $19,999 | 0 (0.0%) | 0 (0.0%) |
| $20,000 to $22,499 | 0 (0.0%) | 0 (0.0%) |
| $22,500 to $24,999 | 0 (0.0%) | 0 (0.0%) |
| $25,000 to $29,999 | 40 (48.8%) | 0 (0.0%) |
| $30,000 to $34,999 | 22 (26.8%) | 0 (0.0%) |
| $35,000 to $39,999 | 20 (24.4%) | 20 (20.4%) |
| $40,000 to $44,999 | 0 (0.0%) | 19 (19.4%) |
| $45,000 to $49,999 | 0 (0.0%) | 0 (0.0%) |
| $50,000 to $54,999 | 0 (0.0%) | 0 (0.0%) |
| $55,000 to $64,999 | 0 (0.0%) | 0 (0.0%) |
| $65,000 to $74,999 | 0 (0.0%) | 0 (0.0%) |
| $75,000 to $99,999 | 0 (0.0%) | 0 (0.0%) |
| $100,000+ | 0 (0.0%) | 0 (0.0%) |
| Total | 82 (100.0%) | 98 (100.0%) |
Earnings by Sex by Educational Attainment in Westley
| Educational Attainment | Male Income | Female Income |
| Less than High School | - | - |
| High School Diploma | - | - |
| College or Associate's Degree | - | - |
| Bachelor's Degree | - | - |
| Graduate Degree | - | - |
| Total | $29,438 | $0 |
Family Income in Westley
Family Income Brackets in Westley
According to the Westley family income data, there are 40 families falling into the $10,000 to $14,999 income range, which is the most common income bracket and makes up 25.5% of all families.
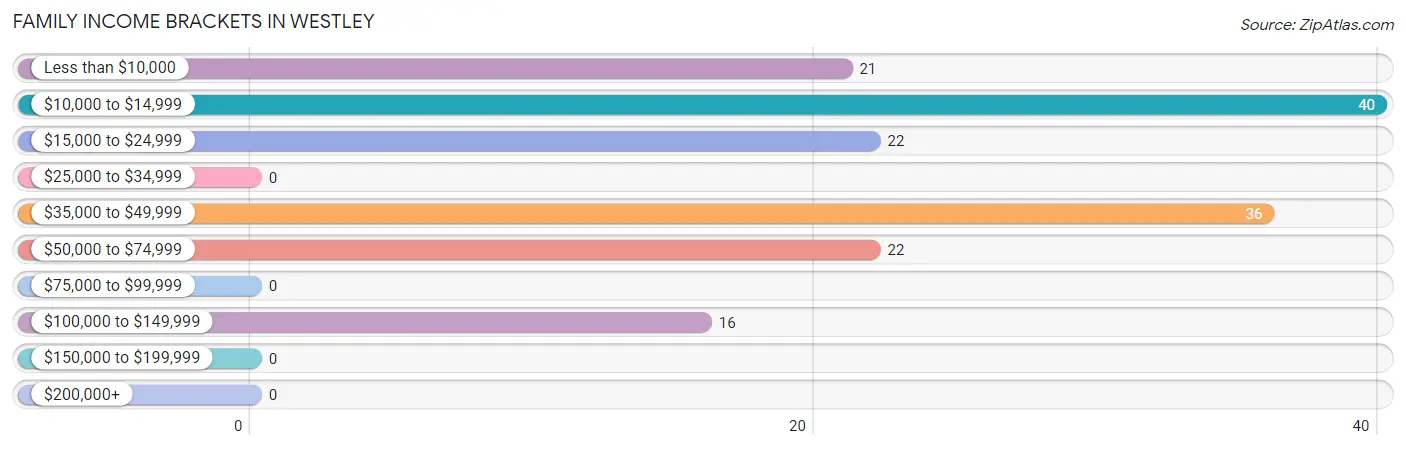
| Income Bracket | # Families | % Families |
| Less than $10,000 | 21 | 13.4% |
| $10,000 to $14,999 | 40 | 25.5% |
| $15,000 to $24,999 | 22 | 14.0% |
| $25,000 to $34,999 | 0 | 0.0% |
| $35,000 to $49,999 | 36 | 22.9% |
| $50,000 to $74,999 | 22 | 14.0% |
| $75,000 to $99,999 | 0 | 0.0% |
| $100,000 to $149,999 | 16 | 10.2% |
| $150,000 to $199,999 | 0 | 0.0% |
| $200,000+ | 0 | 0.0% |
Family Income by Famaliy Size in Westley
| Income Bracket | # Families | Median Income |
| 2-Person Families | 84 (53.5%) | $0 |
| 3-Person Families | 19 (12.1%) | $0 |
| 4-Person Families | 0 (0.0%) | $0 |
| 5-Person Families | 21 (13.4%) | $0 |
| 6-Person Families | 16 (10.2%) | $0 |
| 7+ Person Families | 17 (10.8%) | $0 |
| Total | 157 (100.0%) | $0 |
Family Income by Number of Earners in Westley
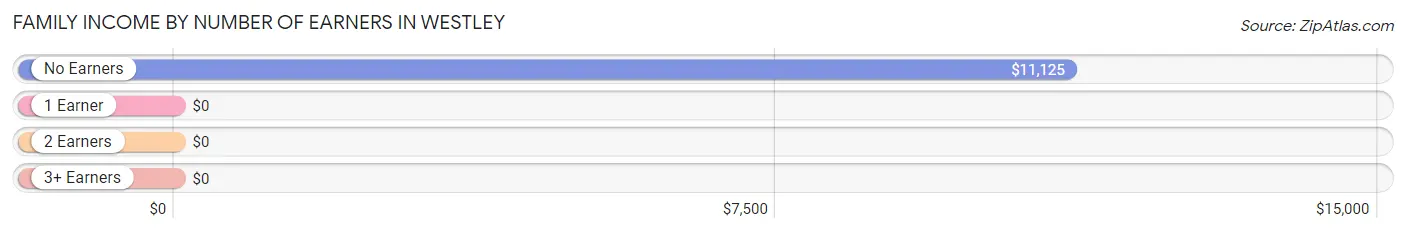
| Number of Earners | # Families | Median Income |
| No Earners | 78 (49.7%) | $11,125 |
| 1 Earner | 41 (26.1%) | $0 |
| 2 Earners | 22 (14.0%) | $0 |
| 3+ Earners | 16 (10.2%) | $0 |
| Total | 157 (100.0%) | $0 |
Household Income in Westley
Household Income Brackets in Westley
With 40 households falling in the category, the $10,000 to $14,999 income range is the most frequent in Westley, accounting for 25.5% of all households.
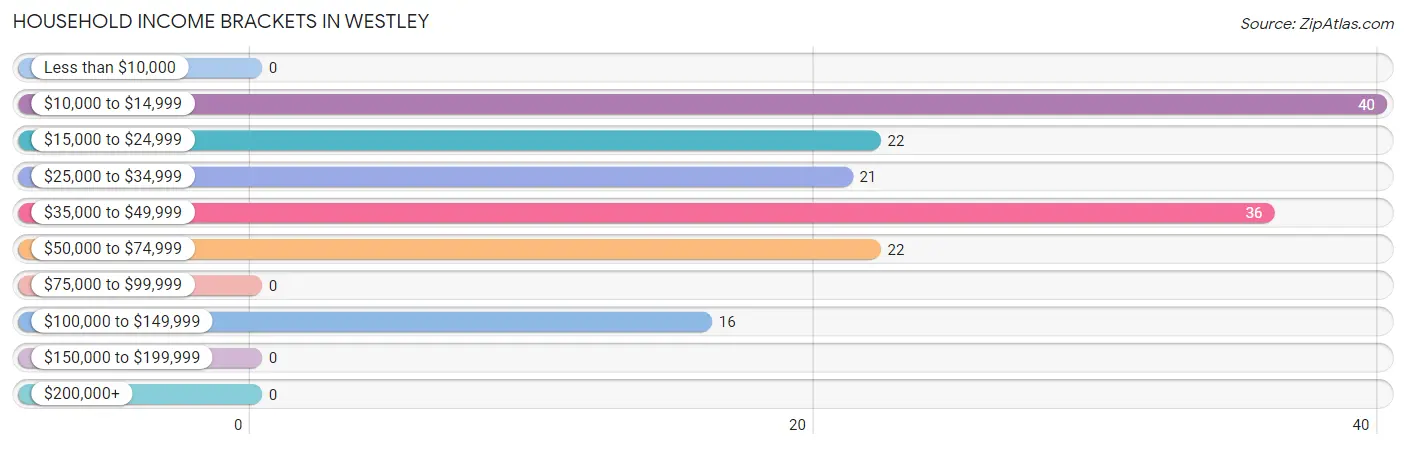
| Income Bracket | # Households | % Households |
| Less than $10,000 | 0 | 0.0% |
| $10,000 to $14,999 | 40 | 25.5% |
| $15,000 to $24,999 | 22 | 14.0% |
| $25,000 to $34,999 | 21 | 13.4% |
| $35,000 to $49,999 | 36 | 22.9% |
| $50,000 to $74,999 | 22 | 14.0% |
| $75,000 to $99,999 | 0 | 0.0% |
| $100,000 to $149,999 | 16 | 10.2% |
| $150,000 to $199,999 | 0 | 0.0% |
| $200,000+ | 0 | 0.0% |
Household Income by Householder Age in Westley
| Income Bracket | # Households | Median Income |
| 15 to 24 Years | 21 (13.4%) | $0 |
| 25 to 44 Years | 36 (22.9%) | $0 |
| 45 to 64 Years | 79 (50.3%) | $0 |
| 65+ Years | 21 (13.4%) | $0 |
| Total | 157 (100.0%) | $29,464 |
Poverty in Westley
Income Below Poverty by Sex and Age in Westley
With 34.1% poverty level for males and 25.0% for females among the residents of Westley, 5 year old males and 65 to 74 year old females are the most vulnerable to poverty, with 21 males (100.0%) and 37 females (100.0%) in their respective age groups living below the poverty level.
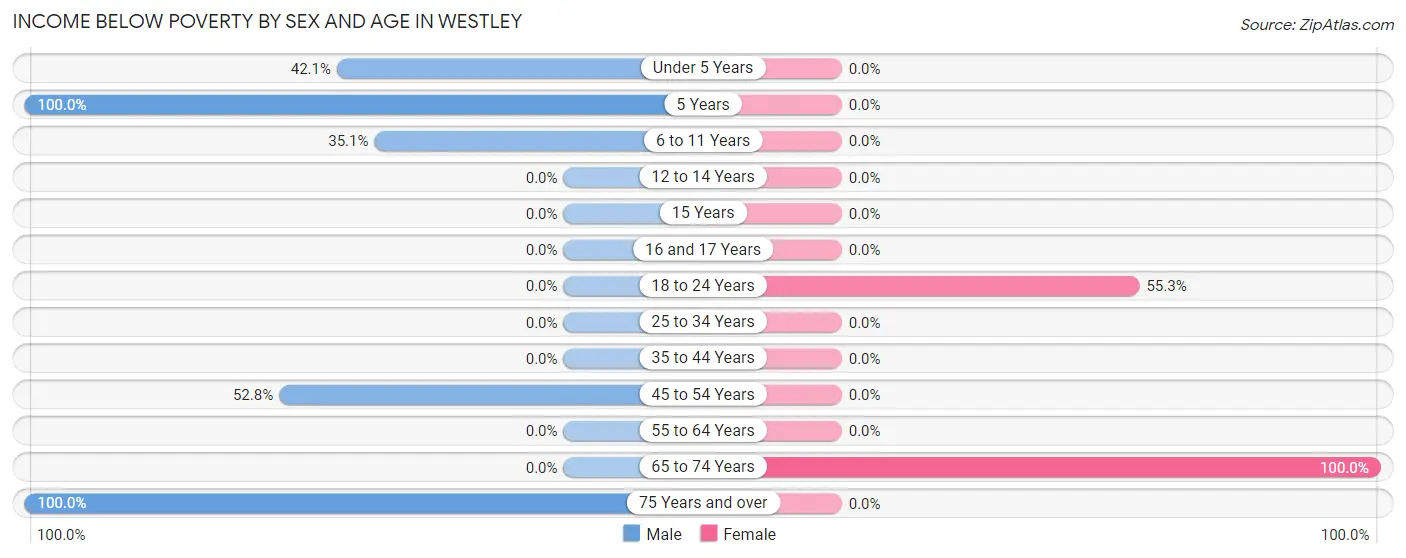
| Age Bracket | Male | Female |
| Under 5 Years | 45 (42.1%) | 0 (0.0%) |
| 5 Years | 21 (100.0%) | 0 (0.0%) |
| 6 to 11 Years | 20 (35.1%) | 0 (0.0%) |
| 12 to 14 Years | 0 (0.0%) | 0 (0.0%) |
| 15 Years | 0 (0.0%) | 0 (0.0%) |
| 16 and 17 Years | 0 (0.0%) | 0 (0.0%) |
| 18 to 24 Years | 0 (0.0%) | 21 (55.3%) |
| 25 to 34 Years | 0 (0.0%) | 0 (0.0%) |
| 35 to 44 Years | 0 (0.0%) | 0 (0.0%) |
| 45 to 54 Years | 19 (52.8%) | 0 (0.0%) |
| 55 to 64 Years | 0 (0.0%) | 0 (0.0%) |
| 65 to 74 Years | 0 (0.0%) | 37 (100.0%) |
| 75 Years and over | 21 (100.0%) | 0 (0.0%) |
| Total | 126 (34.1%) | 58 (25.0%) |
Income Above Poverty by Sex and Age in Westley
According to the poverty statistics in Westley, males aged 12 to 14 years and females aged 5 years are the age groups that are most secure financially, with 100.0% of males and 100.0% of females in these age groups living above the poverty line.
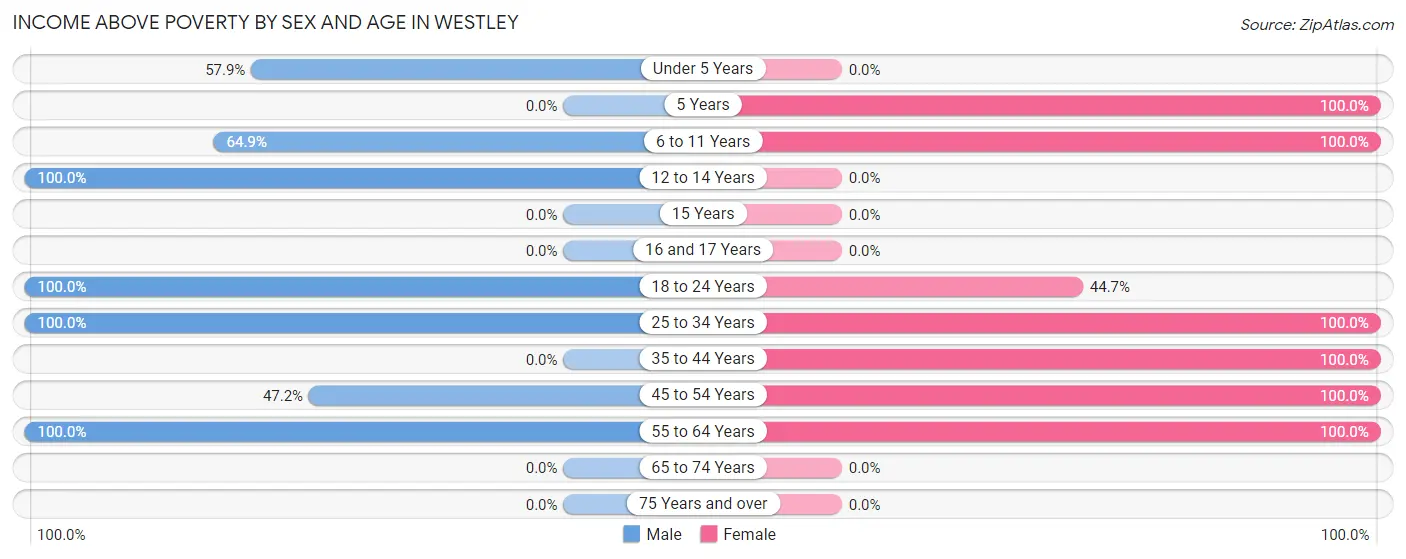
| Age Bracket | Male | Female |
| Under 5 Years | 62 (57.9%) | 0 (0.0%) |
| 5 Years | 0 (0.0%) | 20 (100.0%) |
| 6 to 11 Years | 37 (64.9%) | 22 (100.0%) |
| 12 to 14 Years | 19 (100.0%) | 0 (0.0%) |
| 15 Years | 0 (0.0%) | 0 (0.0%) |
| 16 and 17 Years | 0 (0.0%) | 0 (0.0%) |
| 18 to 24 Years | 44 (100.0%) | 17 (44.7%) |
| 25 to 34 Years | 43 (100.0%) | 37 (100.0%) |
| 35 to 44 Years | 0 (0.0%) | 19 (100.0%) |
| 45 to 54 Years | 17 (47.2%) | 16 (100.0%) |
| 55 to 64 Years | 22 (100.0%) | 43 (100.0%) |
| 65 to 74 Years | 0 (0.0%) | 0 (0.0%) |
| 75 Years and over | 0 (0.0%) | 0 (0.0%) |
| Total | 244 (65.9%) | 174 (75.0%) |
Income Below Poverty Among Married-Couple Families in Westley
The poverty statistics for married-couple families in Westley show that 42.1% or 40 of the total 95 families live below the poverty line. Families with no children have the highest poverty rate of 64.5%, comprising of 40 families. On the other hand, families with 1 or 2 children have the lowest poverty rate of 0.0%, which includes 0 families.
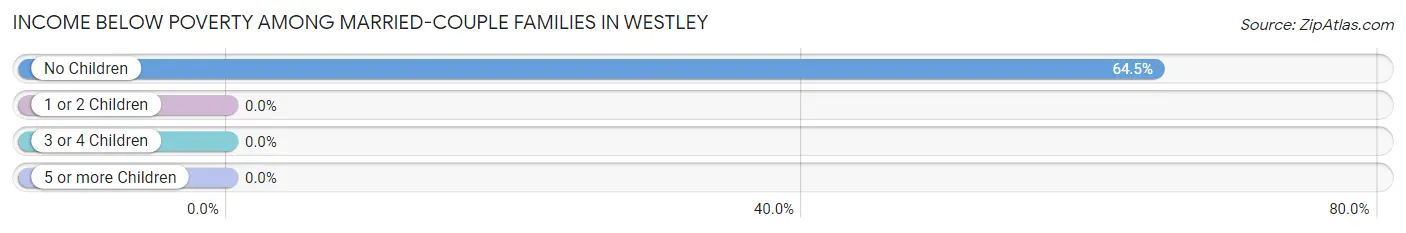
| Children | Above Poverty | Below Poverty |
| No Children | 22 (35.5%) | 40 (64.5%) |
| 1 or 2 Children | 16 (100.0%) | 0 (0.0%) |
| 3 or 4 Children | 0 (0.0%) | 0 (0.0%) |
| 5 or more Children | 17 (100.0%) | 0 (0.0%) |
| Total | 55 (57.9%) | 40 (42.1%) |
Income Below Poverty Among Single-Parent Households in Westley
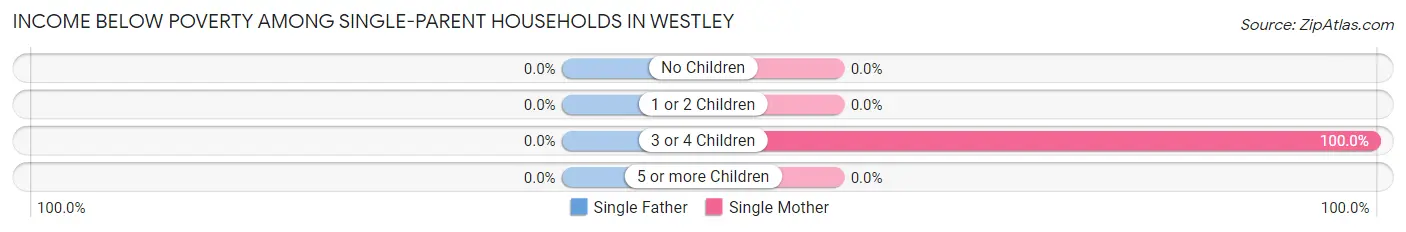
| Children | Single Father | Single Mother |
| No Children | 0 (0.0%) | 0 (0.0%) |
| 1 or 2 Children | 0 (0.0%) | 0 (0.0%) |
| 3 or 4 Children | 0 (0.0%) | 21 (100.0%) |
| 5 or more Children | 0 (0.0%) | 0 (0.0%) |
| Total | 0 (0.0%) | 21 (33.9%) |
Income Below Poverty Among Married-Couple vs Single-Parent Households in Westley
The poverty data for Westley shows that 40 of the married-couple family households (42.1%) and 21 of the single-parent households (33.9%) are living below the poverty level. Within the married-couple family households, those with no children have the highest poverty rate, with 40 households (64.5%) falling below the poverty line. Among the single-parent households, those with 3 or 4 children have the highest poverty rate, with 21 household (100.0%) living below poverty.
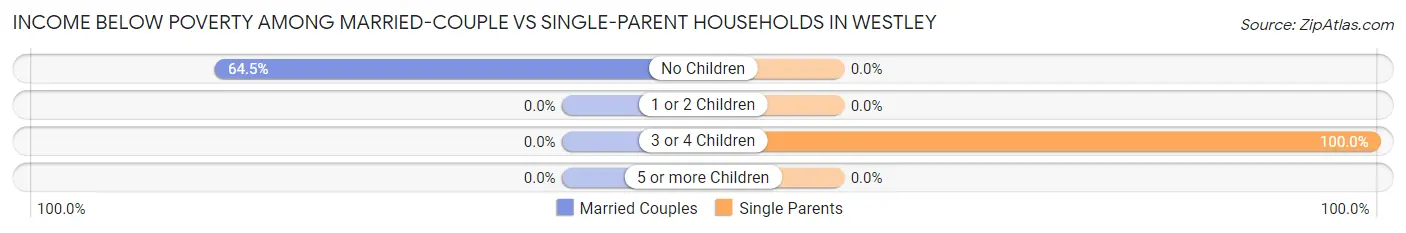
| Children | Married-Couple Families | Single-Parent Households |
| No Children | 40 (64.5%) | 0 (0.0%) |
| 1 or 2 Children | 0 (0.0%) | 0 (0.0%) |
| 3 or 4 Children | 0 (0.0%) | 21 (100.0%) |
| 5 or more Children | 0 (0.0%) | 0 (0.0%) |
| Total | 40 (42.1%) | 21 (33.9%) |
Race in Westley
The most populous races in Westley are Hispanic or Latino (602 | 100.0%), Two or more Races (301 | 50.0%), and White / Caucasian (255 | 42.4%).
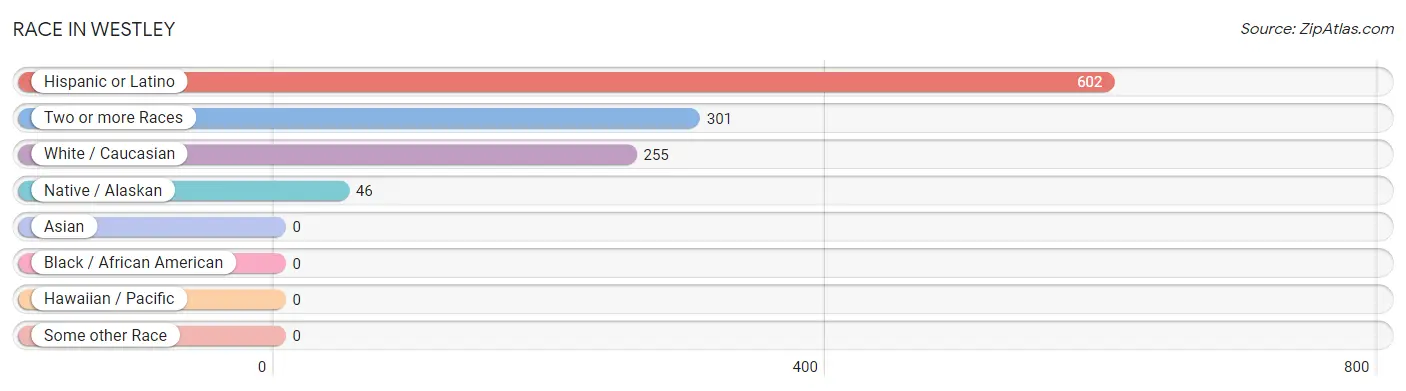
| Race | # Population | % Population |
| Asian | 0 | 0.0% |
| Black / African American | 0 | 0.0% |
| Hawaiian / Pacific | 0 | 0.0% |
| Hispanic or Latino | 602 | 100.0% |
| Native / Alaskan | 46 | 7.6% |
| White / Caucasian | 255 | 42.4% |
| Two or more Races | 301 | 50.0% |
| Some other Race | 0 | 0.0% |
| Total | 602 | 100.0% |
Ancestry in Westley
The most populous ancestries reported in Westley are , and Mexican (602 | 100.0%), together accounting for 100.0% of all Westley residents.

| Ancestry | # Population | % Population |
| Mexican | 602 | 100.0% | View All 1 Rows |
Immigrants in Westley
The most numerous immigrant groups reported in Westley came from Central America (272 | 45.2%), Latin America (272 | 45.2%), and Mexico (272 | 45.2%), together accounting for 135.5% of all Westley residents.
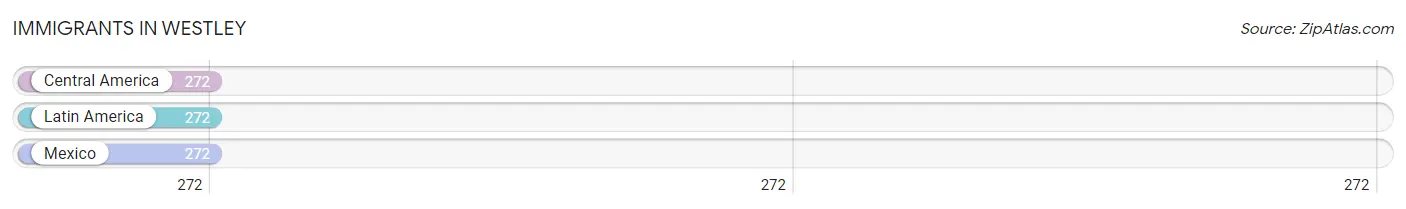
| Immigration Origin | # Population | % Population |
| Central America | 272 | 45.2% |
| Latin America | 272 | 45.2% |
| Mexico | 272 | 45.2% | View All 3 Rows |
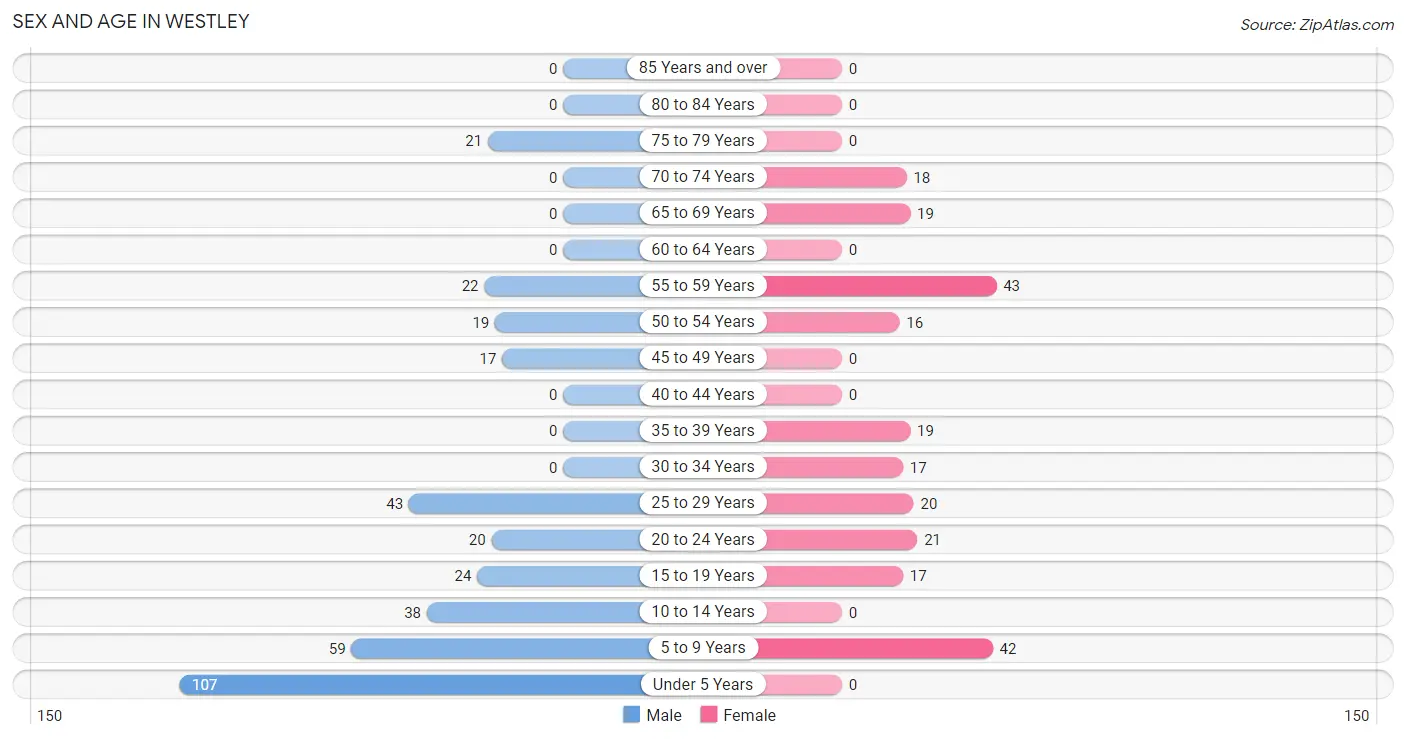
Sex and Age in Westley
Sex and Age in Westley
The most populous age groups in Westley are Under 5 Years (107 | 28.9%) for men and 55 to 59 Years (43 | 18.5%) for women.
| Age Bracket | Male | Female |
| Under 5 Years | 107 (28.9%) | 0 (0.0%) |
| 5 to 9 Years | 59 (16.0%) | 42 (18.1%) |
| 10 to 14 Years | 38 (10.3%) | 0 (0.0%) |
| 15 to 19 Years | 24 (6.5%) | 17 (7.3%) |
| 20 to 24 Years | 20 (5.4%) | 21 (9.0%) |
| 25 to 29 Years | 43 (11.6%) | 20 (8.6%) |
| 30 to 34 Years | 0 (0.0%) | 17 (7.3%) |
| 35 to 39 Years | 0 (0.0%) | 19 (8.2%) |
| 40 to 44 Years | 0 (0.0%) | 0 (0.0%) |
| 45 to 49 Years | 17 (4.6%) | 0 (0.0%) |
| 50 to 54 Years | 19 (5.1%) | 16 (6.9%) |
| 55 to 59 Years | 22 (5.9%) | 43 (18.5%) |
| 60 to 64 Years | 0 (0.0%) | 0 (0.0%) |
| 65 to 69 Years | 0 (0.0%) | 19 (8.2%) |
| 70 to 74 Years | 0 (0.0%) | 18 (7.8%) |
| 75 to 79 Years | 21 (5.7%) | 0 (0.0%) |
| 80 to 84 Years | 0 (0.0%) | 0 (0.0%) |
| 85 Years and over | 0 (0.0%) | 0 (0.0%) |
| Total | 370 (100.0%) | 232 (100.0%) |
Families and Households in Westley
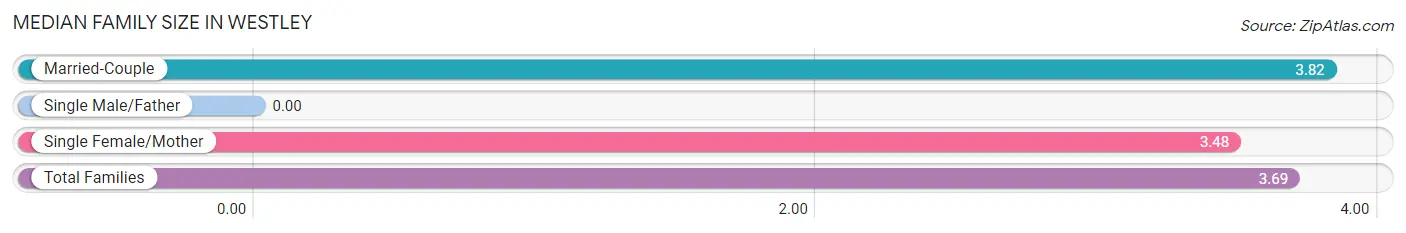
Median Family Size in Westley
| Family Type | # Families | Family Size |
| Married-Couple | 95 (60.5%) | 3.82 |
| Single Male/Father | 0 (0.0%) | - |
| Single Female/Mother | 62 (39.5%) | 3.48 |
| Total Families | 157 (100.0%) | 3.69 |
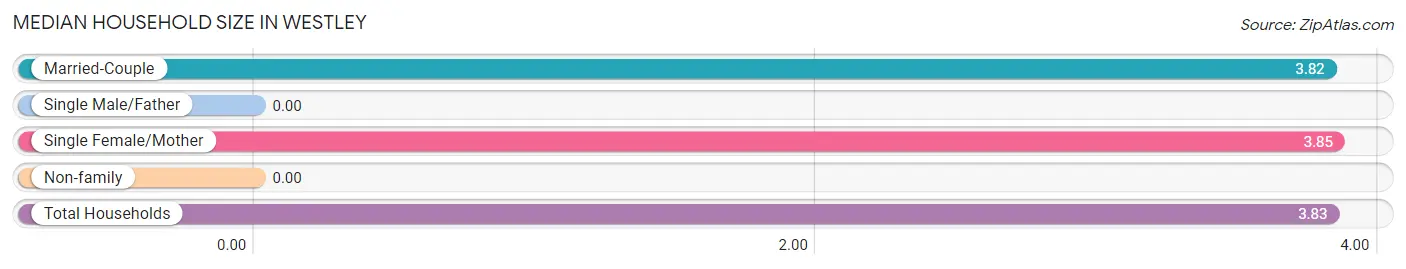
Median Household Size in Westley
| Household Type | # Households | Household Size |
| Married-Couple | 95 (60.5%) | 3.82 |
| Single Male/Father | 0 (0.0%) | - |
| Single Female/Mother | 62 (39.5%) | 3.85 |
| Non-family | 0 (0.0%) | - |
| Total Households | 157 (100.0%) | 3.83 |
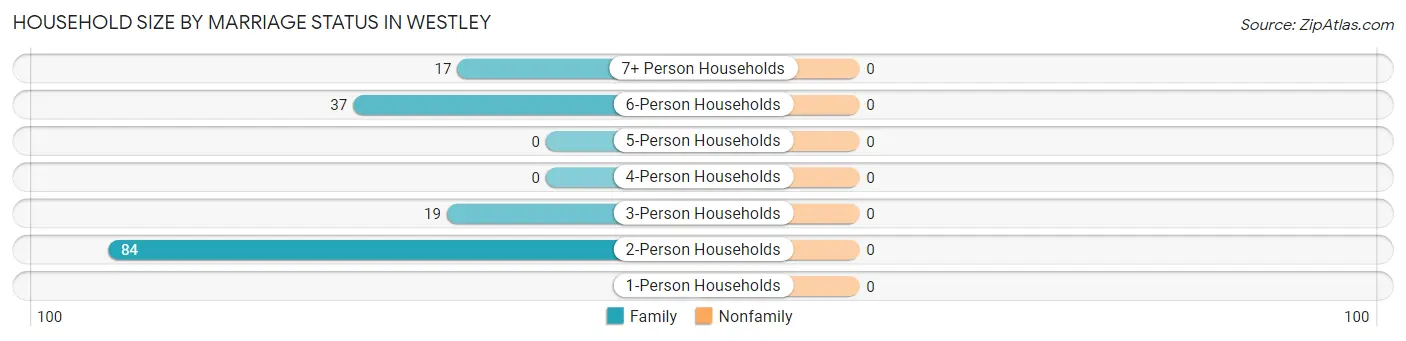
Household Size by Marriage Status in Westley
| Household Size | Family Households | Nonfamily Households |
| 1-Person Households | - | 0 (0.0%) |
| 2-Person Households | 84 (53.5%) | 0 (0.0%) |
| 3-Person Households | 19 (12.1%) | 0 (0.0%) |
| 4-Person Households | 0 (0.0%) | 0 (0.0%) |
| 5-Person Households | 0 (0.0%) | 0 (0.0%) |
| 6-Person Households | 37 (23.6%) | 0 (0.0%) |
| 7+ Person Households | 17 (10.8%) | 0 (0.0%) |
| Total | 157 (100.0%) | 0 (0.0%) |
Female Fertility in Westley
Fertility by Age in Westley
Average fertility rate in Westley is 181.0 births per 1,000 women. Women in the age bracket of 20 to 34 years have the highest fertility rate with 293.0 births per 1,000 women. Women in the age bracket of 20 to 34 years acount for 100.0% of all women with births.
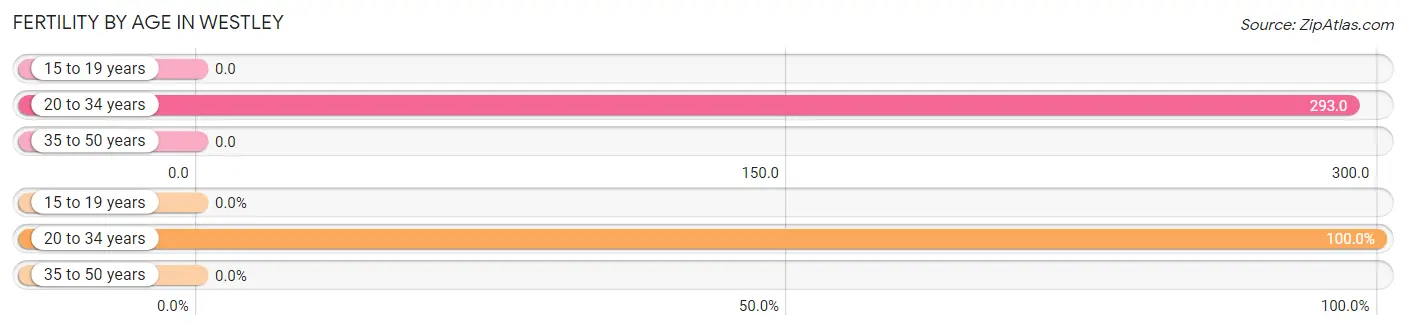
| Age Bracket | Women with Births | Births / 1,000 Women |
| 15 to 19 years | 0 (0.0%) | 0.0 |
| 20 to 34 years | 17 (100.0%) | 293.0 |
| 35 to 50 years | 0 (0.0%) | 0.0 |
| Total | 17 (100.0%) | 181.0 |
Fertility by Age by Marriage Status in Westley
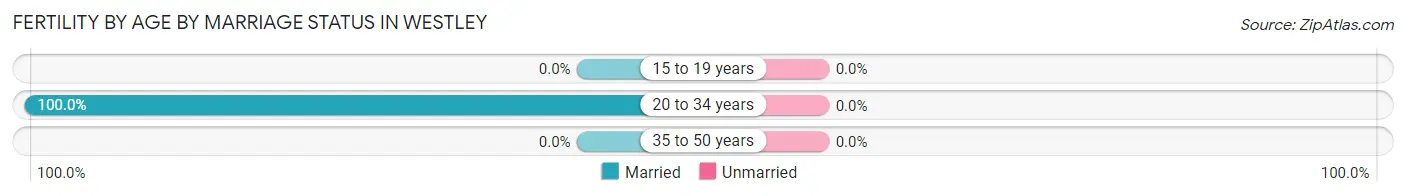
| Age Bracket | Married | Unmarried |
| 15 to 19 years | 0 (0.0%) | 0 (0.0%) |
| 20 to 34 years | 17 (100.0%) | 0 (0.0%) |
| 35 to 50 years | 0 (0.0%) | 0 (0.0%) |
| Total | 17 (100.0%) | 0 (0.0%) |
Fertility by Education in Westley
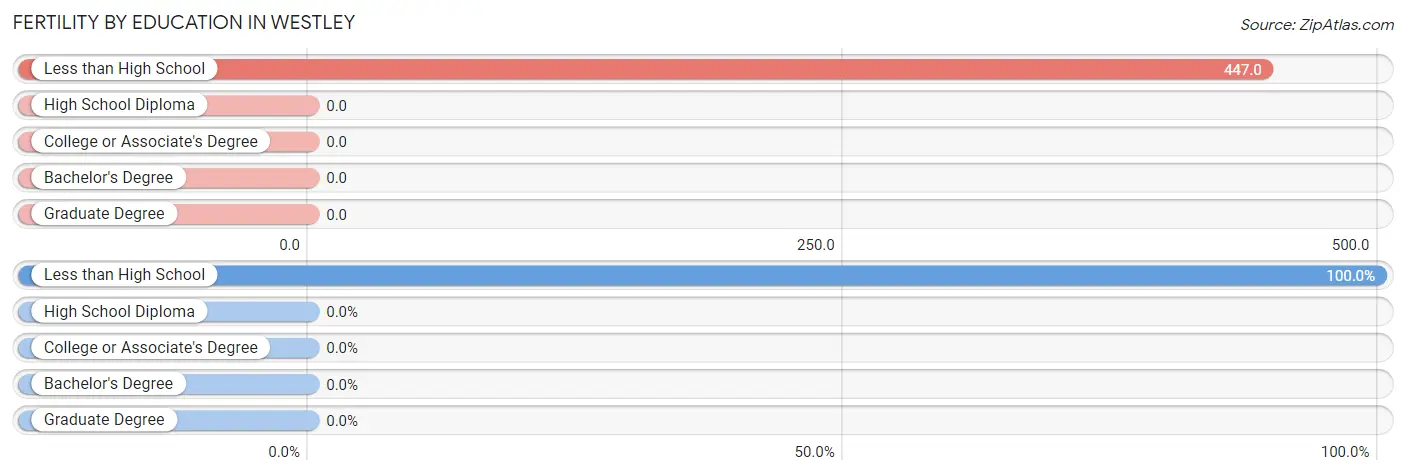
| Educational Attainment | Women with Births | Births / 1,000 Women |
| Less than High School | 17 (100.0%) | 447.0 |
| High School Diploma | 0 (0.0%) | 0.0 |
| College or Associate's Degree | 0 (0.0%) | 0.0 |
| Bachelor's Degree | 0 (0.0%) | 0.0 |
| Graduate Degree | 0 (0.0%) | 0.0 |
| Total | 17 (100.0%) | 181.0 |
Fertility by Education by Marriage Status in Westley
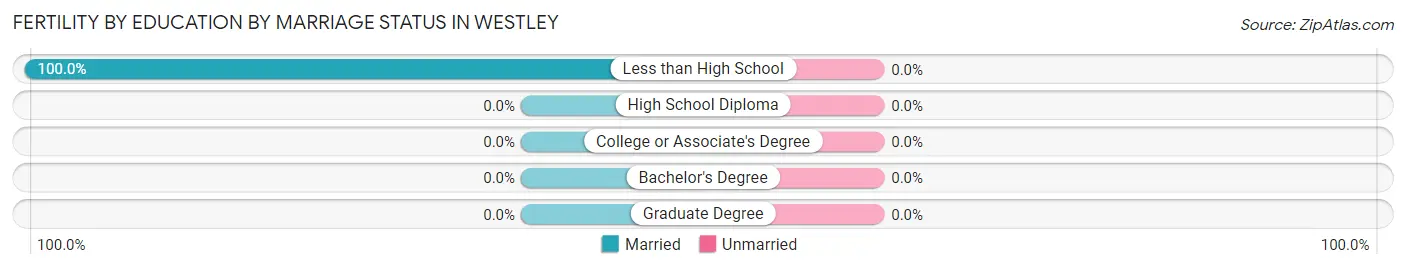
| Educational Attainment | Married | Unmarried |
| Less than High School | 17 (100.0%) | 0 (0.0%) |
| High School Diploma | 0 (0.0%) | 0 (0.0%) |
| College or Associate's Degree | 0 (0.0%) | 0 (0.0%) |
| Bachelor's Degree | 0 (0.0%) | 0 (0.0%) |
| Graduate Degree | 0 (0.0%) | 0 (0.0%) |
| Total | 17 (100.0%) | 0 (0.0%) |
Employment Characteristics in Westley
Employment by Class of Employer in Westley
Among the 81 employed individuals in Westley, , and private company employees (81 | 100.0%) make up the most common classes of employment.
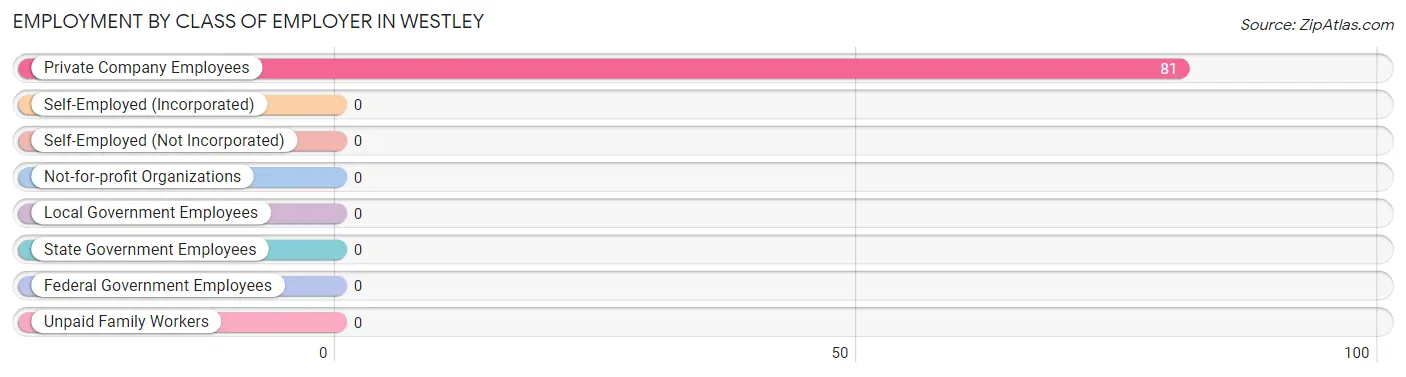
| Employer Class | # Employees | % Employees |
| Private Company Employees | 81 | 100.0% |
| Self-Employed (Incorporated) | 0 | 0.0% |
| Self-Employed (Not Incorporated) | 0 | 0.0% |
| Not-for-profit Organizations | 0 | 0.0% |
| Local Government Employees | 0 | 0.0% |
| State Government Employees | 0 | 0.0% |
| Federal Government Employees | 0 | 0.0% |
| Unpaid Family Workers | 0 | 0.0% |
| Total | 81 | 100.0% |
Employment Status by Age in Westley
According to the labor force statistics for Westley, out of the total population over 16 years of age (356), 56.5% or 201 individuals are in the labor force, with 59.7% or 120 of them unemployed. The age group with the highest labor force participation rate is 25 to 29 years, with 100.0% or 63 individuals in the labor force. Within the labor force, the 16 to 19 years age range has the highest percentage of unemployed individuals, with 100.0% or 17 of them being unemployed.
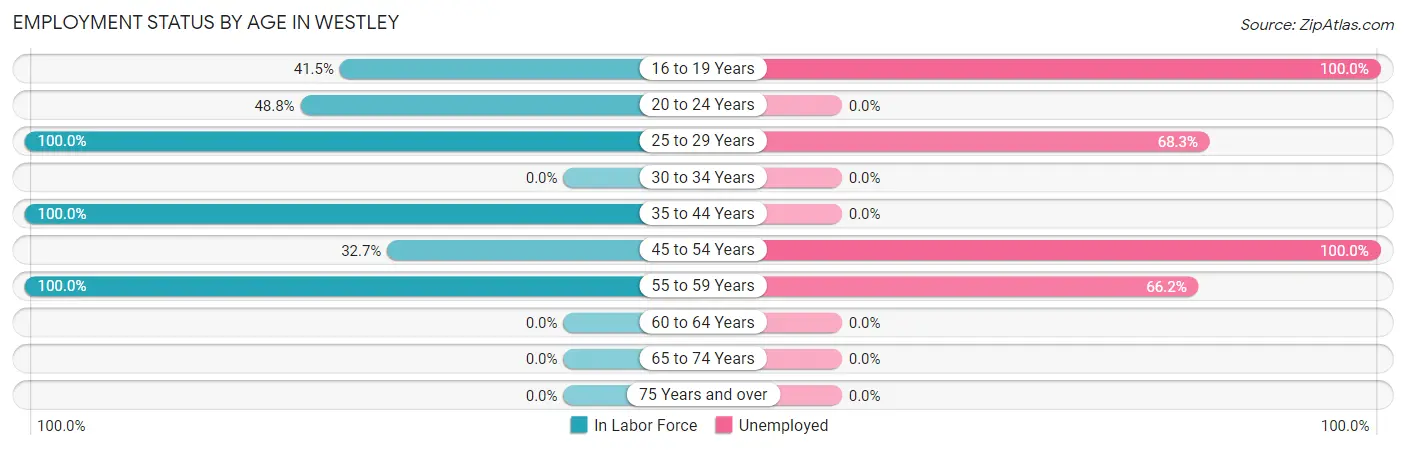
| Age Bracket | In Labor Force | Unemployed |
| 16 to 19 Years | 17 (41.5%) | 17 (100.0%) |
| 20 to 24 Years | 20 (48.8%) | 0 (0.0%) |
| 25 to 29 Years | 63 (100.0%) | 43 (68.3%) |
| 30 to 34 Years | 0 (0.0%) | 0 (0.0%) |
| 35 to 44 Years | 19 (100.0%) | 0 (0.0%) |
| 45 to 54 Years | 17 (32.7%) | 17 (100.0%) |
| 55 to 59 Years | 65 (100.0%) | 43 (66.2%) |
| 60 to 64 Years | 0 (0.0%) | 0 (0.0%) |
| 65 to 74 Years | 0 (0.0%) | 0 (0.0%) |
| 75 Years and over | 0 (0.0%) | 0 (0.0%) |
| Total | 201 (56.5%) | 120 (59.7%) |
Employment Status by Educational Attainment in Westley
According to labor force statistics for Westley, 75.9% of individuals (164) out of the total population between 25 and 64 years of age (216) are in the labor force, with 62.8% or 103 of them being unemployed. The group with the highest labor force participation rate are those with the educational attainment of college / associate degree, with 100.0% or 39 individuals in the labor force. Within the labor force, individuals with high school diploma education have the highest percentage of unemployment, with 100.0% or 23 of them being unemployed.
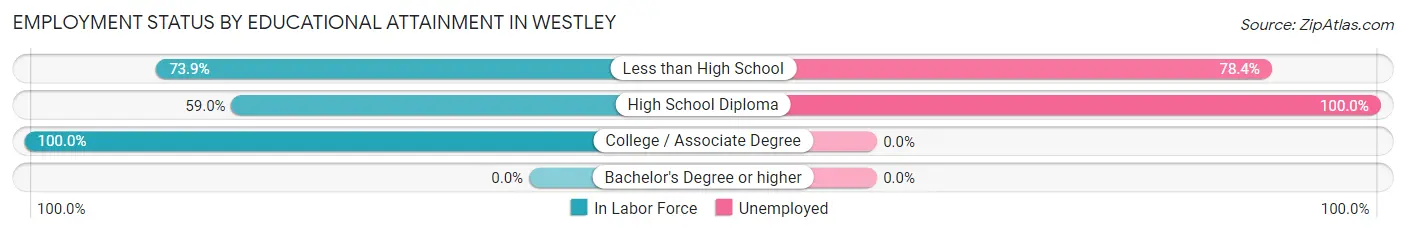
| Educational Attainment | In Labor Force | Unemployed |
| Less than High School | 102 (73.9%) | 108 (78.4%) |
| High School Diploma | 23 (59.0%) | 39 (100.0%) |
| College / Associate Degree | 39 (100.0%) | 0 (0.0%) |
| Bachelor's Degree or higher | 0 (0.0%) | 0 (0.0%) |
| Total | 164 (75.9%) | 136 (62.8%) |
Employment Occupations by Sex in Westley
Management, Business, Science and Arts Occupations
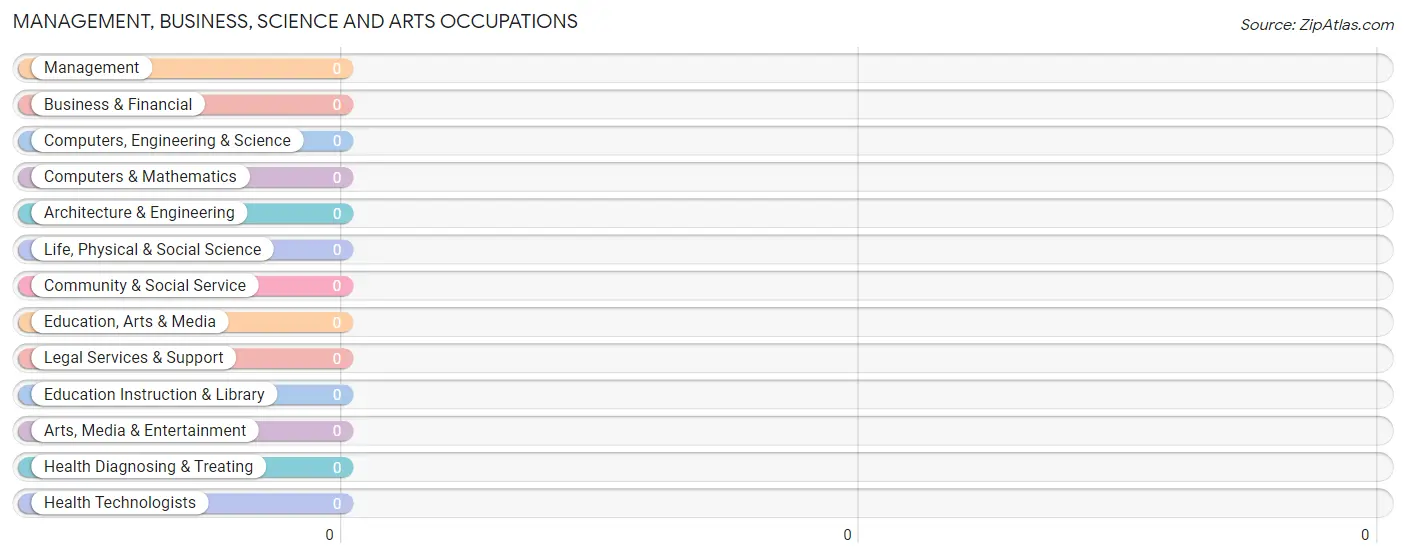
Management, Business, Science and Arts Occupations by Sex
| Occupation | Male | Female |
| Management | 0 (0.0%) | 0 (0.0%) |
| Business & Financial | 0 (0.0%) | 0 (0.0%) |
| Computers, Engineering & Science | 0 (0.0%) | 0 (0.0%) |
| Computers & Mathematics | 0 (0.0%) | 0 (0.0%) |
| Architecture & Engineering | 0 (0.0%) | 0 (0.0%) |
| Life, Physical & Social Science | 0 (0.0%) | 0 (0.0%) |
| Community & Social Service | 0 (0.0%) | 0 (0.0%) |
| Education, Arts & Media | 0 (0.0%) | 0 (0.0%) |
| Legal Services & Support | 0 (0.0%) | 0 (0.0%) |
| Education Instruction & Library | 0 (0.0%) | 0 (0.0%) |
| Arts, Media & Entertainment | 0 (0.0%) | 0 (0.0%) |
| Health Diagnosing & Treating | 0 (0.0%) | 0 (0.0%) |
| Health Technologists | 0 (0.0%) | 0 (0.0%) |
| Total (Category) | 0 (0.0%) | 0 (0.0%) |
| Total (Overall) | 42 (51.8%) | 39 (48.1%) |
Services Occupations
Services Occupations by Sex
| Occupation | Male | Female |
| Healthcare Support | 0 (0.0%) | 0 (0.0%) |
| Security & Protection | 0 (0.0%) | 0 (0.0%) |
| Firefighting & Prevention | 0 (0.0%) | 0 (0.0%) |
| Law Enforcement | 0 (0.0%) | 0 (0.0%) |
| Food Preparation & Serving | 0 (0.0%) | 0 (0.0%) |
| Cleaning & Maintenance | 0 (0.0%) | 0 (0.0%) |
| Personal Care & Service | 0 (0.0%) | 0 (0.0%) |
| Total (Category) | 0 (0.0%) | 0 (0.0%) |
| Total (Overall) | 42 (51.8%) | 39 (48.1%) |
Sales and Office Occupations
The most common Sales and Office occupations in Westley are , and Office & Administration (20 | 24.7%).
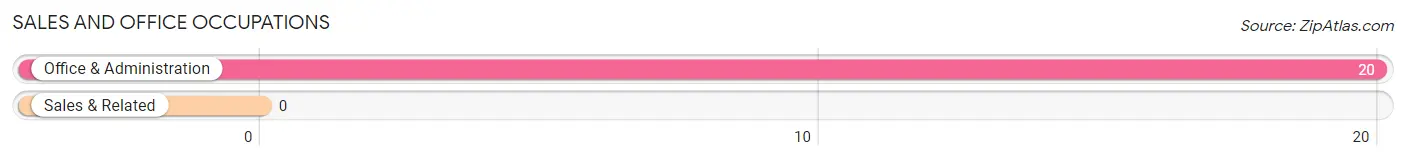
Sales and Office Occupations by Sex
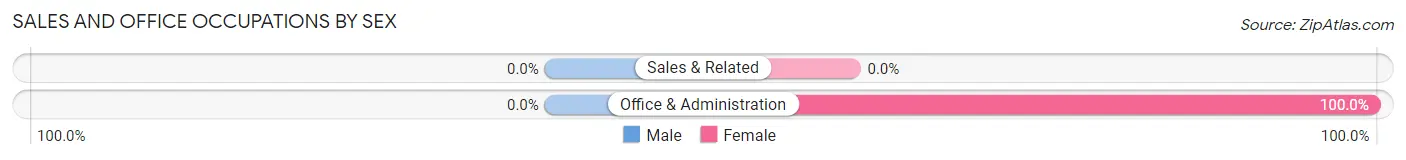
| Occupation | Male | Female |
| Sales & Related | 0 (0.0%) | 0 (0.0%) |
| Office & Administration | 0 (0.0%) | 20 (100.0%) |
| Total (Category) | 0 (0.0%) | 20 (100.0%) |
| Total (Overall) | 42 (51.8%) | 39 (48.1%) |
Natural Resources, Construction and Maintenance Occupations
Natural Resources, Construction and Maintenance Occupations by Sex
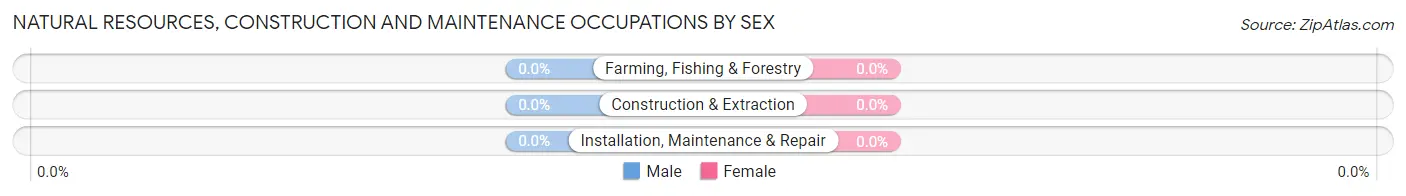
| Occupation | Male | Female |
| Farming, Fishing & Forestry | 0 (0.0%) | 0 (0.0%) |
| Construction & Extraction | 0 (0.0%) | 0 (0.0%) |
| Installation, Maintenance & Repair | 0 (0.0%) | 0 (0.0%) |
| Total (Category) | 0 (0.0%) | 0 (0.0%) |
| Total (Overall) | 42 (51.8%) | 39 (48.1%) |
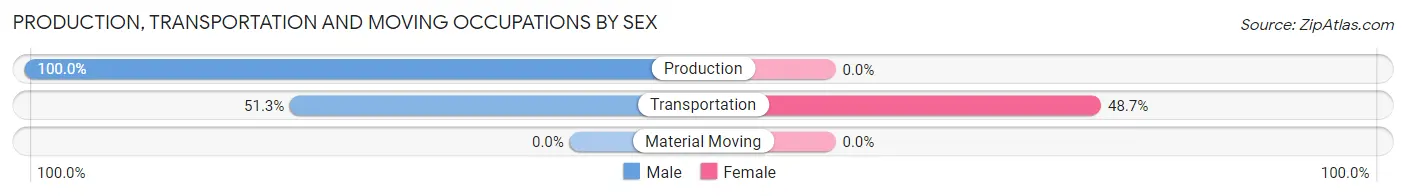
Production, Transportation and Moving Occupations
The most common Production, Transportation and Moving occupations in Westley are Transportation (39 | 48.1%), and Production (22 | 27.2%).
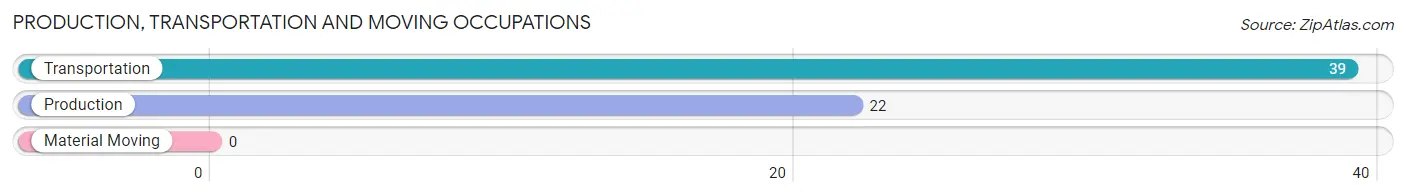
Production, Transportation and Moving Occupations by Sex
| Occupation | Male | Female |
| Production | 22 (100.0%) | 0 (0.0%) |
| Transportation | 20 (51.3%) | 19 (48.7%) |
| Material Moving | 0 (0.0%) | 0 (0.0%) |
| Total (Category) | 42 (68.9%) | 19 (31.1%) |
| Total (Overall) | 42 (51.8%) | 39 (48.1%) |
Employment Industries by Sex in Westley
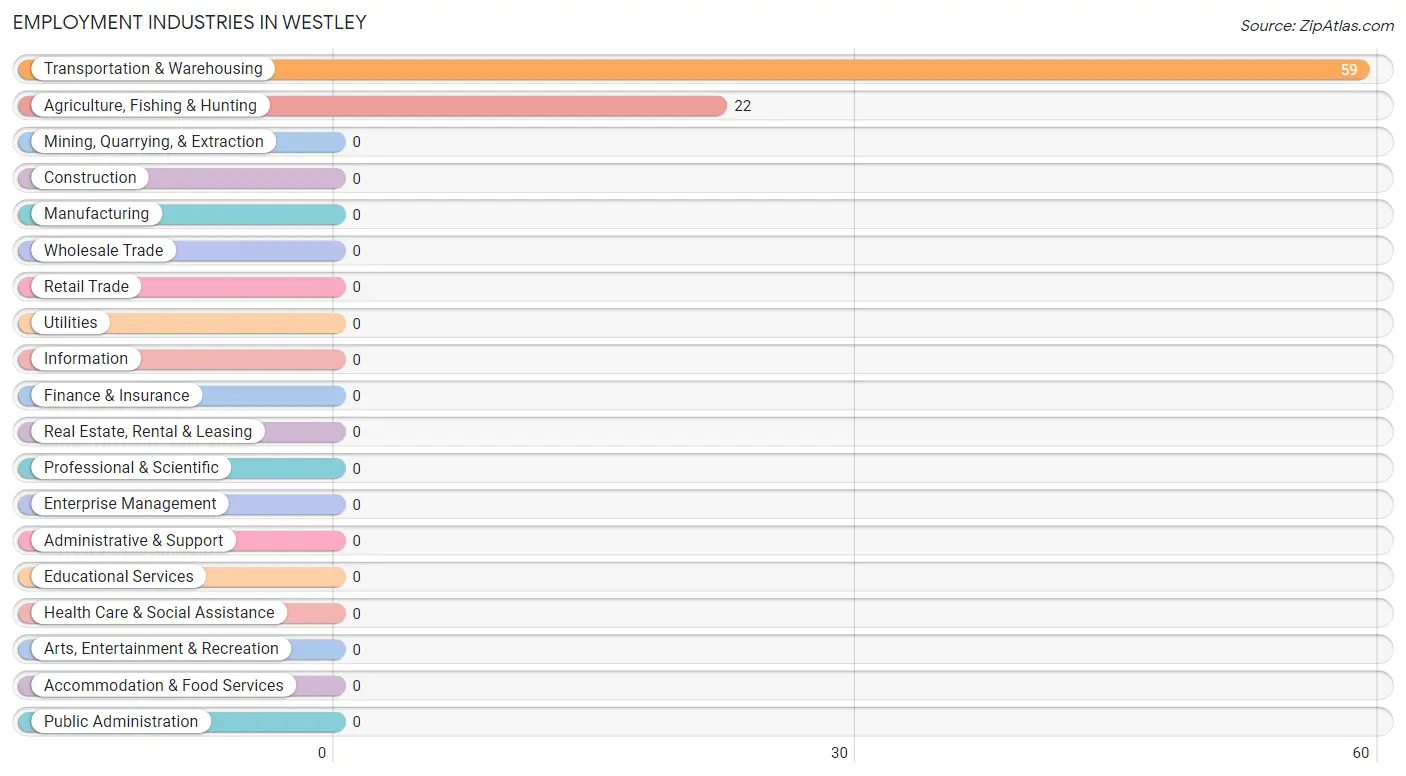
Employment Industries in Westley
The major employment industries in Westley include Transportation & Warehousing (59 | 72.8%), and Agriculture, Fishing & Hunting (22 | 27.2%).
Employment Industries by Sex in Westley
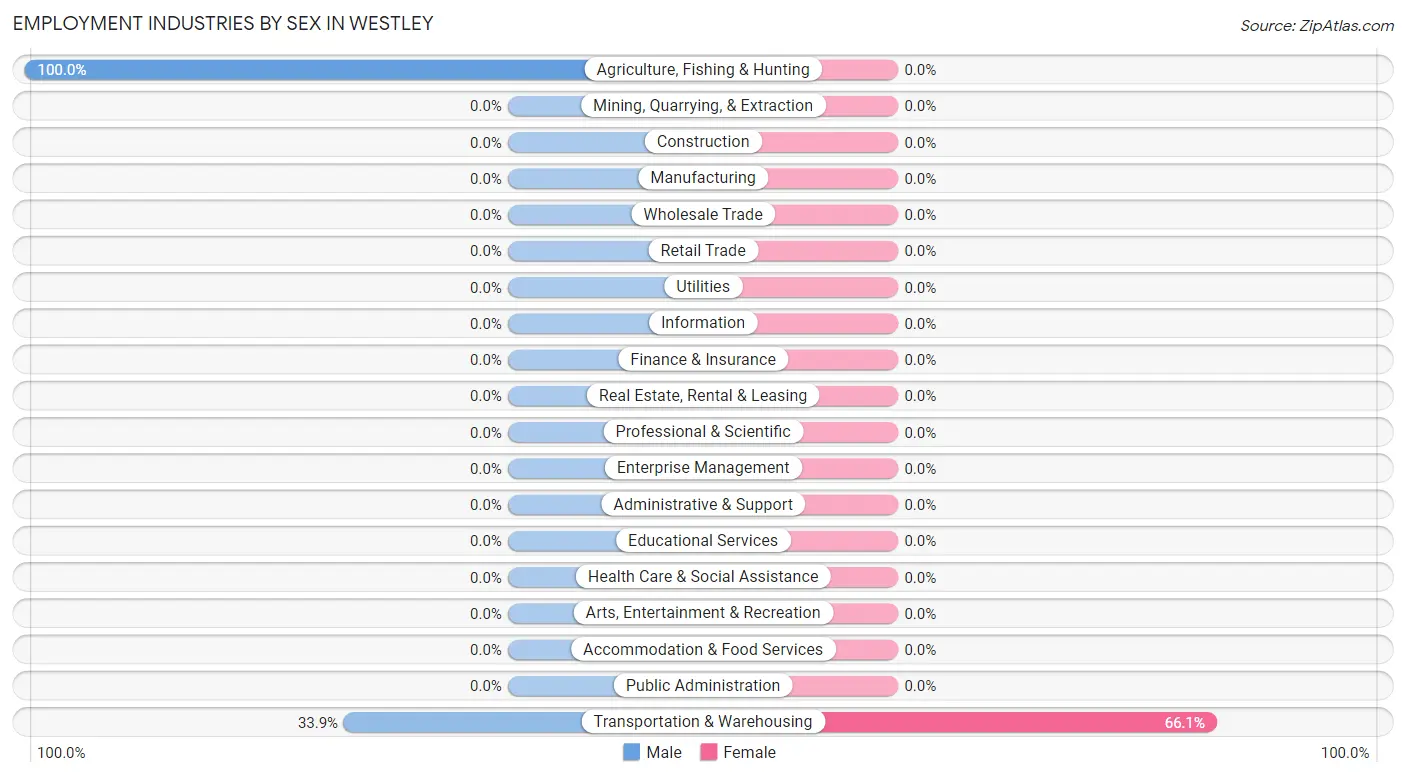
| Industry | Male | Female |
| Agriculture, Fishing & Hunting | 22 (100.0%) | 0 (0.0%) |
| Mining, Quarrying, & Extraction | 0 (0.0%) | 0 (0.0%) |
| Construction | 0 (0.0%) | 0 (0.0%) |
| Manufacturing | 0 (0.0%) | 0 (0.0%) |
| Wholesale Trade | 0 (0.0%) | 0 (0.0%) |
| Retail Trade | 0 (0.0%) | 0 (0.0%) |
| Transportation & Warehousing | 20 (33.9%) | 39 (66.1%) |
| Utilities | 0 (0.0%) | 0 (0.0%) |
| Information | 0 (0.0%) | 0 (0.0%) |
| Finance & Insurance | 0 (0.0%) | 0 (0.0%) |
| Real Estate, Rental & Leasing | 0 (0.0%) | 0 (0.0%) |
| Professional & Scientific | 0 (0.0%) | 0 (0.0%) |
| Enterprise Management | 0 (0.0%) | 0 (0.0%) |
| Administrative & Support | 0 (0.0%) | 0 (0.0%) |
| Educational Services | 0 (0.0%) | 0 (0.0%) |
| Health Care & Social Assistance | 0 (0.0%) | 0 (0.0%) |
| Arts, Entertainment & Recreation | 0 (0.0%) | 0 (0.0%) |
| Accommodation & Food Services | 0 (0.0%) | 0 (0.0%) |
| Public Administration | 0 (0.0%) | 0 (0.0%) |
| Total | 42 (51.8%) | 39 (48.1%) |
Education in Westley
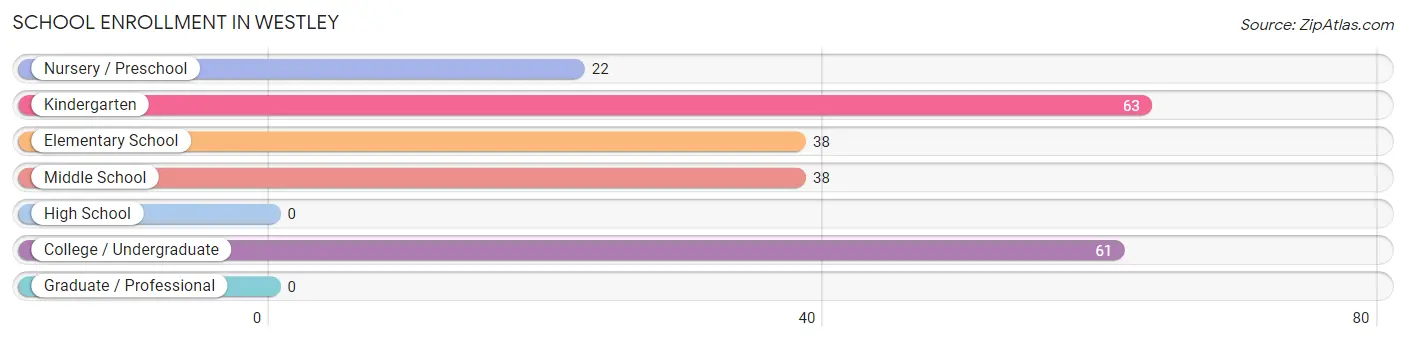
School Enrollment in Westley
The most common levels of schooling among the 222 students in Westley are kindergarten (63 | 28.4%), college / undergraduate (61 | 27.5%), and elementary school (38 | 17.1%).
| School Level | # Students | % Students |
| Nursery / Preschool | 22 | 9.9% |
| Kindergarten | 63 | 28.4% |
| Elementary School | 38 | 17.1% |
| Middle School | 38 | 17.1% |
| High School | 0 | 0.0% |
| College / Undergraduate | 61 | 27.5% |
| Graduate / Professional | 0 | 0.0% |
| Total | 222 | 100.0% |
School Enrollment by Age by Funding Source in Westley
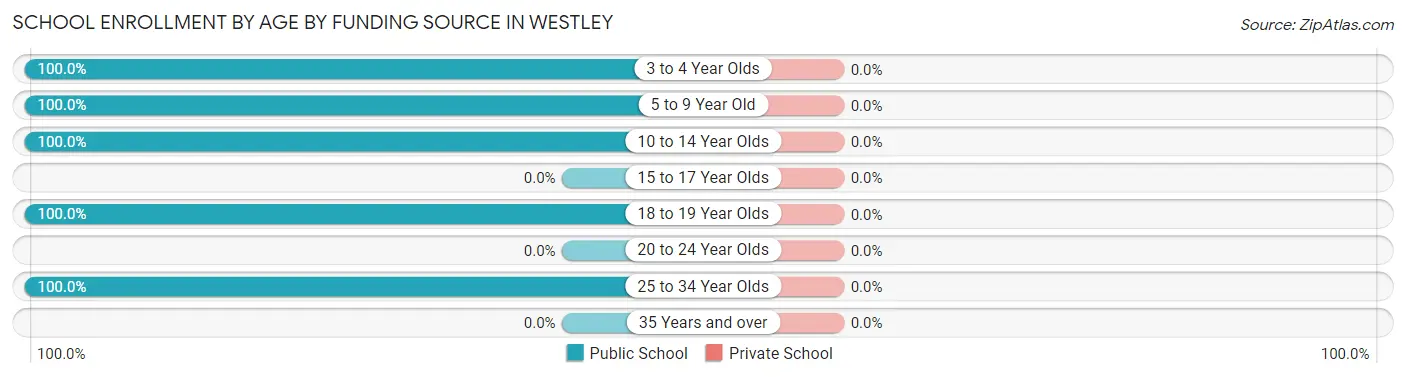
| Age Bracket | Public School | Private School |
| 3 to 4 Year Olds | 22 (100.0%) | 0 (0.0%) |
| 5 to 9 Year Old | 101 (100.0%) | 0 (0.0%) |
| 10 to 14 Year Olds | 38 (100.0%) | 0 (0.0%) |
| 15 to 17 Year Olds | 0 (0.0%) | 0 (0.0%) |
| 18 to 19 Year Olds | 41 (100.0%) | 0 (0.0%) |
| 20 to 24 Year Olds | 0 (0.0%) | 0 (0.0%) |
| 25 to 34 Year Olds | 20 (100.0%) | 0 (0.0%) |
| 35 Years and over | 0 (0.0%) | 0 (0.0%) |
| Total | 222 (100.0%) | 0 (0.0%) |
Educational Attainment by Field of Study in Westley
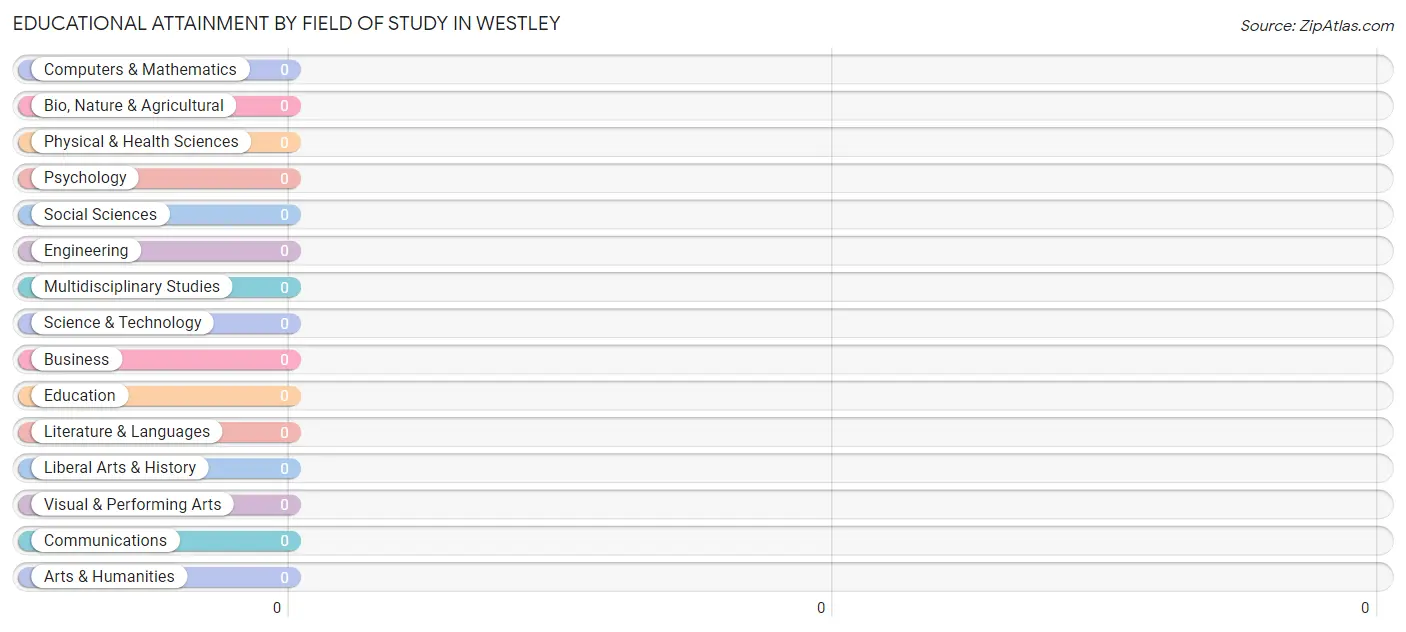
| Field of Study | # Graduates | % Graduates |
| Computers & Mathematics | 0 | 0.0% |
| Bio, Nature & Agricultural | 0 | 0.0% |
| Physical & Health Sciences | 0 | 0.0% |
| Psychology | 0 | 0.0% |
| Social Sciences | 0 | 0.0% |
| Engineering | 0 | 0.0% |
| Multidisciplinary Studies | 0 | 0.0% |
| Science & Technology | 0 | 0.0% |
| Business | 0 | 0.0% |
| Education | 0 | 0.0% |
| Literature & Languages | 0 | 0.0% |
| Liberal Arts & History | 0 | 0.0% |
| Visual & Performing Arts | 0 | 0.0% |
| Communications | 0 | 0.0% |
| Arts & Humanities | 0 | 0.0% |
| Total | 0 | 0.0% |
Transportation & Commute in Westley
Vehicle Availability by Sex in Westley
The most prevalent vehicle ownership categories in Westley are males with 2 vehicles (22, accounting for 52.4%) and females with 2 vehicles (0, making up 56.4%).
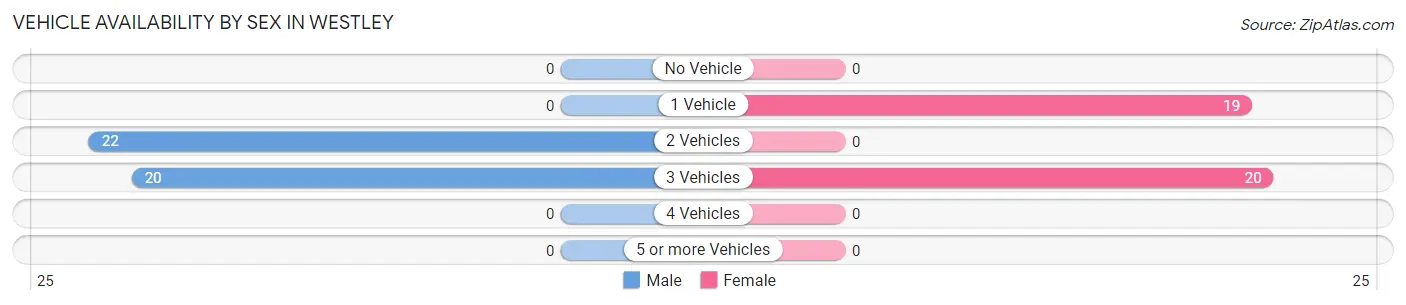
| Vehicles Available | Male | Female |
| No Vehicle | 0 (0.0%) | 0 (0.0%) |
| 1 Vehicle | 0 (0.0%) | 19 (48.7%) |
| 2 Vehicles | 22 (52.4%) | 0 (0.0%) |
| 3 Vehicles | 20 (47.6%) | 20 (51.3%) |
| 4 Vehicles | 0 (0.0%) | 0 (0.0%) |
| 5 or more Vehicles | 0 (0.0%) | 0 (0.0%) |
| Total | 42 (100.0%) | 39 (100.0%) |
Commute Time in Westley
The most frequently occuring commute durations in Westley are 45 to 59 minutes (22 commuters, 27.2%), 20 to 24 minutes (20 commuters, 24.7%), and 60 to 89 minutes (20 commuters, 24.7%).
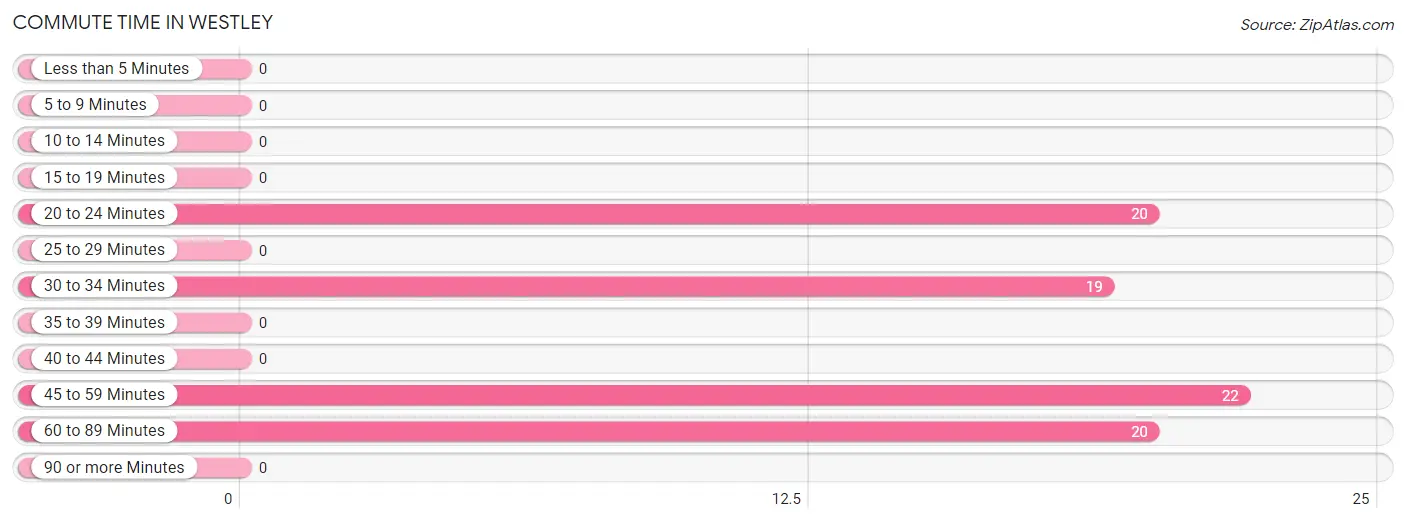
| Commute Time | # Commuters | % Commuters |
| Less than 5 Minutes | 0 | 0.0% |
| 5 to 9 Minutes | 0 | 0.0% |
| 10 to 14 Minutes | 0 | 0.0% |
| 15 to 19 Minutes | 0 | 0.0% |
| 20 to 24 Minutes | 20 | 24.7% |
| 25 to 29 Minutes | 0 | 0.0% |
| 30 to 34 Minutes | 19 | 23.5% |
| 35 to 39 Minutes | 0 | 0.0% |
| 40 to 44 Minutes | 0 | 0.0% |
| 45 to 59 Minutes | 22 | 27.2% |
| 60 to 89 Minutes | 20 | 24.7% |
| 90 or more Minutes | 0 | 0.0% |
Commute Time by Sex in Westley
The most common commute times in Westley are 45 to 59 minutes (22 commuters, 52.4%) for males and 20 to 24 minutes (20 commuters, 51.3%) for females.
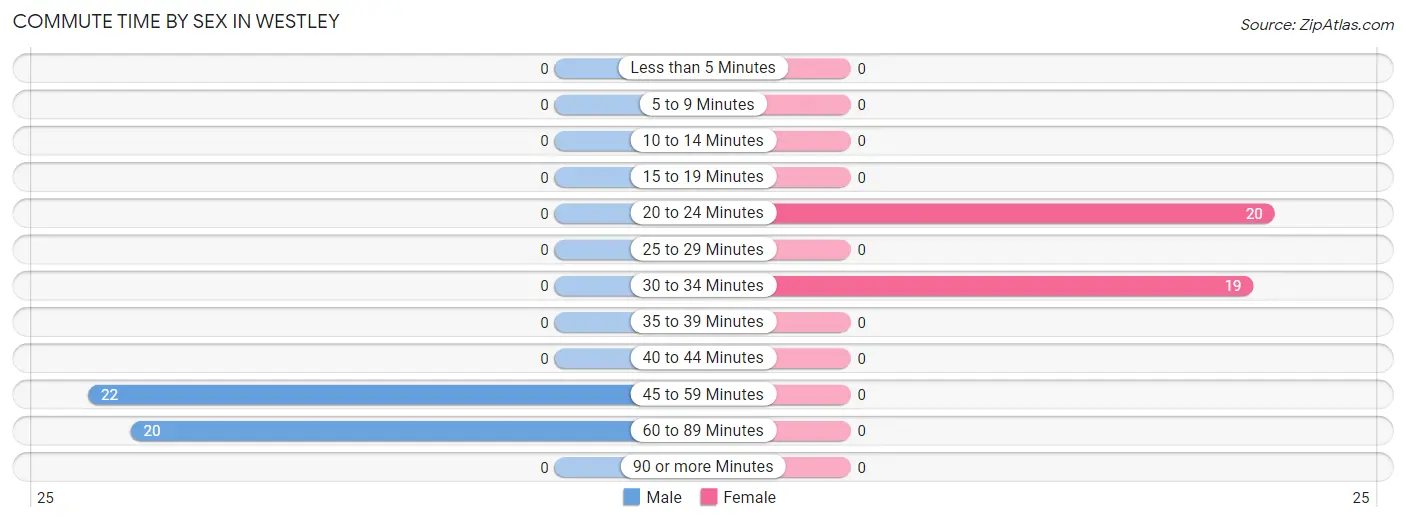
| Commute Time | Male | Female |
| Less than 5 Minutes | 0 (0.0%) | 0 (0.0%) |
| 5 to 9 Minutes | 0 (0.0%) | 0 (0.0%) |
| 10 to 14 Minutes | 0 (0.0%) | 0 (0.0%) |
| 15 to 19 Minutes | 0 (0.0%) | 0 (0.0%) |
| 20 to 24 Minutes | 0 (0.0%) | 20 (51.3%) |
| 25 to 29 Minutes | 0 (0.0%) | 0 (0.0%) |
| 30 to 34 Minutes | 0 (0.0%) | 19 (48.7%) |
| 35 to 39 Minutes | 0 (0.0%) | 0 (0.0%) |
| 40 to 44 Minutes | 0 (0.0%) | 0 (0.0%) |
| 45 to 59 Minutes | 22 (52.4%) | 0 (0.0%) |
| 60 to 89 Minutes | 20 (47.6%) | 0 (0.0%) |
| 90 or more Minutes | 0 (0.0%) | 0 (0.0%) |
Time of Departure to Work by Sex in Westley
The most frequent times of departure to work in Westley are 12:00 PM to 3:59 PM (22, 52.4%) for males and 7:30 AM to 7:59 AM (20, 51.3%) for females.
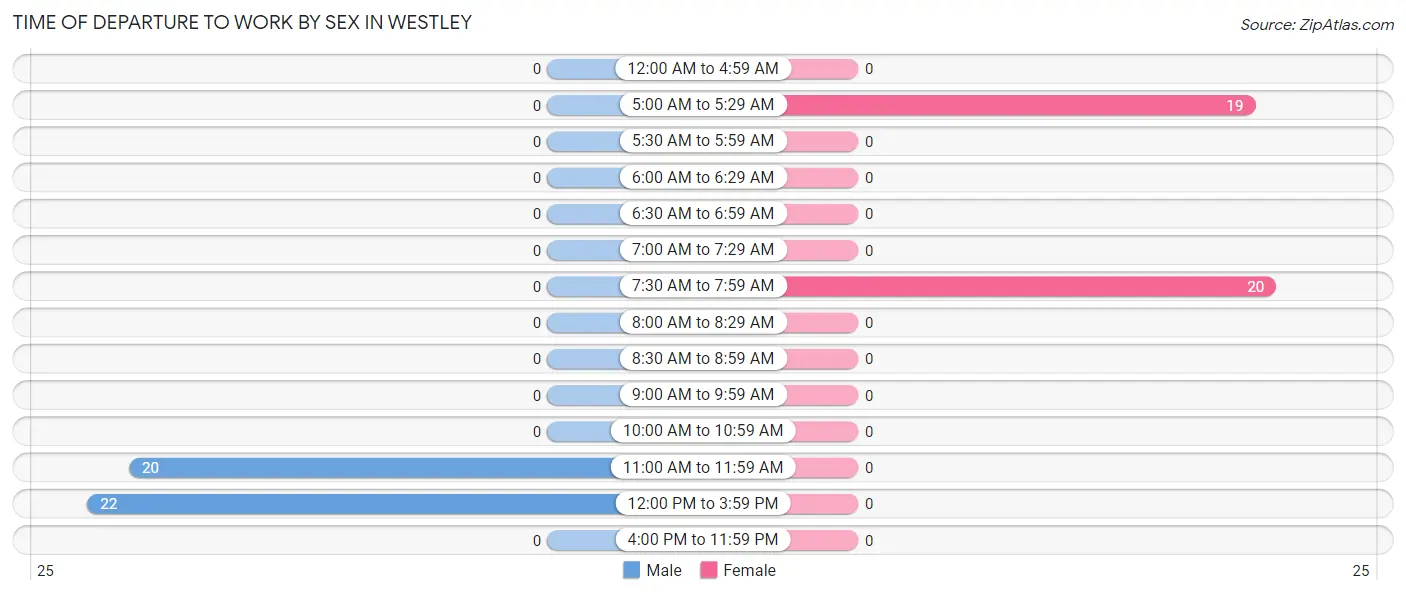
| Time of Departure | Male | Female |
| 12:00 AM to 4:59 AM | 0 (0.0%) | 0 (0.0%) |
| 5:00 AM to 5:29 AM | 0 (0.0%) | 19 (48.7%) |
| 5:30 AM to 5:59 AM | 0 (0.0%) | 0 (0.0%) |
| 6:00 AM to 6:29 AM | 0 (0.0%) | 0 (0.0%) |
| 6:30 AM to 6:59 AM | 0 (0.0%) | 0 (0.0%) |
| 7:00 AM to 7:29 AM | 0 (0.0%) | 0 (0.0%) |
| 7:30 AM to 7:59 AM | 0 (0.0%) | 20 (51.3%) |
| 8:00 AM to 8:29 AM | 0 (0.0%) | 0 (0.0%) |
| 8:30 AM to 8:59 AM | 0 (0.0%) | 0 (0.0%) |
| 9:00 AM to 9:59 AM | 0 (0.0%) | 0 (0.0%) |
| 10:00 AM to 10:59 AM | 0 (0.0%) | 0 (0.0%) |
| 11:00 AM to 11:59 AM | 20 (47.6%) | 0 (0.0%) |
| 12:00 PM to 3:59 PM | 22 (52.4%) | 0 (0.0%) |
| 4:00 PM to 11:59 PM | 0 (0.0%) | 0 (0.0%) |
| Total | 42 (100.0%) | 39 (100.0%) |
Housing Occupancy in Westley
Occupancy by Ownership in Westley
Of the total 157 dwellings in Westley, owner-occupied units account for 22 (14.0%), while renter-occupied units make up 135 (86.0%).
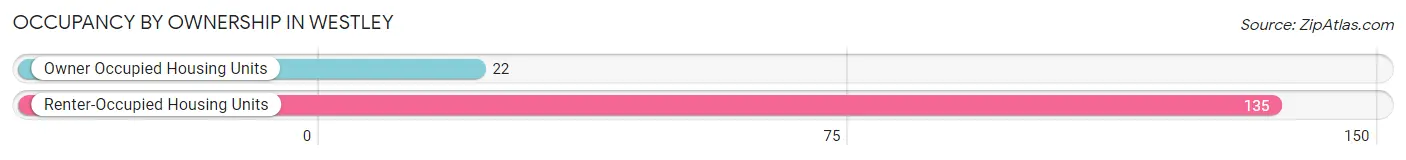
| Occupancy | # Housing Units | % Housing Units |
| Owner Occupied Housing Units | 22 | 14.0% |
| Renter-Occupied Housing Units | 135 | 86.0% |
| Total Occupied Housing Units | 157 | 100.0% |
Occupancy by Household Size in Westley
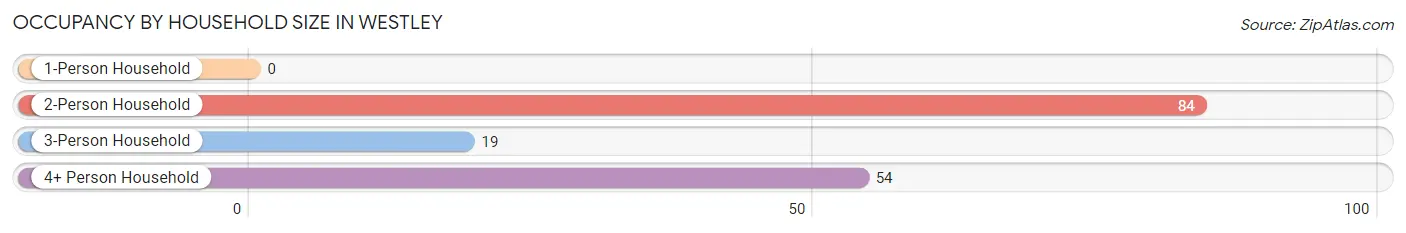
| Household Size | # Housing Units | % Housing Units |
| 1-Person Household | 0 | 0.0% |
| 2-Person Household | 84 | 53.5% |
| 3-Person Household | 19 | 12.1% |
| 4+ Person Household | 54 | 34.4% |
| Total Housing Units | 157 | 100.0% |
Occupancy by Ownership by Household Size in Westley
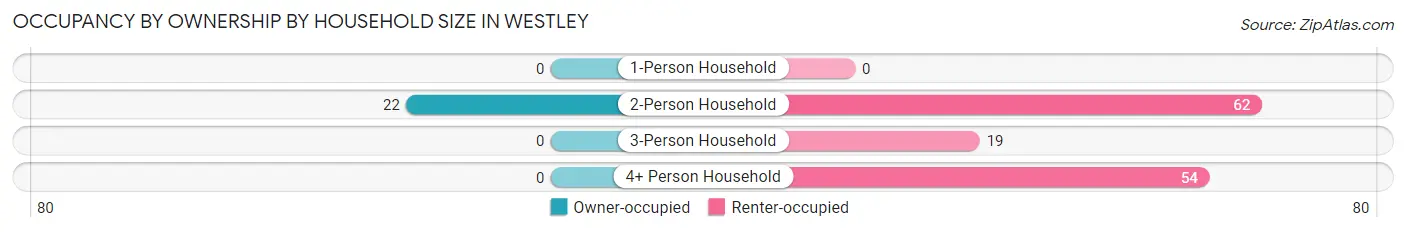
| Household Size | Owner-occupied | Renter-occupied |
| 1-Person Household | 0 (0.0%) | 0 (0.0%) |
| 2-Person Household | 22 (26.2%) | 62 (73.8%) |
| 3-Person Household | 0 (0.0%) | 19 (100.0%) |
| 4+ Person Household | 0 (0.0%) | 54 (100.0%) |
| Total Housing Units | 22 (14.0%) | 135 (86.0%) |
Occupancy by Educational Attainment in Westley
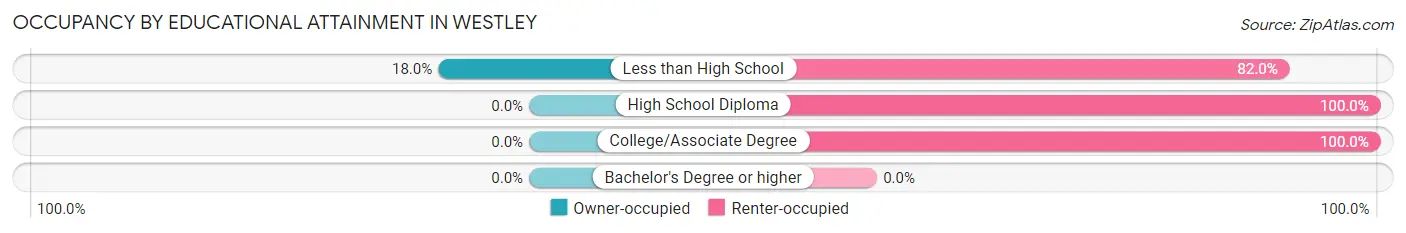
| Household Size | Owner-occupied | Renter-occupied |
| Less than High School | 22 (18.0%) | 100 (82.0%) |
| High School Diploma | 0 (0.0%) | 16 (100.0%) |
| College/Associate Degree | 0 (0.0%) | 19 (100.0%) |
| Bachelor's Degree or higher | 0 (0.0%) | 0 (0.0%) |
Occupancy by Age of Householder in Westley
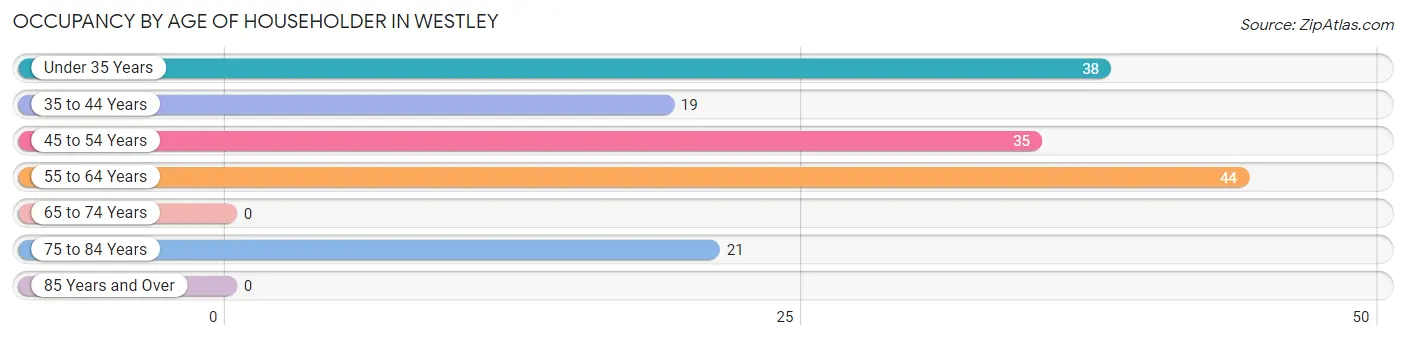
| Age Bracket | # Households | % Households |
| Under 35 Years | 38 | 24.2% |
| 35 to 44 Years | 19 | 12.1% |
| 45 to 54 Years | 35 | 22.3% |
| 55 to 64 Years | 44 | 28.0% |
| 65 to 74 Years | 0 | 0.0% |
| 75 to 84 Years | 21 | 13.4% |
| 85 Years and Over | 0 | 0.0% |
| Total | 157 | 100.0% |
Housing Finances in Westley
Median Income by Occupancy in Westley
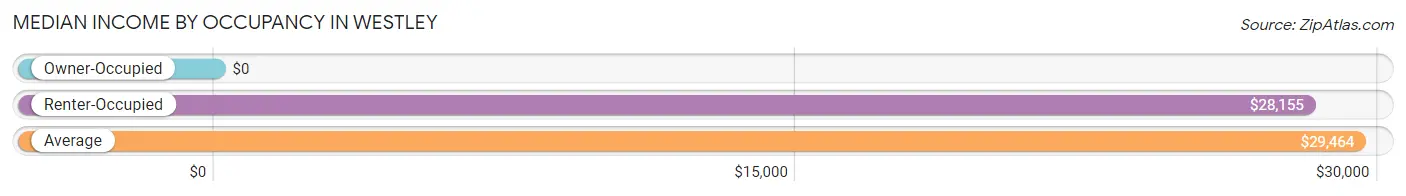
| Occupancy Type | # Households | Median Income |
| Owner-Occupied | 22 (14.0%) | $0 |
| Renter-Occupied | 135 (86.0%) | $28,155 |
| Average | 157 (100.0%) | $29,464 |
Occupancy by Householder Income Bracket in Westley
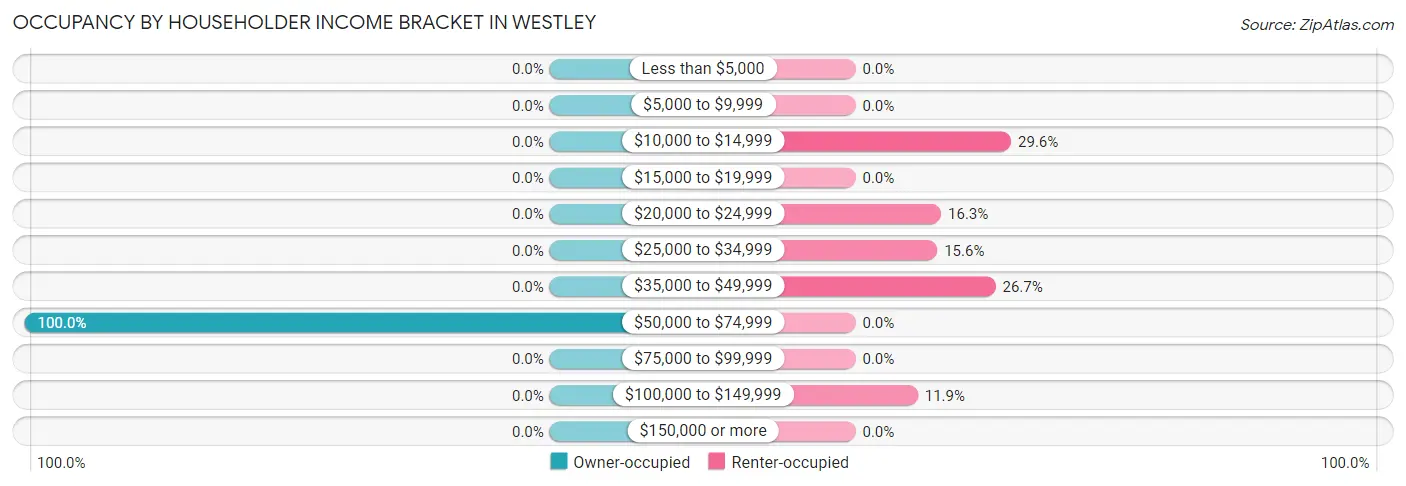
| Income Bracket | Owner-occupied | Renter-occupied |
| Less than $5,000 | 0 (0.0%) | 0 (0.0%) |
| $5,000 to $9,999 | 0 (0.0%) | 0 (0.0%) |
| $10,000 to $14,999 | 0 (0.0%) | 40 (29.6%) |
| $15,000 to $19,999 | 0 (0.0%) | 0 (0.0%) |
| $20,000 to $24,999 | 0 (0.0%) | 22 (16.3%) |
| $25,000 to $34,999 | 0 (0.0%) | 21 (15.6%) |
| $35,000 to $49,999 | 0 (0.0%) | 36 (26.7%) |
| $50,000 to $74,999 | 22 (100.0%) | 0 (0.0%) |
| $75,000 to $99,999 | 0 (0.0%) | 0 (0.0%) |
| $100,000 to $149,999 | 0 (0.0%) | 16 (11.8%) |
| $150,000 or more | 0 (0.0%) | 0 (0.0%) |
| Total | 22 (100.0%) | 135 (100.0%) |
Monthly Housing Cost Tiers in Westley
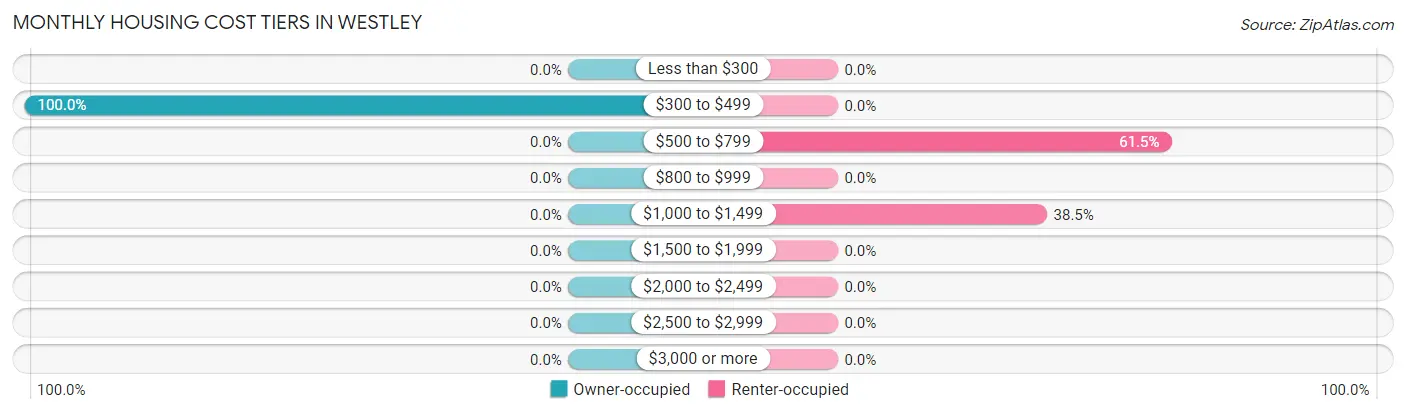
| Monthly Cost | Owner-occupied | Renter-occupied |
| Less than $300 | 0 (0.0%) | 0 (0.0%) |
| $300 to $499 | 22 (100.0%) | 0 (0.0%) |
| $500 to $799 | 0 (0.0%) | 83 (61.5%) |
| $800 to $999 | 0 (0.0%) | 0 (0.0%) |
| $1,000 to $1,499 | 0 (0.0%) | 52 (38.5%) |
| $1,500 to $1,999 | 0 (0.0%) | 0 (0.0%) |
| $2,000 to $2,499 | 0 (0.0%) | 0 (0.0%) |
| $2,500 to $2,999 | 0 (0.0%) | 0 (0.0%) |
| $3,000 or more | 0 (0.0%) | 0 (0.0%) |
| Total | 22 (100.0%) | 135 (100.0%) |
Physical Housing Characteristics in Westley
Housing Structures in Westley
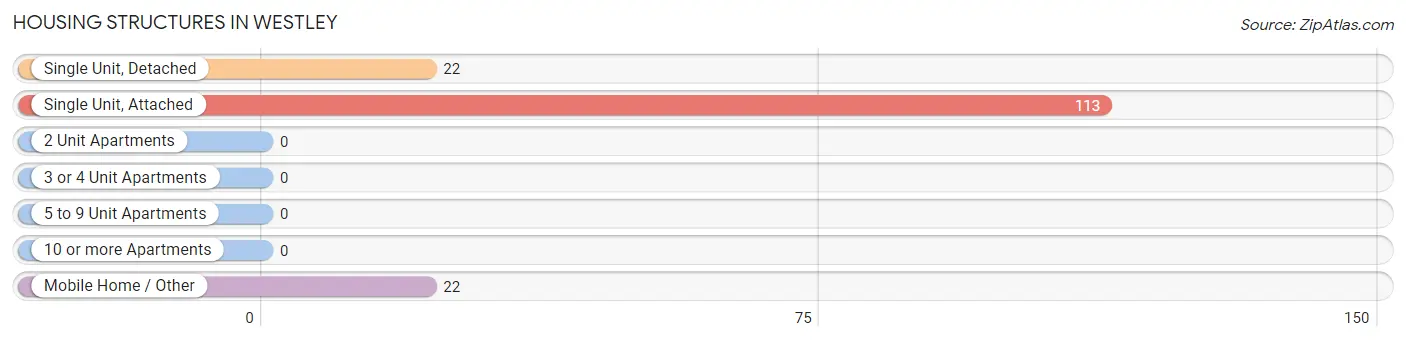
| Structure Type | # Housing Units | % Housing Units |
| Single Unit, Detached | 22 | 14.0% |
| Single Unit, Attached | 113 | 72.0% |
| 2 Unit Apartments | 0 | 0.0% |
| 3 or 4 Unit Apartments | 0 | 0.0% |
| 5 to 9 Unit Apartments | 0 | 0.0% |
| 10 or more Apartments | 0 | 0.0% |
| Mobile Home / Other | 22 | 14.0% |
| Total | 157 | 100.0% |
Housing Structures by Occupancy in Westley
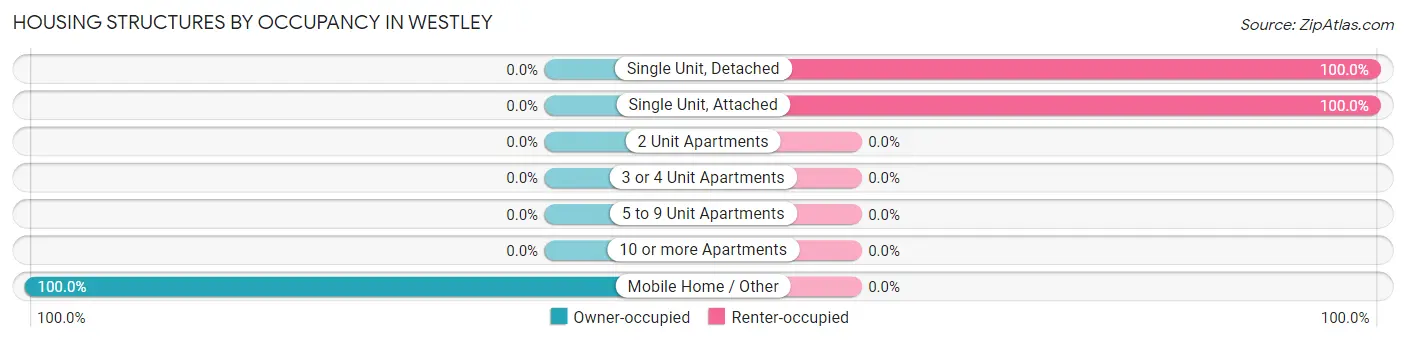
| Structure Type | Owner-occupied | Renter-occupied |
| Single Unit, Detached | 0 (0.0%) | 22 (100.0%) |
| Single Unit, Attached | 0 (0.0%) | 113 (100.0%) |
| 2 Unit Apartments | 0 (0.0%) | 0 (0.0%) |
| 3 or 4 Unit Apartments | 0 (0.0%) | 0 (0.0%) |
| 5 to 9 Unit Apartments | 0 (0.0%) | 0 (0.0%) |
| 10 or more Apartments | 0 (0.0%) | 0 (0.0%) |
| Mobile Home / Other | 22 (100.0%) | 0 (0.0%) |
| Total | 22 (14.0%) | 135 (86.0%) |
Housing Structures by Number of Rooms in Westley
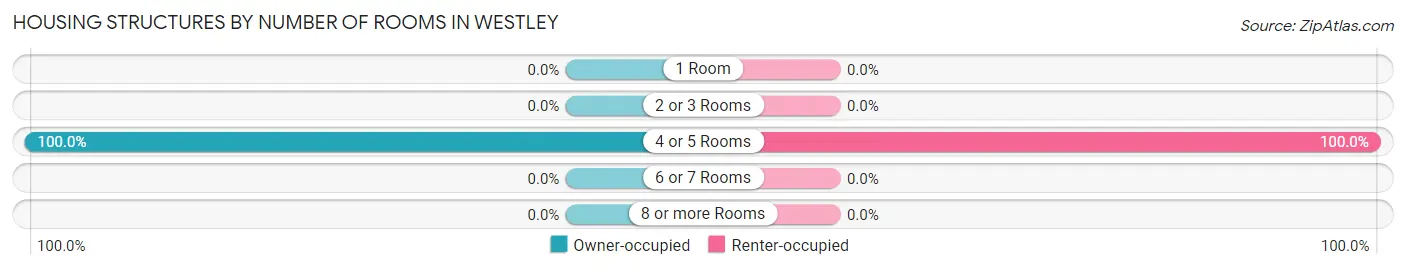
| Number of Rooms | Owner-occupied | Renter-occupied |
| 1 Room | 0 (0.0%) | 0 (0.0%) |
| 2 or 3 Rooms | 0 (0.0%) | 0 (0.0%) |
| 4 or 5 Rooms | 22 (100.0%) | 135 (100.0%) |
| 6 or 7 Rooms | 0 (0.0%) | 0 (0.0%) |
| 8 or more Rooms | 0 (0.0%) | 0 (0.0%) |
| Total | 22 (100.0%) | 135 (100.0%) |
Housing Structure by Heating Type in Westley
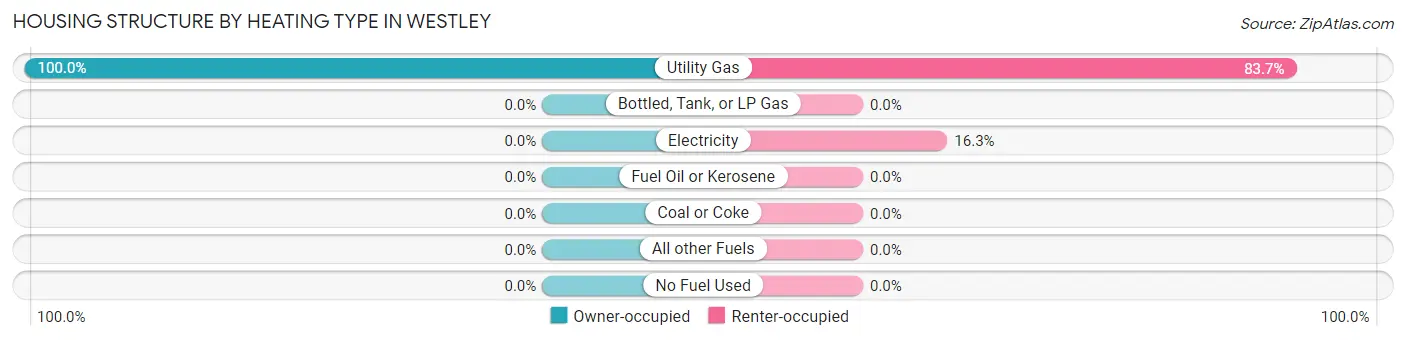
| Heating Type | Owner-occupied | Renter-occupied |
| Utility Gas | 22 (100.0%) | 113 (83.7%) |
| Bottled, Tank, or LP Gas | 0 (0.0%) | 0 (0.0%) |
| Electricity | 0 (0.0%) | 22 (16.3%) |
| Fuel Oil or Kerosene | 0 (0.0%) | 0 (0.0%) |
| Coal or Coke | 0 (0.0%) | 0 (0.0%) |
| All other Fuels | 0 (0.0%) | 0 (0.0%) |
| No Fuel Used | 0 (0.0%) | 0 (0.0%) |
| Total | 22 (100.0%) | 135 (100.0%) |
Household Vehicle Usage in Westley
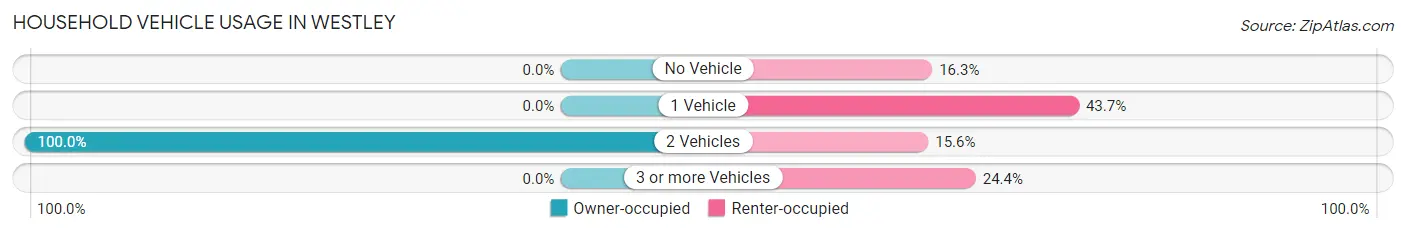
| Vehicles per Household | Owner-occupied | Renter-occupied |
| No Vehicle | 0 (0.0%) | 22 (16.3%) |
| 1 Vehicle | 0 (0.0%) | 59 (43.7%) |
| 2 Vehicles | 22 (100.0%) | 21 (15.6%) |
| 3 or more Vehicles | 0 (0.0%) | 33 (24.4%) |
| Total | 22 (100.0%) | 135 (100.0%) |
Real Estate & Mortgages in Westley
Real Estate and Mortgage Overview in Westley
| Characteristic | Without Mortgage | With Mortgage |
| Housing Units | 22 | 0 |
| Median Property Value | - | - |
| Median Household Income | - | - |
| Monthly Housing Costs | - | - |
| Real Estate Taxes | - | - |
Property Value by Mortgage Status in Westley
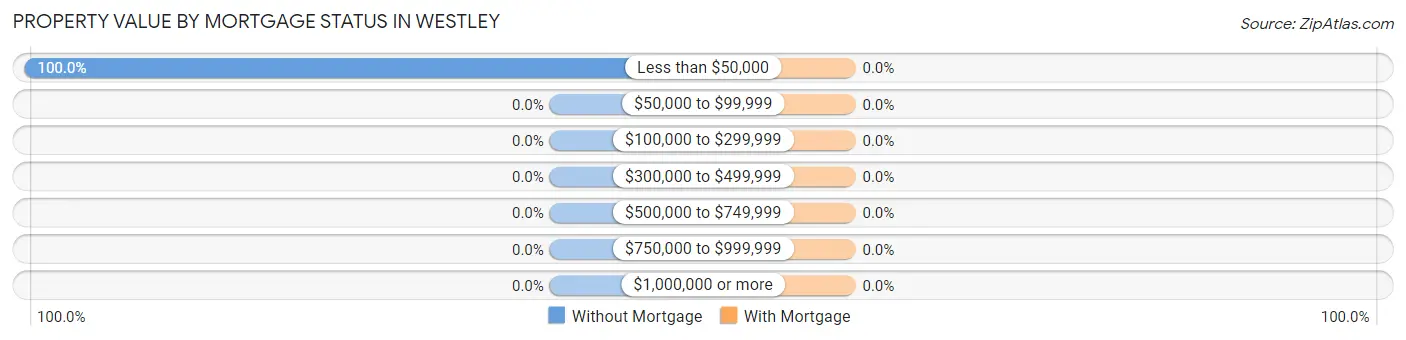
| Property Value | Without Mortgage | With Mortgage |
| Less than $50,000 | 22 (100.0%) | 0 (0.0%) |
| $50,000 to $99,999 | 0 (0.0%) | 0 (0.0%) |
| $100,000 to $299,999 | 0 (0.0%) | 0 (0.0%) |
| $300,000 to $499,999 | 0 (0.0%) | 0 (0.0%) |
| $500,000 to $749,999 | 0 (0.0%) | 0 (0.0%) |
| $750,000 to $999,999 | 0 (0.0%) | 0 (0.0%) |
| $1,000,000 or more | 0 (0.0%) | 0 (0.0%) |
| Total | 22 (100.0%) | 0 (0.0%) |
Household Income by Mortgage Status in Westley
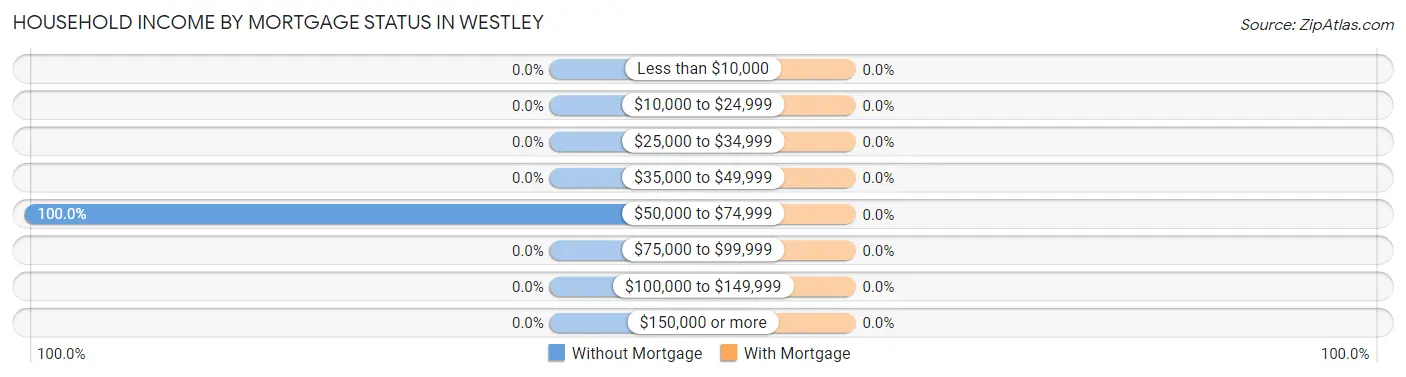
| Household Income | Without Mortgage | With Mortgage |
| Less than $10,000 | 0 (0.0%) | 0 (0.0%) |
| $10,000 to $24,999 | 0 (0.0%) | 0 (0.0%) |
| $25,000 to $34,999 | 0 (0.0%) | 0 (0.0%) |
| $35,000 to $49,999 | 0 (0.0%) | 0 (0.0%) |
| $50,000 to $74,999 | 22 (100.0%) | 0 (0.0%) |
| $75,000 to $99,999 | 0 (0.0%) | 0 (0.0%) |
| $100,000 to $149,999 | 0 (0.0%) | 0 (0.0%) |
| $150,000 or more | 0 (0.0%) | 0 (0.0%) |
| Total | 22 (100.0%) | 0 (0.0%) |
Property Value to Household Income Ratio in Westley
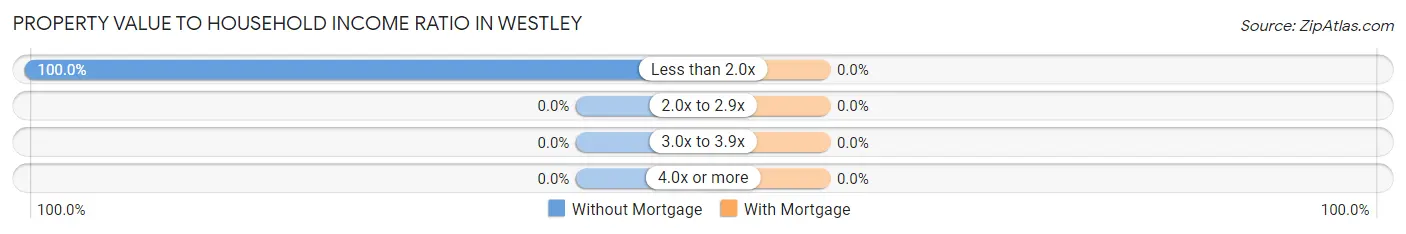
| Value-to-Income Ratio | Without Mortgage | With Mortgage |
| Less than 2.0x | 22 (100.0%) | 0 (0.0%) |
| 2.0x to 2.9x | 0 (0.0%) | 0 (0.0%) |
| 3.0x to 3.9x | 0 (0.0%) | 0 (0.0%) |
| 4.0x or more | 0 (0.0%) | 0 (0.0%) |
| Total | 22 (100.0%) | 0 (0.0%) |
Real Estate Taxes by Mortgage Status in Westley
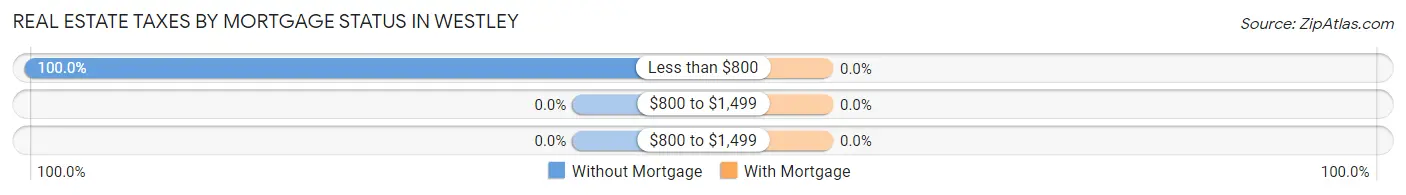
| Property Taxes | Without Mortgage | With Mortgage |
| Less than $800 | 22 (100.0%) | 0 (0.0%) |
| $800 to $1,499 | 0 (0.0%) | 0 (0.0%) |
| $800 to $1,499 | 0 (0.0%) | 0 (0.0%) |
| Total | 22 (100.0%) | 0 (0.0%) |
Health & Disability in Westley
Health Insurance Coverage by Age in Westley
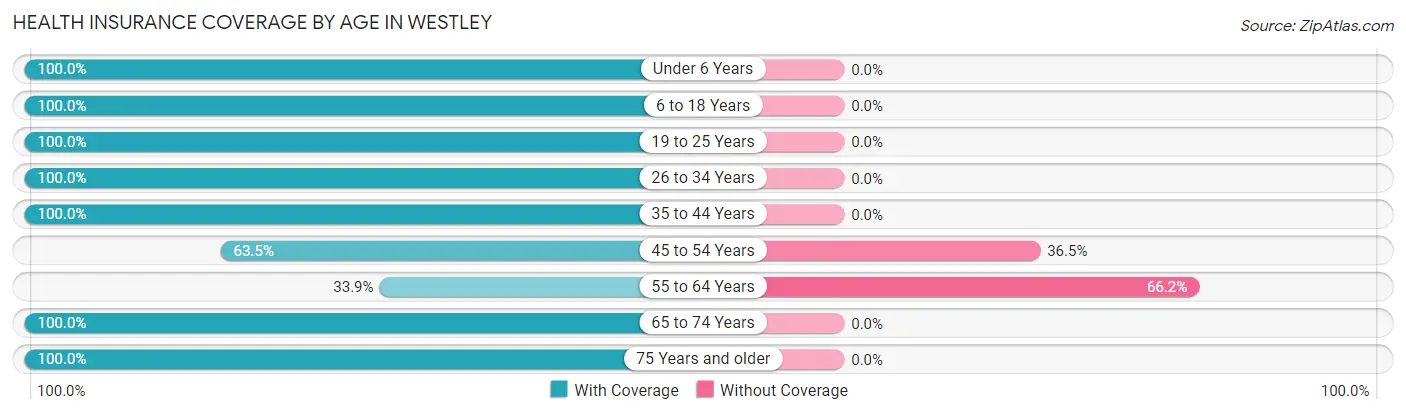
| Age Bracket | With Coverage | Without Coverage |
| Under 6 Years | 148 (100.0%) | 0 (0.0%) |
| 6 to 18 Years | 98 (100.0%) | 0 (0.0%) |
| 19 to 25 Years | 82 (100.0%) | 0 (0.0%) |
| 26 to 34 Years | 80 (100.0%) | 0 (0.0%) |
| 35 to 44 Years | 19 (100.0%) | 0 (0.0%) |
| 45 to 54 Years | 33 (63.5%) | 19 (36.5%) |
| 55 to 64 Years | 22 (33.9%) | 43 (66.1%) |
| 65 to 74 Years | 37 (100.0%) | 0 (0.0%) |
| 75 Years and older | 21 (100.0%) | 0 (0.0%) |
| Total | 540 (89.7%) | 62 (10.3%) |
Health Insurance Coverage by Citizenship Status in Westley
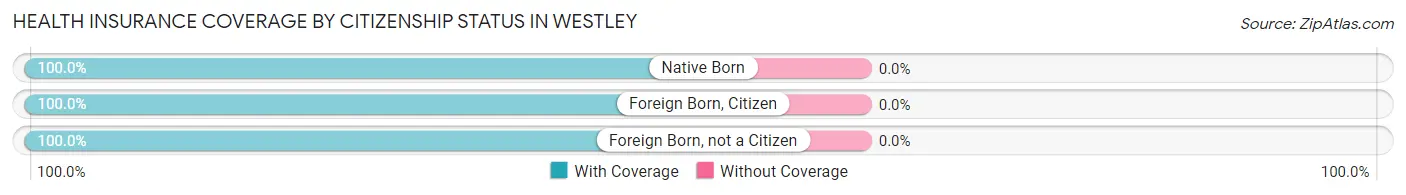
| Citizenship Status | With Coverage | Without Coverage |
| Native Born | 148 (100.0%) | 0 (0.0%) |
| Foreign Born, Citizen | 98 (100.0%) | 0 (0.0%) |
| Foreign Born, not a Citizen | 82 (100.0%) | 0 (0.0%) |
Health Insurance Coverage by Household Income in Westley
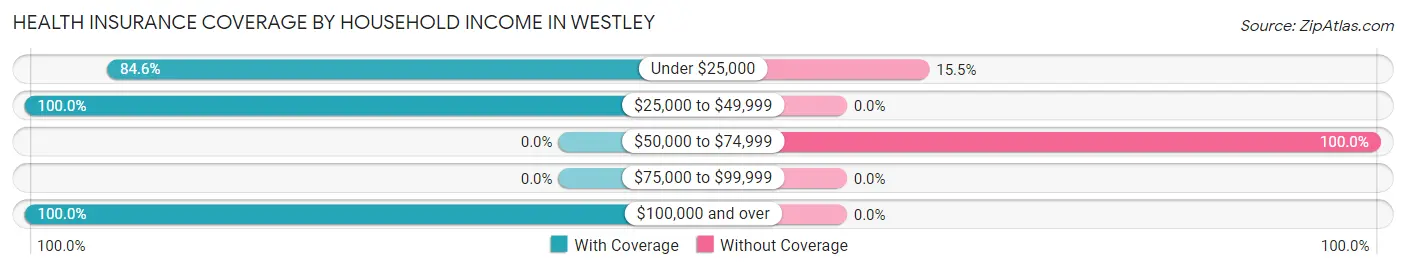
| Household Income | With Coverage | Without Coverage |
| Under $25,000 | 104 (84.6%) | 19 (15.4%) |
| $25,000 to $49,999 | 326 (100.0%) | 0 (0.0%) |
| $50,000 to $74,999 | 0 (0.0%) | 43 (100.0%) |
| $75,000 to $99,999 | 0 (0.0%) | 0 (0.0%) |
| $100,000 and over | 110 (100.0%) | 0 (0.0%) |
Public vs Private Health Insurance Coverage by Age in Westley
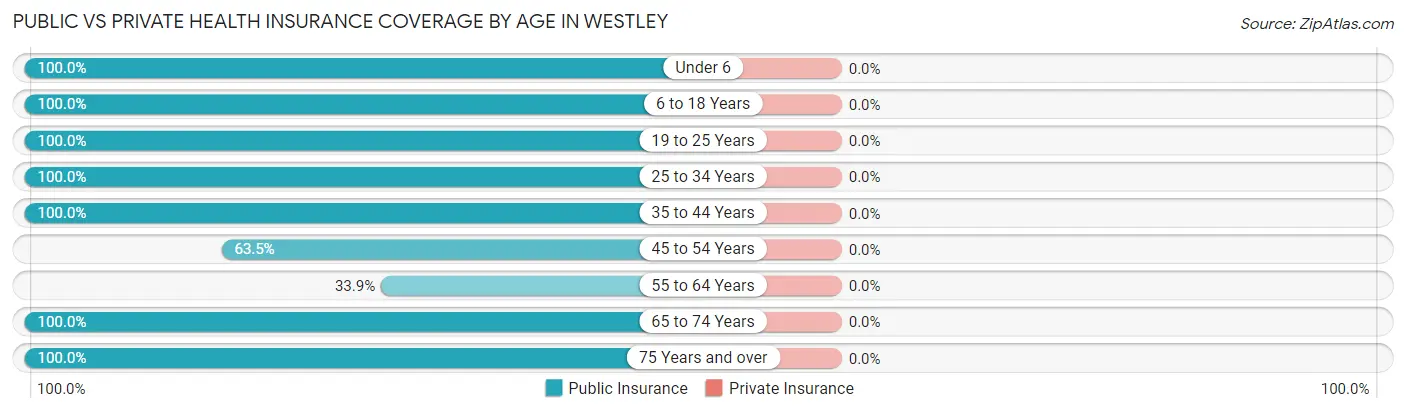
| Age Bracket | Public Insurance | Private Insurance |
| Under 6 | 148 (100.0%) | 0 (0.0%) |
| 6 to 18 Years | 98 (100.0%) | 0 (0.0%) |
| 19 to 25 Years | 82 (100.0%) | 0 (0.0%) |
| 25 to 34 Years | 80 (100.0%) | 0 (0.0%) |
| 35 to 44 Years | 19 (100.0%) | 0 (0.0%) |
| 45 to 54 Years | 33 (63.5%) | 0 (0.0%) |
| 55 to 64 Years | 22 (33.9%) | 0 (0.0%) |
| 65 to 74 Years | 37 (100.0%) | 0 (0.0%) |
| 75 Years and over | 21 (100.0%) | 0 (0.0%) |
| Total | 540 (89.7%) | 0 (0.0%) |
Disability Status by Sex by Age in Westley
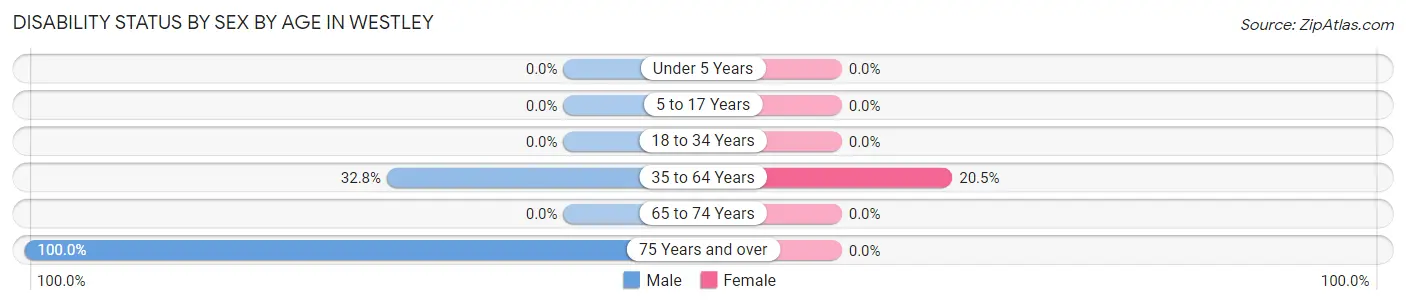
| Age Bracket | Male | Female |
| Under 5 Years | 0 (0.0%) | 0 (0.0%) |
| 5 to 17 Years | 0 (0.0%) | 0 (0.0%) |
| 18 to 34 Years | 0 (0.0%) | 0 (0.0%) |
| 35 to 64 Years | 19 (32.8%) | 16 (20.5%) |
| 65 to 74 Years | 0 (0.0%) | 0 (0.0%) |
| 75 Years and over | 21 (100.0%) | 0 (0.0%) |
Disability Class by Sex by Age in Westley
Disability Class: Hearing Difficulty
| Age Bracket | Male | Female |
| Under 5 Years | 0 (0.0%) | 0 (0.0%) |
| 5 to 17 Years | 0 (0.0%) | 0 (0.0%) |
| 18 to 34 Years | 0 (0.0%) | 0 (0.0%) |
| 35 to 64 Years | 0 (0.0%) | 0 (0.0%) |
| 65 to 74 Years | 0 (0.0%) | 0 (0.0%) |
| 75 Years and over | 0 (0.0%) | 0 (0.0%) |
Disability Class: Vision Difficulty
| Age Bracket | Male | Female |
| Under 5 Years | 0 (0.0%) | 0 (0.0%) |
| 5 to 17 Years | 0 (0.0%) | 0 (0.0%) |
| 18 to 34 Years | 0 (0.0%) | 0 (0.0%) |
| 35 to 64 Years | 0 (0.0%) | 0 (0.0%) |
| 65 to 74 Years | 0 (0.0%) | 0 (0.0%) |
| 75 Years and over | 0 (0.0%) | 0 (0.0%) |
Disability Class: Cognitive Difficulty
| Age Bracket | Male | Female |
| 5 to 17 Years | 0 (0.0%) | 0 (0.0%) |
| 18 to 34 Years | 0 (0.0%) | 0 (0.0%) |
| 35 to 64 Years | 0 (0.0%) | 0 (0.0%) |
| 65 to 74 Years | 0 (0.0%) | 0 (0.0%) |
| 75 Years and over | 0 (0.0%) | 0 (0.0%) |
Disability Class: Ambulatory Difficulty
| Age Bracket | Male | Female |
| 5 to 17 Years | 0 (0.0%) | 0 (0.0%) |
| 18 to 34 Years | 0 (0.0%) | 0 (0.0%) |
| 35 to 64 Years | 19 (32.8%) | 16 (20.5%) |
| 65 to 74 Years | 0 (0.0%) | 0 (0.0%) |
| 75 Years and over | 21 (100.0%) | 0 (0.0%) |
Disability Class: Self-Care Difficulty
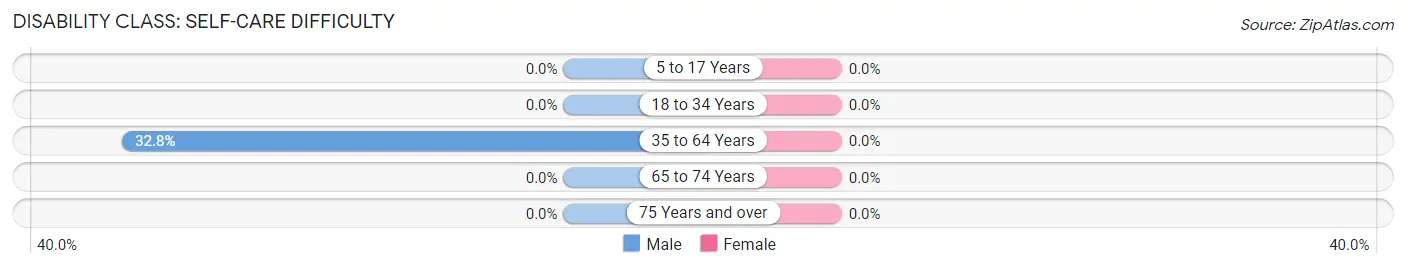
| Age Bracket | Male | Female |
| 5 to 17 Years | 0 (0.0%) | 0 (0.0%) |
| 18 to 34 Years | 0 (0.0%) | 0 (0.0%) |
| 35 to 64 Years | 19 (32.8%) | 0 (0.0%) |
| 65 to 74 Years | 0 (0.0%) | 0 (0.0%) |
| 75 Years and over | 0 (0.0%) | 0 (0.0%) |
Technology Access in Westley
Computing Device Access in Westley
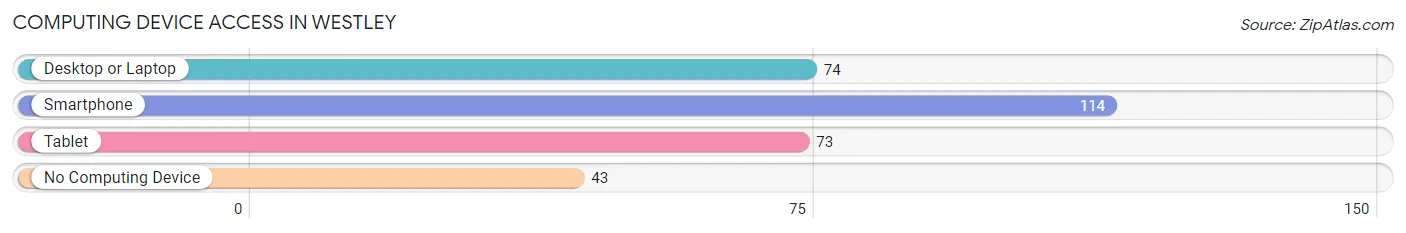
| Device Type | # Households | % Households |
| Desktop or Laptop | 74 | 47.1% |
| Smartphone | 114 | 72.6% |
| Tablet | 73 | 46.5% |
| No Computing Device | 43 | 27.4% |
| Total | 157 | 100.0% |
Internet Access in Westley
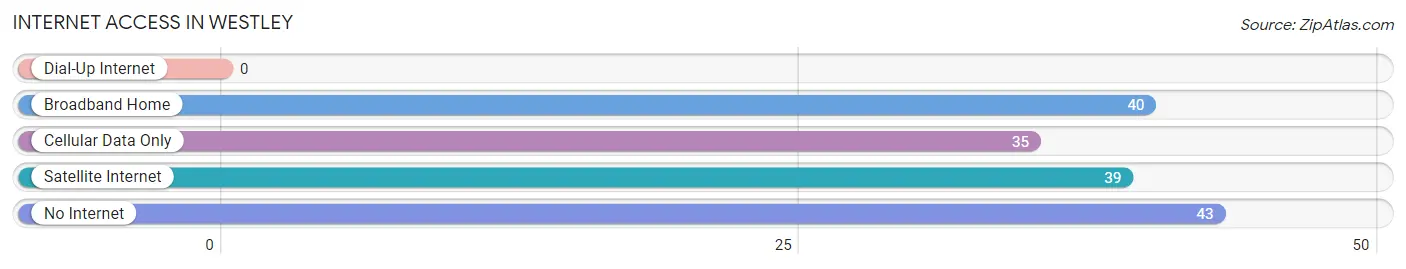
| Internet Type | # Households | % Households |
| Dial-Up Internet | 0 | 0.0% |
| Broadband Home | 40 | 25.5% |
| Cellular Data Only | 35 | 22.3% |
| Satellite Internet | 39 | 24.8% |
| No Internet | 43 | 27.4% |
| Total | 157 | 100.0% |
Westley Summary
Westley is a small unincorporated community located in Stanislaus County, California. It is situated in the Central Valley, approximately 10 miles east of Modesto. The population of Westley was estimated to be 1,845 in 2019.
History
Westley was founded in 1891 by William Westley, a rancher from the Midwest. He purchased a large tract of land in the area and began to develop it for agricultural purposes. The town was originally called Westleyville, but the name was changed to Westley in 1895.
The town grew slowly but steadily over the years, and by the early 1900s, it had become a thriving agricultural community. The town was home to a variety of businesses, including a general store, a blacksmith shop, a hotel, and a saloon.
In the 1920s, Westley began to experience a period of growth and prosperity. The town was home to a number of successful businesses, including a bank, a movie theater, and a variety of stores. The town also had its own newspaper, the Westley Gazette.
In the 1950s, Westley experienced a period of decline. Many of the businesses in town closed, and the population began to decline. The town was further impacted by the construction of Interstate 5, which bypassed the town.
Geography
Westley is located in the Central Valley of California, approximately 10 miles east of Modesto. The town is situated on the banks of the Tuolumne River, which flows through the area. The town is surrounded by rolling hills and farmland.
The climate in Westley is mild and temperate. Summers are hot and dry, while winters are cool and wet. The average annual temperature is around 60 degrees Fahrenheit.
Economy
Westley’s economy is largely based on agriculture. The town is home to a number of farms and ranches, which produce a variety of crops, including almonds, walnuts, and grapes. The town is also home to a number of small businesses, including restaurants, stores, and service providers.
Demographics
As of 2019, the population of Westley was estimated to be 1,845. The town is predominantly white, with a small Hispanic population. The median household income is $50,000, and the median home value is $250,000.
Conclusion
Westley is a small unincorporated community located in Stanislaus County, California. It is situated in the Central Valley, approximately 10 miles east of Modesto. The population of Westley was estimated to be 1,845 in 2019. The town is predominantly white, with a small Hispanic population. The economy of Westley is largely based on agriculture, and the town is home to a number of small businesses.
Common Questions
What is Per Capita Income in Westley?
Per Capita income in Westley is $10,642.
What is the Median Household income in Westley?
Median Household Income in Westley is $29,464.
What is Inequality or Gini Index in Westley?
Inequality or Gini Index in Westley is 0.36.
What is the Total Population of Westley?
Total Population of Westley is 602.
What is the Total Male Population of Westley?
Total Male Population of Westley is 370.
What is the Total Female Population of Westley?
Total Female Population of Westley is 232.
What is the Ratio of Males per 100 Females in Westley?
There are 159.48 Males per 100 Females in Westley.
What is the Ratio of Females per 100 Males in Westley?
There are 62.70 Females per 100 Males in Westley.
What is the Median Population Age in Westley?
Median Population Age in Westley is 24.3 Years.
What is the Average Family Size in Westley
Average Family Size in Westley is 3.7 People.
What is the Average Household Size in Westley
Average Household Size in Westley is 3.8 People.
How Large is the Labor Force in Westley?
There are 201 People in the Labor Forcein in Westley.
What is the Percentage of People in the Labor Force in Westley?
56.5% of People are in the Labor Force in Westley.
What is the Unemployment Rate in Westley?
Unemployment Rate in Westley is 59.7%.