Cities with the Highest Unemployment Rate Amomg Youth Under the Age of 25 in Arizona
RELATED REPORTS & OPTIONS
Highest Unemployment | Youth < 25
Arizona
Compare Cities
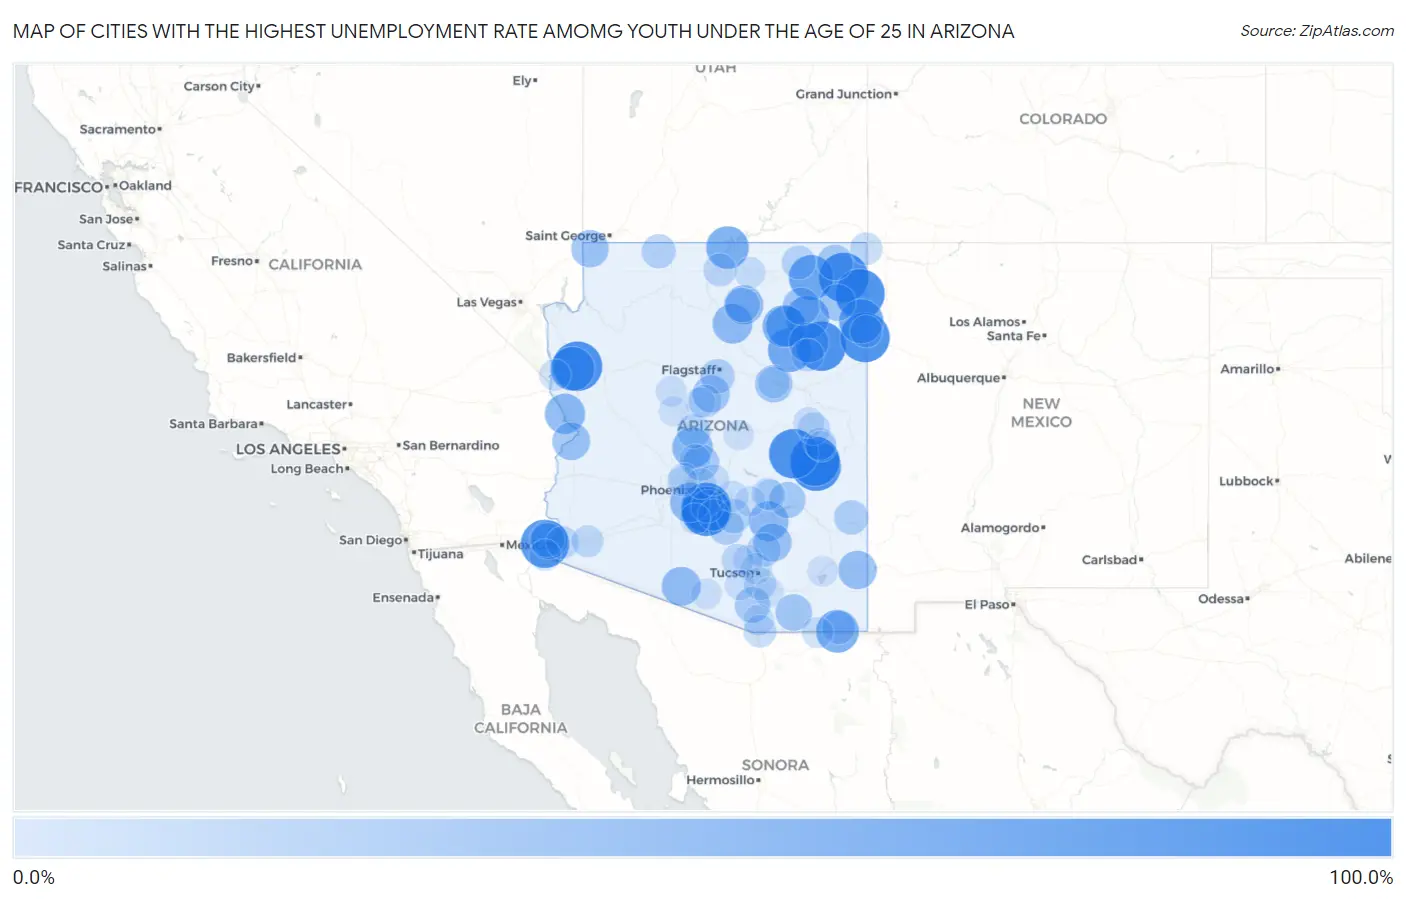
Map of Cities with the Highest Unemployment Rate Amomg Youth Under the Age of 25 in Arizona
0.0%
100.0%
Cities with the Highest Unemployment Rate Amomg Youth Under the Age of 25 in Arizona
| City | Youth Unemployment | vs State | vs National | |
| 1. | So Hi | 100.0% | 10.6%(+89.4)#1 | 10.9%(+89.1)#111 |
| 2. | Goodyear Village | 100.0% | 10.6%(+89.4)#2 | 10.9%(+89.1)#136 |
| 3. | Yuma Proving Ground | 100.0% | 10.6%(+89.4)#3 | 10.9%(+89.1)#147 |
| 4. | Greasewood | 100.0% | 10.6%(+89.4)#4 | 10.9%(+89.1)#157 |
| 5. | Wet Camp Village | 100.0% | 10.6%(+89.4)#5 | 10.9%(+89.1)#209 |
| 6. | Seven Mile | 99.9% | 10.6%(+89.3)#6 | 10.9%(+89.0)#334 |
| 7. | Round Rock | 99.9% | 10.6%(+89.3)#7 | 10.9%(+89.0)#346 |
| 8. | Sehili | 99.9% | 10.6%(+89.3)#8 | 10.9%(+89.0)#360 |
| 9. | St Michaels | 99.8% | 10.6%(+89.2)#9 | 10.9%(+88.9)#370 |
| 10. | Rainbow City | 99.8% | 10.6%(+89.2)#10 | 10.9%(+88.9)#371 |
| 11. | Carrizo | 99.7% | 10.6%(+89.1)#11 | 10.9%(+88.8)#377 |
| 12. | Wall Lane | 94.1% | 10.6%(+83.5)#12 | 10.9%(+83.2)#389 |
| 13. | Chilchinbito | 78.6% | 10.6%(+68.0)#13 | 10.9%(+67.7)#475 |
| 14. | Sawmill | 76.0% | 10.6%(+65.4)#14 | 10.9%(+65.1)#496 |
| 15. | Golden Valley | 75.0% | 10.6%(+64.4)#15 | 10.9%(+64.1)#506 |
| 16. | Tees Toh | 75.0% | 10.6%(+64.4)#16 | 10.9%(+64.1)#507 |
| 17. | Low Mountain | 71.0% | 10.6%(+60.4)#17 | 10.9%(+60.1)#572 |
| 18. | Pirtleville | 69.4% | 10.6%(+58.8)#18 | 10.9%(+58.5)#593 |
| 19. | Page | 68.1% | 10.6%(+57.5)#19 | 10.9%(+57.2)#612 |
| 20. | Shongopovi | 66.5% | 10.6%(+55.9)#20 | 10.9%(+55.6)#656 |
| 21. | Second Mesa | 60.5% | 10.6%(+49.9)#21 | 10.9%(+49.6)#759 |
| 22. | Black Canyon City | 58.9% | 10.6%(+48.3)#22 | 10.9%(+48.0)#803 |
| 23. | Desert Hills | 57.5% | 10.6%(+46.9)#23 | 10.9%(+46.6)#835 |
| 24. | Gila Crossing | 55.5% | 10.6%(+44.9)#24 | 10.9%(+44.6)#896 |
| 25. | Whitecone | 55.5% | 10.6%(+44.9)#25 | 10.9%(+44.6)#897 |
| 26. | Cameron | 55.3% | 10.6%(+44.7)#26 | 10.9%(+44.4)#916 |
| 27. | Hayden | 55.3% | 10.6%(+44.7)#27 | 10.9%(+44.4)#917 |
| 28. | Moenkopi | 53.3% | 10.6%(+42.7)#28 | 10.9%(+42.4)#981 |
| 29. | Pisinemo | 52.3% | 10.6%(+41.7)#29 | 10.9%(+41.4)#1,015 |
| 30. | San Simon | 50.0% | 10.6%(+39.4)#30 | 10.9%(+39.1)#1,121 |
| 31. | Kaibab Estates West | 49.4% | 10.6%(+38.8)#31 | 10.9%(+38.5)#1,196 |
| 32. | Avenue B And C | 49.2% | 10.6%(+38.6)#32 | 10.9%(+38.3)#1,203 |
| 33. | Mammoth | 48.2% | 10.6%(+37.6)#33 | 10.9%(+37.3)#1,234 |
| 34. | Sunsites | 47.0% | 10.6%(+36.4)#34 | 10.9%(+36.1)#1,267 |
| 35. | Bluewater | 46.6% | 10.6%(+36.0)#35 | 10.9%(+35.7)#1,277 |
| 36. | Beaver Dam | 45.0% | 10.6%(+34.4)#36 | 10.9%(+34.1)#1,360 |
| 37. | Winslow West | 44.4% | 10.6%(+33.8)#37 | 10.9%(+33.5)#1,397 |
| 38. | Pinon | 44.2% | 10.6%(+33.6)#38 | 10.9%(+33.3)#1,410 |
| 39. | Sedona | 43.7% | 10.6%(+33.1)#39 | 10.9%(+32.8)#1,429 |
| 40. | Chinle | 41.5% | 10.6%(+30.9)#40 | 10.9%(+30.6)#1,609 |
| 41. | Huachuca City | 41.2% | 10.6%(+30.6)#41 | 10.9%(+30.3)#1,624 |
| 42. | Peridot | 39.0% | 10.6%(+28.4)#42 | 10.9%(+28.1)#1,780 |
| 43. | Cave Creek | 38.2% | 10.6%(+27.6)#43 | 10.9%(+27.3)#1,832 |
| 44. | Rock Point | 37.5% | 10.6%(+26.9)#44 | 10.9%(+26.6)#1,891 |
| 45. | Arivaca Junction | 37.1% | 10.6%(+26.5)#45 | 10.9%(+26.2)#1,931 |
| 46. | Coolidge | 33.1% | 10.6%(+22.5)#46 | 10.9%(+22.2)#2,353 |
| 47. | Tuba City | 33.1% | 10.6%(+22.5)#47 | 10.9%(+22.2)#2,355 |
| 48. | Kachina Village | 32.5% | 10.6%(+21.9)#48 | 10.9%(+21.6)#2,398 |
| 49. | Morenci | 32.2% | 10.6%(+21.6)#49 | 10.9%(+21.3)#2,428 |
| 50. | Florence | 31.3% | 10.6%(+20.7)#50 | 10.9%(+20.4)#2,527 |
| 51. | Kaibab | 30.7% | 10.6%(+20.1)#51 | 10.9%(+19.8)#2,606 |
| 52. | Saddlebrooke | 29.6% | 10.6%(+19.0)#52 | 10.9%(+18.7)#2,731 |
| 53. | Donovan Estates | 29.6% | 10.6%(+19.0)#53 | 10.9%(+18.7)#2,740 |
| 54. | Cordes Lakes | 29.5% | 10.6%(+18.9)#54 | 10.9%(+18.6)#2,748 |
| 55. | Kayenta | 29.2% | 10.6%(+18.6)#55 | 10.9%(+18.3)#2,783 |
| 56. | Douglas | 26.6% | 10.6%(+16.0)#56 | 10.9%(+15.7)#3,165 |
| 57. | Cornville | 26.2% | 10.6%(+15.6)#57 | 10.9%(+15.3)#3,269 |
| 58. | Bitter Springs | 25.5% | 10.6%(+14.9)#58 | 10.9%(+14.6)#3,394 |
| 59. | Indian Wells | 24.9% | 10.6%(+14.3)#59 | 10.9%(+14.0)#3,543 |
| 60. | Sun Lakes | 24.3% | 10.6%(+13.7)#60 | 10.9%(+13.4)#3,637 |
| 61. | Fortuna Foothills | 24.1% | 10.6%(+13.5)#61 | 10.9%(+13.2)#3,675 |
| 62. | White Mountain Lake | 23.5% | 10.6%(+12.9)#62 | 10.9%(+12.6)#3,813 |
| 63. | Teec Nos Pos | 23.5% | 10.6%(+12.9)#63 | 10.9%(+12.6)#3,819 |
| 64. | Nogales | 23.2% | 10.6%(+12.6)#64 | 10.9%(+12.3)#3,868 |
| 65. | Timberline-Fernwood | 23.1% | 10.6%(+12.5)#65 | 10.9%(+12.2)#3,901 |
| 66. | Summit | 22.9% | 10.6%(+12.3)#66 | 10.9%(+12.0)#3,961 |
| 67. | Fort Defiance | 22.9% | 10.6%(+12.3)#67 | 10.9%(+12.0)#3,963 |
| 68. | Avra Valley | 21.8% | 10.6%(+11.2)#68 | 10.9%(+10.9)#4,223 |
| 69. | Tacna | 21.7% | 10.6%(+11.1)#69 | 10.9%(+10.8)#4,263 |
| 70. | Pinetop Country Club | 21.6% | 10.6%(+11.0)#70 | 10.9%(+10.7)#4,282 |
| 71. | Central Heights Midland City | 20.5% | 10.6%(+9.90)#71 | 10.9%(+9.60)#4,569 |
| 72. | Winslow | 19.9% | 10.6%(+9.30)#72 | 10.9%(+9.00)#4,752 |
| 73. | Bullhead City | 19.5% | 10.6%(+8.90)#73 | 10.9%(+8.60)#4,857 |
| 74. | New River | 19.5% | 10.6%(+8.90)#74 | 10.9%(+8.60)#4,860 |
| 75. | San Luis | 19.4% | 10.6%(+8.80)#75 | 10.9%(+8.50)#4,888 |
| 76. | Sun City | 18.8% | 10.6%(+8.20)#76 | 10.9%(+7.90)#5,092 |
| 77. | Sacaton | 18.7% | 10.6%(+8.10)#77 | 10.9%(+7.80)#5,139 |
| 78. | Globe | 18.4% | 10.6%(+7.80)#78 | 10.9%(+7.50)#5,230 |
| 79. | Gold Canyon | 18.1% | 10.6%(+7.50)#79 | 10.9%(+7.20)#5,302 |
| 80. | Naco | 18.1% | 10.6%(+7.50)#80 | 10.9%(+7.20)#5,324 |
| 81. | Flowing Wells | 18.0% | 10.6%(+7.40)#81 | 10.9%(+7.10)#5,371 |
| 82. | Kaibito | 17.8% | 10.6%(+7.20)#82 | 10.9%(+6.90)#5,458 |
| 83. | Fountain Hills | 17.6% | 10.6%(+7.00)#83 | 10.9%(+6.70)#5,524 |
| 84. | Red Rock Cdp Pinal County | 16.9% | 10.6%(+6.30)#84 | 10.9%(+6.00)#5,831 |
| 85. | Rio Rico | 16.8% | 10.6%(+6.20)#85 | 10.9%(+5.90)#5,856 |
| 86. | Paulden | 16.3% | 10.6%(+5.70)#86 | 10.9%(+5.40)#6,088 |
| 87. | Ak Chin Village | 16.2% | 10.6%(+5.60)#87 | 10.9%(+5.30)#6,142 |
| 88. | Taylor | 16.1% | 10.6%(+5.50)#88 | 10.9%(+5.20)#6,167 |
| 89. | Marana | 15.5% | 10.6%(+4.90)#89 | 10.9%(+4.60)#6,424 |
| 90. | Willcox | 15.4% | 10.6%(+4.80)#90 | 10.9%(+4.50)#6,500 |
| 91. | Mcnary | 15.4% | 10.6%(+4.80)#91 | 10.9%(+4.50)#6,509 |
| 92. | Paradise Valley | 15.3% | 10.6%(+4.70)#92 | 10.9%(+4.40)#6,518 |
| 93. | Superior | 15.3% | 10.6%(+4.70)#93 | 10.9%(+4.40)#6,535 |
| 94. | Sells | 14.9% | 10.6%(+4.30)#94 | 10.9%(+4.00)#6,729 |
| 95. | Three Points | 14.5% | 10.6%(+3.90)#95 | 10.9%(+3.60)#6,921 |
| 96. | Verde Village | 14.2% | 10.6%(+3.60)#96 | 10.9%(+3.30)#7,043 |
| 97. | Youngtown | 14.2% | 10.6%(+3.60)#97 | 10.9%(+3.30)#7,051 |
| 98. | Corona De Tucson | 13.8% | 10.6%(+3.20)#98 | 10.9%(+2.90)#7,315 |
| 99. | Payson | 13.7% | 10.6%(+3.10)#99 | 10.9%(+2.80)#7,374 |
| 100. | Prescott | 13.5% | 10.6%(+2.90)#100 | 10.9%(+2.60)#7,512 |
1
2Common Questions
What are the Top 10 Cities with the Highest Unemployment Rate Amomg Youth Under the Age of 25 in Arizona?
Top 10 Cities with the Highest Unemployment Rate Amomg Youth Under the Age of 25 in Arizona are:
#1
100.0%
#2
100.0%
#3
100.0%
#4
100.0%
#5
99.9%
#6
99.9%
#7
99.9%
#8
99.8%
#9
99.8%
#10
99.7%
What city has the Highest Unemployment Rate Amomg Youth Under the Age of 25 in Arizona?
So Hi has the Highest Unemployment Rate Amomg Youth Under the Age of 25 in Arizona with 100.0%.
What is the Unemployment Rate Amomg Youth Under the Age of 25 in the State of Arizona?
Unemployment Rate Amomg Youth Under the Age of 25 in Arizona is 10.6%.
What is the Unemployment Rate Amomg Youth Under the Age of 25 in the United States?
Unemployment Rate Amomg Youth Under the Age of 25 in the United States is 10.9%.