Cities with the Highest Unemployment Rate Amomg Youth Under the Age of 25 in Illinois
RELATED REPORTS & OPTIONS
Highest Unemployment | Youth < 25
Illinois
Compare Cities
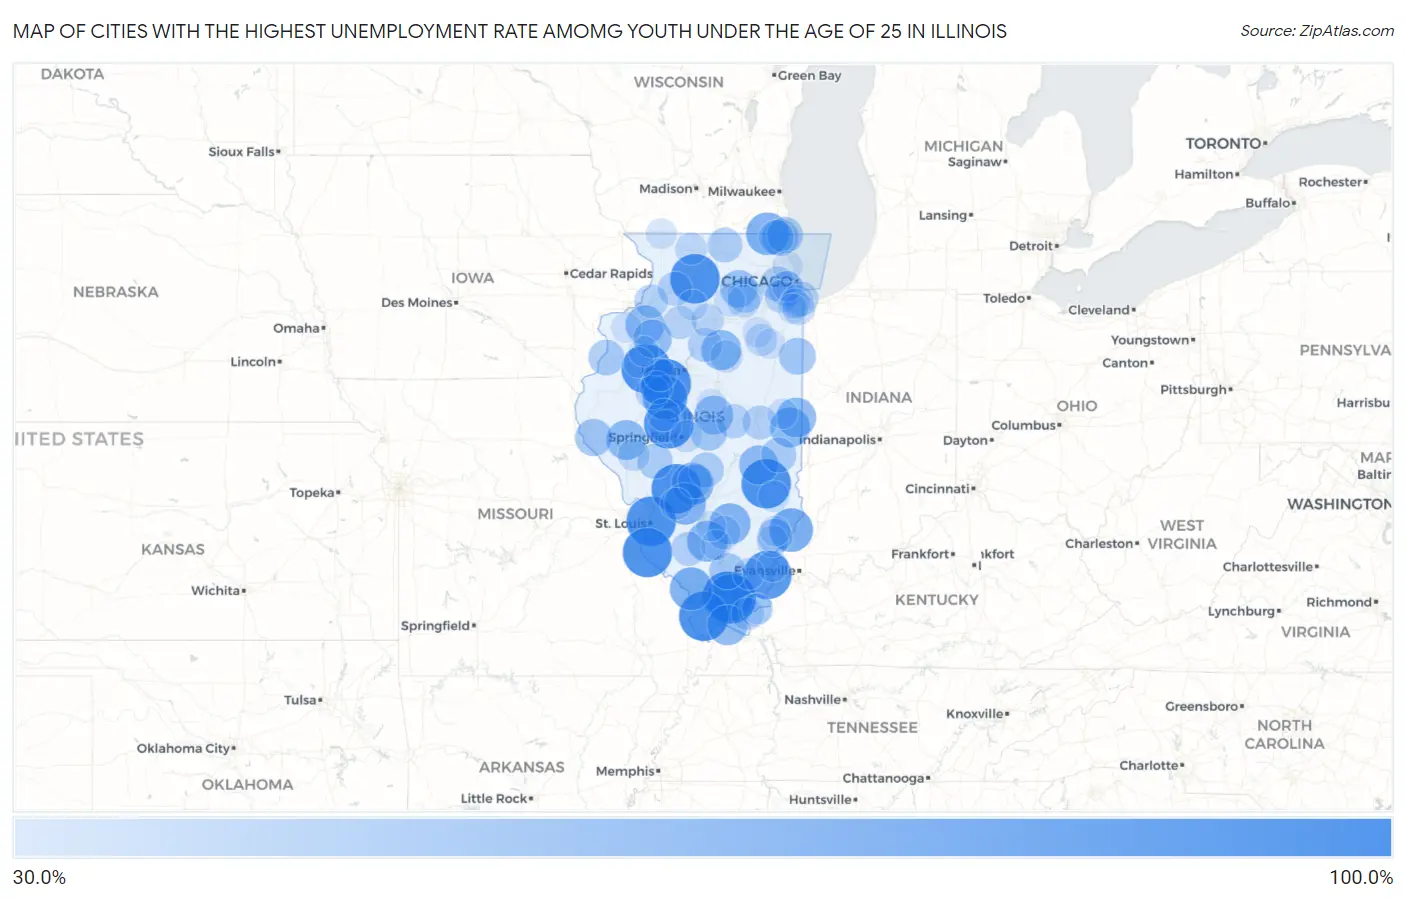
Map of Cities with the Highest Unemployment Rate Amomg Youth Under the Age of 25 in Illinois
0.0%
100.0%
Cities with the Highest Unemployment Rate Amomg Youth Under the Age of 25 in Illinois
| City | Youth Unemployment | vs State | vs National | |
| 1. | Lake Petersburg | 100.0% | 12.2%(+87.8)#1 | 10.9%(+89.1)#75 |
| 2. | Brooklyn | 100.0% | 12.2%(+87.8)#2 | 10.9%(+89.1)#85 |
| 3. | Creal Springs | 100.0% | 12.2%(+87.8)#3 | 10.9%(+89.1)#118 |
| 4. | London Mills | 100.0% | 12.2%(+87.8)#4 | 10.9%(+89.1)#128 |
| 5. | Prairietown | 100.0% | 12.2%(+87.8)#5 | 10.9%(+89.1)#134 |
| 6. | Grand Detour | 100.0% | 12.2%(+87.8)#6 | 10.9%(+89.1)#150 |
| 7. | New Burnside | 100.0% | 12.2%(+87.8)#7 | 10.9%(+89.1)#215 |
| 8. | Banner | 100.0% | 12.2%(+87.8)#8 | 10.9%(+89.1)#223 |
| 9. | Hidalgo | 100.0% | 12.2%(+87.8)#9 | 10.9%(+89.1)#270 |
| 10. | Maeystown | 100.0% | 12.2%(+87.8)#10 | 10.9%(+89.1)#279 |
| 11. | Mill Creek | 100.0% | 12.2%(+87.8)#11 | 10.9%(+89.1)#309 |
| 12. | Lake Ka Ho | 99.9% | 12.2%(+87.7)#12 | 10.9%(+89.0)#353 |
| 13. | New Haven | 95.6% | 12.2%(+83.4)#13 | 10.9%(+84.7)#382 |
| 14. | Gulfport | 84.6% | 12.2%(+72.4)#14 | 10.9%(+73.7)#430 |
| 15. | Topeka | 83.3% | 12.2%(+71.1)#15 | 10.9%(+72.4)#438 |
| 16. | Allendale | 79.0% | 12.2%(+66.8)#16 | 10.9%(+68.1)#471 |
| 17. | Gorham | 76.1% | 12.2%(+63.9)#17 | 10.9%(+65.2)#495 |
| 18. | Lake Catherine | 75.9% | 12.2%(+63.7)#18 | 10.9%(+65.0)#498 |
| 19. | Schram City | 74.9% | 12.2%(+62.7)#19 | 10.9%(+64.0)#518 |
| 20. | Old Ripley | 72.7% | 12.2%(+60.5)#20 | 10.9%(+61.8)#547 |
| 21. | Iuka | 70.6% | 12.2%(+58.4)#21 | 10.9%(+59.7)#578 |
| 22. | Richview | 69.9% | 12.2%(+57.7)#22 | 10.9%(+59.0)#588 |
| 23. | Joppa | 68.2% | 12.2%(+56.0)#23 | 10.9%(+57.3)#611 |
| 24. | Dana | 66.7% | 12.2%(+54.5)#24 | 10.9%(+55.8)#633 |
| 25. | Indianola | 66.6% | 12.2%(+54.4)#25 | 10.9%(+55.7)#641 |
| 26. | Naples | 66.6% | 12.2%(+54.4)#26 | 10.9%(+55.7)#649 |
| 27. | Belgium | 66.5% | 12.2%(+54.3)#27 | 10.9%(+55.6)#658 |
| 28. | Lerna | 63.9% | 12.2%(+51.7)#28 | 10.9%(+53.0)#689 |
| 29. | Andover | 63.7% | 12.2%(+51.5)#29 | 10.9%(+52.8)#695 |
| 30. | Kenney | 62.4% | 12.2%(+50.2)#30 | 10.9%(+51.5)#723 |
| 31. | Altona | 61.2% | 12.2%(+49.0)#31 | 10.9%(+50.3)#741 |
| 32. | Hinckley | 57.5% | 12.2%(+45.3)#32 | 10.9%(+46.6)#837 |
| 33. | Plainville | 57.1% | 12.2%(+44.9)#33 | 10.9%(+46.2)#854 |
| 34. | Donovan | 55.8% | 12.2%(+43.6)#34 | 10.9%(+44.9)#890 |
| 35. | Wadsworth | 55.1% | 12.2%(+42.9)#35 | 10.9%(+44.2)#922 |
| 36. | Hanaford | 54.5% | 12.2%(+42.3)#36 | 10.9%(+43.6)#941 |
| 37. | Niantic | 54.0% | 12.2%(+41.8)#37 | 10.9%(+43.1)#954 |
| 38. | Winthrop Harbor | 53.4% | 12.2%(+41.2)#38 | 10.9%(+42.5)#974 |
| 39. | Gladstone | 52.3% | 12.2%(+40.1)#39 | 10.9%(+41.4)#1,016 |
| 40. | Plano | 50.3% | 12.2%(+38.1)#40 | 10.9%(+39.4)#1,075 |
| 41. | Scottville | 50.0% | 12.2%(+37.8)#41 | 10.9%(+39.1)#1,150 |
| 42. | Ohlman | 50.0% | 12.2%(+37.8)#42 | 10.9%(+39.1)#1,152 |
| 43. | Kansas | 49.9% | 12.2%(+37.7)#43 | 10.9%(+39.0)#1,165 |
| 44. | Bedford Park | 49.9% | 12.2%(+37.7)#44 | 10.9%(+39.0)#1,166 |
| 45. | Bone Gap | 49.9% | 12.2%(+37.7)#45 | 10.9%(+39.0)#1,179 |
| 46. | Old Mill Creek | 49.9% | 12.2%(+37.7)#46 | 10.9%(+39.0)#1,184 |
| 47. | Timberlane | 48.8% | 12.2%(+36.6)#47 | 10.9%(+37.9)#1,213 |
| 48. | Oak Brook | 48.0% | 12.2%(+35.8)#48 | 10.9%(+37.1)#1,239 |
| 49. | Burnham | 47.8% | 12.2%(+35.6)#49 | 10.9%(+36.9)#1,246 |
| 50. | Varna | 46.6% | 12.2%(+34.4)#50 | 10.9%(+35.7)#1,282 |
| 51. | Irving | 46.6% | 12.2%(+34.4)#51 | 10.9%(+35.7)#1,283 |
| 52. | Oakdale | 46.5% | 12.2%(+34.3)#52 | 10.9%(+35.6)#1,290 |
| 53. | Tolono | 46.4% | 12.2%(+34.2)#53 | 10.9%(+35.5)#1,291 |
| 54. | Como | 46.4% | 12.2%(+34.2)#54 | 10.9%(+35.5)#1,293 |
| 55. | Cisco | 46.1% | 12.2%(+33.9)#55 | 10.9%(+35.2)#1,310 |
| 56. | Lewistown | 45.8% | 12.2%(+33.6)#56 | 10.9%(+34.9)#1,324 |
| 57. | Kell | 45.4% | 12.2%(+33.2)#57 | 10.9%(+34.5)#1,347 |
| 58. | Hillsdale | 45.1% | 12.2%(+32.9)#58 | 10.9%(+34.2)#1,358 |
| 59. | Lockport Heights | 43.9% | 12.2%(+31.7)#59 | 10.9%(+33.0)#1,421 |
| 60. | Buda | 43.9% | 12.2%(+31.7)#60 | 10.9%(+33.0)#1,424 |
| 61. | Palos Park | 43.2% | 12.2%(+31.0)#61 | 10.9%(+32.3)#1,476 |
| 62. | Bryant | 43.2% | 12.2%(+31.0)#62 | 10.9%(+32.3)#1,480 |
| 63. | Norris | 42.8% | 12.2%(+30.6)#63 | 10.9%(+31.9)#1,518 |
| 64. | Dalzell | 42.0% | 12.2%(+29.8)#64 | 10.9%(+31.1)#1,564 |
| 65. | Tallula | 41.8% | 12.2%(+29.6)#65 | 10.9%(+30.9)#1,577 |
| 66. | Millbrook | 41.6% | 12.2%(+29.4)#66 | 10.9%(+30.7)#1,597 |
| 67. | Oakford | 41.6% | 12.2%(+29.4)#67 | 10.9%(+30.7)#1,603 |
| 68. | South Holland | 41.3% | 12.2%(+29.1)#68 | 10.9%(+30.4)#1,615 |
| 69. | Ford Heights | 41.2% | 12.2%(+29.0)#69 | 10.9%(+30.3)#1,625 |
| 70. | Rosiclare | 41.2% | 12.2%(+29.0)#70 | 10.9%(+30.3)#1,627 |
| 71. | Golconda | 41.1% | 12.2%(+28.9)#71 | 10.9%(+30.2)#1,633 |
| 72. | Flanagan | 40.7% | 12.2%(+28.5)#72 | 10.9%(+29.8)#1,658 |
| 73. | Glasgow | 40.0% | 12.2%(+27.8)#73 | 10.9%(+29.1)#1,706 |
| 74. | Ridott | 40.0% | 12.2%(+27.8)#74 | 10.9%(+29.1)#1,707 |
| 75. | Osco | 40.0% | 12.2%(+27.8)#75 | 10.9%(+29.1)#1,711 |
| 76. | Reddick | 39.9% | 12.2%(+27.7)#76 | 10.9%(+29.0)#1,736 |
| 77. | Alhambra | 39.3% | 12.2%(+27.1)#77 | 10.9%(+28.4)#1,761 |
| 78. | Clear Lake | 39.1% | 12.2%(+26.9)#78 | 10.9%(+28.2)#1,775 |
| 79. | Albion | 38.8% | 12.2%(+26.6)#79 | 10.9%(+27.9)#1,794 |
| 80. | Broughton | 38.4% | 12.2%(+26.2)#80 | 10.9%(+27.5)#1,821 |
| 81. | Willow Hill | 37.5% | 12.2%(+25.3)#81 | 10.9%(+26.6)#1,895 |
| 82. | Maunie | 37.5% | 12.2%(+25.3)#82 | 10.9%(+26.6)#1,905 |
| 83. | Elizabethtown | 36.3% | 12.2%(+24.1)#83 | 10.9%(+25.4)#1,991 |
| 84. | Leland | 35.2% | 12.2%(+23.0)#84 | 10.9%(+24.3)#2,087 |
| 85. | Warren | 35.1% | 12.2%(+22.9)#85 | 10.9%(+24.2)#2,102 |
| 86. | West Salem | 35.1% | 12.2%(+22.9)#86 | 10.9%(+24.2)#2,103 |
| 87. | Abingdon | 35.0% | 12.2%(+22.8)#87 | 10.9%(+24.1)#2,110 |
| 88. | Ohio | 35.0% | 12.2%(+22.8)#88 | 10.9%(+24.1)#2,113 |
| 89. | Forest View | 34.9% | 12.2%(+22.7)#89 | 10.9%(+24.0)#2,122 |
| 90. | East Galesburg | 34.6% | 12.2%(+22.4)#90 | 10.9%(+23.7)#2,147 |
| 91. | East Hazel Crest | 34.2% | 12.2%(+22.0)#91 | 10.9%(+23.3)#2,178 |
| 92. | Woodlawn | 34.2% | 12.2%(+22.0)#92 | 10.9%(+23.3)#2,182 |
| 93. | Fithian | 34.2% | 12.2%(+22.0)#93 | 10.9%(+23.3)#2,184 |
| 94. | Gardner | 34.0% | 12.2%(+21.8)#94 | 10.9%(+23.1)#2,198 |
| 95. | Matherville | 34.0% | 12.2%(+21.8)#95 | 10.9%(+23.1)#2,200 |
| 96. | Olympia Fields | 33.8% | 12.2%(+21.6)#96 | 10.9%(+22.9)#2,213 |
| 97. | Herscher | 33.7% | 12.2%(+21.5)#97 | 10.9%(+22.8)#2,225 |
| 98. | Junction City | 33.3% | 12.2%(+21.1)#98 | 10.9%(+22.4)#2,264 |
| 99. | Golf | 33.3% | 12.2%(+21.1)#99 | 10.9%(+22.4)#2,269 |
| 100. | Waynesville | 33.3% | 12.2%(+21.1)#100 | 10.9%(+22.4)#2,277 |
Common Questions
What are the Top 10 Cities with the Highest Unemployment Rate Amomg Youth Under the Age of 25 in Illinois?
Top 10 Cities with the Highest Unemployment Rate Amomg Youth Under the Age of 25 in Illinois are:
#1
100.0%
#2
100.0%
#3
100.0%
#4
100.0%
#5
100.0%
#6
100.0%
#7
100.0%
#8
100.0%
#9
100.0%
#10
100.0%
What city has the Highest Unemployment Rate Amomg Youth Under the Age of 25 in Illinois?
Lake Petersburg has the Highest Unemployment Rate Amomg Youth Under the Age of 25 in Illinois with 100.0%.
What is the Unemployment Rate Amomg Youth Under the Age of 25 in the State of Illinois?
Unemployment Rate Amomg Youth Under the Age of 25 in Illinois is 12.2%.
What is the Unemployment Rate Amomg Youth Under the Age of 25 in the United States?
Unemployment Rate Amomg Youth Under the Age of 25 in the United States is 10.9%.