Plainview, CA Map & Demographics
Plainview Map
Plainview Overview
$18,857
PER CAPITA INCOME
$49,261
AVG FAMILY INCOME
$61,250
AVG HOUSEHOLD INCOME
0.39
INEQUALITY / GINI INDEX
378
TOTAL POPULATION
177
MALE POPULATION
201
FEMALE POPULATION
88.06
MALES / 100 FEMALES
113.56
FEMALES / 100 MALES
42.6
MEDIAN AGE
3.9
AVG FAMILY SIZE
3.1
AVG HOUSEHOLD SIZE
193
LABOR FORCE [ PEOPLE ]
59.8%
PERCENT IN LABOR FORCE
40.4%
UNEMPLOYMENT RATE
Income in Plainview
Income Overview in Plainview
Per Capita Income in Plainview is $18,857, while median incomes of families and households are $49,261 and $61,250 respectively.
| Characteristic | Number | Measure |
| Per Capita Income | 378 | $18,857 |
| Median Family Income | 81 | $49,261 |
| Mean Family Income | 81 | $47,206 |
| Median Household Income | 121 | $61,250 |
| Mean Household Income | 121 | $56,626 |
| Income Deficit | 81 | $0 |
| Wage / Income Gap (%) | 378 | 0.00% |
| Wage / Income Gap ($) | 378 | 100.00¢ per $1 |
| Gini / Inequality Index | 378 | 0.39 |
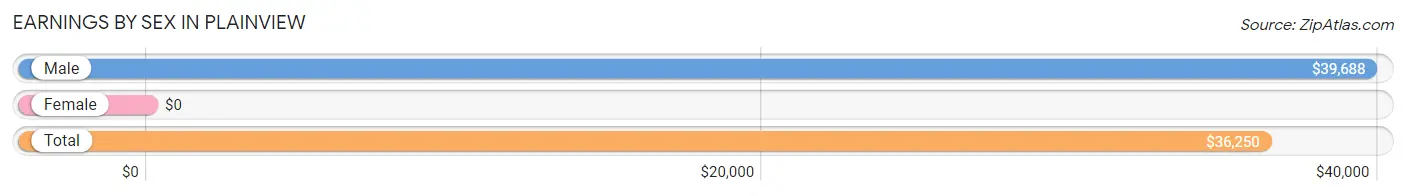
Earnings by Sex in Plainview
| Sex | Number | Average Earnings |
| Male | 103 (57.2%) | $39,688 |
| Female | 77 (42.8%) | $0 |
| Total | 180 (100.0%) | $36,250 |
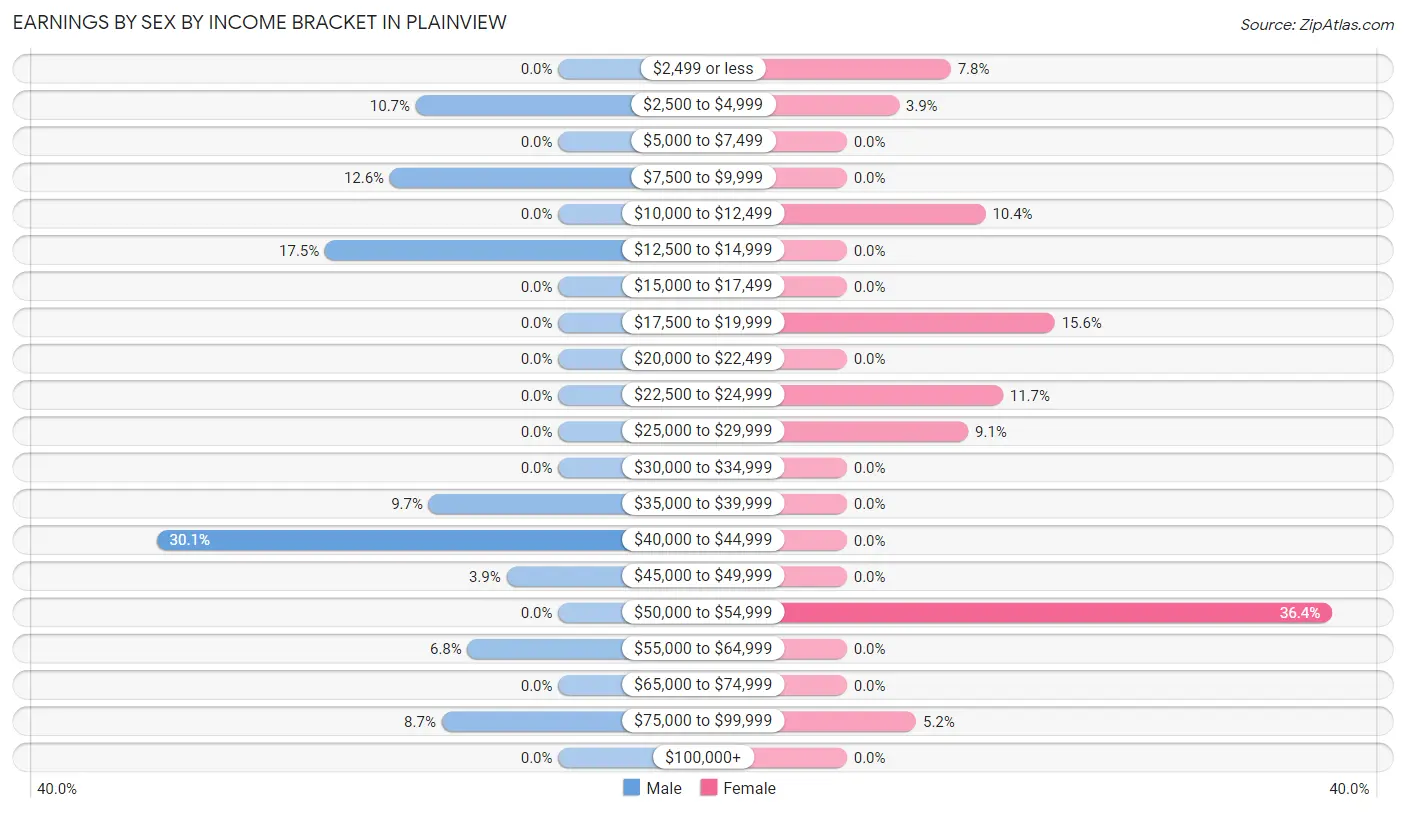
Earnings by Sex by Income Bracket in Plainview
The most common earnings brackets in Plainview are $40,000 to $44,999 for men (31 | 30.1%) and $50,000 to $54,999 for women (28 | 36.4%).
| Income | Male | Female |
| $2,499 or less | 0 (0.0%) | 6 (7.8%) |
| $2,500 to $4,999 | 11 (10.7%) | 3 (3.9%) |
| $5,000 to $7,499 | 0 (0.0%) | 0 (0.0%) |
| $7,500 to $9,999 | 13 (12.6%) | 0 (0.0%) |
| $10,000 to $12,499 | 0 (0.0%) | 8 (10.4%) |
| $12,500 to $14,999 | 18 (17.5%) | 0 (0.0%) |
| $15,000 to $17,499 | 0 (0.0%) | 0 (0.0%) |
| $17,500 to $19,999 | 0 (0.0%) | 12 (15.6%) |
| $20,000 to $22,499 | 0 (0.0%) | 0 (0.0%) |
| $22,500 to $24,999 | 0 (0.0%) | 9 (11.7%) |
| $25,000 to $29,999 | 0 (0.0%) | 7 (9.1%) |
| $30,000 to $34,999 | 0 (0.0%) | 0 (0.0%) |
| $35,000 to $39,999 | 10 (9.7%) | 0 (0.0%) |
| $40,000 to $44,999 | 31 (30.1%) | 0 (0.0%) |
| $45,000 to $49,999 | 4 (3.9%) | 0 (0.0%) |
| $50,000 to $54,999 | 0 (0.0%) | 28 (36.4%) |
| $55,000 to $64,999 | 7 (6.8%) | 0 (0.0%) |
| $65,000 to $74,999 | 0 (0.0%) | 0 (0.0%) |
| $75,000 to $99,999 | 9 (8.7%) | 4 (5.2%) |
| $100,000+ | 0 (0.0%) | 0 (0.0%) |
| Total | 103 (100.0%) | 77 (100.0%) |
Earnings by Sex by Educational Attainment in Plainview
Average earnings in Plainview are $39,688 for men and $23,194 for women, a difference of 41.6%. Men with an educational attainment of high school diploma enjoy the highest average annual earnings of $42,944, while those with less than high school education earn the least with $38,438. Women with an educational attainment of less than high school earn the most with the average annual earnings of $27,679, while those with less than high school education have the smallest earnings of $27,679.

| Educational Attainment | Male Income | Female Income |
| Less than High School | $38,438 | $27,679 |
| High School Diploma | $42,944 | $0 |
| College or Associate's Degree | - | - |
| Bachelor's Degree | - | - |
| Graduate Degree | - | - |
| Total | $39,688 | $23,194 |
Family Income in Plainview
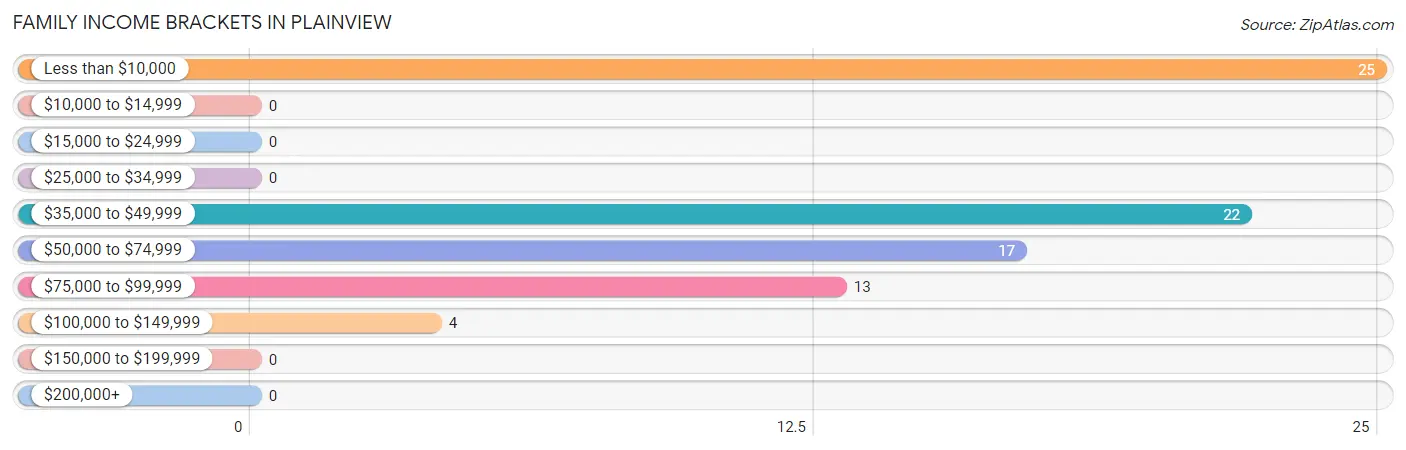
Family Income Brackets in Plainview
According to the Plainview family income data, there are 25 families falling into the less than $10,000 income range, which is the most common income bracket and makes up 30.9% of all families.
| Income Bracket | # Families | % Families |
| Less than $10,000 | 25 | 30.9% |
| $10,000 to $14,999 | 0 | 0.0% |
| $15,000 to $24,999 | 0 | 0.0% |
| $25,000 to $34,999 | 0 | 0.0% |
| $35,000 to $49,999 | 22 | 27.2% |
| $50,000 to $74,999 | 17 | 21.0% |
| $75,000 to $99,999 | 13 | 16.0% |
| $100,000 to $149,999 | 4 | 4.9% |
| $150,000 to $199,999 | 0 | 0.0% |
| $200,000+ | 0 | 0.0% |
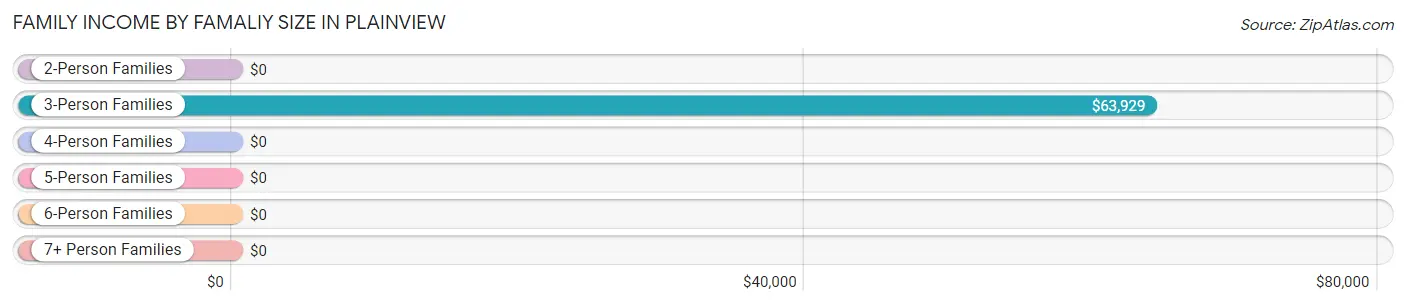
Family Income by Famaliy Size in Plainview
3-person families (34 | 42.0%) account for the highest median family income in Plainview with $63,929 per family, while 3-person families (34 | 42.0%) have the highest median income of $21,310 per family member.
| Income Bracket | # Families | Median Income |
| 2-Person Families | 26 (32.1%) | $0 |
| 3-Person Families | 34 (42.0%) | $63,929 |
| 4-Person Families | 6 (7.4%) | $0 |
| 5-Person Families | 9 (11.1%) | $0 |
| 6-Person Families | 0 (0.0%) | $0 |
| 7+ Person Families | 6 (7.4%) | $0 |
| Total | 81 (100.0%) | $49,261 |
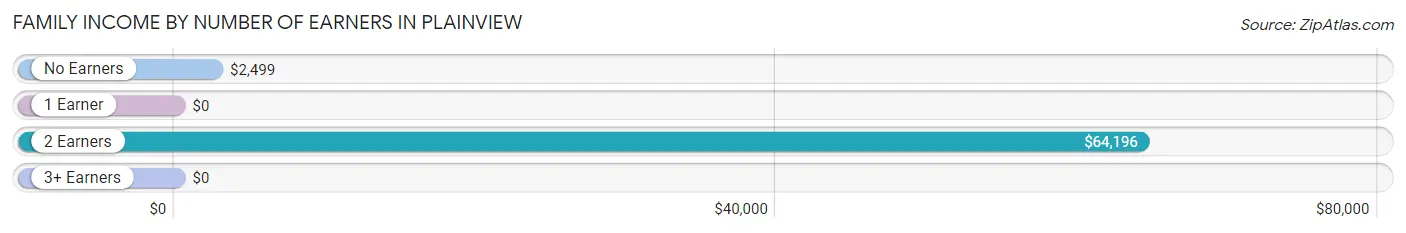
Family Income by Number of Earners in Plainview
| Number of Earners | # Families | Median Income |
| No Earners | 28 (34.6%) | $2,499 |
| 1 Earner | 16 (19.8%) | $0 |
| 2 Earners | 31 (38.3%) | $64,196 |
| 3+ Earners | 6 (7.4%) | $0 |
| Total | 81 (100.0%) | $49,261 |
Household Income in Plainview
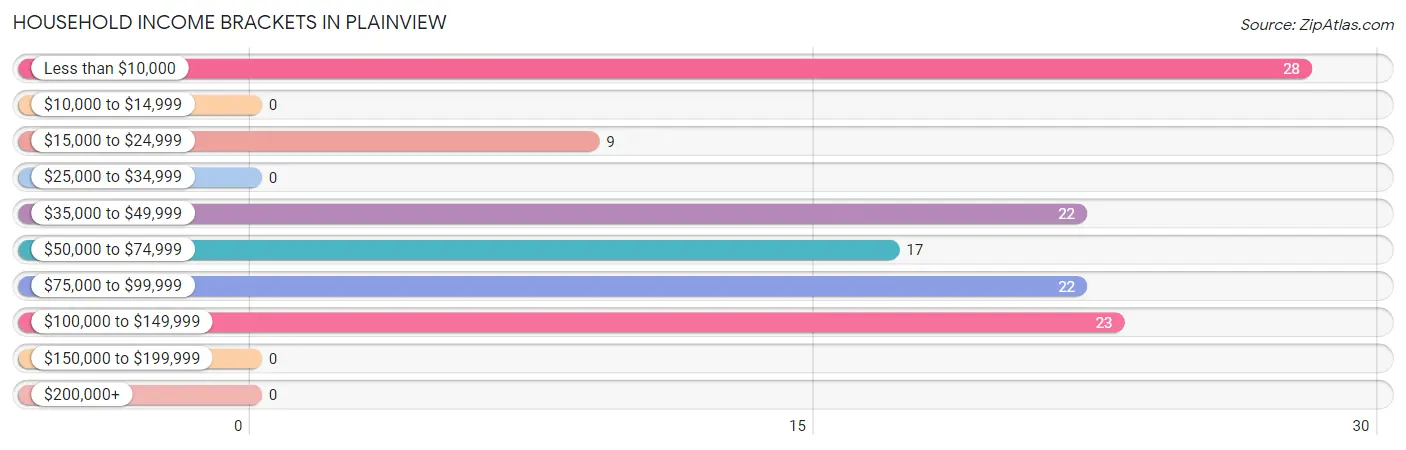
Household Income Brackets in Plainview
With 28 households falling in the category, the less than $10,000 income range is the most frequent in Plainview, accounting for 23.1% of all households.
| Income Bracket | # Households | % Households |
| Less than $10,000 | 28 | 23.1% |
| $10,000 to $14,999 | 0 | 0.0% |
| $15,000 to $24,999 | 9 | 7.4% |
| $25,000 to $34,999 | 0 | 0.0% |
| $35,000 to $49,999 | 22 | 18.2% |
| $50,000 to $74,999 | 17 | 14.0% |
| $75,000 to $99,999 | 22 | 18.2% |
| $100,000 to $149,999 | 23 | 19.0% |
| $150,000 to $199,999 | 0 | 0.0% |
| $200,000+ | 0 | 0.0% |
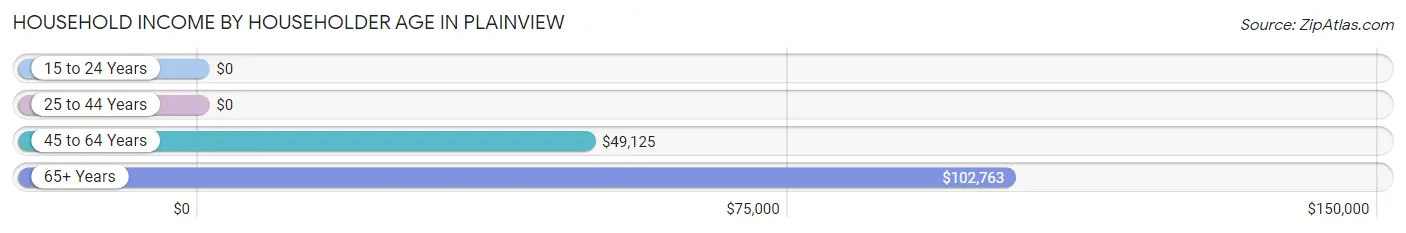
Household Income by Householder Age in Plainview
The median household income in Plainview is $61,250, with the highest median household income of $102,763 found in the 65+ years age bracket for the primary householder. A total of 34 households (28.1%) fall into this category.
| Income Bracket | # Households | Median Income |
| 15 to 24 Years | 0 (0.0%) | $0 |
| 25 to 44 Years | 18 (14.9%) | $0 |
| 45 to 64 Years | 69 (57.0%) | $49,125 |
| 65+ Years | 34 (28.1%) | $102,763 |
| Total | 121 (100.0%) | $61,250 |
Poverty in Plainview
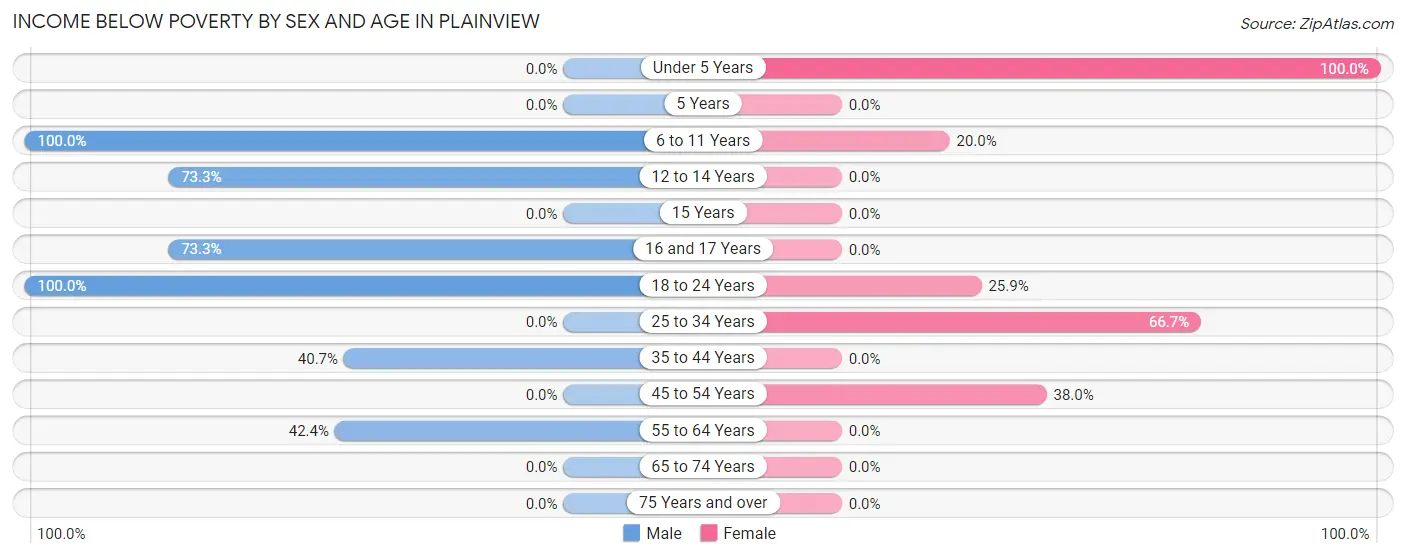
Income Below Poverty by Sex and Age in Plainview
With 34.5% poverty level for males and 24.9% for females among the residents of Plainview, 6 to 11 year old males and under 5 year old females are the most vulnerable to poverty, with 11 males (100.0%) and 2 females (100.0%) in their respective age groups living below the poverty level.
| Age Bracket | Male | Female |
| Under 5 Years | 0 (0.0%) | 2 (100.0%) |
| 5 Years | 0 (0.0%) | 0 (0.0%) |
| 6 to 11 Years | 11 (100.0%) | 3 (20.0%) |
| 12 to 14 Years | 11 (73.3%) | 0 (0.0%) |
| 15 Years | 0 (0.0%) | 0 (0.0%) |
| 16 and 17 Years | 11 (73.3%) | 0 (0.0%) |
| 18 to 24 Years | 3 (100.0%) | 14 (25.9%) |
| 25 to 34 Years | 0 (0.0%) | 12 (66.7%) |
| 35 to 44 Years | 11 (40.7%) | 0 (0.0%) |
| 45 to 54 Years | 0 (0.0%) | 19 (38.0%) |
| 55 to 64 Years | 14 (42.4%) | 0 (0.0%) |
| 65 to 74 Years | 0 (0.0%) | 0 (0.0%) |
| 75 Years and over | 0 (0.0%) | 0 (0.0%) |
| Total | 61 (34.5%) | 50 (24.9%) |
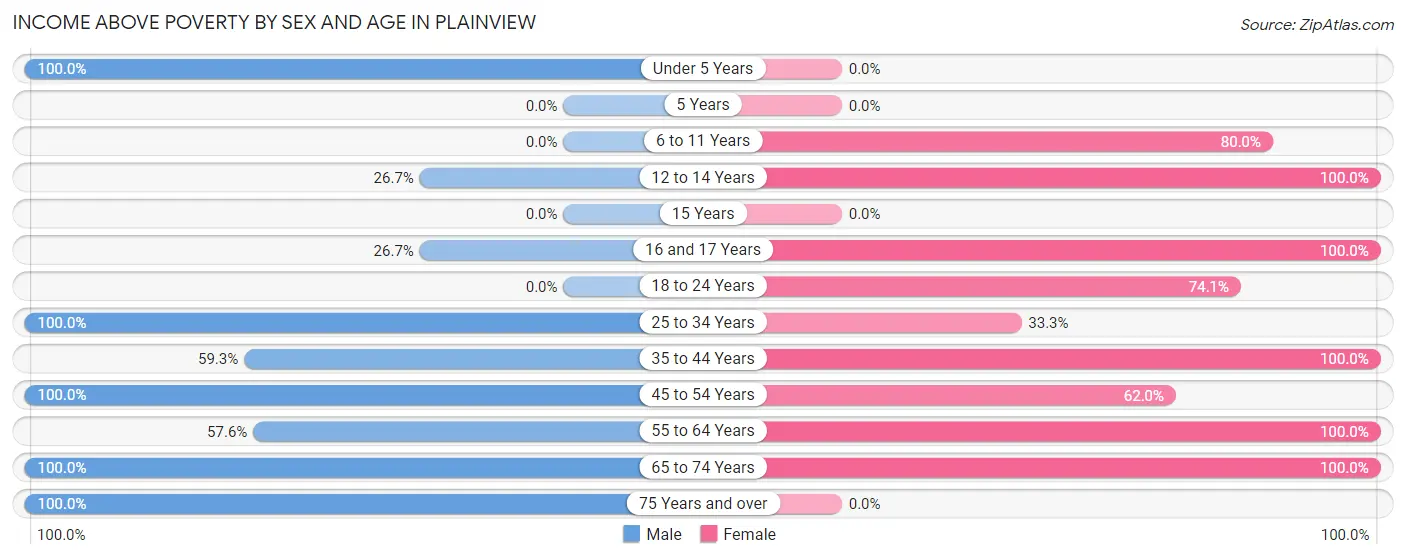
Income Above Poverty by Sex and Age in Plainview
According to the poverty statistics in Plainview, males aged under 5 years and females aged 12 to 14 years are the age groups that are most secure financially, with 100.0% of males and 100.0% of females in these age groups living above the poverty line.
| Age Bracket | Male | Female |
| Under 5 Years | 6 (100.0%) | 0 (0.0%) |
| 5 Years | 0 (0.0%) | 0 (0.0%) |
| 6 to 11 Years | 0 (0.0%) | 12 (80.0%) |
| 12 to 14 Years | 4 (26.7%) | 6 (100.0%) |
| 15 Years | 0 (0.0%) | 0 (0.0%) |
| 16 and 17 Years | 4 (26.7%) | 4 (100.0%) |
| 18 to 24 Years | 0 (0.0%) | 40 (74.1%) |
| 25 to 34 Years | 18 (100.0%) | 6 (33.3%) |
| 35 to 44 Years | 16 (59.3%) | 7 (100.0%) |
| 45 to 54 Years | 13 (100.0%) | 31 (62.0%) |
| 55 to 64 Years | 19 (57.6%) | 31 (100.0%) |
| 65 to 74 Years | 19 (100.0%) | 14 (100.0%) |
| 75 Years and over | 17 (100.0%) | 0 (0.0%) |
| Total | 116 (65.5%) | 151 (75.1%) |
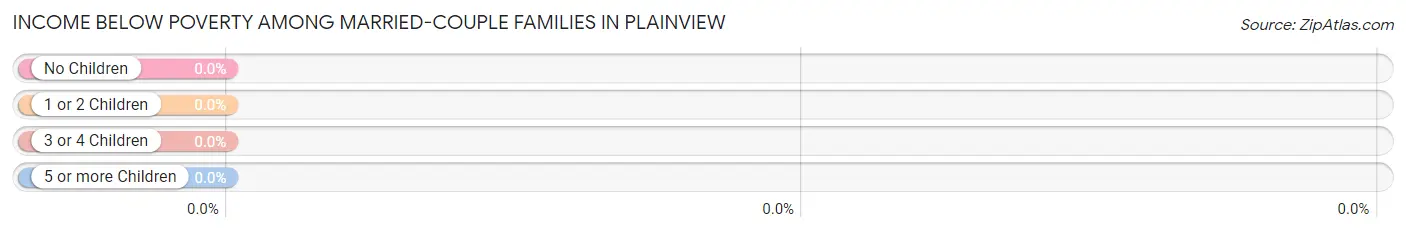
Income Below Poverty Among Married-Couple Families in Plainview
| Children | Above Poverty | Below Poverty |
| No Children | 29 (100.0%) | 0 (0.0%) |
| 1 or 2 Children | 4 (100.0%) | 0 (0.0%) |
| 3 or 4 Children | 6 (100.0%) | 0 (0.0%) |
| 5 or more Children | 0 (0.0%) | 0 (0.0%) |
| Total | 39 (100.0%) | 0 (0.0%) |
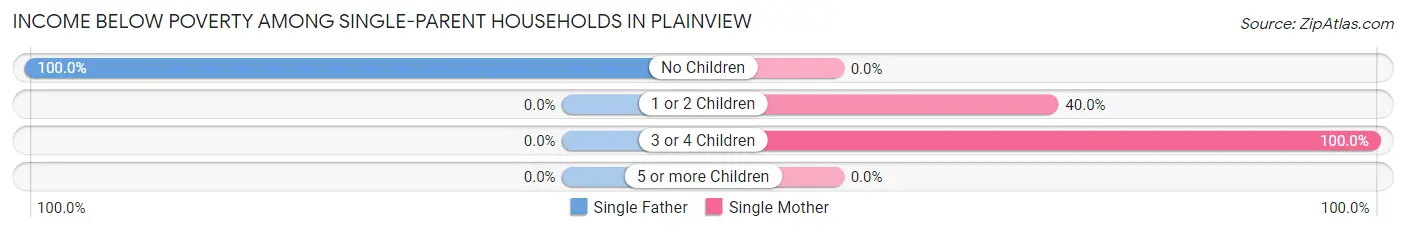
Income Below Poverty Among Single-Parent Households in Plainview
According to the poverty data in Plainview, 100.0% or 14 single-father households and 39.3% or 11 single-mother households are living below the poverty line. Among single-father households, those with no children have the highest poverty rate, with 14 households (100.0%) experiencing poverty. Likewise, among single-mother households, those with 3 or 4 children have the highest poverty rate, with 9 households (100.0%) falling below the poverty line.
| Children | Single Father | Single Mother |
| No Children | 14 (100.0%) | 0 (0.0%) |
| 1 or 2 Children | 0 (0.0%) | 2 (40.0%) |
| 3 or 4 Children | 0 (0.0%) | 9 (100.0%) |
| 5 or more Children | 0 (0.0%) | 0 (0.0%) |
| Total | 14 (100.0%) | 11 (39.3%) |
Income Below Poverty Among Married-Couple vs Single-Parent Households in Plainview
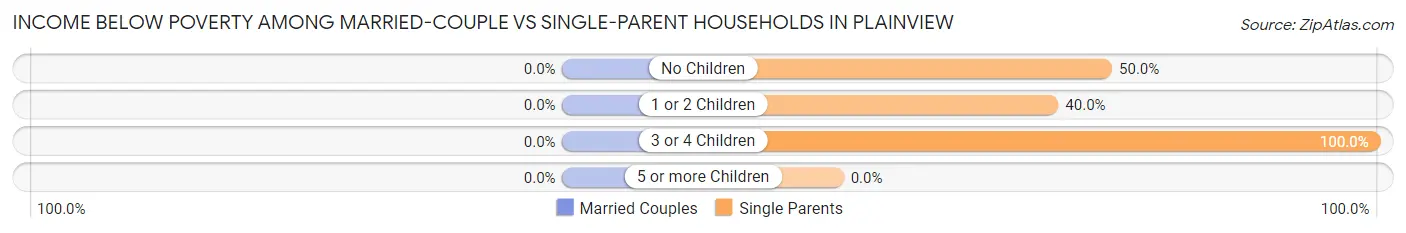
| Children | Married-Couple Families | Single-Parent Households |
| No Children | 0 (0.0%) | 14 (50.0%) |
| 1 or 2 Children | 0 (0.0%) | 2 (40.0%) |
| 3 or 4 Children | 0 (0.0%) | 9 (100.0%) |
| 5 or more Children | 0 (0.0%) | 0 (0.0%) |
| Total | 0 (0.0%) | 25 (59.5%) |
Race in Plainview
The most populous races in Plainview are Hispanic or Latino (357 | 94.4%), Some other Race (162 | 42.9%), and White / Caucasian (105 | 27.8%).
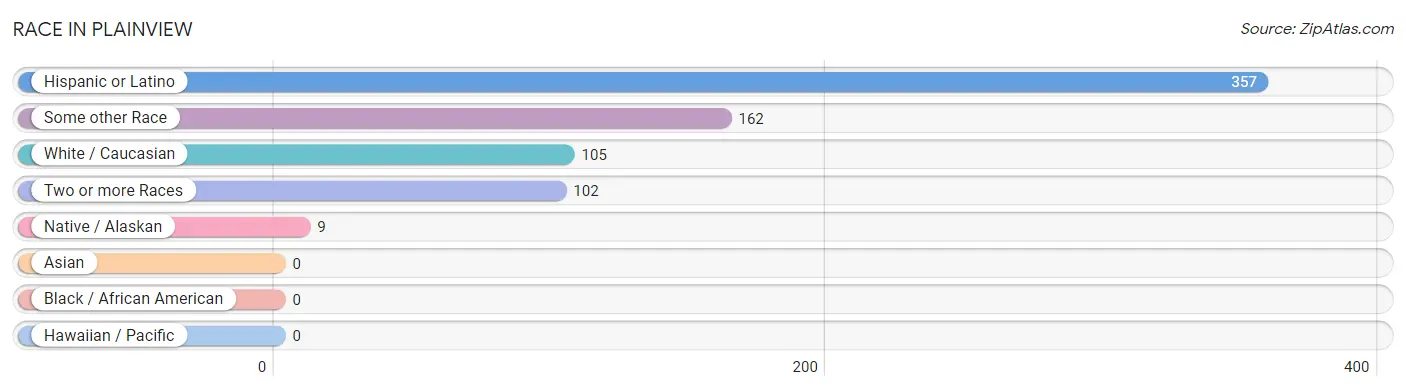
| Race | # Population | % Population |
| Asian | 0 | 0.0% |
| Black / African American | 0 | 0.0% |
| Hawaiian / Pacific | 0 | 0.0% |
| Hispanic or Latino | 357 | 94.4% |
| Native / Alaskan | 9 | 2.4% |
| White / Caucasian | 105 | 27.8% |
| Two or more Races | 102 | 27.0% |
| Some other Race | 162 | 42.9% |
| Total | 378 | 100.0% |
Ancestry in Plainview
The most populous ancestries reported in Plainview are Mexican (357 | 94.4%), English (9 | 2.4%), German (3 | 0.8%), and Irish (3 | 0.8%), together accounting for 98.4% of all Plainview residents.
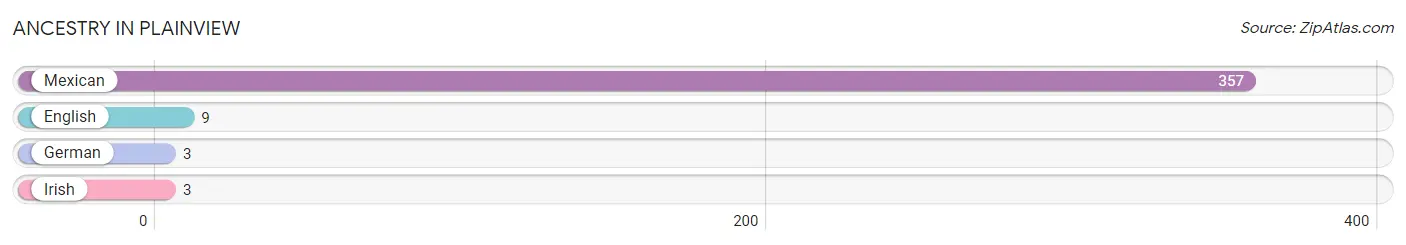
| Ancestry | # Population | % Population |
| English | 9 | 2.4% |
| German | 3 | 0.8% |
| Irish | 3 | 0.8% |
| Mexican | 357 | 94.4% | View All 4 Rows |
Immigrants in Plainview
The most numerous immigrant groups reported in Plainview came from Central America (195 | 51.6%), Latin America (195 | 51.6%), and Mexico (195 | 51.6%), together accounting for 154.8% of all Plainview residents.
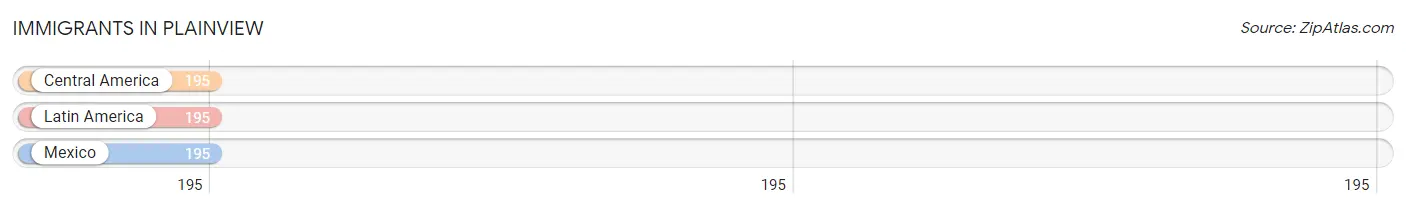
| Immigration Origin | # Population | % Population |
| Central America | 195 | 51.6% |
| Latin America | 195 | 51.6% |
| Mexico | 195 | 51.6% | View All 3 Rows |
Sex and Age in Plainview
Sex and Age in Plainview
The most populous age groups in Plainview are 60 to 64 Years (27 | 15.2%) for men and 50 to 54 Years (41 | 20.4%) for women.
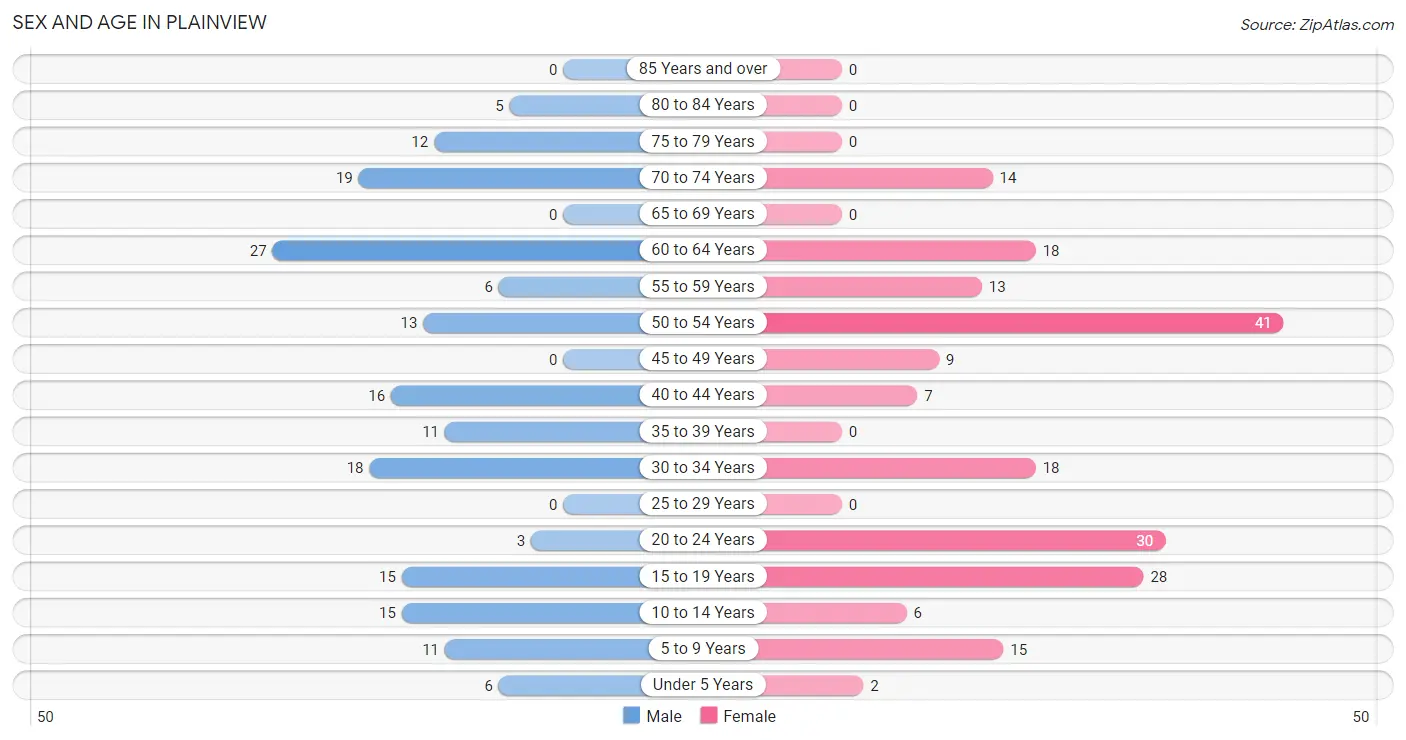
| Age Bracket | Male | Female |
| Under 5 Years | 6 (3.4%) | 2 (1.0%) |
| 5 to 9 Years | 11 (6.2%) | 15 (7.5%) |
| 10 to 14 Years | 15 (8.5%) | 6 (3.0%) |
| 15 to 19 Years | 15 (8.5%) | 28 (13.9%) |
| 20 to 24 Years | 3 (1.7%) | 30 (14.9%) |
| 25 to 29 Years | 0 (0.0%) | 0 (0.0%) |
| 30 to 34 Years | 18 (10.2%) | 18 (9.0%) |
| 35 to 39 Years | 11 (6.2%) | 0 (0.0%) |
| 40 to 44 Years | 16 (9.0%) | 7 (3.5%) |
| 45 to 49 Years | 0 (0.0%) | 9 (4.5%) |
| 50 to 54 Years | 13 (7.3%) | 41 (20.4%) |
| 55 to 59 Years | 6 (3.4%) | 13 (6.5%) |
| 60 to 64 Years | 27 (15.2%) | 18 (9.0%) |
| 65 to 69 Years | 0 (0.0%) | 0 (0.0%) |
| 70 to 74 Years | 19 (10.7%) | 14 (7.0%) |
| 75 to 79 Years | 12 (6.8%) | 0 (0.0%) |
| 80 to 84 Years | 5 (2.8%) | 0 (0.0%) |
| 85 Years and over | 0 (0.0%) | 0 (0.0%) |
| Total | 177 (100.0%) | 201 (100.0%) |
Families and Households in Plainview
Median Family Size in Plainview
The median family size in Plainview is 3.85 persons per family, with single female/mother families (28 | 34.6%) accounting for the largest median family size of 4.71 persons per family. On the other hand, single male/father families (14 | 17.3%) represent the smallest median family size with 2.00 persons per family.
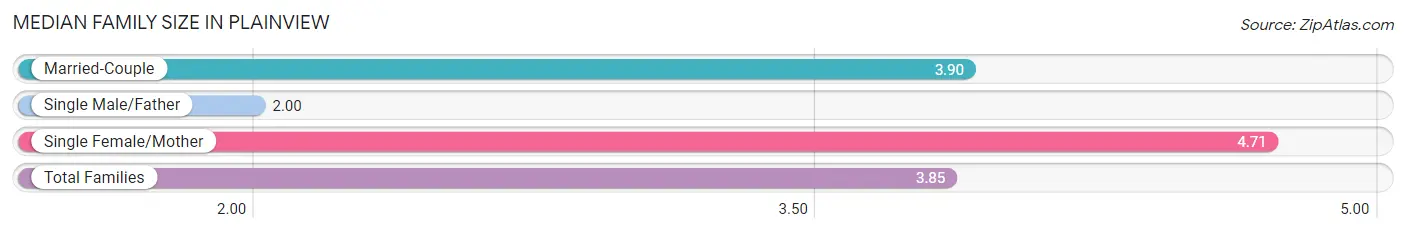
| Family Type | # Families | Family Size |
| Married-Couple | 39 (48.1%) | 3.90 |
| Single Male/Father | 14 (17.3%) | 2.00 |
| Single Female/Mother | 28 (34.6%) | 4.71 |
| Total Families | 81 (100.0%) | 3.85 |
Median Household Size in Plainview
The median household size in Plainview is 3.12 persons per household, with single female/mother households (28 | 23.1%) accounting for the largest median household size of 5.11 persons per household. non-family households (40 | 33.1%) represent the smallest median household size with 1.38 persons per household.
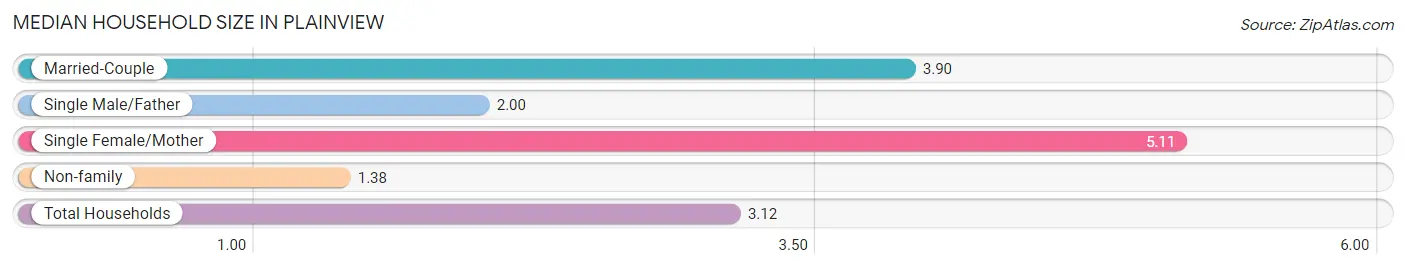
| Household Type | # Households | Household Size |
| Married-Couple | 39 (32.2%) | 3.90 |
| Single Male/Father | 14 (11.6%) | 2.00 |
| Single Female/Mother | 28 (23.1%) | 5.11 |
| Non-family | 40 (33.1%) | 1.38 |
| Total Households | 121 (100.0%) | 3.12 |
Household Size by Marriage Status in Plainview
Out of a total of 121 households in Plainview, 81 (66.9%) are family households, while 40 (33.1%) are nonfamily households. The most numerous type of family households are 3-person households, comprising 34, and the most common type of nonfamily households are 2-person households, comprising 22.
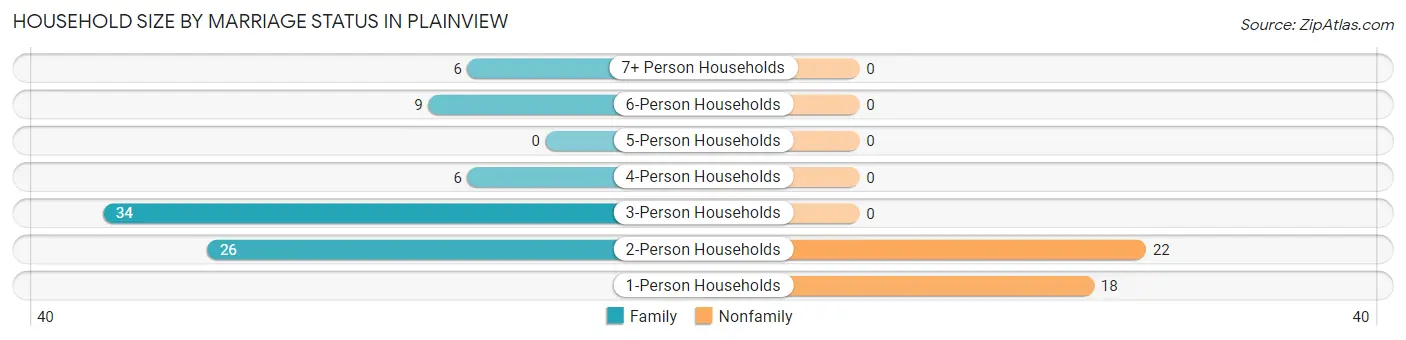
| Household Size | Family Households | Nonfamily Households |
| 1-Person Households | - | 18 (14.9%) |
| 2-Person Households | 26 (21.5%) | 22 (18.2%) |
| 3-Person Households | 34 (28.1%) | 0 (0.0%) |
| 4-Person Households | 6 (5.0%) | 0 (0.0%) |
| 5-Person Households | 0 (0.0%) | 0 (0.0%) |
| 6-Person Households | 9 (7.4%) | 0 (0.0%) |
| 7+ Person Households | 6 (5.0%) | 0 (0.0%) |
| Total | 81 (66.9%) | 40 (33.1%) |
Female Fertility in Plainview
Fertility by Age in Plainview
Average fertility rate in Plainview is 61.0 births per 1,000 women. Women in the age bracket of 20 to 34 years have the highest fertility rate with 125.0 births per 1,000 women. Women in the age bracket of 20 to 34 years acount for 100.0% of all women with births.
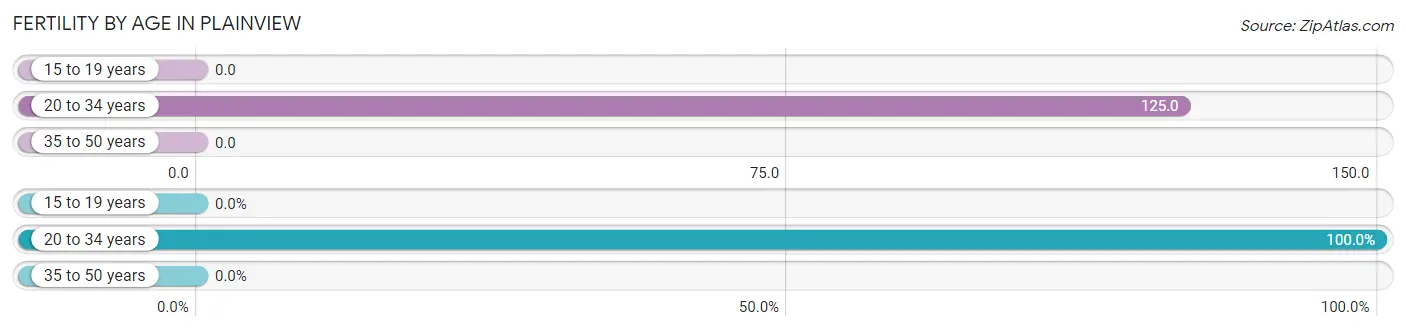
| Age Bracket | Women with Births | Births / 1,000 Women |
| 15 to 19 years | 0 (0.0%) | 0.0 |
| 20 to 34 years | 6 (100.0%) | 125.0 |
| 35 to 50 years | 0 (0.0%) | 0.0 |
| Total | 6 (100.0%) | 61.0 |
Fertility by Age by Marriage Status in Plainview
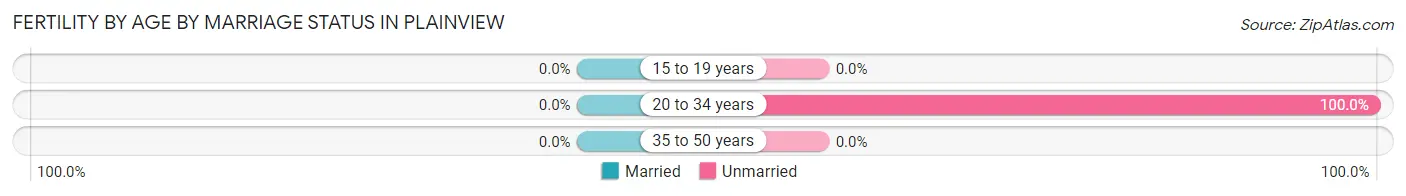
| Age Bracket | Married | Unmarried |
| 15 to 19 years | 0 (0.0%) | 0 (0.0%) |
| 20 to 34 years | 0 (0.0%) | 6 (100.0%) |
| 35 to 50 years | 0 (0.0%) | 0 (0.0%) |
| Total | 0 (0.0%) | 6 (100.0%) |
Fertility by Education in Plainview
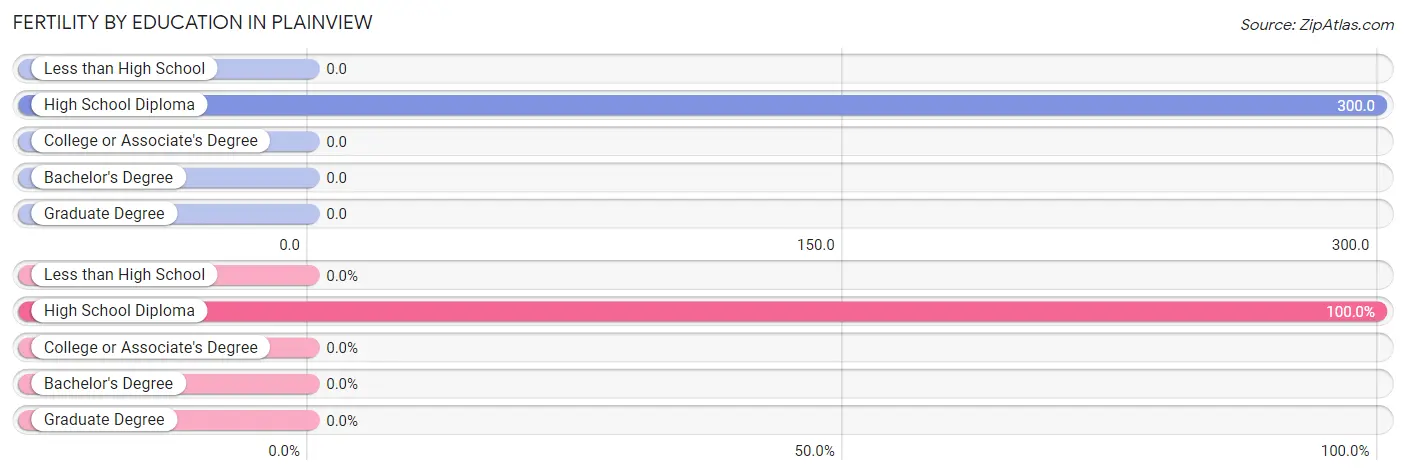
| Educational Attainment | Women with Births | Births / 1,000 Women |
| Less than High School | 0 (0.0%) | 0.0 |
| High School Diploma | 6 (100.0%) | 300.0 |
| College or Associate's Degree | 0 (0.0%) | 0.0 |
| Bachelor's Degree | 0 (0.0%) | 0.0 |
| Graduate Degree | 0 (0.0%) | 0.0 |
| Total | 6 (100.0%) | 61.0 |
Fertility by Education by Marriage Status in Plainview
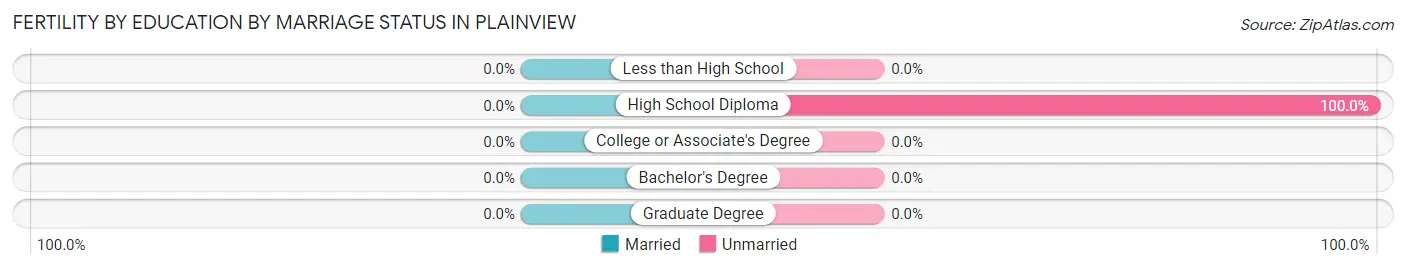
| Educational Attainment | Married | Unmarried |
| Less than High School | 0 (0.0%) | 0 (0.0%) |
| High School Diploma | 0 (0.0%) | 6 (100.0%) |
| College or Associate's Degree | 0 (0.0%) | 0 (0.0%) |
| Bachelor's Degree | 0 (0.0%) | 0 (0.0%) |
| Graduate Degree | 0 (0.0%) | 0 (0.0%) |
| Total | 0 (0.0%) | 6 (100.0%) |
Employment Characteristics in Plainview
Employment by Class of Employer in Plainview
Among the 115 employed individuals in Plainview, private company employees (75 | 65.2%), local government employees (30 | 26.1%), and state government employees (7 | 6.1%) make up the most common classes of employment.
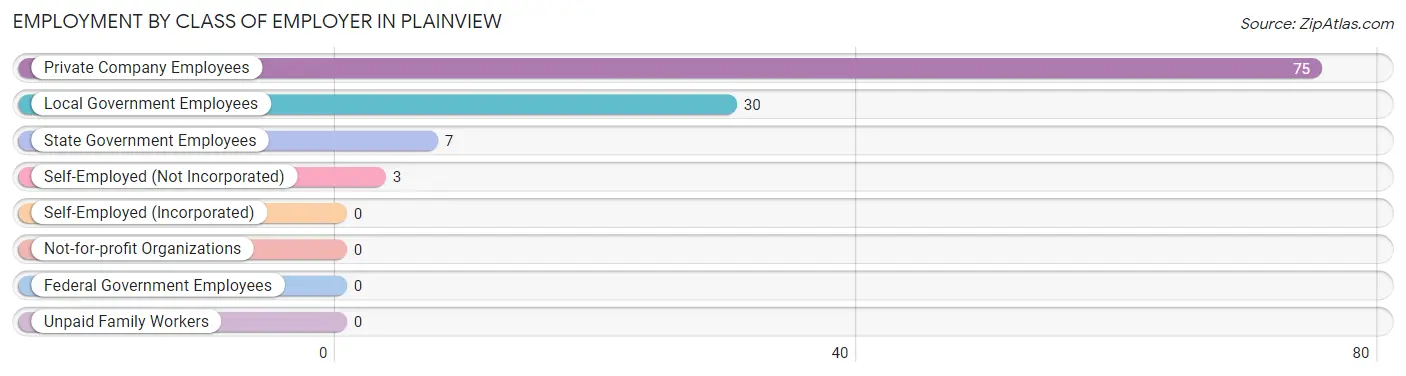
| Employer Class | # Employees | % Employees |
| Private Company Employees | 75 | 65.2% |
| Self-Employed (Incorporated) | 0 | 0.0% |
| Self-Employed (Not Incorporated) | 3 | 2.6% |
| Not-for-profit Organizations | 0 | 0.0% |
| Local Government Employees | 30 | 26.1% |
| State Government Employees | 7 | 6.1% |
| Federal Government Employees | 0 | 0.0% |
| Unpaid Family Workers | 0 | 0.0% |
| Total | 115 | 100.0% |
Employment Status by Age in Plainview
According to the labor force statistics for Plainview, out of the total population over 16 years of age (323), 59.8% or 193 individuals are in the labor force, with 40.4% or 78 of them unemployed. The age group with the highest labor force participation rate is 20 to 24 years, with 100.0% or 33 individuals in the labor force. Within the labor force, the 16 to 19 years age range has the highest percentage of unemployed individuals, with 100.0% or 18 of them being unemployed.
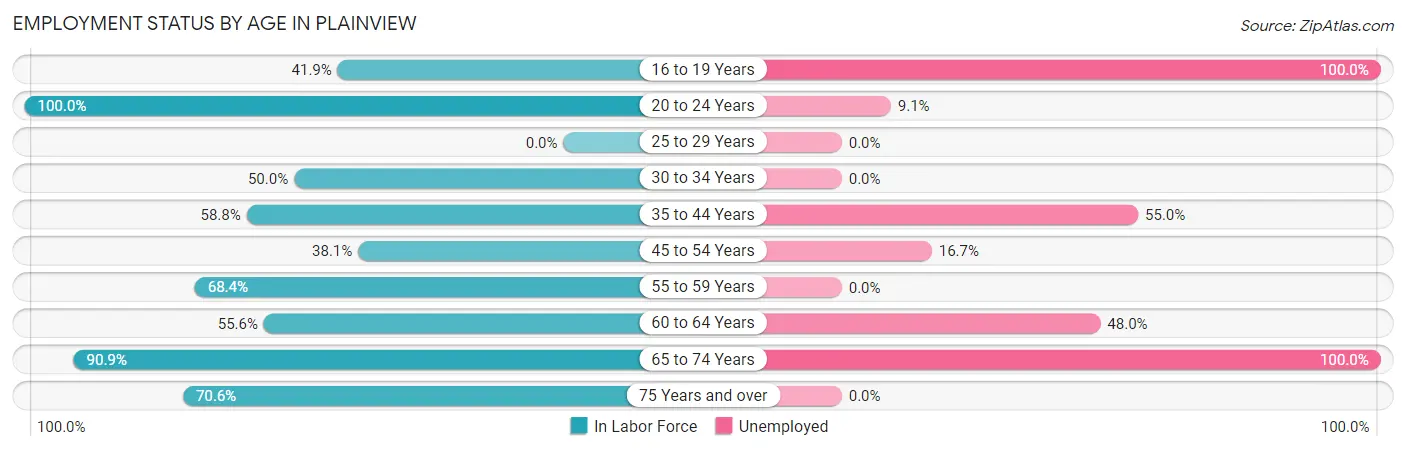
| Age Bracket | In Labor Force | Unemployed |
| 16 to 19 Years | 18 (41.9%) | 18 (100.0%) |
| 20 to 24 Years | 33 (100.0%) | 3 (9.1%) |
| 25 to 29 Years | 0 (0.0%) | 0 (0.0%) |
| 30 to 34 Years | 18 (50.0%) | 0 (0.0%) |
| 35 to 44 Years | 20 (58.8%) | 11 (55.0%) |
| 45 to 54 Years | 24 (38.1%) | 4 (16.7%) |
| 55 to 59 Years | 13 (68.4%) | 0 (0.0%) |
| 60 to 64 Years | 25 (55.6%) | 12 (48.0%) |
| 65 to 74 Years | 30 (90.9%) | 30 (100.0%) |
| 75 Years and over | 12 (70.6%) | 0 (0.0%) |
| Total | 193 (59.8%) | 78 (40.4%) |
Employment Status by Educational Attainment in Plainview
According to labor force statistics for Plainview, 50.8% of individuals (100) out of the total population between 25 and 64 years of age (197) are in the labor force, with 27.0% or 27 of them being unemployed. The group with the highest labor force participation rate are those with the educational attainment of high school diploma, with 77.8% or 42 individuals in the labor force. Within the labor force, individuals with bachelor's degree or higher education have the highest percentage of unemployment, with 100.0% or 12 of them being unemployed.
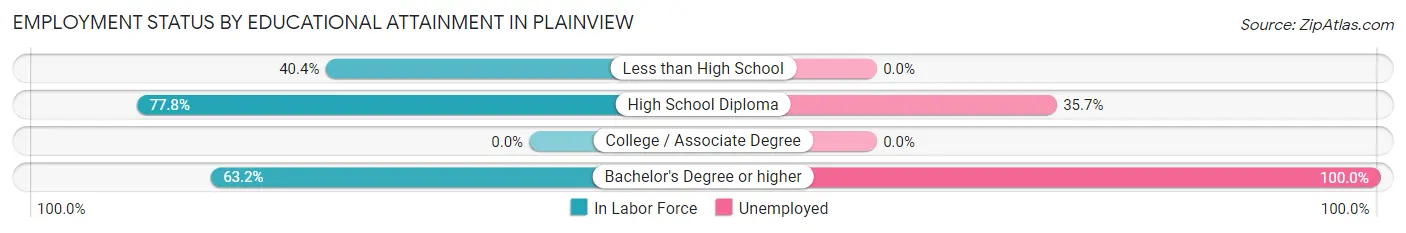
| Educational Attainment | In Labor Force | Unemployed |
| Less than High School | 46 (40.4%) | 0 (0.0%) |
| High School Diploma | 42 (77.8%) | 19 (35.7%) |
| College / Associate Degree | 0 (0.0%) | 0 (0.0%) |
| Bachelor's Degree or higher | 12 (63.2%) | 19 (100.0%) |
| Total | 100 (50.8%) | 53 (27.0%) |
Employment Occupations by Sex in Plainview
Management, Business, Science and Arts Occupations
The most common Management, Business, Science and Arts occupations in Plainview are Community & Social Service (22 | 19.1%), Education Instruction & Library (22 | 19.1%), Management (13 | 11.3%), and Business & Financial (8 | 7.0%).
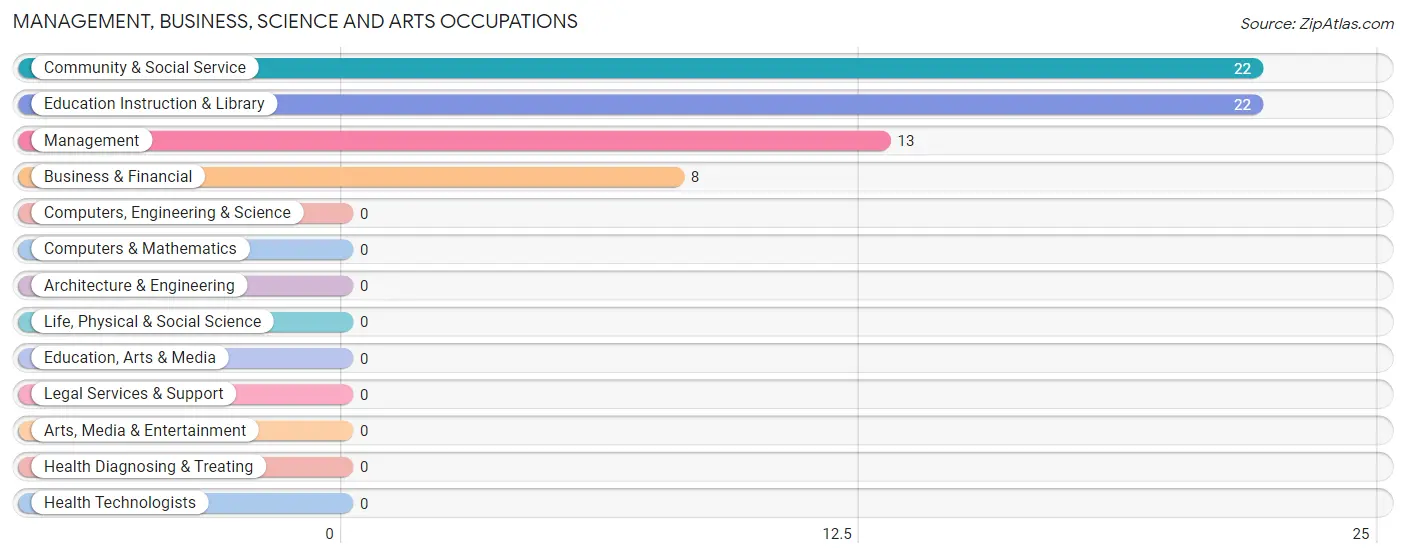
Management, Business, Science and Arts Occupations by Sex
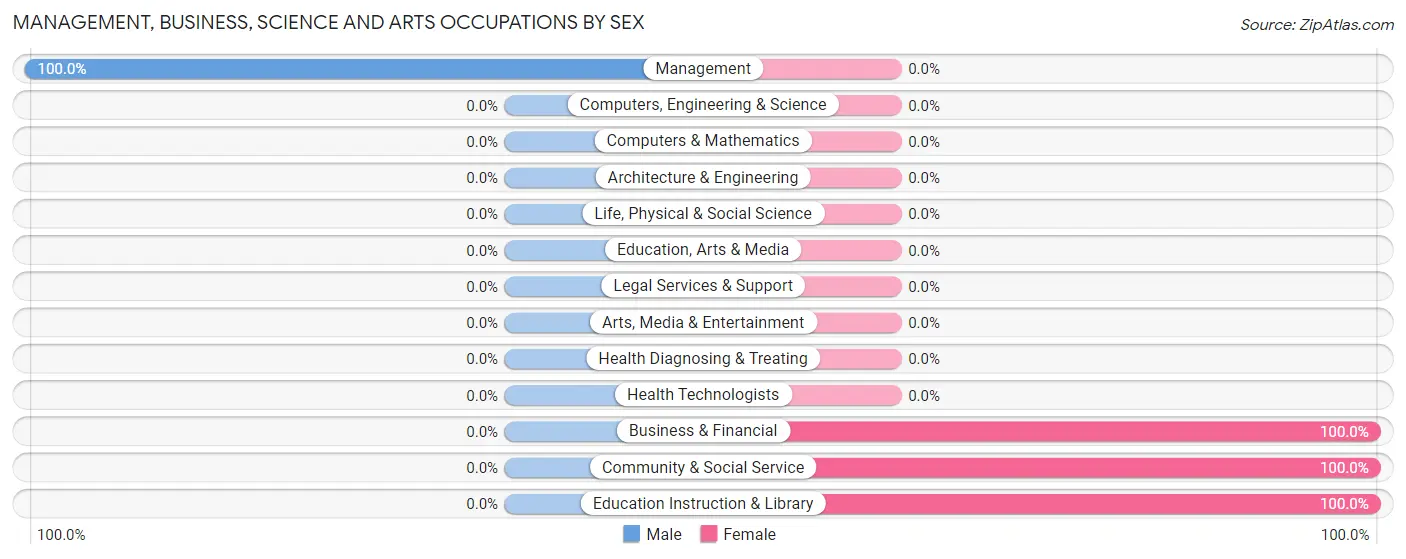
| Occupation | Male | Female |
| Management | 13 (100.0%) | 0 (0.0%) |
| Business & Financial | 0 (0.0%) | 8 (100.0%) |
| Computers, Engineering & Science | 0 (0.0%) | 0 (0.0%) |
| Computers & Mathematics | 0 (0.0%) | 0 (0.0%) |
| Architecture & Engineering | 0 (0.0%) | 0 (0.0%) |
| Life, Physical & Social Science | 0 (0.0%) | 0 (0.0%) |
| Community & Social Service | 0 (0.0%) | 22 (100.0%) |
| Education, Arts & Media | 0 (0.0%) | 0 (0.0%) |
| Legal Services & Support | 0 (0.0%) | 0 (0.0%) |
| Education Instruction & Library | 0 (0.0%) | 22 (100.0%) |
| Arts, Media & Entertainment | 0 (0.0%) | 0 (0.0%) |
| Health Diagnosing & Treating | 0 (0.0%) | 0 (0.0%) |
| Health Technologists | 0 (0.0%) | 0 (0.0%) |
| Total (Category) | 13 (30.2%) | 30 (69.8%) |
| Total (Overall) | 60 (52.2%) | 55 (47.8%) |
Services Occupations
The most common Services occupations in Plainview are , and Cleaning & Maintenance (10 | 8.7%).
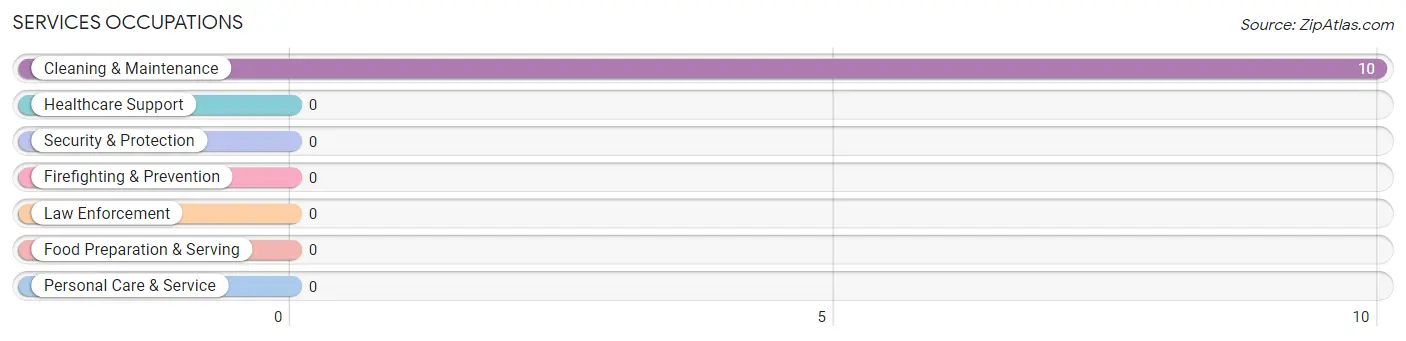
Services Occupations by Sex
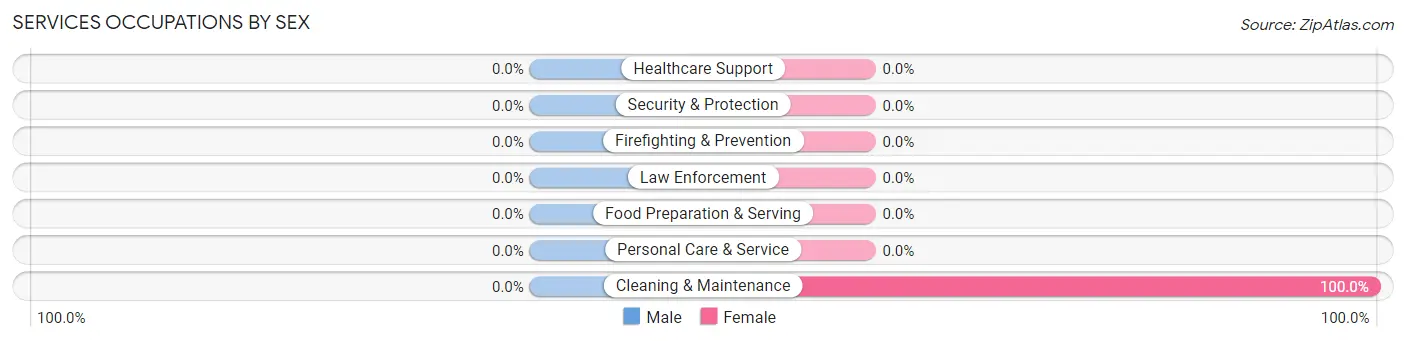
| Occupation | Male | Female |
| Healthcare Support | 0 (0.0%) | 0 (0.0%) |
| Security & Protection | 0 (0.0%) | 0 (0.0%) |
| Firefighting & Prevention | 0 (0.0%) | 0 (0.0%) |
| Law Enforcement | 0 (0.0%) | 0 (0.0%) |
| Food Preparation & Serving | 0 (0.0%) | 0 (0.0%) |
| Cleaning & Maintenance | 0 (0.0%) | 10 (100.0%) |
| Personal Care & Service | 0 (0.0%) | 0 (0.0%) |
| Total (Category) | 0 (0.0%) | 10 (100.0%) |
| Total (Overall) | 60 (52.2%) | 55 (47.8%) |
Sales and Office Occupations
The most common Sales and Office occupations in Plainview are Office & Administration (13 | 11.3%), and Sales & Related (12 | 10.4%).
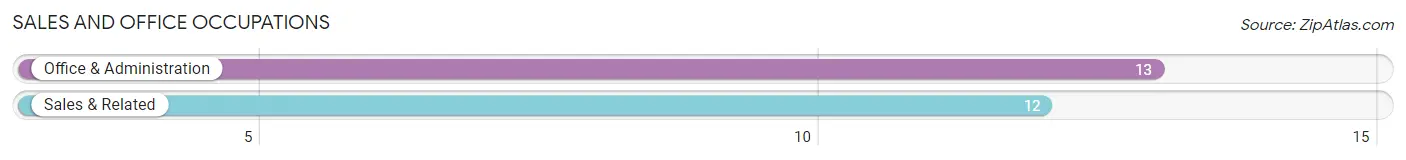
Sales and Office Occupations by Sex

| Occupation | Male | Female |
| Sales & Related | 12 (100.0%) | 0 (0.0%) |
| Office & Administration | 4 (30.8%) | 9 (69.2%) |
| Total (Category) | 16 (64.0%) | 9 (36.0%) |
| Total (Overall) | 60 (52.2%) | 55 (47.8%) |
Natural Resources, Construction and Maintenance Occupations
The most common Natural Resources, Construction and Maintenance occupations in Plainview are , and Farming, Fishing & Forestry (24 | 20.9%).
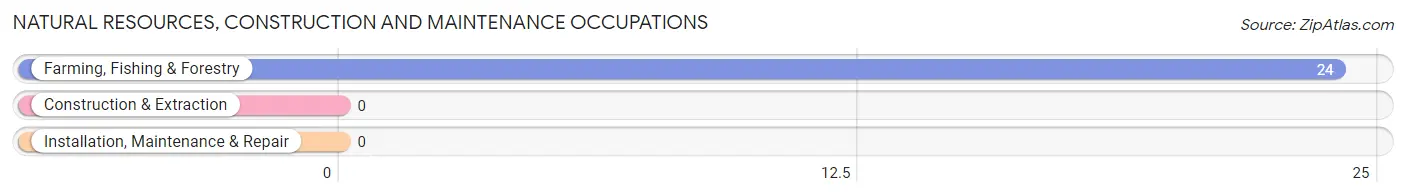
Natural Resources, Construction and Maintenance Occupations by Sex
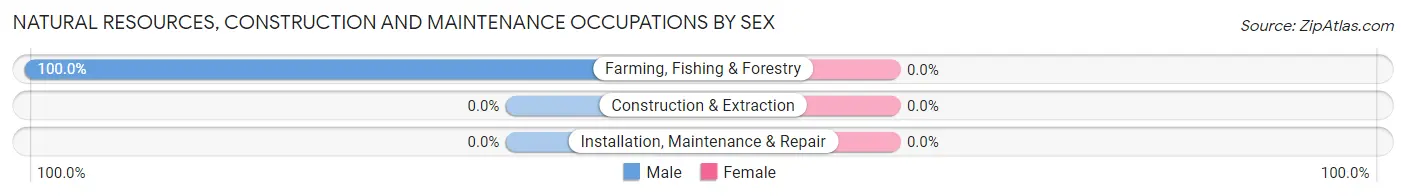
| Occupation | Male | Female |
| Farming, Fishing & Forestry | 24 (100.0%) | 0 (0.0%) |
| Construction & Extraction | 0 (0.0%) | 0 (0.0%) |
| Installation, Maintenance & Repair | 0 (0.0%) | 0 (0.0%) |
| Total (Category) | 24 (100.0%) | 0 (0.0%) |
| Total (Overall) | 60 (52.2%) | 55 (47.8%) |
Production, Transportation and Moving Occupations
The most common Production, Transportation and Moving occupations in Plainview are , and Production (13 | 11.3%).
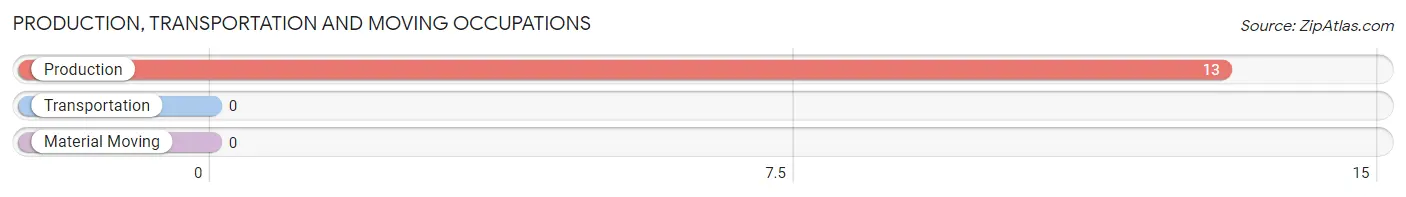
Production, Transportation and Moving Occupations by Sex
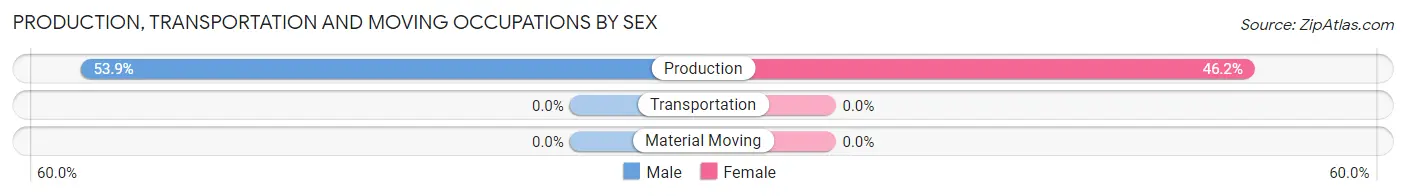
| Occupation | Male | Female |
| Production | 7 (53.8%) | 6 (46.2%) |
| Transportation | 0 (0.0%) | 0 (0.0%) |
| Material Moving | 0 (0.0%) | 0 (0.0%) |
| Total (Category) | 7 (53.8%) | 6 (46.2%) |
| Total (Overall) | 60 (52.2%) | 55 (47.8%) |
Employment Industries by Sex in Plainview
Employment Industries in Plainview
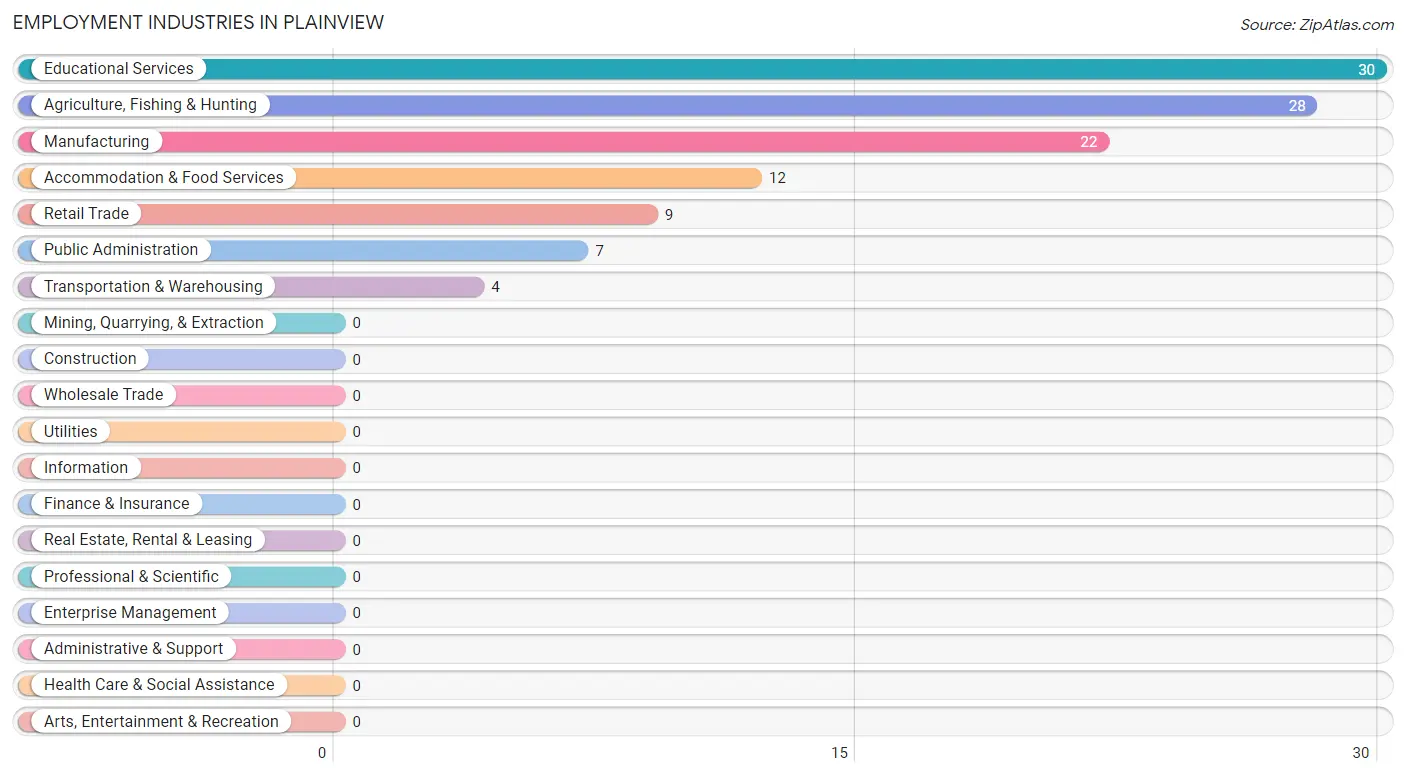
The major employment industries in Plainview include Educational Services (30 | 26.1%), Agriculture, Fishing & Hunting (28 | 24.3%), Manufacturing (22 | 19.1%), Accommodation & Food Services (12 | 10.4%), and Retail Trade (9 | 7.8%).
Employment Industries by Sex in Plainview
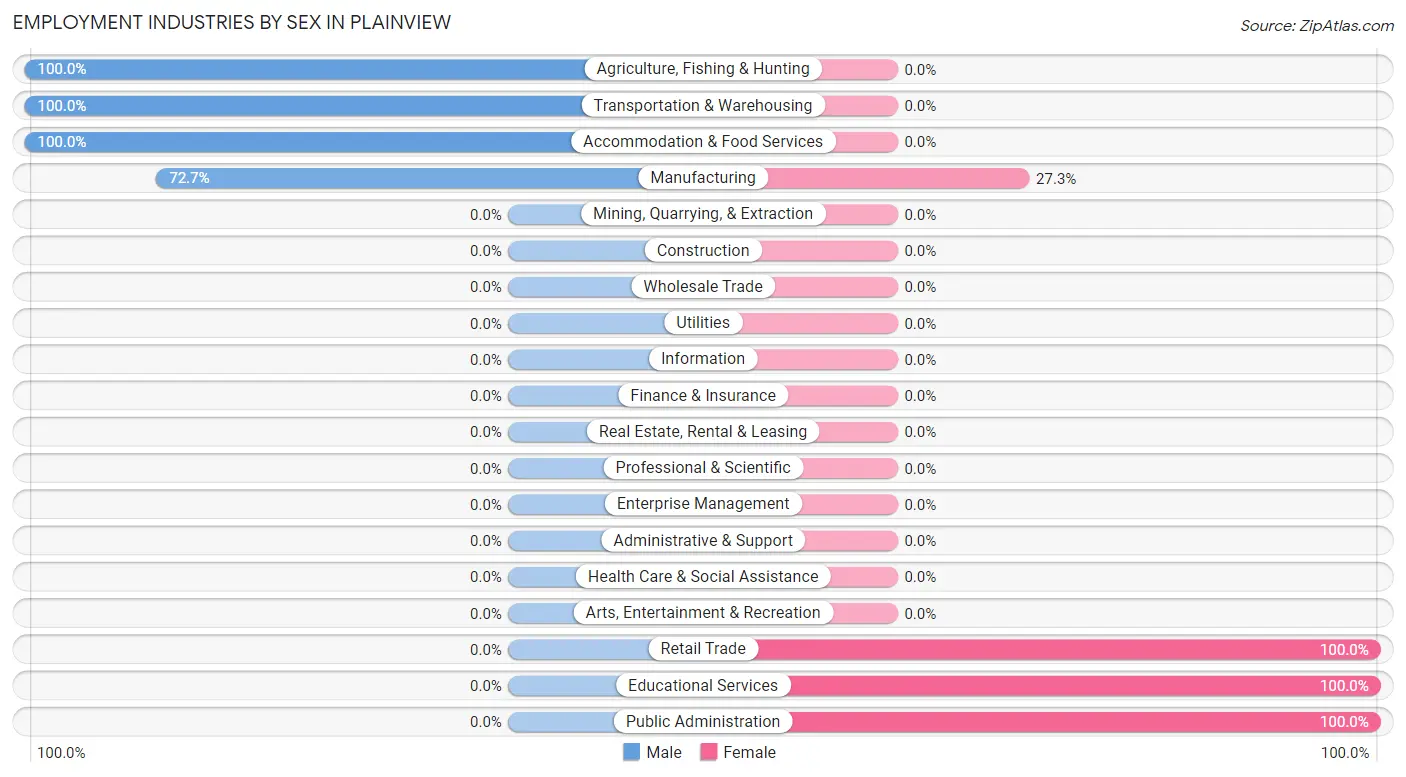
The Plainview industries that see more men than women are Agriculture, Fishing & Hunting (100.0%), Transportation & Warehousing (100.0%), and Accommodation & Food Services (100.0%), whereas the industries that tend to have a higher number of women are Retail Trade (100.0%), Educational Services (100.0%), and Public Administration (100.0%).
| Industry | Male | Female |
| Agriculture, Fishing & Hunting | 28 (100.0%) | 0 (0.0%) |
| Mining, Quarrying, & Extraction | 0 (0.0%) | 0 (0.0%) |
| Construction | 0 (0.0%) | 0 (0.0%) |
| Manufacturing | 16 (72.7%) | 6 (27.3%) |
| Wholesale Trade | 0 (0.0%) | 0 (0.0%) |
| Retail Trade | 0 (0.0%) | 9 (100.0%) |
| Transportation & Warehousing | 4 (100.0%) | 0 (0.0%) |
| Utilities | 0 (0.0%) | 0 (0.0%) |
| Information | 0 (0.0%) | 0 (0.0%) |
| Finance & Insurance | 0 (0.0%) | 0 (0.0%) |
| Real Estate, Rental & Leasing | 0 (0.0%) | 0 (0.0%) |
| Professional & Scientific | 0 (0.0%) | 0 (0.0%) |
| Enterprise Management | 0 (0.0%) | 0 (0.0%) |
| Administrative & Support | 0 (0.0%) | 0 (0.0%) |
| Educational Services | 0 (0.0%) | 30 (100.0%) |
| Health Care & Social Assistance | 0 (0.0%) | 0 (0.0%) |
| Arts, Entertainment & Recreation | 0 (0.0%) | 0 (0.0%) |
| Accommodation & Food Services | 12 (100.0%) | 0 (0.0%) |
| Public Administration | 0 (0.0%) | 7 (100.0%) |
| Total | 60 (52.2%) | 55 (47.8%) |
Education in Plainview
School Enrollment in Plainview
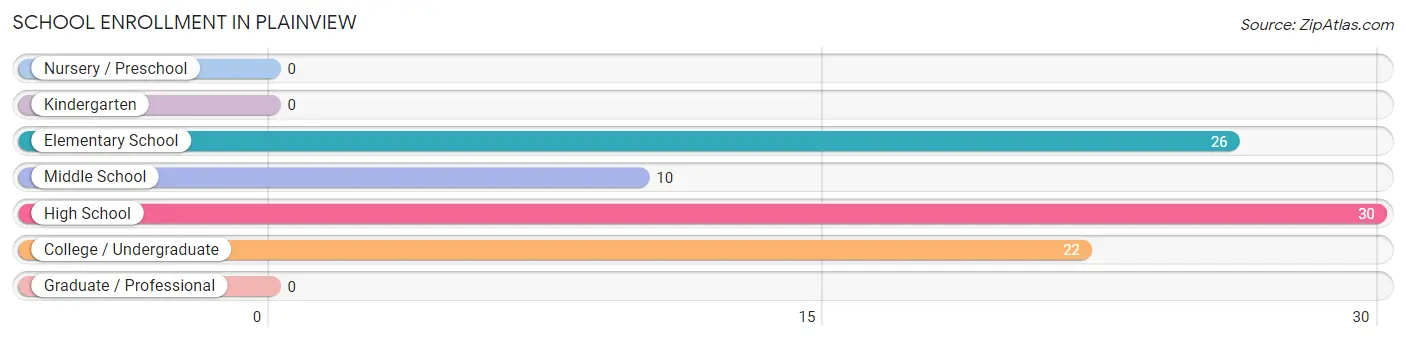
The most common levels of schooling among the 88 students in Plainview are high school (30 | 34.1%), elementary school (26 | 29.5%), and college / undergraduate (22 | 25.0%).
| School Level | # Students | % Students |
| Nursery / Preschool | 0 | 0.0% |
| Kindergarten | 0 | 0.0% |
| Elementary School | 26 | 29.5% |
| Middle School | 10 | 11.4% |
| High School | 30 | 34.1% |
| College / Undergraduate | 22 | 25.0% |
| Graduate / Professional | 0 | 0.0% |
| Total | 88 | 100.0% |
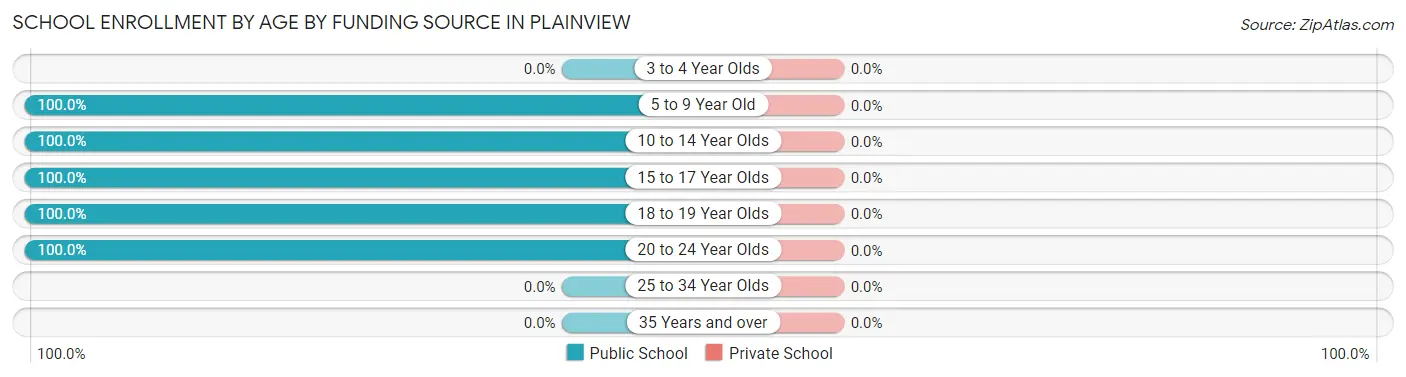
School Enrollment by Age by Funding Source in Plainview
| Age Bracket | Public School | Private School |
| 3 to 4 Year Olds | 0 (0.0%) | 0 (0.0%) |
| 5 to 9 Year Old | 26 (100.0%) | 0 (0.0%) |
| 10 to 14 Year Olds | 21 (100.0%) | 0 (0.0%) |
| 15 to 17 Year Olds | 19 (100.0%) | 0 (0.0%) |
| 18 to 19 Year Olds | 14 (100.0%) | 0 (0.0%) |
| 20 to 24 Year Olds | 8 (100.0%) | 0 (0.0%) |
| 25 to 34 Year Olds | 0 (0.0%) | 0 (0.0%) |
| 35 Years and over | 0 (0.0%) | 0 (0.0%) |
| Total | 88 (100.0%) | 0 (0.0%) |
Educational Attainment by Field of Study in Plainview
Science & technology (12 | 38.7%), business (12 | 38.7%), and arts & humanities (7 | 22.6%) are the most common fields of study among 31 individuals in Plainview who have obtained a bachelor's degree or higher.
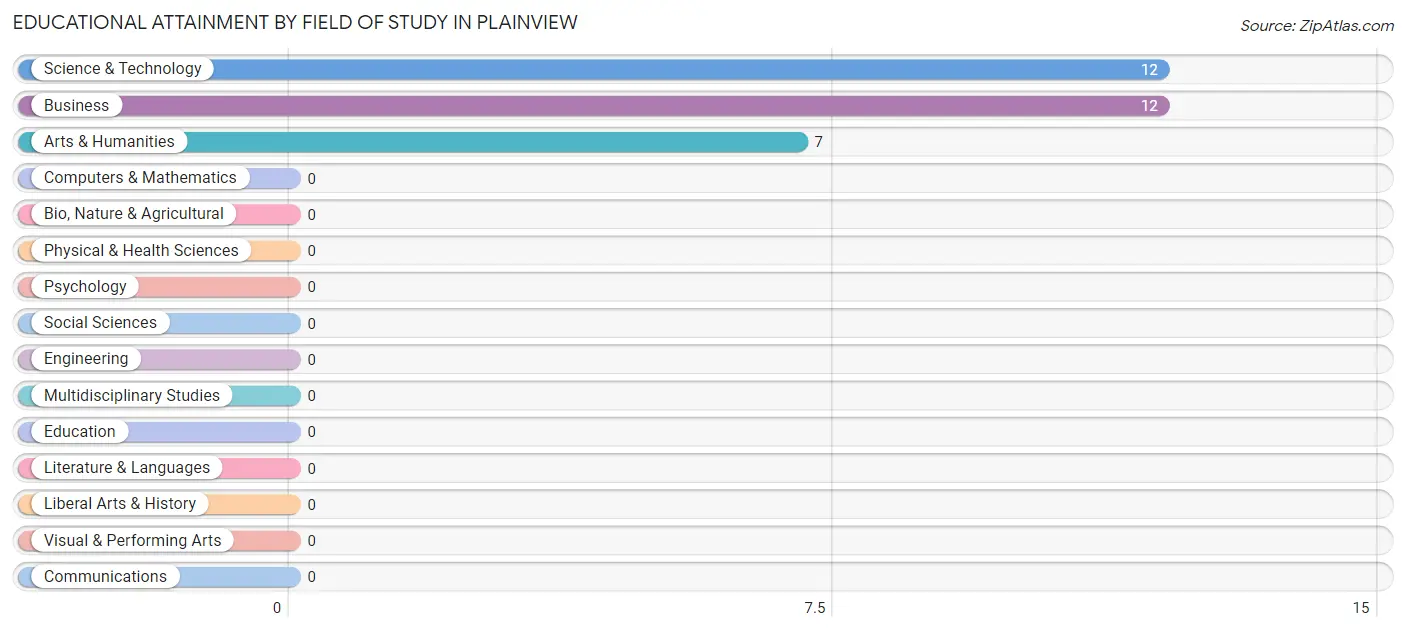
| Field of Study | # Graduates | % Graduates |
| Computers & Mathematics | 0 | 0.0% |
| Bio, Nature & Agricultural | 0 | 0.0% |
| Physical & Health Sciences | 0 | 0.0% |
| Psychology | 0 | 0.0% |
| Social Sciences | 0 | 0.0% |
| Engineering | 0 | 0.0% |
| Multidisciplinary Studies | 0 | 0.0% |
| Science & Technology | 12 | 38.7% |
| Business | 12 | 38.7% |
| Education | 0 | 0.0% |
| Literature & Languages | 0 | 0.0% |
| Liberal Arts & History | 0 | 0.0% |
| Visual & Performing Arts | 0 | 0.0% |
| Communications | 0 | 0.0% |
| Arts & Humanities | 7 | 22.6% |
| Total | 31 | 100.0% |
Transportation & Commute in Plainview
Vehicle Availability by Sex in Plainview
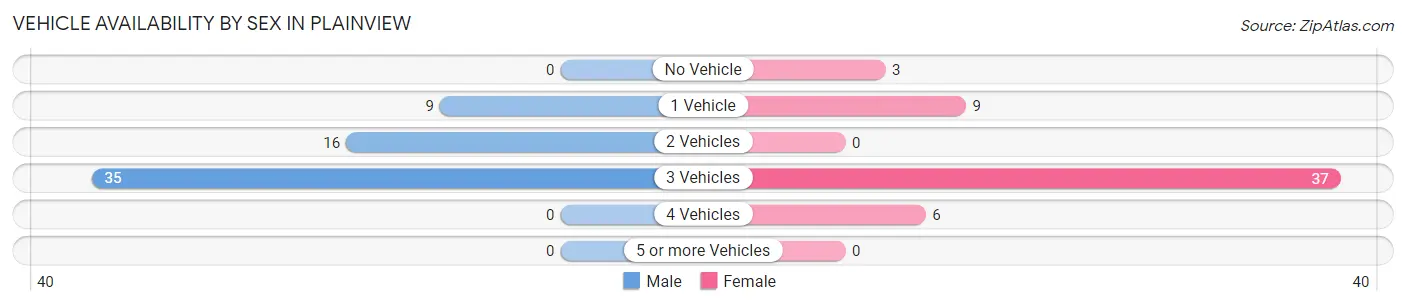
The most prevalent vehicle ownership categories in Plainview are males with 3 vehicles (35, accounting for 58.3%) and females with 3 vehicles (37, making up 63.6%).
| Vehicles Available | Male | Female |
| No Vehicle | 0 (0.0%) | 3 (5.4%) |
| 1 Vehicle | 9 (15.0%) | 9 (16.4%) |
| 2 Vehicles | 16 (26.7%) | 0 (0.0%) |
| 3 Vehicles | 35 (58.3%) | 37 (67.3%) |
| 4 Vehicles | 0 (0.0%) | 6 (10.9%) |
| 5 or more Vehicles | 0 (0.0%) | 0 (0.0%) |
| Total | 60 (100.0%) | 55 (100.0%) |
Commute Time in Plainview
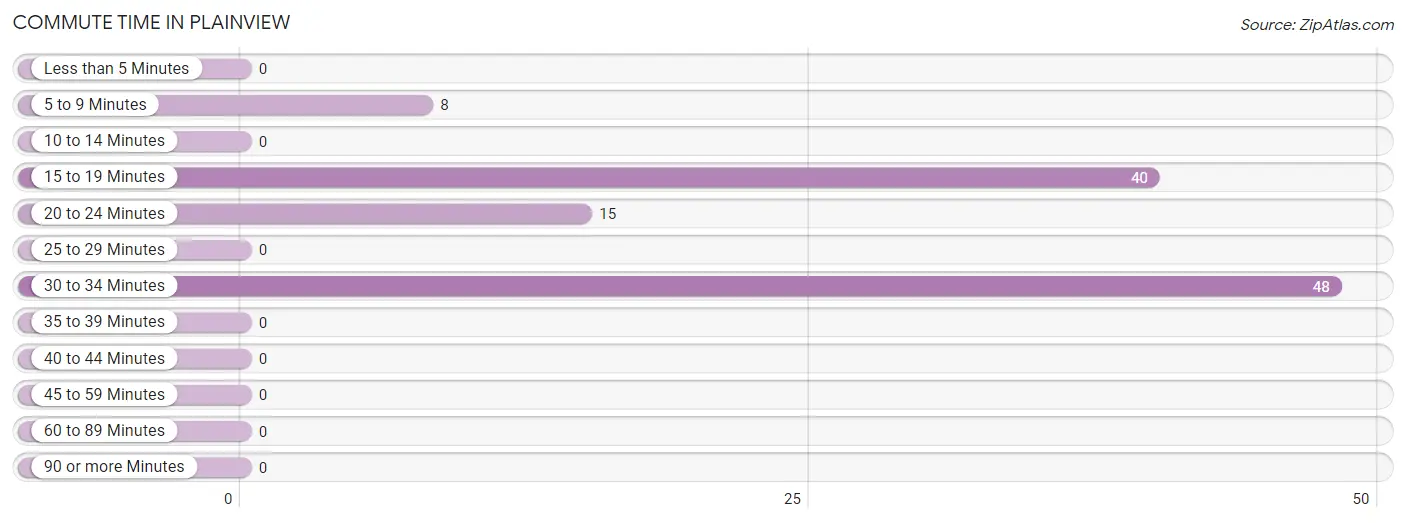
The most frequently occuring commute durations in Plainview are 30 to 34 minutes (48 commuters, 43.2%), 15 to 19 minutes (40 commuters, 36.0%), and 20 to 24 minutes (15 commuters, 13.5%).
| Commute Time | # Commuters | % Commuters |
| Less than 5 Minutes | 0 | 0.0% |
| 5 to 9 Minutes | 8 | 7.2% |
| 10 to 14 Minutes | 0 | 0.0% |
| 15 to 19 Minutes | 40 | 36.0% |
| 20 to 24 Minutes | 15 | 13.5% |
| 25 to 29 Minutes | 0 | 0.0% |
| 30 to 34 Minutes | 48 | 43.2% |
| 35 to 39 Minutes | 0 | 0.0% |
| 40 to 44 Minutes | 0 | 0.0% |
| 45 to 59 Minutes | 0 | 0.0% |
| 60 to 89 Minutes | 0 | 0.0% |
| 90 or more Minutes | 0 | 0.0% |
Commute Time by Sex in Plainview
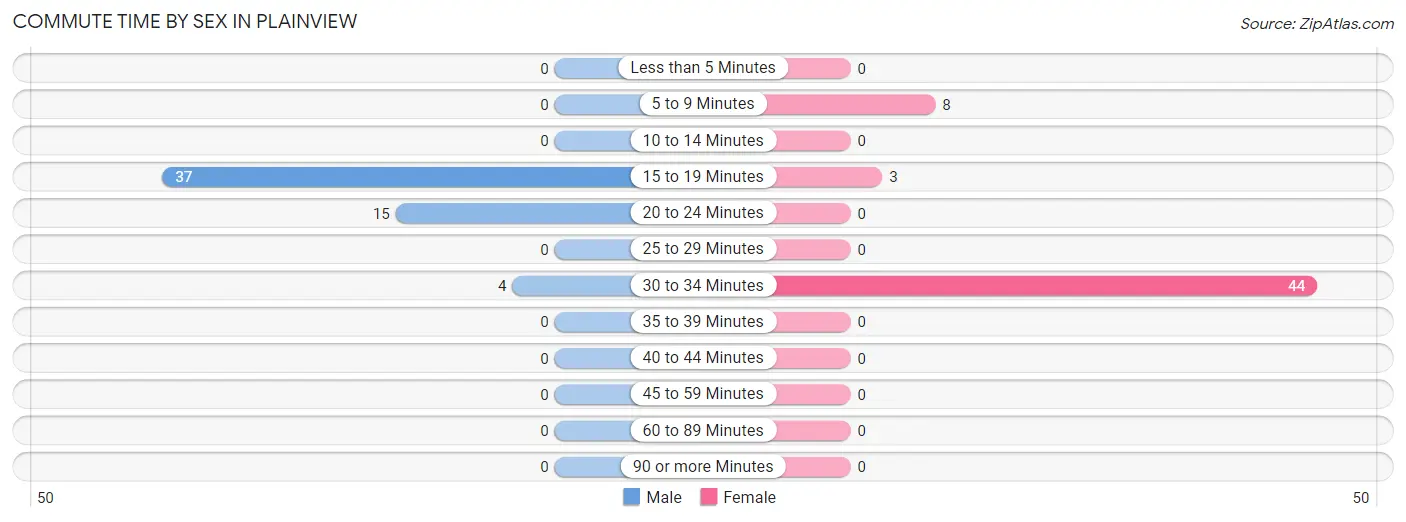
The most common commute times in Plainview are 15 to 19 minutes (37 commuters, 66.1%) for males and 30 to 34 minutes (44 commuters, 80.0%) for females.
| Commute Time | Male | Female |
| Less than 5 Minutes | 0 (0.0%) | 0 (0.0%) |
| 5 to 9 Minutes | 0 (0.0%) | 8 (14.5%) |
| 10 to 14 Minutes | 0 (0.0%) | 0 (0.0%) |
| 15 to 19 Minutes | 37 (66.1%) | 3 (5.4%) |
| 20 to 24 Minutes | 15 (26.8%) | 0 (0.0%) |
| 25 to 29 Minutes | 0 (0.0%) | 0 (0.0%) |
| 30 to 34 Minutes | 4 (7.1%) | 44 (80.0%) |
| 35 to 39 Minutes | 0 (0.0%) | 0 (0.0%) |
| 40 to 44 Minutes | 0 (0.0%) | 0 (0.0%) |
| 45 to 59 Minutes | 0 (0.0%) | 0 (0.0%) |
| 60 to 89 Minutes | 0 (0.0%) | 0 (0.0%) |
| 90 or more Minutes | 0 (0.0%) | 0 (0.0%) |
Time of Departure to Work by Sex in Plainview
The most frequent times of departure to work in Plainview are 6:30 AM to 6:59 AM (25, 44.6%) for males and 6:00 AM to 6:29 AM (29, 52.7%) for females.
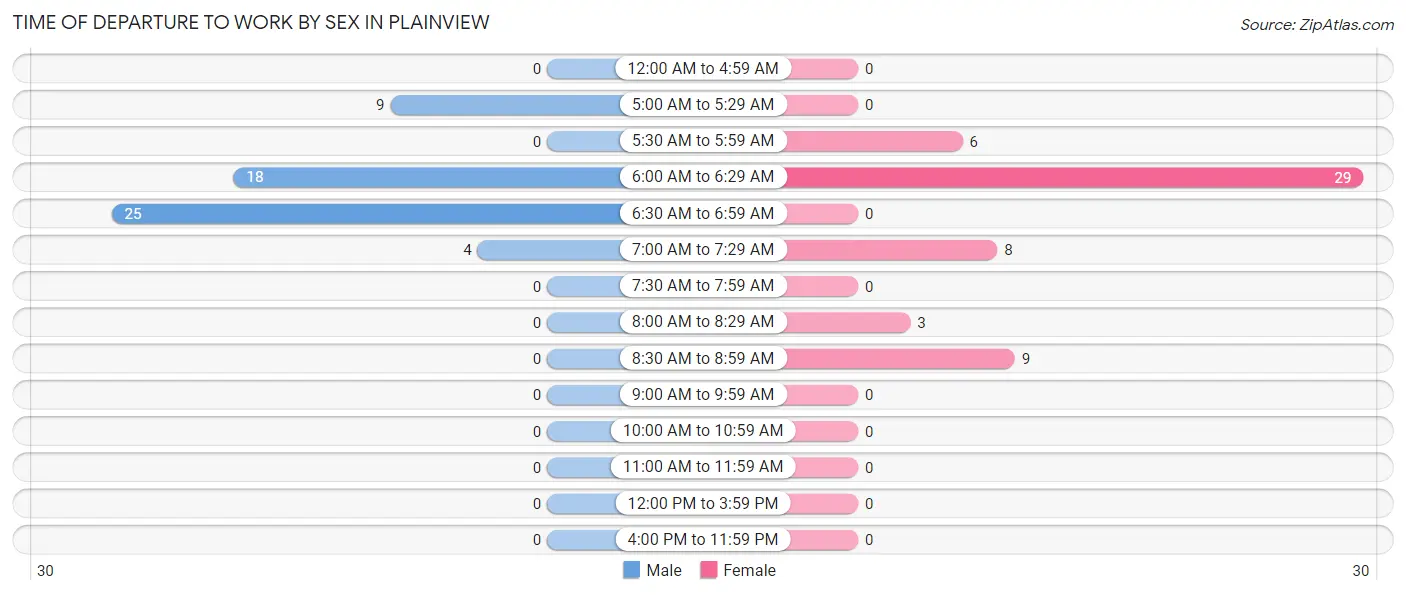
| Time of Departure | Male | Female |
| 12:00 AM to 4:59 AM | 0 (0.0%) | 0 (0.0%) |
| 5:00 AM to 5:29 AM | 9 (16.1%) | 0 (0.0%) |
| 5:30 AM to 5:59 AM | 0 (0.0%) | 6 (10.9%) |
| 6:00 AM to 6:29 AM | 18 (32.1%) | 29 (52.7%) |
| 6:30 AM to 6:59 AM | 25 (44.6%) | 0 (0.0%) |
| 7:00 AM to 7:29 AM | 4 (7.1%) | 8 (14.5%) |
| 7:30 AM to 7:59 AM | 0 (0.0%) | 0 (0.0%) |
| 8:00 AM to 8:29 AM | 0 (0.0%) | 3 (5.4%) |
| 8:30 AM to 8:59 AM | 0 (0.0%) | 9 (16.4%) |
| 9:00 AM to 9:59 AM | 0 (0.0%) | 0 (0.0%) |
| 10:00 AM to 10:59 AM | 0 (0.0%) | 0 (0.0%) |
| 11:00 AM to 11:59 AM | 0 (0.0%) | 0 (0.0%) |
| 12:00 PM to 3:59 PM | 0 (0.0%) | 0 (0.0%) |
| 4:00 PM to 11:59 PM | 0 (0.0%) | 0 (0.0%) |
| Total | 56 (100.0%) | 55 (100.0%) |
Housing Occupancy in Plainview
Occupancy by Ownership in Plainview
Of the total 121 dwellings in Plainview, owner-occupied units account for 104 (86.0%), while renter-occupied units make up 17 (14.1%).
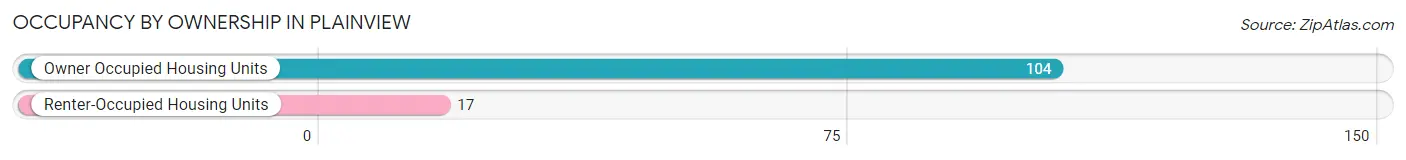
| Occupancy | # Housing Units | % Housing Units |
| Owner Occupied Housing Units | 104 | 86.0% |
| Renter-Occupied Housing Units | 17 | 14.1% |
| Total Occupied Housing Units | 121 | 100.0% |
Occupancy by Household Size in Plainview
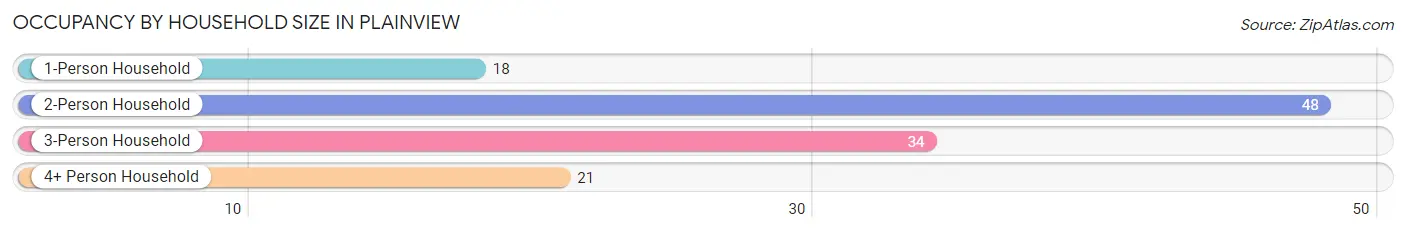
| Household Size | # Housing Units | % Housing Units |
| 1-Person Household | 18 | 14.9% |
| 2-Person Household | 48 | 39.7% |
| 3-Person Household | 34 | 28.1% |
| 4+ Person Household | 21 | 17.4% |
| Total Housing Units | 121 | 100.0% |
Occupancy by Ownership by Household Size in Plainview
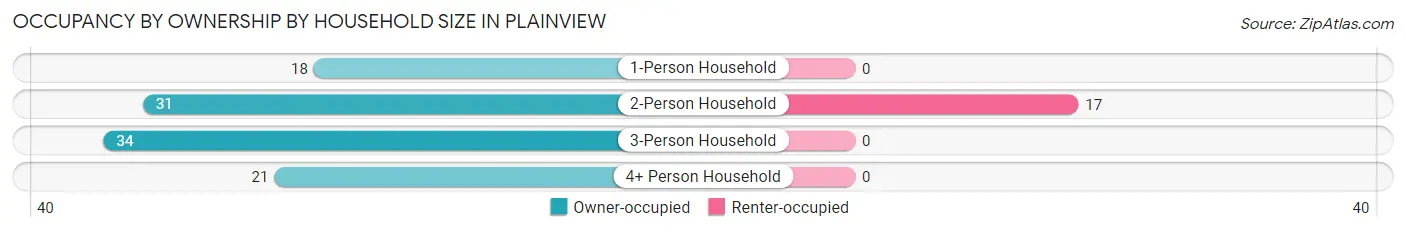
| Household Size | Owner-occupied | Renter-occupied |
| 1-Person Household | 18 (100.0%) | 0 (0.0%) |
| 2-Person Household | 31 (64.6%) | 17 (35.4%) |
| 3-Person Household | 34 (100.0%) | 0 (0.0%) |
| 4+ Person Household | 21 (100.0%) | 0 (0.0%) |
| Total Housing Units | 104 (86.0%) | 17 (14.1%) |
Occupancy by Educational Attainment in Plainview
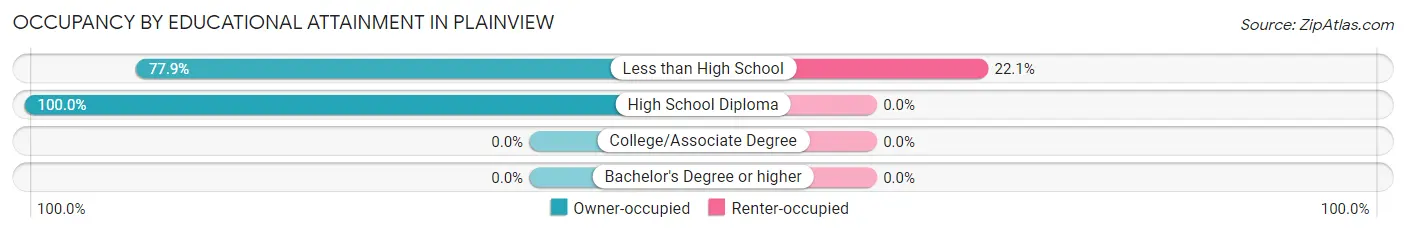
| Household Size | Owner-occupied | Renter-occupied |
| Less than High School | 60 (77.9%) | 17 (22.1%) |
| High School Diploma | 44 (100.0%) | 0 (0.0%) |
| College/Associate Degree | 0 (0.0%) | 0 (0.0%) |
| Bachelor's Degree or higher | 0 (0.0%) | 0 (0.0%) |
Occupancy by Age of Householder in Plainview
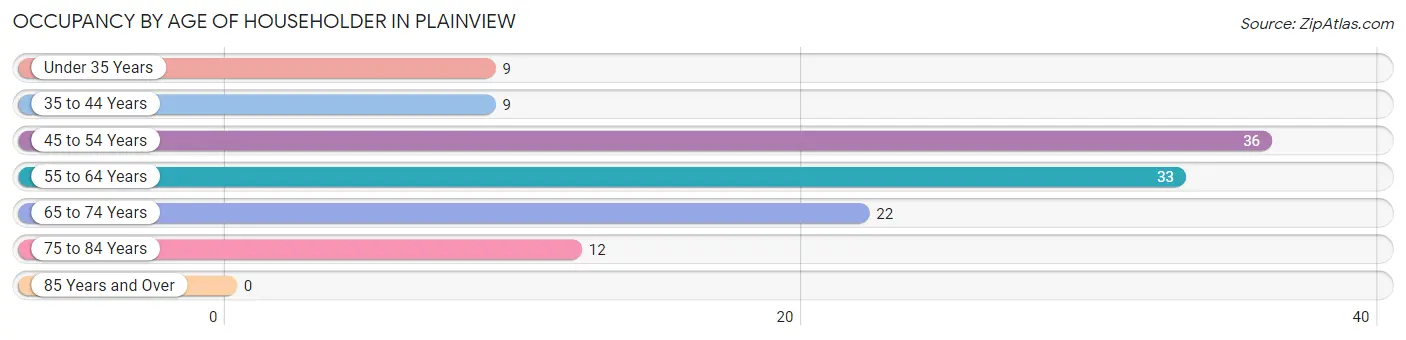
| Age Bracket | # Households | % Households |
| Under 35 Years | 9 | 7.4% |
| 35 to 44 Years | 9 | 7.4% |
| 45 to 54 Years | 36 | 29.7% |
| 55 to 64 Years | 33 | 27.3% |
| 65 to 74 Years | 22 | 18.2% |
| 75 to 84 Years | 12 | 9.9% |
| 85 Years and Over | 0 | 0.0% |
| Total | 121 | 100.0% |
Housing Finances in Plainview
Median Income by Occupancy in Plainview
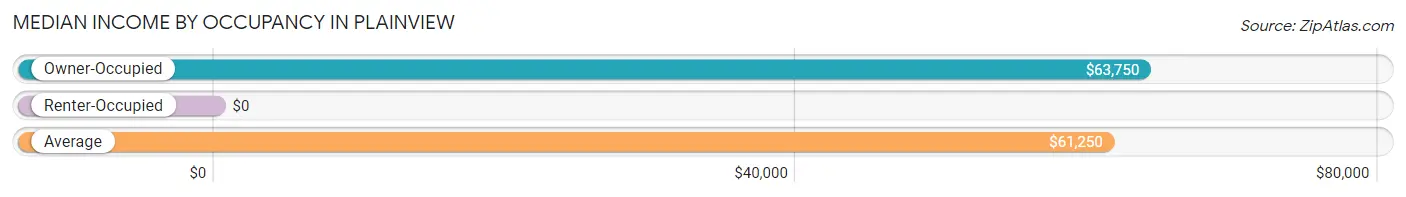
| Occupancy Type | # Households | Median Income |
| Owner-Occupied | 104 (86.0%) | $63,750 |
| Renter-Occupied | 17 (14.1%) | $0 |
| Average | 121 (100.0%) | $61,250 |
Occupancy by Householder Income Bracket in Plainview
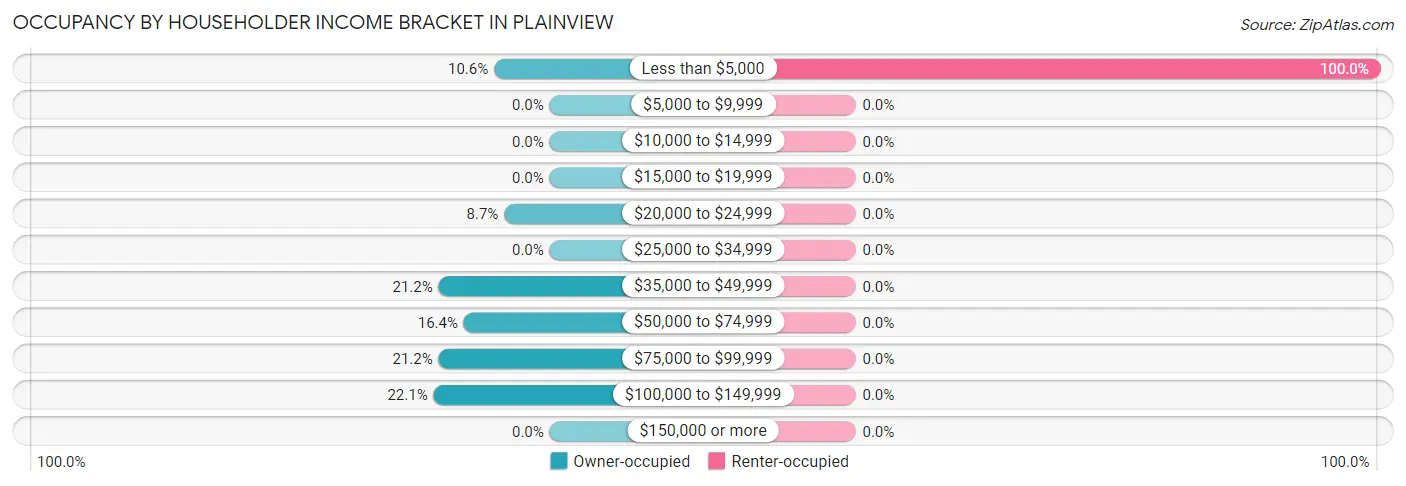
| Income Bracket | Owner-occupied | Renter-occupied |
| Less than $5,000 | 11 (10.6%) | 17 (100.0%) |
| $5,000 to $9,999 | 0 (0.0%) | 0 (0.0%) |
| $10,000 to $14,999 | 0 (0.0%) | 0 (0.0%) |
| $15,000 to $19,999 | 0 (0.0%) | 0 (0.0%) |
| $20,000 to $24,999 | 9 (8.6%) | 0 (0.0%) |
| $25,000 to $34,999 | 0 (0.0%) | 0 (0.0%) |
| $35,000 to $49,999 | 22 (21.1%) | 0 (0.0%) |
| $50,000 to $74,999 | 17 (16.4%) | 0 (0.0%) |
| $75,000 to $99,999 | 22 (21.1%) | 0 (0.0%) |
| $100,000 to $149,999 | 23 (22.1%) | 0 (0.0%) |
| $150,000 or more | 0 (0.0%) | 0 (0.0%) |
| Total | 104 (100.0%) | 17 (100.0%) |
Monthly Housing Cost Tiers in Plainview
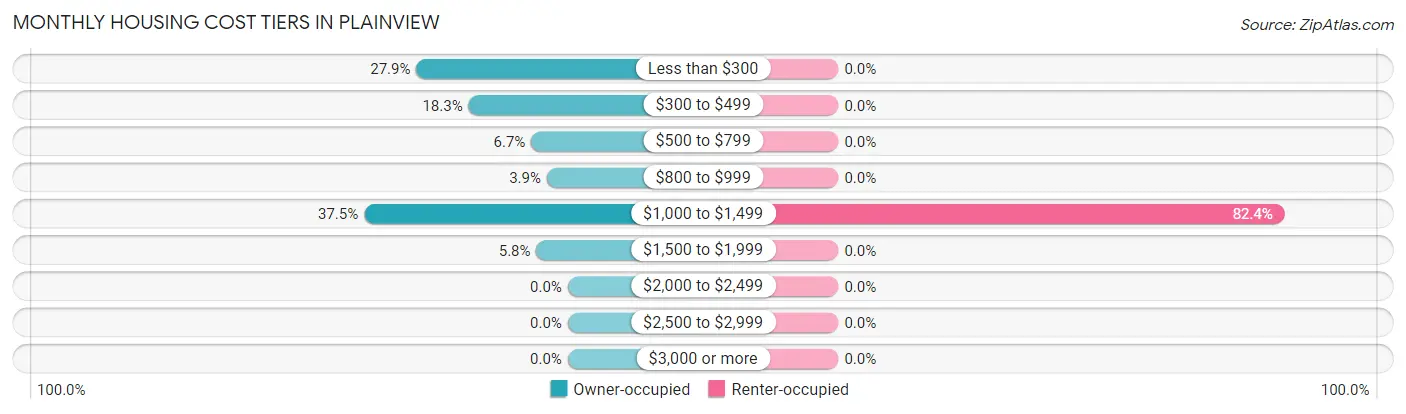
| Monthly Cost | Owner-occupied | Renter-occupied |
| Less than $300 | 29 (27.9%) | 0 (0.0%) |
| $300 to $499 | 19 (18.3%) | 0 (0.0%) |
| $500 to $799 | 7 (6.7%) | 0 (0.0%) |
| $800 to $999 | 4 (3.8%) | 0 (0.0%) |
| $1,000 to $1,499 | 39 (37.5%) | 14 (82.4%) |
| $1,500 to $1,999 | 6 (5.8%) | 0 (0.0%) |
| $2,000 to $2,499 | 0 (0.0%) | 0 (0.0%) |
| $2,500 to $2,999 | 0 (0.0%) | 0 (0.0%) |
| $3,000 or more | 0 (0.0%) | 0 (0.0%) |
| Total | 104 (100.0%) | 17 (100.0%) |
Physical Housing Characteristics in Plainview
Housing Structures in Plainview
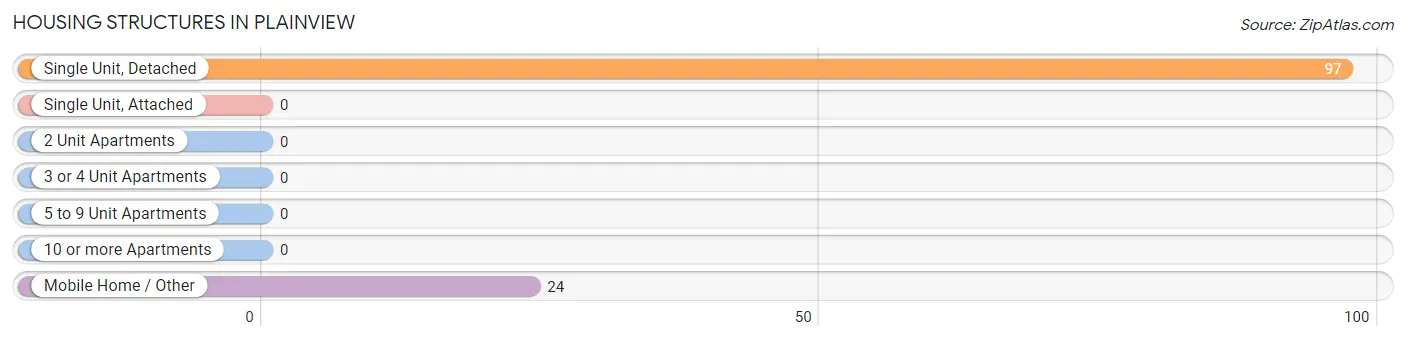
| Structure Type | # Housing Units | % Housing Units |
| Single Unit, Detached | 97 | 80.2% |
| Single Unit, Attached | 0 | 0.0% |
| 2 Unit Apartments | 0 | 0.0% |
| 3 or 4 Unit Apartments | 0 | 0.0% |
| 5 to 9 Unit Apartments | 0 | 0.0% |
| 10 or more Apartments | 0 | 0.0% |
| Mobile Home / Other | 24 | 19.8% |
| Total | 121 | 100.0% |
Housing Structures by Occupancy in Plainview
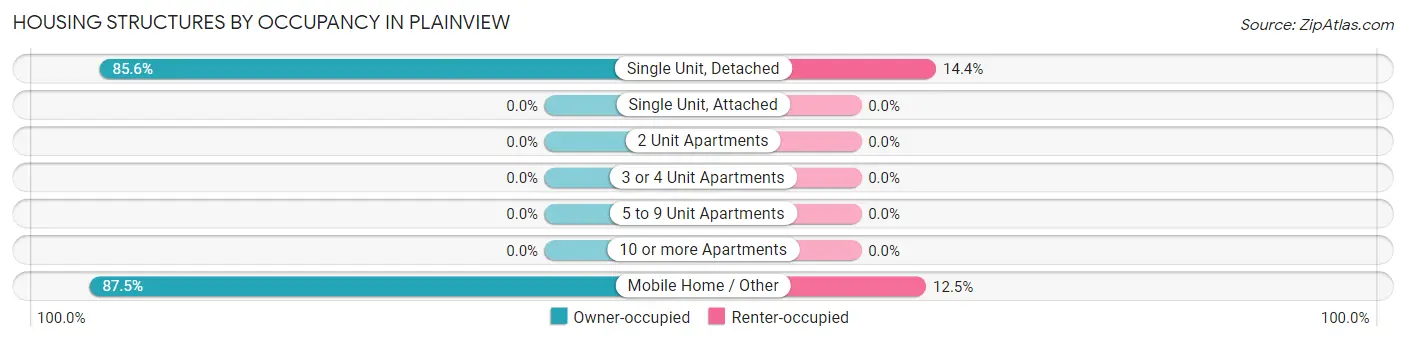
| Structure Type | Owner-occupied | Renter-occupied |
| Single Unit, Detached | 83 (85.6%) | 14 (14.4%) |
| Single Unit, Attached | 0 (0.0%) | 0 (0.0%) |
| 2 Unit Apartments | 0 (0.0%) | 0 (0.0%) |
| 3 or 4 Unit Apartments | 0 (0.0%) | 0 (0.0%) |
| 5 to 9 Unit Apartments | 0 (0.0%) | 0 (0.0%) |
| 10 or more Apartments | 0 (0.0%) | 0 (0.0%) |
| Mobile Home / Other | 21 (87.5%) | 3 (12.5%) |
| Total | 104 (86.0%) | 17 (14.1%) |
Housing Structures by Number of Rooms in Plainview
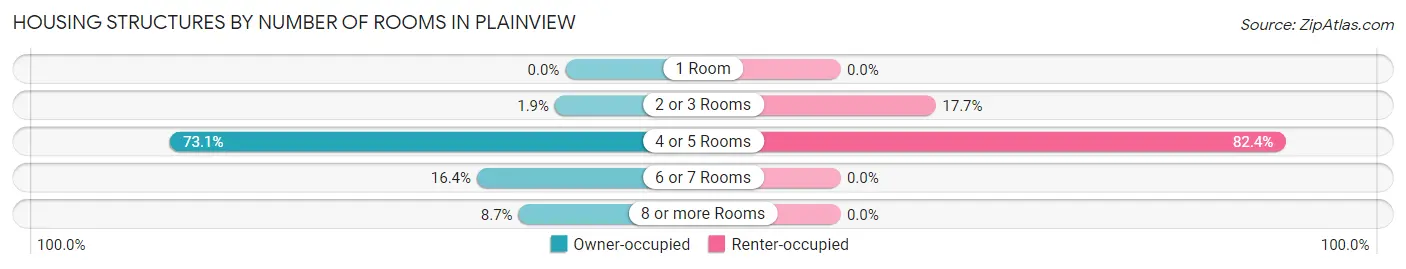
| Number of Rooms | Owner-occupied | Renter-occupied |
| 1 Room | 0 (0.0%) | 0 (0.0%) |
| 2 or 3 Rooms | 2 (1.9%) | 3 (17.6%) |
| 4 or 5 Rooms | 76 (73.1%) | 14 (82.4%) |
| 6 or 7 Rooms | 17 (16.4%) | 0 (0.0%) |
| 8 or more Rooms | 9 (8.6%) | 0 (0.0%) |
| Total | 104 (100.0%) | 17 (100.0%) |
Housing Structure by Heating Type in Plainview
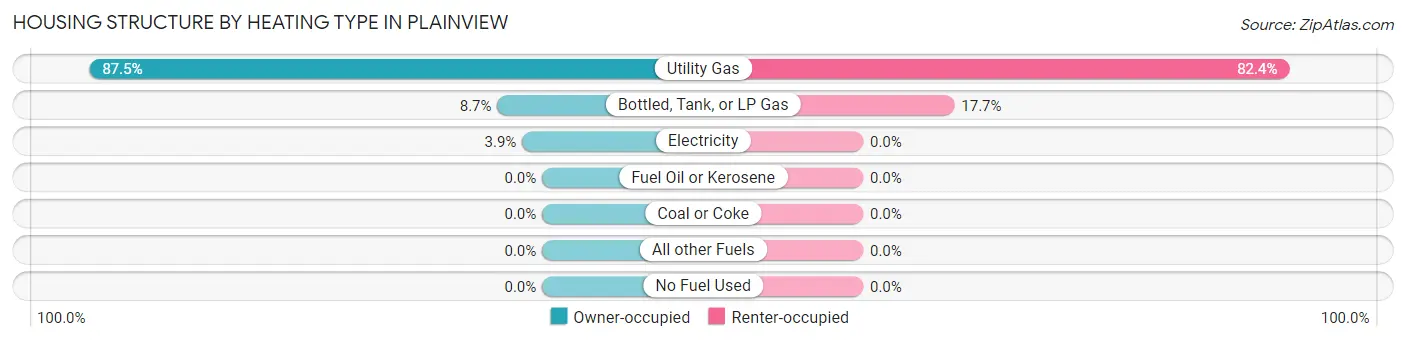
| Heating Type | Owner-occupied | Renter-occupied |
| Utility Gas | 91 (87.5%) | 14 (82.4%) |
| Bottled, Tank, or LP Gas | 9 (8.6%) | 3 (17.6%) |
| Electricity | 4 (3.8%) | 0 (0.0%) |
| Fuel Oil or Kerosene | 0 (0.0%) | 0 (0.0%) |
| Coal or Coke | 0 (0.0%) | 0 (0.0%) |
| All other Fuels | 0 (0.0%) | 0 (0.0%) |
| No Fuel Used | 0 (0.0%) | 0 (0.0%) |
| Total | 104 (100.0%) | 17 (100.0%) |
Household Vehicle Usage in Plainview
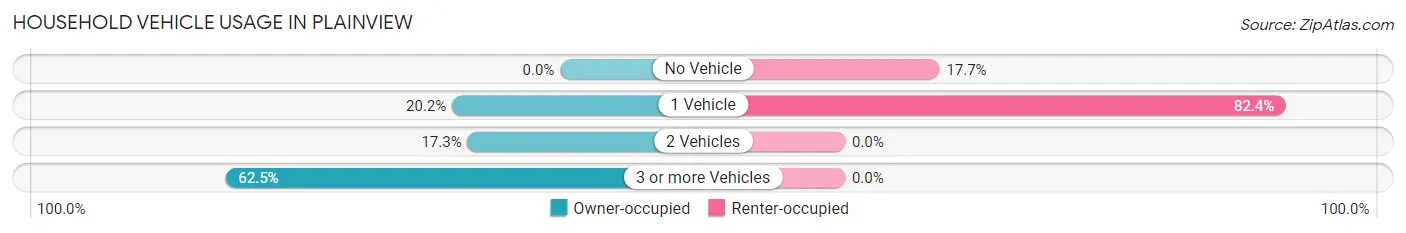
| Vehicles per Household | Owner-occupied | Renter-occupied |
| No Vehicle | 0 (0.0%) | 3 (17.6%) |
| 1 Vehicle | 21 (20.2%) | 14 (82.4%) |
| 2 Vehicles | 18 (17.3%) | 0 (0.0%) |
| 3 or more Vehicles | 65 (62.5%) | 0 (0.0%) |
| Total | 104 (100.0%) | 17 (100.0%) |
Real Estate & Mortgages in Plainview
Real Estate and Mortgage Overview in Plainview
| Characteristic | Without Mortgage | With Mortgage |
| Housing Units | 59 | 45 |
| Median Property Value | $124,100 | $85,800 |
| Median Household Income | $87,679 | $0 |
| Monthly Housing Costs | $403 | $0 |
| Real Estate Taxes | $936 | $0 |
Property Value by Mortgage Status in Plainview
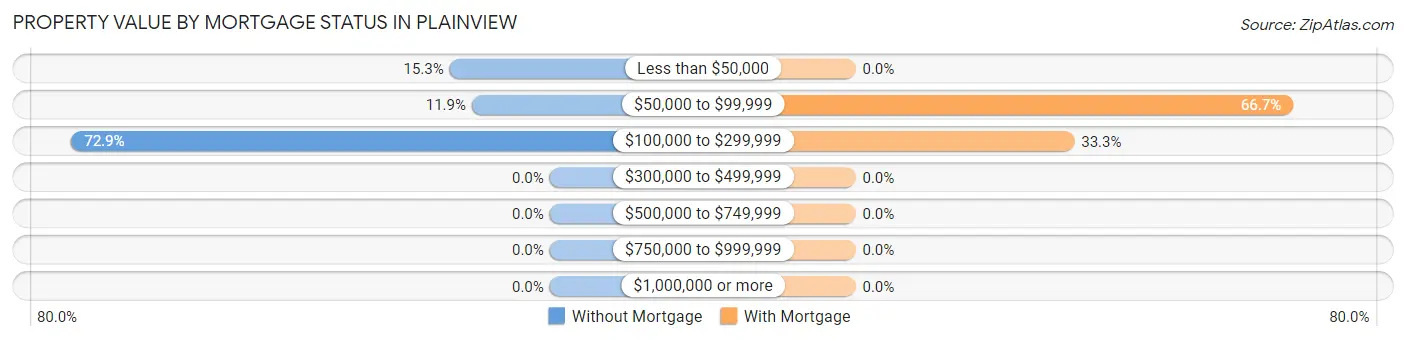
| Property Value | Without Mortgage | With Mortgage |
| Less than $50,000 | 9 (15.2%) | 0 (0.0%) |
| $50,000 to $99,999 | 7 (11.9%) | 30 (66.7%) |
| $100,000 to $299,999 | 43 (72.9%) | 15 (33.3%) |
| $300,000 to $499,999 | 0 (0.0%) | 0 (0.0%) |
| $500,000 to $749,999 | 0 (0.0%) | 0 (0.0%) |
| $750,000 to $999,999 | 0 (0.0%) | 0 (0.0%) |
| $1,000,000 or more | 0 (0.0%) | 0 (0.0%) |
| Total | 59 (100.0%) | 45 (100.0%) |
Household Income by Mortgage Status in Plainview
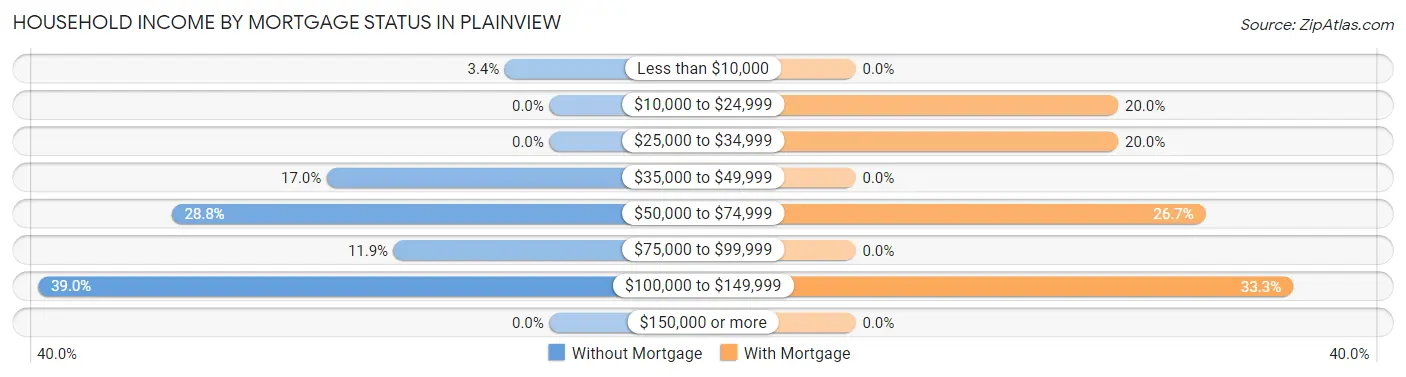
| Household Income | Without Mortgage | With Mortgage |
| Less than $10,000 | 2 (3.4%) | 0 (0.0%) |
| $10,000 to $24,999 | 0 (0.0%) | 9 (20.0%) |
| $25,000 to $34,999 | 0 (0.0%) | 9 (20.0%) |
| $35,000 to $49,999 | 10 (17.0%) | 0 (0.0%) |
| $50,000 to $74,999 | 17 (28.8%) | 12 (26.7%) |
| $75,000 to $99,999 | 7 (11.9%) | 0 (0.0%) |
| $100,000 to $149,999 | 23 (39.0%) | 15 (33.3%) |
| $150,000 or more | 0 (0.0%) | 0 (0.0%) |
| Total | 59 (100.0%) | 45 (100.0%) |
Property Value to Household Income Ratio in Plainview
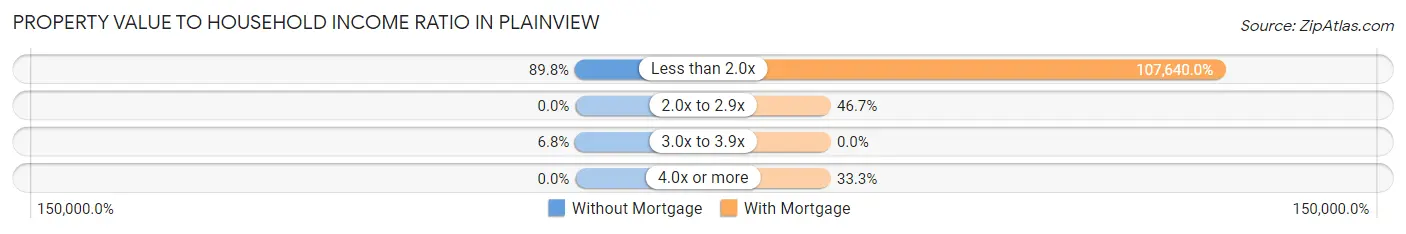
| Value-to-Income Ratio | Without Mortgage | With Mortgage |
| Less than 2.0x | 53 (89.8%) | 48,438 (107,640.0%) |
| 2.0x to 2.9x | 0 (0.0%) | 21 (46.7%) |
| 3.0x to 3.9x | 4 (6.8%) | 0 (0.0%) |
| 4.0x or more | 0 (0.0%) | 15 (33.3%) |
| Total | 59 (100.0%) | 45 (100.0%) |
Real Estate Taxes by Mortgage Status in Plainview
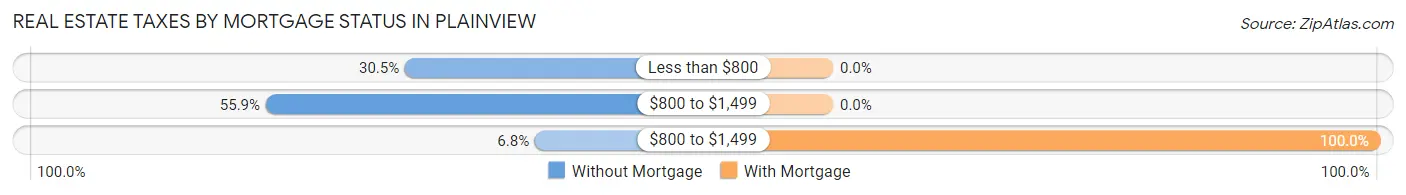
| Property Taxes | Without Mortgage | With Mortgage |
| Less than $800 | 18 (30.5%) | 0 (0.0%) |
| $800 to $1,499 | 33 (55.9%) | 0 (0.0%) |
| $800 to $1,499 | 4 (6.8%) | 45 (100.0%) |
| Total | 59 (100.0%) | 45 (100.0%) |
Health & Disability in Plainview
Health Insurance Coverage by Age in Plainview
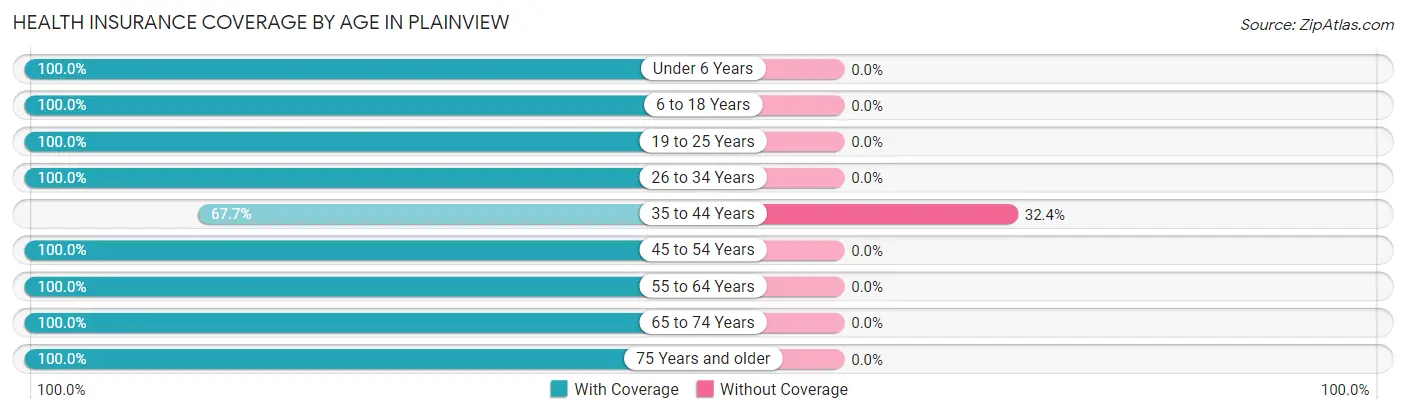
| Age Bracket | With Coverage | Without Coverage |
| Under 6 Years | 8 (100.0%) | 0 (0.0%) |
| 6 to 18 Years | 80 (100.0%) | 0 (0.0%) |
| 19 to 25 Years | 43 (100.0%) | 0 (0.0%) |
| 26 to 34 Years | 36 (100.0%) | 0 (0.0%) |
| 35 to 44 Years | 23 (67.6%) | 11 (32.4%) |
| 45 to 54 Years | 63 (100.0%) | 0 (0.0%) |
| 55 to 64 Years | 64 (100.0%) | 0 (0.0%) |
| 65 to 74 Years | 33 (100.0%) | 0 (0.0%) |
| 75 Years and older | 17 (100.0%) | 0 (0.0%) |
| Total | 367 (97.1%) | 11 (2.9%) |
Health Insurance Coverage by Citizenship Status in Plainview
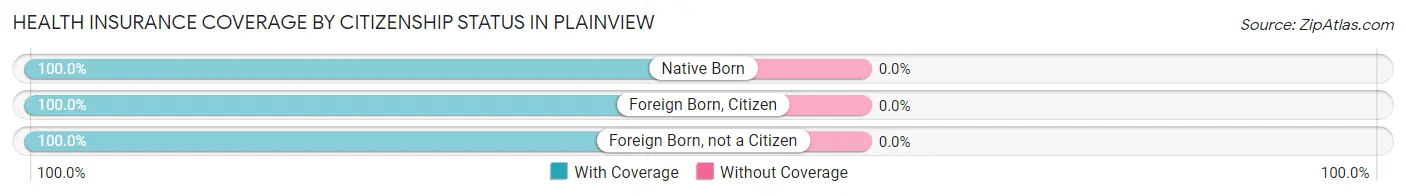
| Citizenship Status | With Coverage | Without Coverage |
| Native Born | 8 (100.0%) | 0 (0.0%) |
| Foreign Born, Citizen | 80 (100.0%) | 0 (0.0%) |
| Foreign Born, not a Citizen | 43 (100.0%) | 0 (0.0%) |
Health Insurance Coverage by Household Income in Plainview
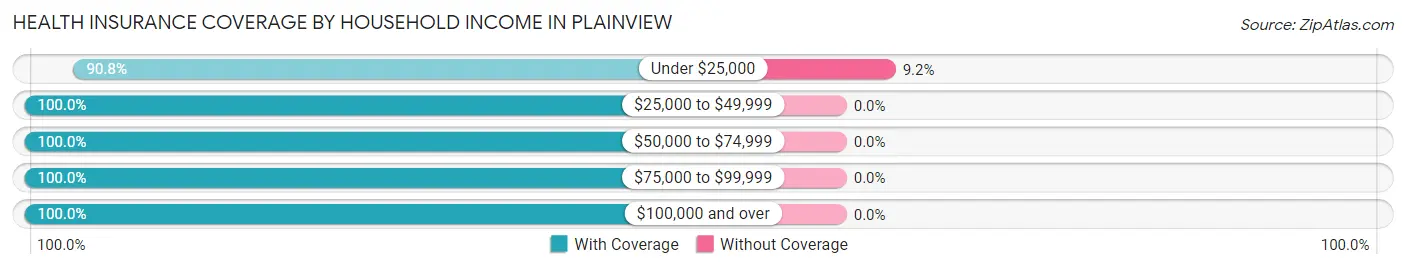
| Household Income | With Coverage | Without Coverage |
| Under $25,000 | 109 (90.8%) | 11 (9.2%) |
| $25,000 to $49,999 | 59 (100.0%) | 0 (0.0%) |
| $50,000 to $74,999 | 66 (100.0%) | 0 (0.0%) |
| $75,000 to $99,999 | 89 (100.0%) | 0 (0.0%) |
| $100,000 and over | 44 (100.0%) | 0 (0.0%) |
Public vs Private Health Insurance Coverage by Age in Plainview
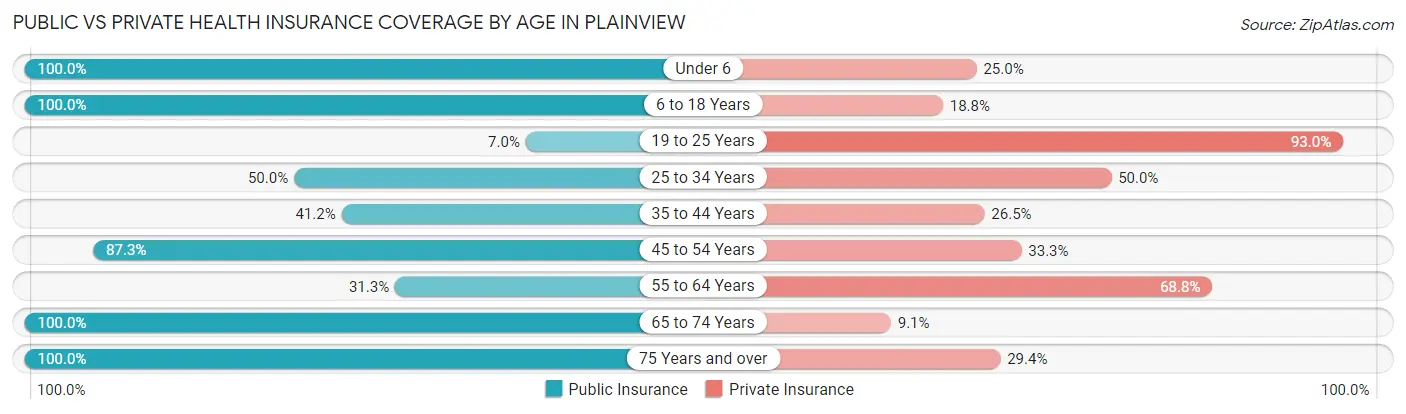
| Age Bracket | Public Insurance | Private Insurance |
| Under 6 | 8 (100.0%) | 2 (25.0%) |
| 6 to 18 Years | 80 (100.0%) | 15 (18.8%) |
| 19 to 25 Years | 3 (7.0%) | 40 (93.0%) |
| 25 to 34 Years | 18 (50.0%) | 18 (50.0%) |
| 35 to 44 Years | 14 (41.2%) | 9 (26.5%) |
| 45 to 54 Years | 55 (87.3%) | 21 (33.3%) |
| 55 to 64 Years | 20 (31.2%) | 44 (68.8%) |
| 65 to 74 Years | 33 (100.0%) | 3 (9.1%) |
| 75 Years and over | 17 (100.0%) | 5 (29.4%) |
| Total | 248 (65.6%) | 157 (41.5%) |
Disability Status by Sex by Age in Plainview
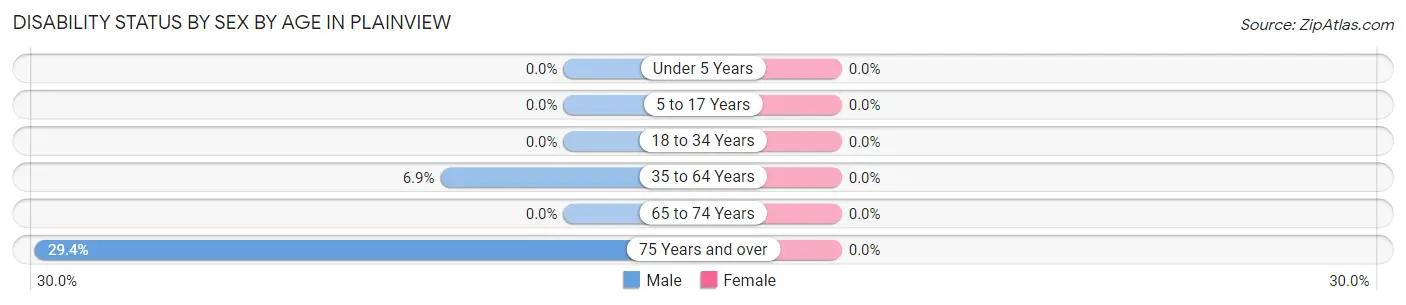
| Age Bracket | Male | Female |
| Under 5 Years | 0 (0.0%) | 0 (0.0%) |
| 5 to 17 Years | 0 (0.0%) | 0 (0.0%) |
| 18 to 34 Years | 0 (0.0%) | 0 (0.0%) |
| 35 to 64 Years | 5 (6.9%) | 0 (0.0%) |
| 65 to 74 Years | 0 (0.0%) | 0 (0.0%) |
| 75 Years and over | 5 (29.4%) | 0 (0.0%) |
Disability Class by Sex by Age in Plainview
Disability Class: Hearing Difficulty
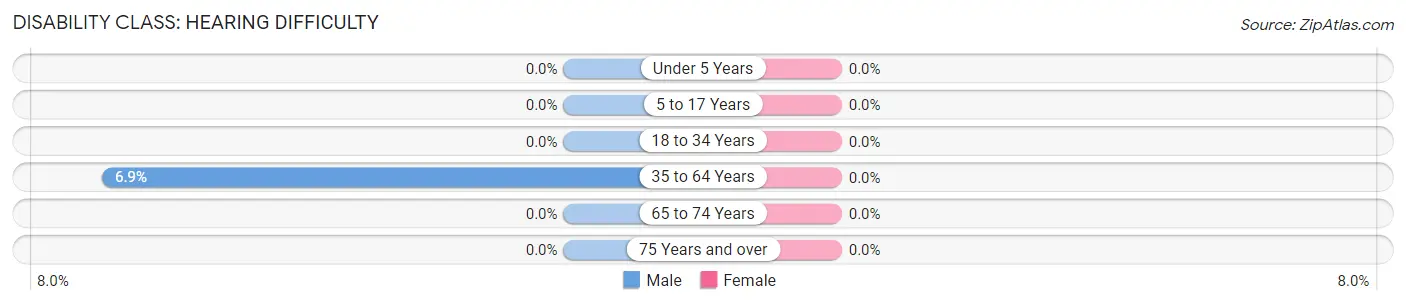
| Age Bracket | Male | Female |
| Under 5 Years | 0 (0.0%) | 0 (0.0%) |
| 5 to 17 Years | 0 (0.0%) | 0 (0.0%) |
| 18 to 34 Years | 0 (0.0%) | 0 (0.0%) |
| 35 to 64 Years | 5 (6.9%) | 0 (0.0%) |
| 65 to 74 Years | 0 (0.0%) | 0 (0.0%) |
| 75 Years and over | 0 (0.0%) | 0 (0.0%) |
Disability Class: Vision Difficulty
| Age Bracket | Male | Female |
| Under 5 Years | 0 (0.0%) | 0 (0.0%) |
| 5 to 17 Years | 0 (0.0%) | 0 (0.0%) |
| 18 to 34 Years | 0 (0.0%) | 0 (0.0%) |
| 35 to 64 Years | 0 (0.0%) | 0 (0.0%) |
| 65 to 74 Years | 0 (0.0%) | 0 (0.0%) |
| 75 Years and over | 0 (0.0%) | 0 (0.0%) |
Disability Class: Cognitive Difficulty
| Age Bracket | Male | Female |
| 5 to 17 Years | 0 (0.0%) | 0 (0.0%) |
| 18 to 34 Years | 0 (0.0%) | 0 (0.0%) |
| 35 to 64 Years | 5 (6.9%) | 0 (0.0%) |
| 65 to 74 Years | 0 (0.0%) | 0 (0.0%) |
| 75 Years and over | 0 (0.0%) | 0 (0.0%) |
Disability Class: Ambulatory Difficulty
| Age Bracket | Male | Female |
| 5 to 17 Years | 0 (0.0%) | 0 (0.0%) |
| 18 to 34 Years | 0 (0.0%) | 0 (0.0%) |
| 35 to 64 Years | 5 (6.9%) | 0 (0.0%) |
| 65 to 74 Years | 0 (0.0%) | 0 (0.0%) |
| 75 Years and over | 5 (29.4%) | 0 (0.0%) |
Disability Class: Self-Care Difficulty
| Age Bracket | Male | Female |
| 5 to 17 Years | 0 (0.0%) | 0 (0.0%) |
| 18 to 34 Years | 0 (0.0%) | 0 (0.0%) |
| 35 to 64 Years | 5 (6.9%) | 0 (0.0%) |
| 65 to 74 Years | 0 (0.0%) | 0 (0.0%) |
| 75 Years and over | 0 (0.0%) | 0 (0.0%) |
Technology Access in Plainview
Computing Device Access in Plainview
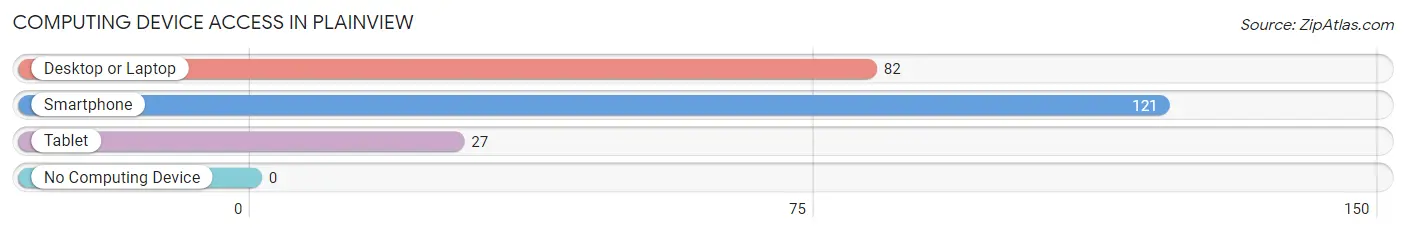
| Device Type | # Households | % Households |
| Desktop or Laptop | 82 | 67.8% |
| Smartphone | 121 | 100.0% |
| Tablet | 27 | 22.3% |
| No Computing Device | 0 | 0.0% |
| Total | 121 | 100.0% |
Internet Access in Plainview
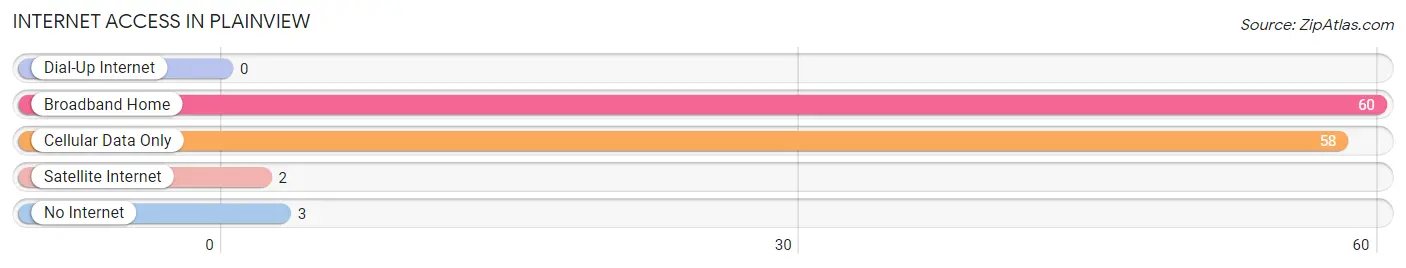
| Internet Type | # Households | % Households |
| Dial-Up Internet | 0 | 0.0% |
| Broadband Home | 60 | 49.6% |
| Cellular Data Only | 58 | 47.9% |
| Satellite Internet | 2 | 1.7% |
| No Internet | 3 | 2.5% |
| Total | 121 | 100.0% |
Plainview Summary
Plainview is a small unincorporated community located in the foothills of the Sierra Nevada Mountains in California. It is situated in the northern part of the state, about 30 miles east of the city of Redding. The population of Plainview was estimated to be around 1,000 people in 2000.
History
The area that is now Plainview was first settled in the late 1800s by miners and ranchers. The town was originally known as “Plainview Station” and was a stop on the stagecoach line that ran between Redding and Susanville. The town was officially established in 1891 and was named after the nearby Plainview Ranch.
In the early 1900s, the town was a popular destination for tourists who wanted to experience the beauty of the Sierra Nevada Mountains. The town was also home to a number of businesses, including a hotel, a general store, a blacksmith shop, and a saloon.
Geography
Plainview is located in the northern part of California, about 30 miles east of the city of Redding. The town is situated in the foothills of the Sierra Nevada Mountains and is surrounded by rolling hills and open meadows. The climate in Plainview is mild and dry, with hot summers and cold winters.
The town is located near several recreational areas, including the Lassen National Forest, the Shasta-Trinity National Forest, and the Lava Beds National Monument. The nearby lakes and rivers provide opportunities for fishing, boating, and swimming.
Economy
The economy of Plainview is largely based on agriculture and tourism. The town is home to several farms and ranches that produce a variety of crops, including hay, alfalfa, and wheat. The nearby forests and recreational areas attract tourists from all over the state.
The town is also home to a number of small businesses, including restaurants, stores, and a gas station. The local economy is supplemented by the nearby cities of Redding and Susanville, which provide employment opportunities for many of the town’s residents.
Demographics
The population of Plainview was estimated to be around 1,000 people in 2000. The town is predominantly white, with a small Hispanic population. The median household income in Plainview is slightly lower than the state average. The town has a high rate of poverty, with nearly one-third of the population living below the poverty line.
Common Questions
What is Per Capita Income in Plainview?
Per Capita income in Plainview is $18,857.
What is the Median Family Income in Plainview?
Median Family Income in Plainview is $49,261.
What is the Median Household income in Plainview?
Median Household Income in Plainview is $61,250.
What is Inequality or Gini Index in Plainview?
Inequality or Gini Index in Plainview is 0.39.
What is the Total Population of Plainview?
Total Population of Plainview is 378.
What is the Total Male Population of Plainview?
Total Male Population of Plainview is 177.
What is the Total Female Population of Plainview?
Total Female Population of Plainview is 201.
What is the Ratio of Males per 100 Females in Plainview?
There are 88.06 Males per 100 Females in Plainview.
What is the Ratio of Females per 100 Males in Plainview?
There are 113.56 Females per 100 Males in Plainview.
What is the Median Population Age in Plainview?
Median Population Age in Plainview is 42.6 Years.
What is the Average Family Size in Plainview
Average Family Size in Plainview is 3.9 People.
What is the Average Household Size in Plainview
Average Household Size in Plainview is 3.1 People.
How Large is the Labor Force in Plainview?
There are 193 People in the Labor Forcein in Plainview.
What is the Percentage of People in the Labor Force in Plainview?
59.8% of People are in the Labor Force in Plainview.
What is the Unemployment Rate in Plainview?
Unemployment Rate in Plainview is 40.4%.