Cities with the Highest Unemployment Rate Amomg Youth Under the Age of 25 in South Dakota
RELATED REPORTS & OPTIONS
Highest Unemployment | Youth < 25
South Dakota
Compare Cities
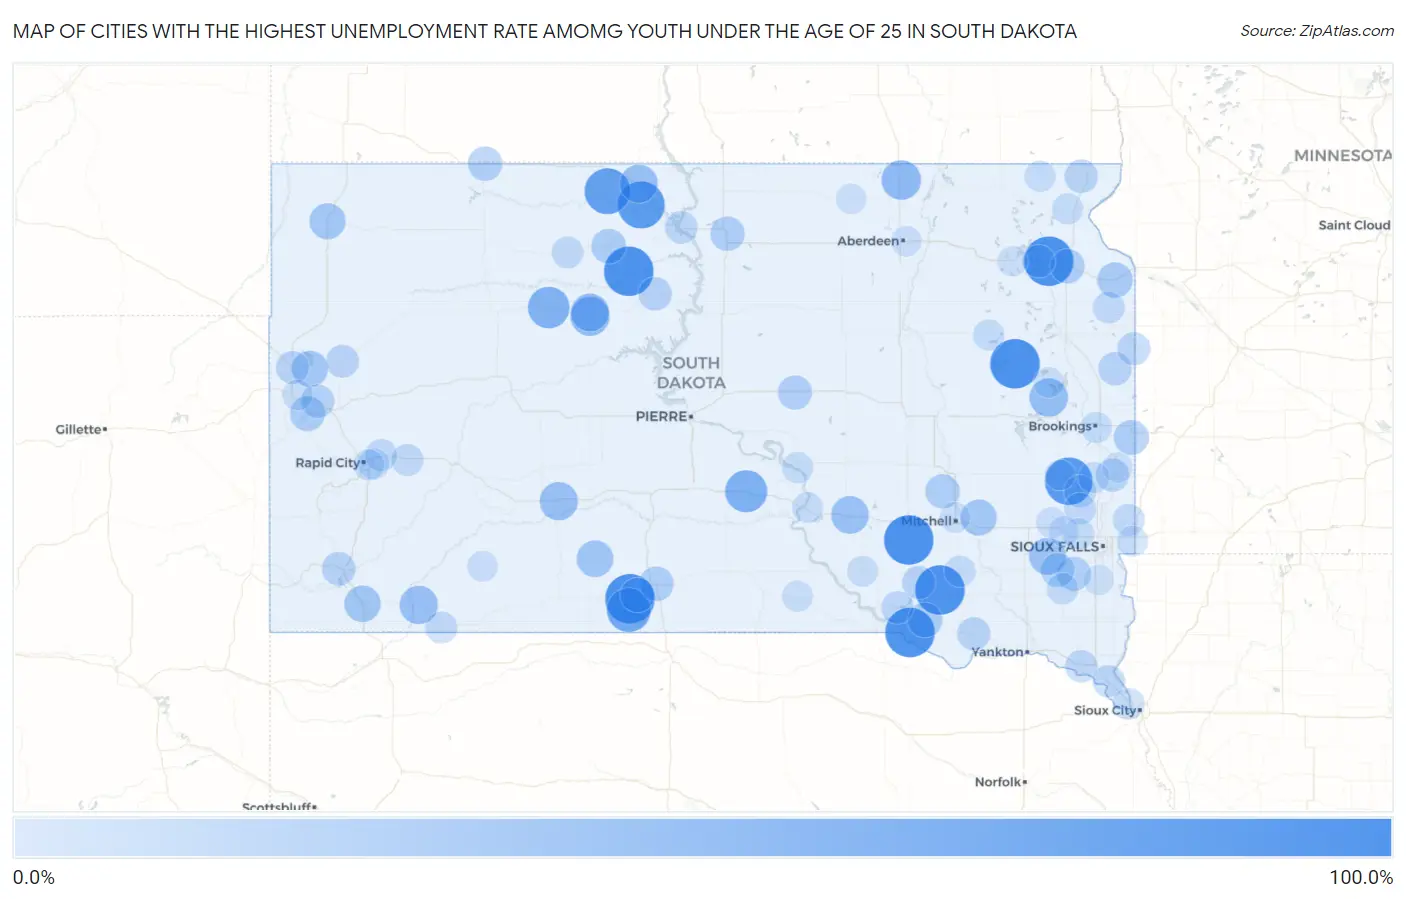
Map of Cities with the Highest Unemployment Rate Amomg Youth Under the Age of 25 in South Dakota
0.0%
100.0%
Cities with the Highest Unemployment Rate Amomg Youth Under the Age of 25 in South Dakota
| City | Youth Unemployment | vs State | vs National | |
| 1. | Marty | 100.0% | 7.4%(+92.6)#1 | 10.9%(+89.1)#23 |
| 2. | Two Strike | 100.0% | 7.4%(+92.6)#2 | 10.9%(+89.1)#140 |
| 3. | Stickney | 100.0% | 7.4%(+92.6)#3 | 10.9%(+89.1)#165 |
| 4. | Cherry Creek | 100.0% | 7.4%(+92.6)#4 | 10.9%(+89.1)#175 |
| 5. | Delmont | 100.0% | 7.4%(+92.6)#5 | 10.9%(+89.1)#184 |
| 6. | Kenel | 100.0% | 7.4%(+92.6)#6 | 10.9%(+89.1)#203 |
| 7. | Whitehorse | 100.0% | 7.4%(+92.6)#7 | 10.9%(+89.1)#226 |
| 8. | Vienna | 100.0% | 7.4%(+92.6)#8 | 10.9%(+89.1)#259 |
| 9. | Ortley | 100.0% | 7.4%(+92.6)#9 | 10.9%(+89.1)#305 |
| 10. | Wakpala | 99.8% | 7.4%(+92.4)#10 | 10.9%(+88.9)#374 |
| 11. | Lake Madison | 90.0% | 7.4%(+82.6)#11 | 10.9%(+79.1)#404 |
| 12. | Little Eagle | 87.4% | 7.4%(+80.0)#12 | 10.9%(+76.5)#415 |
| 13. | Enemy Swim | 86.4% | 7.4%(+79.0)#13 | 10.9%(+75.5)#419 |
| 14. | Bullhead | 81.2% | 7.4%(+73.8)#14 | 10.9%(+70.3)#453 |
| 15. | St Francis | 71.5% | 7.4%(+64.1)#15 | 10.9%(+60.6)#558 |
| 16. | Kennebec | 62.5% | 7.4%(+55.1)#16 | 10.9%(+51.6)#718 |
| 17. | Dupree | 59.9% | 7.4%(+52.5)#17 | 10.9%(+49.0)#783 |
| 18. | Frederick | 50.0% | 7.4%(+42.6)#18 | 10.9%(+39.1)#1,122 |
| 19. | Eagle Butte | 48.7% | 7.4%(+41.3)#19 | 10.9%(+37.8)#1,216 |
| 20. | Badger | 44.9% | 7.4%(+37.5)#20 | 10.9%(+34.0)#1,372 |
| 21. | Oglala | 43.7% | 7.4%(+36.3)#21 | 10.9%(+32.8)#1,431 |
| 22. | Kadoka | 43.4% | 7.4%(+36.0)#22 | 10.9%(+32.5)#1,465 |
| 23. | Mclaughlin | 42.8% | 7.4%(+35.4)#23 | 10.9%(+31.9)#1,505 |
| 24. | North Eagle Butte | 42.5% | 7.4%(+35.1)#24 | 10.9%(+31.6)#1,536 |
| 25. | Kimball | 40.7% | 7.4%(+33.3)#25 | 10.9%(+29.8)#1,660 |
| 26. | Monroe | 37.5% | 7.4%(+30.1)#26 | 10.9%(+26.6)#1,899 |
| 27. | Norris | 35.7% | 7.4%(+28.3)#27 | 10.9%(+24.8)#2,044 |
| 28. | Mountain Plains | 35.3% | 7.4%(+27.9)#28 | 10.9%(+24.4)#2,081 |
| 29. | Oelrichs | 34.7% | 7.4%(+27.3)#29 | 10.9%(+23.8)#2,138 |
| 30. | Buffalo | 33.3% | 7.4%(+25.9)#30 | 10.9%(+22.4)#2,292 |
| 31. | Fruitdale | 33.3% | 7.4%(+25.9)#31 | 10.9%(+22.4)#2,333 |
| 32. | Fulton | 33.3% | 7.4%(+25.9)#32 | 10.9%(+22.4)#2,343 |
| 33. | Milbank | 28.8% | 7.4%(+21.4)#33 | 10.9%(+17.9)#2,831 |
| 34. | Deadwood | 27.9% | 7.4%(+20.5)#34 | 10.9%(+17.0)#2,976 |
| 35. | Wagner | 27.1% | 7.4%(+19.7)#35 | 10.9%(+16.2)#3,103 |
| 36. | Elkton | 26.9% | 7.4%(+19.5)#36 | 10.9%(+16.0)#3,138 |
| 37. | Timber Lake | 26.5% | 7.4%(+19.1)#37 | 10.9%(+15.6)#3,212 |
| 38. | Mission | 25.9% | 7.4%(+18.5)#38 | 10.9%(+15.0)#3,323 |
| 39. | Rosebud | 25.0% | 7.4%(+17.6)#39 | 10.9%(+14.1)#3,460 |
| 40. | Letcher | 25.0% | 7.4%(+17.6)#40 | 10.9%(+14.1)#3,504 |
| 41. | Selby | 24.9% | 7.4%(+17.5)#41 | 10.9%(+14.0)#3,532 |
| 42. | Summit | 24.9% | 7.4%(+17.5)#42 | 10.9%(+14.0)#3,545 |
| 43. | Lemmon | 24.6% | 7.4%(+17.2)#43 | 10.9%(+13.7)#3,591 |
| 44. | Highmore | 23.8% | 7.4%(+16.4)#44 | 10.9%(+12.9)#3,749 |
| 45. | Chancellor | 23.5% | 7.4%(+16.1)#45 | 10.9%(+12.6)#3,822 |
| 46. | Horse Creek | 23.0% | 7.4%(+15.6)#46 | 10.9%(+12.1)#3,951 |
| 47. | Parker | 22.8% | 7.4%(+15.4)#47 | 10.9%(+11.9)#3,989 |
| 48. | Whitewood | 21.3% | 7.4%(+13.9)#48 | 10.9%(+10.4)#4,376 |
| 49. | Hot Springs | 21.0% | 7.4%(+13.6)#49 | 10.9%(+10.1)#4,433 |
| 50. | La Plant | 20.6% | 7.4%(+13.2)#50 | 10.9%(+9.70)#4,558 |
| 51. | Egan | 20.0% | 7.4%(+12.6)#51 | 10.9%(+9.10)#4,723 |
| 52. | New Effington | 20.0% | 7.4%(+12.6)#52 | 10.9%(+9.10)#4,726 |
| 53. | Brandt | 20.0% | 7.4%(+12.6)#53 | 10.9%(+9.10)#4,735 |
| 54. | Armour | 18.7% | 7.4%(+11.3)#54 | 10.9%(+7.80)#5,153 |
| 55. | Belle Fourche | 18.5% | 7.4%(+11.1)#55 | 10.9%(+7.60)#5,201 |
| 56. | Tyndall | 18.5% | 7.4%(+11.1)#56 | 10.9%(+7.60)#5,213 |
| 57. | Gary | 18.1% | 7.4%(+10.7)#57 | 10.9%(+7.20)#5,356 |
| 58. | Newell | 17.6% | 7.4%(+10.2)#58 | 10.9%(+6.70)#5,578 |
| 59. | Waubay | 16.6% | 7.4%(+9.20)#59 | 10.9%(+5.70)#5,974 |
| 60. | Lake Andes | 16.0% | 7.4%(+8.60)#60 | 10.9%(+5.10)#6,228 |
| 61. | Mobridge | 15.4% | 7.4%(+8.00)#61 | 10.9%(+4.50)#6,501 |
| 62. | Vermillion | 15.2% | 7.4%(+7.80)#62 | 10.9%(+4.30)#6,580 |
| 63. | Elk Point | 15.2% | 7.4%(+7.80)#63 | 10.9%(+4.30)#6,593 |
| 64. | West Brule | 14.8% | 7.4%(+7.40)#64 | 10.9%(+3.90)#6,809 |
| 65. | Chester | 14.2% | 7.4%(+6.80)#65 | 10.9%(+3.30)#7,128 |
| 66. | New Underwood | 13.7% | 7.4%(+6.30)#66 | 10.9%(+2.80)#7,424 |
| 67. | Colton | 13.4% | 7.4%(+6.00)#67 | 10.9%(+2.50)#7,599 |
| 68. | Isabel | 13.3% | 7.4%(+5.90)#68 | 10.9%(+2.40)#7,679 |
| 69. | Box Elder | 13.1% | 7.4%(+5.70)#69 | 10.9%(+2.20)#7,741 |
| 70. | Garretson | 13.1% | 7.4%(+5.70)#70 | 10.9%(+2.20)#7,766 |
| 71. | Pine Ridge | 12.7% | 7.4%(+5.30)#71 | 10.9%(+1.80)#7,997 |
| 72. | La Bolt | 12.4% | 7.4%(+5.00)#72 | 10.9%(+1.50)#8,224 |
| 73. | North Sioux City | 11.3% | 7.4%(+3.90)#73 | 10.9%(+0.400)#8,858 |
| 74. | Hurley | 11.1% | 7.4%(+3.70)#74 | 10.9%(+0.200)#9,041 |
| 75. | Parkston | 10.5% | 7.4%(+3.10)#75 | 10.9%(-0.400)#9,426 |
| 76. | Fort Thompson | 10.3% | 7.4%(+2.90)#76 | 10.9%(-0.600)#9,608 |
| 77. | Sisseton | 10.0% | 7.4%(+2.60)#77 | 10.9%(-0.900)#9,819 |
| 78. | Clark | 9.7% | 7.4%(+2.30)#78 | 10.9%(-1.20)#10,077 |
| 79. | Brookings | 9.4% | 7.4%(+2.00)#79 | 10.9%(-1.50)#10,258 |
| 80. | Hartford | 9.4% | 7.4%(+2.00)#80 | 10.9%(-1.50)#10,292 |
| 81. | Rapid Valley | 9.1% | 7.4%(+1.70)#81 | 10.9%(-1.80)#10,521 |
| 82. | Colman | 9.0% | 7.4%(+1.60)#82 | 10.9%(-1.90)#10,608 |
| 83. | Veblen | 9.0% | 7.4%(+1.60)#83 | 10.9%(-1.90)#10,622 |
| 84. | Rapid City | 8.9% | 7.4%(+1.50)#84 | 10.9%(-2.00)#10,658 |
| 85. | Gregory | 8.3% | 7.4%(+0.900)#85 | 10.9%(-2.60)#11,221 |
| 86. | Valley Springs | 7.8% | 7.4%(+0.400)#86 | 10.9%(-3.10)#11,596 |
| 87. | Chamberlain | 7.6% | 7.4%(+0.200)#87 | 10.9%(-3.30)#11,726 |
| 88. | Platte | 7.6% | 7.4%(+0.200)#88 | 10.9%(-3.30)#11,736 |
| 89. | Aberdeen | 7.3% | 7.4%(-0.100)#89 | 10.9%(-3.60)#11,955 |
| 90. | Mitchell | 7.1% | 7.4%(-0.300)#90 | 10.9%(-3.80)#12,104 |
| 91. | Lake Norden | 7.1% | 7.4%(-0.300)#91 | 10.9%(-3.80)#12,141 |
| 92. | Kyle | 6.9% | 7.4%(-0.500)#92 | 10.9%(-4.00)#12,287 |
| 93. | Montrose | 6.8% | 7.4%(-0.600)#93 | 10.9%(-4.10)#12,383 |
| 94. | Spearfish | 6.2% | 7.4%(-1.20)#94 | 10.9%(-4.70)#12,799 |
| 95. | Humboldt | 6.2% | 7.4%(-1.20)#95 | 10.9%(-4.70)#12,844 |
| 96. | Madison | 5.8% | 7.4%(-1.60)#96 | 10.9%(-5.10)#13,132 |
| 97. | Leola | 5.5% | 7.4%(-1.90)#97 | 10.9%(-5.40)#13,412 |
| 98. | Flandreau | 5.4% | 7.4%(-2.00)#98 | 10.9%(-5.50)#13,473 |
| 99. | Worthing | 5.4% | 7.4%(-2.00)#99 | 10.9%(-5.50)#13,491 |
| 100. | Webster | 5.0% | 7.4%(-2.40)#100 | 10.9%(-5.90)#13,770 |
1
2Common Questions
What are the Top 10 Cities with the Highest Unemployment Rate Amomg Youth Under the Age of 25 in South Dakota?
Top 10 Cities with the Highest Unemployment Rate Amomg Youth Under the Age of 25 in South Dakota are:
#1
100.0%
#2
100.0%
#3
100.0%
#4
100.0%
#5
100.0%
#6
100.0%
#7
100.0%
#8
90.0%
#9
87.4%
#10
81.2%
What city has the Highest Unemployment Rate Amomg Youth Under the Age of 25 in South Dakota?
Marty has the Highest Unemployment Rate Amomg Youth Under the Age of 25 in South Dakota with 100.0%.
What is the Unemployment Rate Amomg Youth Under the Age of 25 in the State of South Dakota?
Unemployment Rate Amomg Youth Under the Age of 25 in South Dakota is 7.4%.
What is the Unemployment Rate Amomg Youth Under the Age of 25 in the United States?
Unemployment Rate Amomg Youth Under the Age of 25 in the United States is 10.9%.