Cities with the Highest Unemployment Rate Amomg Youth Under the Age of 25 in Washington
RELATED REPORTS & OPTIONS
Highest Unemployment | Youth < 25
Washington
Compare Cities
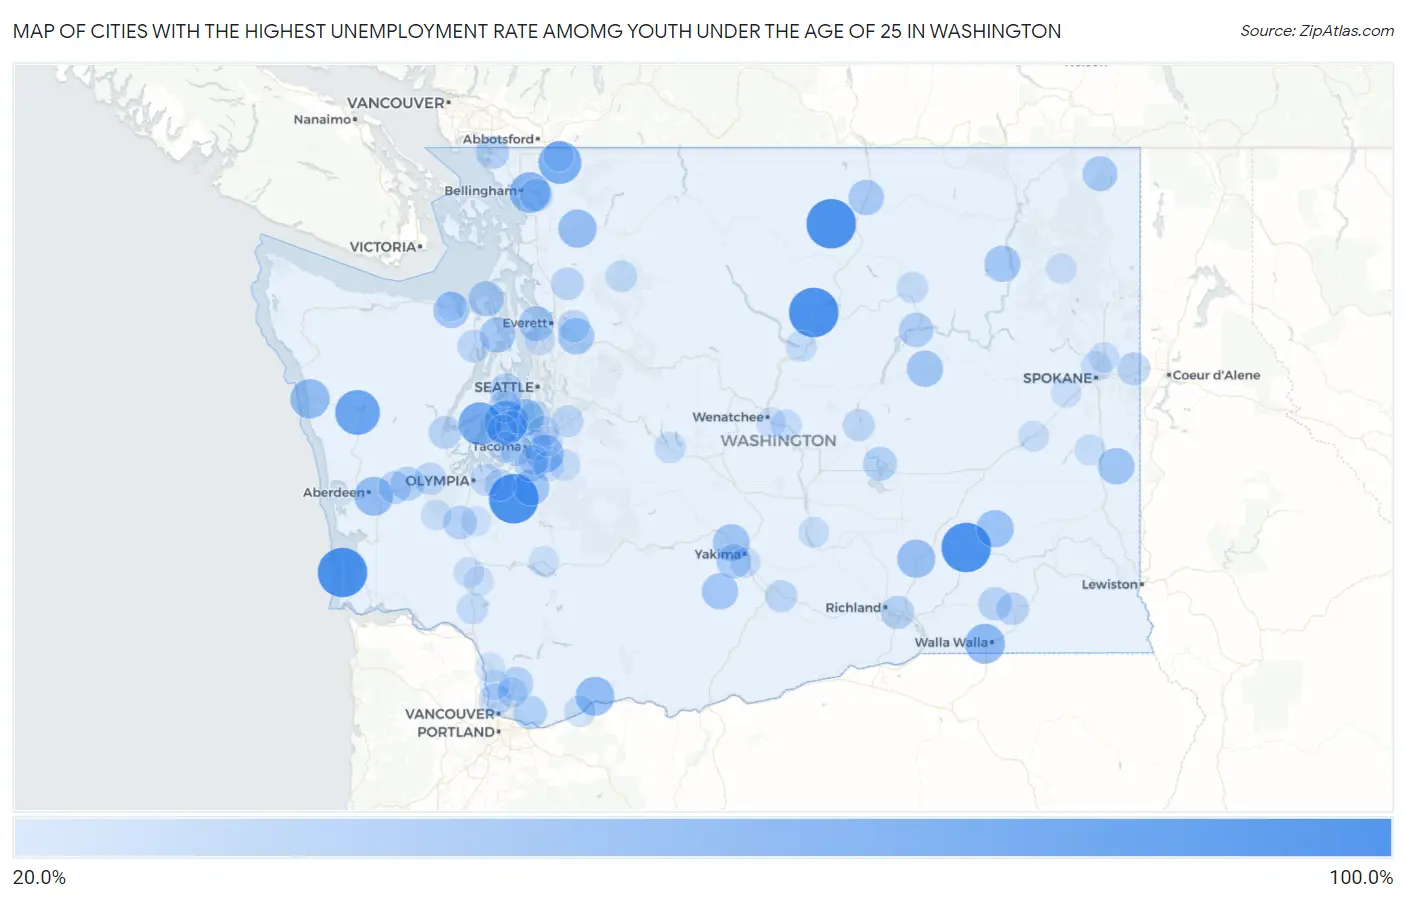
Map of Cities with the Highest Unemployment Rate Amomg Youth Under the Age of 25 in Washington
0.0%
100.0%
Cities with the Highest Unemployment Rate Amomg Youth Under the Age of 25 in Washington
| City | Youth Unemployment | vs State | vs National | |
| 1. | Conconully | 100.0% | 10.9%(+89.1)#1 | 10.9%(+89.1)#22 |
| 2. | Mckenna | 100.0% | 10.9%(+89.1)#2 | 10.9%(+89.1)#95 |
| 3. | Kahlotus | 100.0% | 10.9%(+89.1)#3 | 10.9%(+89.1)#234 |
| 4. | Ocean Park | 99.9% | 10.9%(+89.0)#4 | 10.9%(+89.0)#324 |
| 5. | Pateros | 99.9% | 10.9%(+89.0)#5 | 10.9%(+89.0)#343 |
| 6. | Amanda Park | 80.0% | 10.9%(+69.1)#6 | 10.9%(+69.1)#460 |
| 7. | Purdy | 74.4% | 10.9%(+63.5)#7 | 10.9%(+63.5)#528 |
| 8. | Allyn | 71.7% | 10.9%(+60.8)#8 | 10.9%(+60.8)#555 |
| 9. | Kendall | 71.5% | 10.9%(+60.6)#9 | 10.9%(+60.6)#557 |
| 10. | Geneva | 63.5% | 10.9%(+52.6)#10 | 10.9%(+52.6)#701 |
| 11. | Garrett | 59.6% | 10.9%(+48.7)#11 | 10.9%(+48.7)#790 |
| 12. | Queets | 57.1% | 10.9%(+46.2)#12 | 10.9%(+46.2)#864 |
| 13. | Cosmopolis | 55.5% | 10.9%(+44.6)#13 | 10.9%(+44.6)#894 |
| 14. | Carson | 55.4% | 10.9%(+44.5)#14 | 10.9%(+44.5)#912 |
| 15. | Hamilton | 53.3% | 10.9%(+42.4)#15 | 10.9%(+42.4)#983 |
| 16. | Mesa | 52.3% | 10.9%(+41.4)#16 | 10.9%(+41.4)#1,014 |
| 17. | North Puyallup | 50.7% | 10.9%(+39.8)#17 | 10.9%(+39.8)#1,067 |
| 18. | Washtucna | 49.9% | 10.9%(+39.0)#18 | 10.9%(+39.0)#1,180 |
| 19. | Vashon | 49.3% | 10.9%(+38.4)#19 | 10.9%(+38.4)#1,198 |
| 20. | Eschbach | 47.5% | 10.9%(+36.6)#20 | 10.9%(+36.6)#1,255 |
| 21. | Tehaleh | 46.1% | 10.9%(+35.2)#21 | 10.9%(+35.2)#1,298 |
| 22. | Oakesdale | 46.1% | 10.9%(+35.2)#22 | 10.9%(+35.2)#1,308 |
| 23. | Almira | 45.4% | 10.9%(+34.5)#23 | 10.9%(+34.5)#1,343 |
| 24. | White Swan | 45.2% | 10.9%(+34.3)#24 | 10.9%(+34.3)#1,352 |
| 25. | Chain Lake | 45.1% | 10.9%(+34.2)#25 | 10.9%(+34.2)#1,353 |
| 26. | Inchelium | 45.0% | 10.9%(+34.1)#26 | 10.9%(+34.1)#1,365 |
| 27. | South Creek | 44.9% | 10.9%(+34.0)#27 | 10.9%(+34.0)#1,369 |
| 28. | Bell Hill | 44.7% | 10.9%(+33.8)#28 | 10.9%(+33.8)#1,380 |
| 29. | Port Ludlow | 41.9% | 10.9%(+31.0)#29 | 10.9%(+31.0)#1,568 |
| 30. | Tonasket | 41.9% | 10.9%(+31.0)#30 | 10.9%(+31.0)#1,571 |
| 31. | Port Townsend | 41.5% | 10.9%(+30.6)#31 | 10.9%(+30.6)#1,608 |
| 32. | Clinton | 40.4% | 10.9%(+29.5)#32 | 10.9%(+29.5)#1,669 |
| 33. | Metaline | 40.0% | 10.9%(+29.1)#33 | 10.9%(+29.1)#1,708 |
| 34. | Ahtanum | 38.5% | 10.9%(+27.6)#34 | 10.9%(+27.6)#1,805 |
| 35. | Grand Coulee | 37.9% | 10.9%(+27.0)#35 | 10.9%(+27.0)#1,858 |
| 36. | Satsop | 35.9% | 10.9%(+25.0)#36 | 10.9%(+25.0)#2,024 |
| 37. | Cascade Valley | 35.8% | 10.9%(+24.9)#37 | 10.9%(+24.9)#2,026 |
| 38. | Lewisville | 35.8% | 10.9%(+24.9)#38 | 10.9%(+24.9)#2,028 |
| 39. | Fern Prairie | 34.8% | 10.9%(+23.9)#39 | 10.9%(+23.9)#2,128 |
| 40. | Grand Mound | 34.6% | 10.9%(+23.7)#40 | 10.9%(+23.7)#2,141 |
| 41. | Clover Creek | 34.5% | 10.9%(+23.6)#41 | 10.9%(+23.6)#2,150 |
| 42. | Enetai | 33.7% | 10.9%(+22.8)#42 | 10.9%(+22.8)#2,224 |
| 43. | West Pasco | 33.6% | 10.9%(+22.7)#43 | 10.9%(+22.7)#2,229 |
| 44. | Blaine | 33.4% | 10.9%(+22.5)#44 | 10.9%(+22.5)#2,238 |
| 45. | Prescott | 33.3% | 10.9%(+22.4)#45 | 10.9%(+22.4)#2,299 |
| 46. | Skokomish | 32.3% | 10.9%(+21.4)#46 | 10.9%(+21.4)#2,420 |
| 47. | Felida | 32.0% | 10.9%(+21.1)#47 | 10.9%(+21.1)#2,443 |
| 48. | Sudden Valley | 32.0% | 10.9%(+21.1)#48 | 10.9%(+21.1)#2,446 |
| 49. | Otis Orchards East Farms | 32.0% | 10.9%(+21.1)#49 | 10.9%(+21.1)#2,447 |
| 50. | Montesano | 31.7% | 10.9%(+20.8)#50 | 10.9%(+20.8)#2,482 |
| 51. | Waitsburg | 31.0% | 10.9%(+20.1)#51 | 10.9%(+20.1)#2,569 |
| 52. | Arlington Heights | 30.9% | 10.9%(+20.0)#52 | 10.9%(+20.0)#2,579 |
| 53. | Snohomish | 30.4% | 10.9%(+19.5)#53 | 10.9%(+19.5)#2,627 |
| 54. | Quilcene | 30.4% | 10.9%(+19.5)#54 | 10.9%(+19.5)#2,633 |
| 55. | Bethel | 29.5% | 10.9%(+18.6)#55 | 10.9%(+18.6)#2,747 |
| 56. | Mccleary | 29.5% | 10.9%(+18.6)#56 | 10.9%(+18.6)#2,752 |
| 57. | Granger | 29.2% | 10.9%(+18.3)#57 | 10.9%(+18.3)#2,788 |
| 58. | Lakeview | 28.6% | 10.9%(+17.7)#58 | 10.9%(+17.7)#2,860 |
| 59. | Fircrest | 28.3% | 10.9%(+17.4)#59 | 10.9%(+17.4)#2,916 |
| 60. | Shadow Lake | 28.1% | 10.9%(+17.2)#60 | 10.9%(+17.2)#2,952 |
| 61. | Tanglewilde | 27.4% | 10.9%(+16.5)#61 | 10.9%(+16.5)#3,045 |
| 62. | Nisqually Indian Community | 27.2% | 10.9%(+16.3)#62 | 10.9%(+16.3)#3,078 |
| 63. | Darrington | 26.9% | 10.9%(+16.0)#63 | 10.9%(+16.0)#3,137 |
| 64. | Castle Rock | 26.6% | 10.9%(+15.7)#64 | 10.9%(+15.7)#3,172 |
| 65. | Nespelem Community | 26.6% | 10.9%(+15.7)#65 | 10.9%(+15.7)#3,187 |
| 66. | North Bonneville | 26.1% | 10.9%(+15.2)#66 | 10.9%(+15.2)#3,288 |
| 67. | Easton | 25.7% | 10.9%(+14.8)#67 | 10.9%(+14.8)#3,368 |
| 68. | Normandy Park | 25.0% | 10.9%(+14.1)#68 | 10.9%(+14.1)#3,452 |
| 69. | Maplewood | 24.9% | 10.9%(+14.0)#69 | 10.9%(+14.0)#3,518 |
| 70. | South Prairie | 24.9% | 10.9%(+14.0)#70 | 10.9%(+14.0)#3,544 |
| 71. | Rock Island | 24.6% | 10.9%(+13.7)#71 | 10.9%(+13.7)#3,589 |
| 72. | Fox Island | 24.5% | 10.9%(+13.6)#72 | 10.9%(+13.6)#3,601 |
| 73. | Chelan | 24.3% | 10.9%(+13.4)#73 | 10.9%(+13.4)#3,642 |
| 74. | Malden | 24.2% | 10.9%(+13.3)#74 | 10.9%(+13.3)#3,672 |
| 75. | Mattawa | 23.7% | 10.9%(+12.8)#75 | 10.9%(+12.8)#3,767 |
| 76. | Fife Heights | 23.7% | 10.9%(+12.8)#76 | 10.9%(+12.8)#3,771 |
| 77. | Sprague | 23.5% | 10.9%(+12.6)#77 | 10.9%(+12.6)#3,820 |
| 78. | Town And Country | 23.4% | 10.9%(+12.5)#78 | 10.9%(+12.5)#3,832 |
| 79. | Mcmillin | 23.3% | 10.9%(+12.4)#79 | 10.9%(+12.4)#3,859 |
| 80. | Picnic Point | 23.2% | 10.9%(+12.3)#80 | 10.9%(+12.3)#3,871 |
| 81. | Oakville | 23.2% | 10.9%(+12.3)#81 | 10.9%(+12.3)#3,886 |
| 82. | Winlock | 23.1% | 10.9%(+12.2)#82 | 10.9%(+12.2)#3,906 |
| 83. | Mead | 23.0% | 10.9%(+12.1)#83 | 10.9%(+12.1)#3,915 |
| 84. | Lakeland North | 22.9% | 10.9%(+12.0)#84 | 10.9%(+12.0)#3,956 |
| 85. | Union Gap | 22.9% | 10.9%(+12.0)#85 | 10.9%(+12.0)#3,959 |
| 86. | Meadow Glade | 22.8% | 10.9%(+11.9)#86 | 10.9%(+11.9)#3,984 |
| 87. | Chewelah | 22.6% | 10.9%(+11.7)#87 | 10.9%(+11.7)#4,023 |
| 88. | Peaceful Valley | 22.5% | 10.9%(+11.6)#88 | 10.9%(+11.6)#4,045 |
| 89. | Summit | 22.3% | 10.9%(+11.4)#89 | 10.9%(+11.4)#4,088 |
| 90. | Medical Lake | 22.3% | 10.9%(+11.4)#90 | 10.9%(+11.4)#4,096 |
| 91. | South Wenatchee | 22.2% | 10.9%(+11.3)#91 | 10.9%(+11.3)#4,130 |
| 92. | Rosedale | 22.1% | 10.9%(+11.2)#92 | 10.9%(+11.2)#4,182 |
| 93. | Morton | 21.8% | 10.9%(+10.9)#93 | 10.9%(+10.9)#4,232 |
| 94. | Ridgefield | 21.7% | 10.9%(+10.8)#94 | 10.9%(+10.8)#4,246 |
| 95. | Woodland | 21.4% | 10.9%(+10.5)#95 | 10.9%(+10.5)#4,326 |
| 96. | Algona | 21.2% | 10.9%(+10.3)#96 | 10.9%(+10.3)#4,387 |
| 97. | Fairwood Cdp King County | 21.0% | 10.9%(+10.1)#97 | 10.9%(+10.1)#4,427 |
| 98. | Bucoda | 21.0% | 10.9%(+10.1)#98 | 10.9%(+10.1)#4,450 |
| 99. | Sequim | 20.9% | 10.9%(+10.00)#99 | 10.9%(+10.00)#4,465 |
| 100. | Toledo | 20.8% | 10.9%(+9.90)#100 | 10.9%(+9.90)#4,514 |
Common Questions
What are the Top 10 Cities with the Highest Unemployment Rate Amomg Youth Under the Age of 25 in Washington?
Top 10 Cities with the Highest Unemployment Rate Amomg Youth Under the Age of 25 in Washington are:
#1
100.0%
#2
100.0%
#3
100.0%
#4
99.9%
#5
99.9%
#6
80.0%
#7
74.4%
#8
71.7%
#9
71.5%
#10
63.5%
What city has the Highest Unemployment Rate Amomg Youth Under the Age of 25 in Washington?
Conconully has the Highest Unemployment Rate Amomg Youth Under the Age of 25 in Washington with 100.0%.
What is the Unemployment Rate Amomg Youth Under the Age of 25 in the State of Washington?
Unemployment Rate Amomg Youth Under the Age of 25 in Washington is 10.9%.
What is the Unemployment Rate Amomg Youth Under the Age of 25 in the United States?
Unemployment Rate Amomg Youth Under the Age of 25 in the United States is 10.9%.