Three Rocks, CA Map & Demographics
Three Rocks Map
Three Rocks Overview
$18,513
PER CAPITA INCOME
0.38
INEQUALITY / GINI INDEX
181
TOTAL POPULATION
80
MALE POPULATION
101
FEMALE POPULATION
79.21
MALES / 100 FEMALES
126.25
FEMALES / 100 MALES
56.0
MEDIAN AGE
3.6
AVG FAMILY SIZE
2.9
AVG HOUSEHOLD SIZE
76
LABOR FORCE [ PEOPLE ]
44.7%
PERCENT IN LABOR FORCE
7.9%
UNEMPLOYMENT RATE
Income in Three Rocks
Income Overview in Three Rocks
| Characteristic | Number | Measure |
| Per Capita Income | 181 | $18,513 |
| Median Family Income | 45 | $0 |
| Mean Family Income | 45 | $55,087 |
| Median Household Income | 63 | $0 |
| Mean Household Income | 63 | $49,730 |
| Income Deficit | 45 | $0 |
| Wage / Income Gap (%) | 181 | 0.00% |
| Wage / Income Gap ($) | 181 | 100.00¢ per $1 |
| Gini / Inequality Index | 181 | 0.38 |
Earnings by Sex in Three Rocks
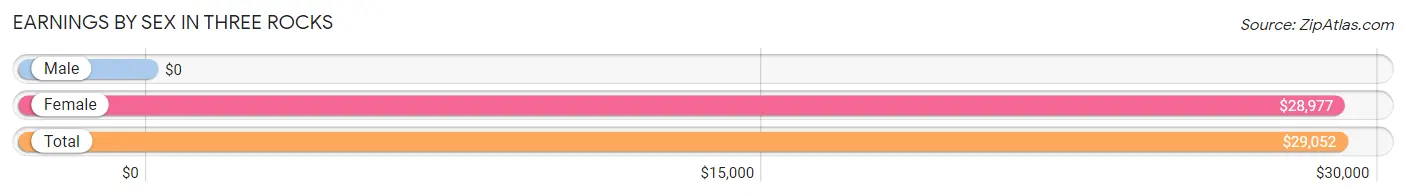
| Sex | Number | Average Earnings |
| Male | 23 (32.9%) | $0 |
| Female | 47 (67.1%) | $28,977 |
| Total | 70 (100.0%) | $29,052 |
Earnings by Sex by Income Bracket in Three Rocks
The most common earnings brackets in Three Rocks are $25,000 to $29,999 for men (18 | 78.3%) and $25,000 to $29,999 for women (28 | 59.6%).
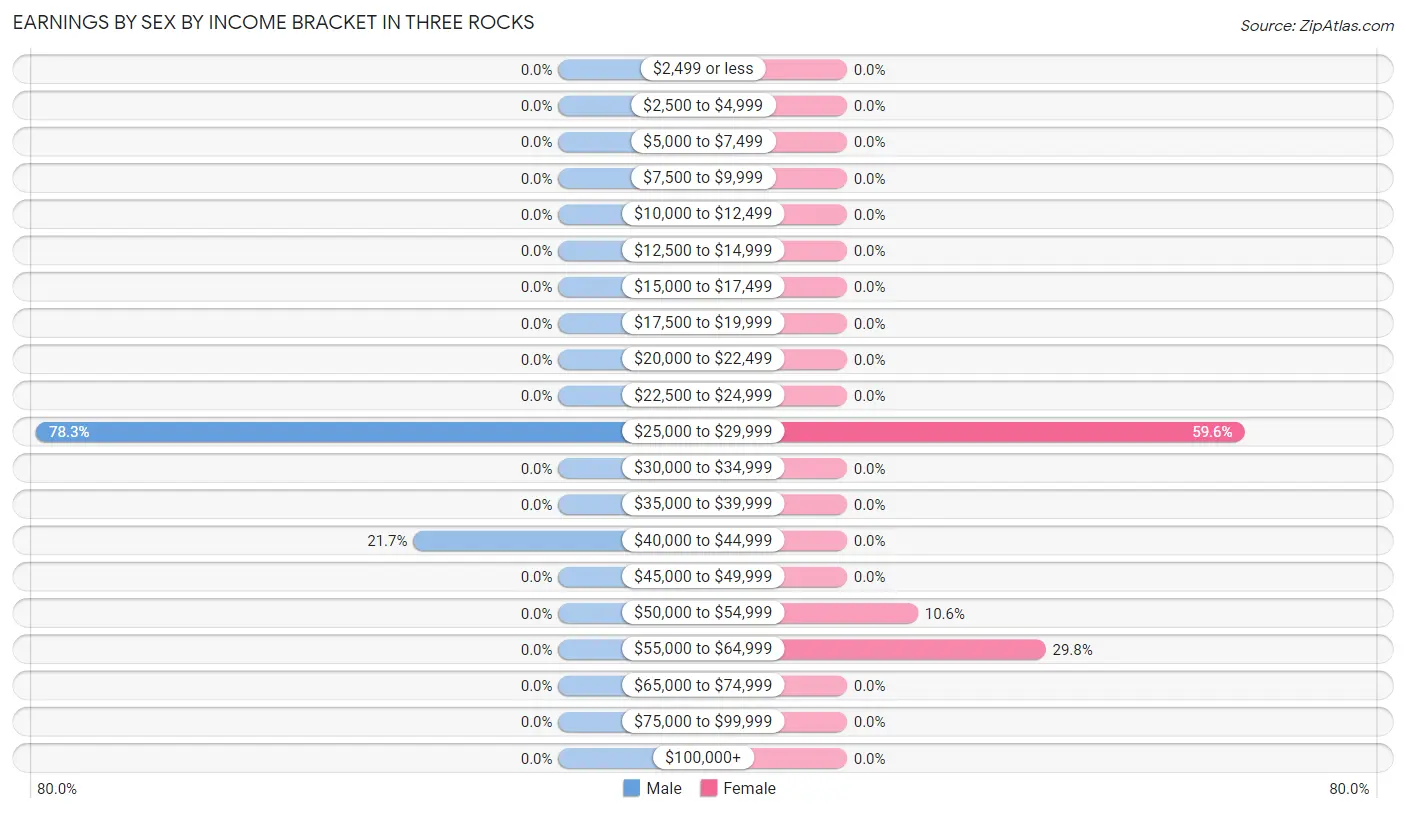
| Income | Male | Female |
| $2,499 or less | 0 (0.0%) | 0 (0.0%) |
| $2,500 to $4,999 | 0 (0.0%) | 0 (0.0%) |
| $5,000 to $7,499 | 0 (0.0%) | 0 (0.0%) |
| $7,500 to $9,999 | 0 (0.0%) | 0 (0.0%) |
| $10,000 to $12,499 | 0 (0.0%) | 0 (0.0%) |
| $12,500 to $14,999 | 0 (0.0%) | 0 (0.0%) |
| $15,000 to $17,499 | 0 (0.0%) | 0 (0.0%) |
| $17,500 to $19,999 | 0 (0.0%) | 0 (0.0%) |
| $20,000 to $22,499 | 0 (0.0%) | 0 (0.0%) |
| $22,500 to $24,999 | 0 (0.0%) | 0 (0.0%) |
| $25,000 to $29,999 | 18 (78.3%) | 28 (59.6%) |
| $30,000 to $34,999 | 0 (0.0%) | 0 (0.0%) |
| $35,000 to $39,999 | 0 (0.0%) | 0 (0.0%) |
| $40,000 to $44,999 | 5 (21.7%) | 0 (0.0%) |
| $45,000 to $49,999 | 0 (0.0%) | 0 (0.0%) |
| $50,000 to $54,999 | 0 (0.0%) | 5 (10.6%) |
| $55,000 to $64,999 | 0 (0.0%) | 14 (29.8%) |
| $65,000 to $74,999 | 0 (0.0%) | 0 (0.0%) |
| $75,000 to $99,999 | 0 (0.0%) | 0 (0.0%) |
| $100,000+ | 0 (0.0%) | 0 (0.0%) |
| Total | 23 (100.0%) | 47 (100.0%) |
Earnings by Sex by Educational Attainment in Three Rocks
| Educational Attainment | Male Income | Female Income |
| Less than High School | - | - |
| High School Diploma | - | - |
| College or Associate's Degree | - | - |
| Bachelor's Degree | - | - |
| Graduate Degree | - | - |
| Total | - | - |
Family Income in Three Rocks
Family Income Brackets in Three Rocks
According to the Three Rocks family income data, there are 19 families falling into the $75,000 to $99,999 income range, which is the most common income bracket and makes up 42.2% of all families.
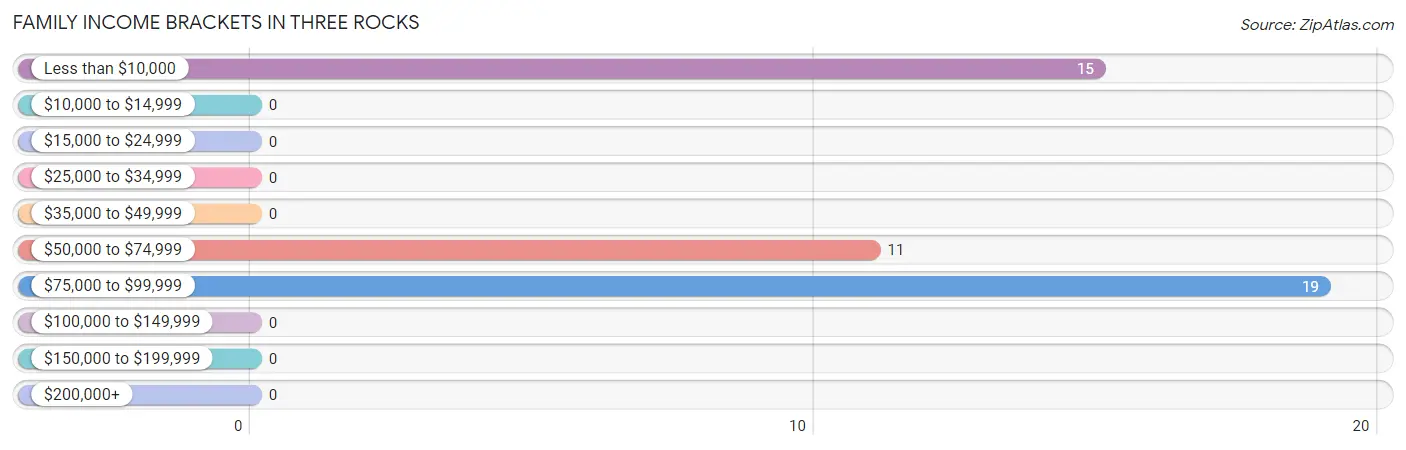
| Income Bracket | # Families | % Families |
| Less than $10,000 | 15 | 33.3% |
| $10,000 to $14,999 | 0 | 0.0% |
| $15,000 to $24,999 | 0 | 0.0% |
| $25,000 to $34,999 | 0 | 0.0% |
| $35,000 to $49,999 | 0 | 0.0% |
| $50,000 to $74,999 | 11 | 24.4% |
| $75,000 to $99,999 | 19 | 42.2% |
| $100,000 to $149,999 | 0 | 0.0% |
| $150,000 to $199,999 | 0 | 0.0% |
| $200,000+ | 0 | 0.0% |
Family Income by Famaliy Size in Three Rocks
| Income Bracket | # Families | Median Income |
| 2-Person Families | 15 (33.3%) | $0 |
| 3-Person Families | 25 (55.6%) | $0 |
| 4-Person Families | 0 (0.0%) | $0 |
| 5-Person Families | 0 (0.0%) | $0 |
| 6-Person Families | 5 (11.1%) | $0 |
| 7+ Person Families | 0 (0.0%) | $0 |
| Total | 45 (100.0%) | $0 |
Family Income by Number of Earners in Three Rocks
| Number of Earners | # Families | Median Income |
| No Earners | 15 (33.3%) | $0 |
| 1 Earner | 11 (24.4%) | $0 |
| 2 Earners | 19 (42.2%) | $0 |
| 3+ Earners | 0 (0.0%) | $0 |
| Total | 45 (100.0%) | $0 |
Household Income in Three Rocks
Household Income Brackets in Three Rocks
With 19 households falling in the category, the $75,000 to $99,999 income range is the most frequent in Three Rocks, accounting for 30.2% of all households.
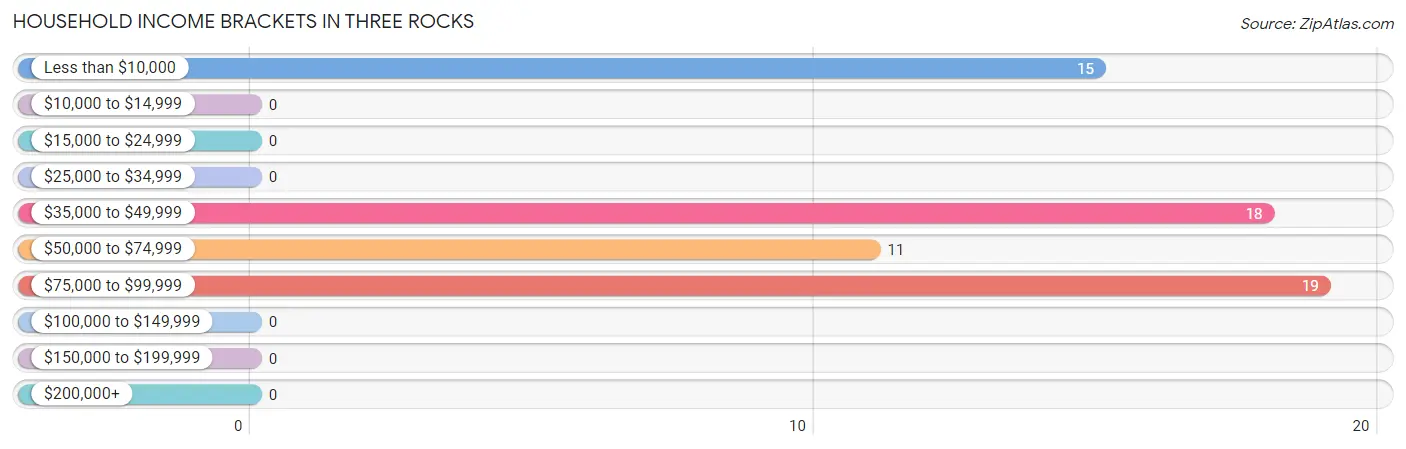
| Income Bracket | # Households | % Households |
| Less than $10,000 | 15 | 23.8% |
| $10,000 to $14,999 | 0 | 0.0% |
| $15,000 to $24,999 | 0 | 0.0% |
| $25,000 to $34,999 | 0 | 0.0% |
| $35,000 to $49,999 | 18 | 28.6% |
| $50,000 to $74,999 | 11 | 17.5% |
| $75,000 to $99,999 | 19 | 30.2% |
| $100,000 to $149,999 | 0 | 0.0% |
| $150,000 to $199,999 | 0 | 0.0% |
| $200,000+ | 0 | 0.0% |
Household Income by Householder Age in Three Rocks
The median household income in Three Rocks is $0, with the highest median household income of $58,295 found in the 45 to 64 years age bracket for the primary householder. A total of 43 households (68.2%) fall into this category.
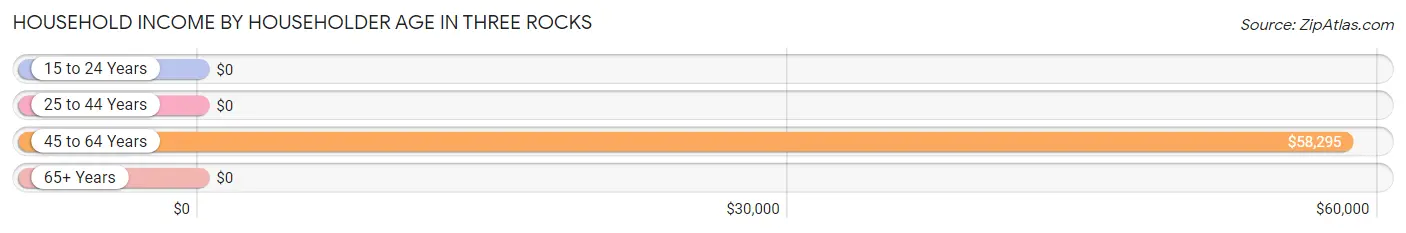
| Income Bracket | # Households | Median Income |
| 15 to 24 Years | 0 (0.0%) | $0 |
| 25 to 44 Years | 5 (7.9%) | $0 |
| 45 to 64 Years | 43 (68.2%) | $58,295 |
| 65+ Years | 15 (23.8%) | $0 |
| Total | 63 (100.0%) | $0 |
Poverty in Three Rocks
Income Below Poverty by Sex and Age in Three Rocks
With 23.7% poverty level for males and 14.8% for females among the residents of Three Rocks, 65 to 74 year old males and 75 year old and over females are the most vulnerable to poverty, with 19 males (100.0%) and 15 females (35.7%) in their respective age groups living below the poverty level.
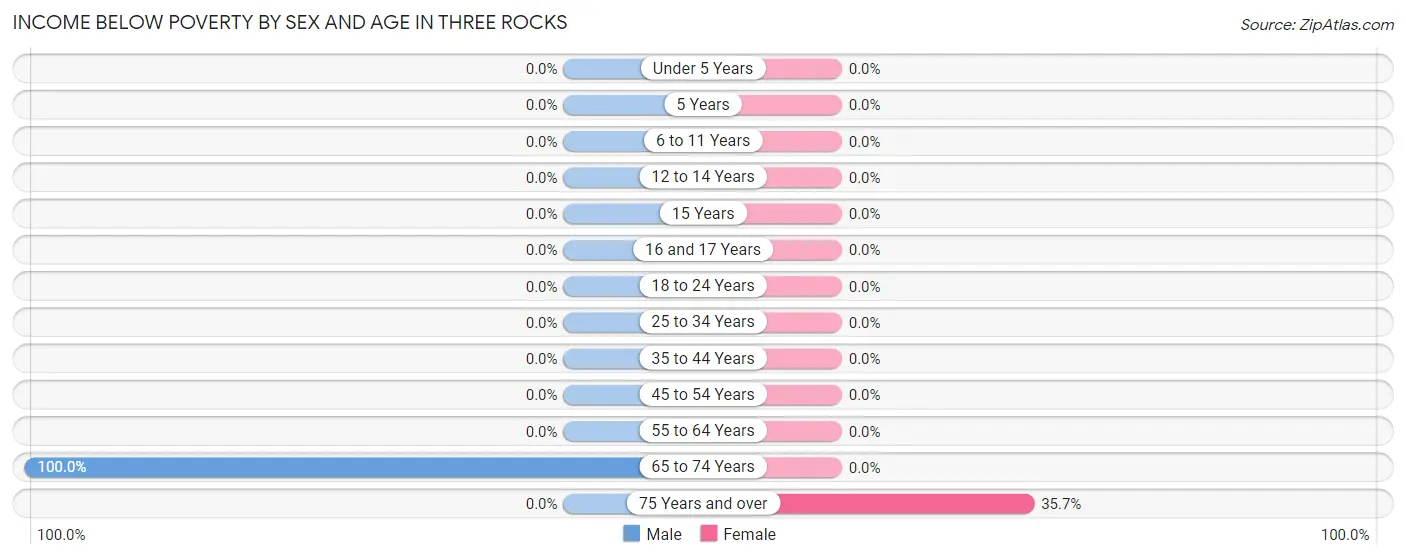
| Age Bracket | Male | Female |
| Under 5 Years | 0 (0.0%) | 0 (0.0%) |
| 5 Years | 0 (0.0%) | 0 (0.0%) |
| 6 to 11 Years | 0 (0.0%) | 0 (0.0%) |
| 12 to 14 Years | 0 (0.0%) | 0 (0.0%) |
| 15 Years | 0 (0.0%) | 0 (0.0%) |
| 16 and 17 Years | 0 (0.0%) | 0 (0.0%) |
| 18 to 24 Years | 0 (0.0%) | 0 (0.0%) |
| 25 to 34 Years | 0 (0.0%) | 0 (0.0%) |
| 35 to 44 Years | 0 (0.0%) | 0 (0.0%) |
| 45 to 54 Years | 0 (0.0%) | 0 (0.0%) |
| 55 to 64 Years | 0 (0.0%) | 0 (0.0%) |
| 65 to 74 Years | 19 (100.0%) | 0 (0.0%) |
| 75 Years and over | 0 (0.0%) | 15 (35.7%) |
| Total | 19 (23.7%) | 15 (14.8%) |
Income Above Poverty by Sex and Age in Three Rocks
According to the poverty statistics in Three Rocks, males aged 6 to 11 years and females aged 16 and 17 years are the age groups that are most secure financially, with 100.0% of males and 100.0% of females in these age groups living above the poverty line.
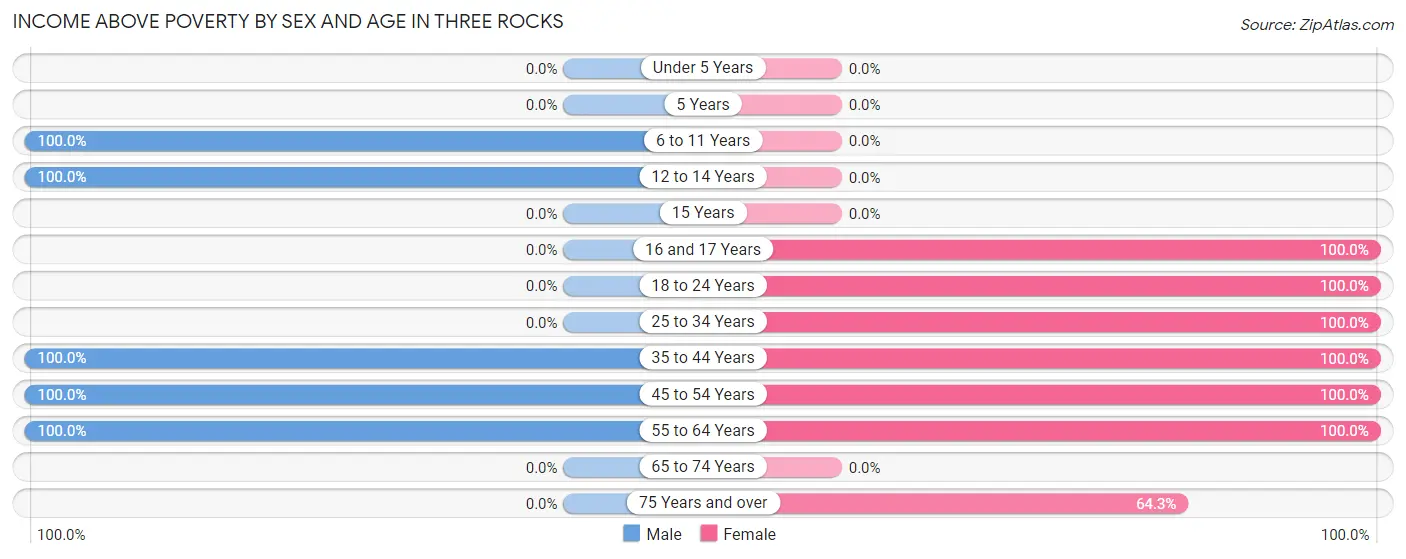
| Age Bracket | Male | Female |
| Under 5 Years | 0 (0.0%) | 0 (0.0%) |
| 5 Years | 0 (0.0%) | 0 (0.0%) |
| 6 to 11 Years | 5 (100.0%) | 0 (0.0%) |
| 12 to 14 Years | 6 (100.0%) | 0 (0.0%) |
| 15 Years | 0 (0.0%) | 0 (0.0%) |
| 16 and 17 Years | 0 (0.0%) | 6 (100.0%) |
| 18 to 24 Years | 0 (0.0%) | 6 (100.0%) |
| 25 to 34 Years | 0 (0.0%) | 17 (100.0%) |
| 35 to 44 Years | 5 (100.0%) | 5 (100.0%) |
| 45 to 54 Years | 16 (100.0%) | 14 (100.0%) |
| 55 to 64 Years | 29 (100.0%) | 11 (100.0%) |
| 65 to 74 Years | 0 (0.0%) | 0 (0.0%) |
| 75 Years and over | 0 (0.0%) | 27 (64.3%) |
| Total | 61 (76.2%) | 86 (85.2%) |
Income Below Poverty Among Married-Couple Families in Three Rocks
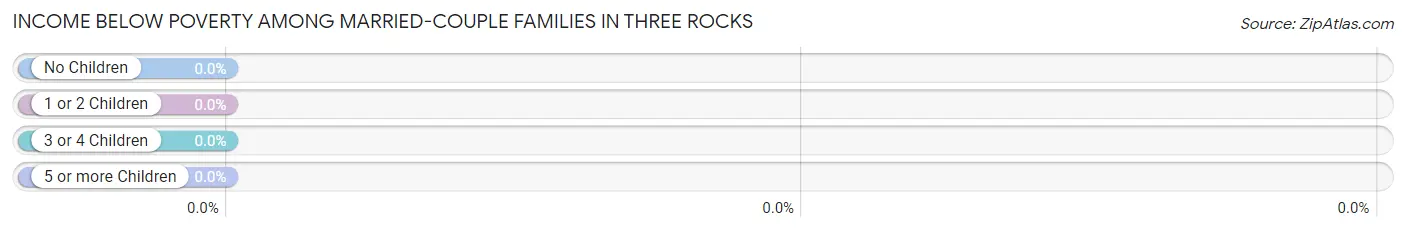
| Children | Above Poverty | Below Poverty |
| No Children | 11 (100.0%) | 0 (0.0%) |
| 1 or 2 Children | 0 (0.0%) | 0 (0.0%) |
| 3 or 4 Children | 5 (100.0%) | 0 (0.0%) |
| 5 or more Children | 0 (0.0%) | 0 (0.0%) |
| Total | 16 (100.0%) | 0 (0.0%) |
Income Below Poverty Among Single-Parent Households in Three Rocks
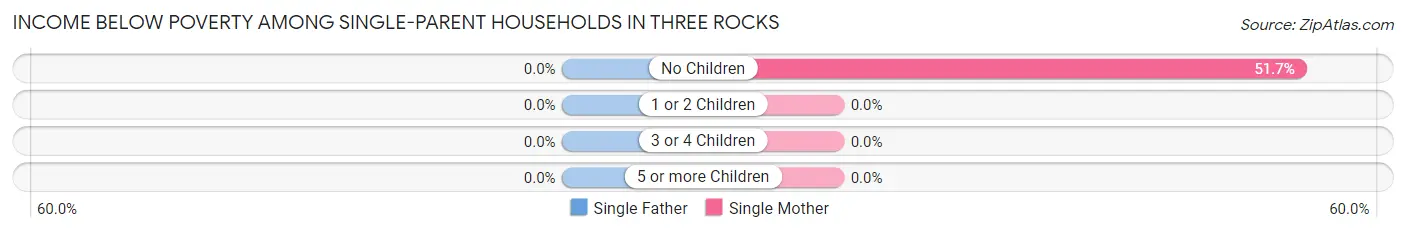
| Children | Single Father | Single Mother |
| No Children | 0 (0.0%) | 15 (51.7%) |
| 1 or 2 Children | 0 (0.0%) | 0 (0.0%) |
| 3 or 4 Children | 0 (0.0%) | 0 (0.0%) |
| 5 or more Children | 0 (0.0%) | 0 (0.0%) |
| Total | 0 (0.0%) | 15 (51.7%) |
Income Below Poverty Among Married-Couple vs Single-Parent Households in Three Rocks
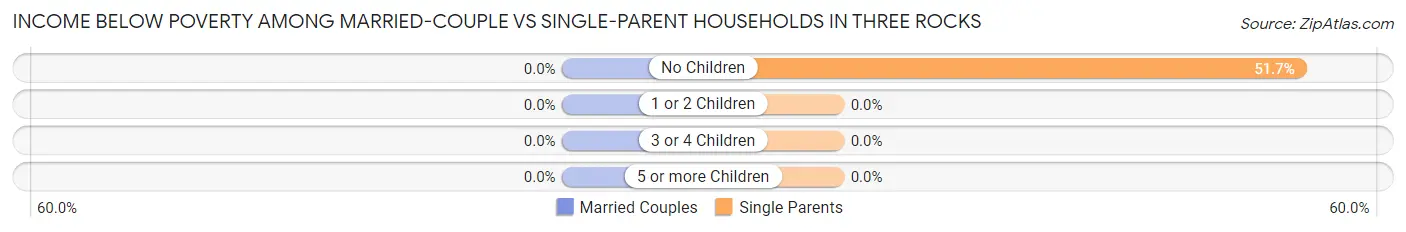
| Children | Married-Couple Families | Single-Parent Households |
| No Children | 0 (0.0%) | 15 (51.7%) |
| 1 or 2 Children | 0 (0.0%) | 0 (0.0%) |
| 3 or 4 Children | 0 (0.0%) | 0 (0.0%) |
| 5 or more Children | 0 (0.0%) | 0 (0.0%) |
| Total | 0 (0.0%) | 15 (51.7%) |
Race in Three Rocks
The most populous races in Three Rocks are Hispanic or Latino (181 | 100.0%), Some other Race (92 | 50.8%), and Two or more Races (48 | 26.5%).
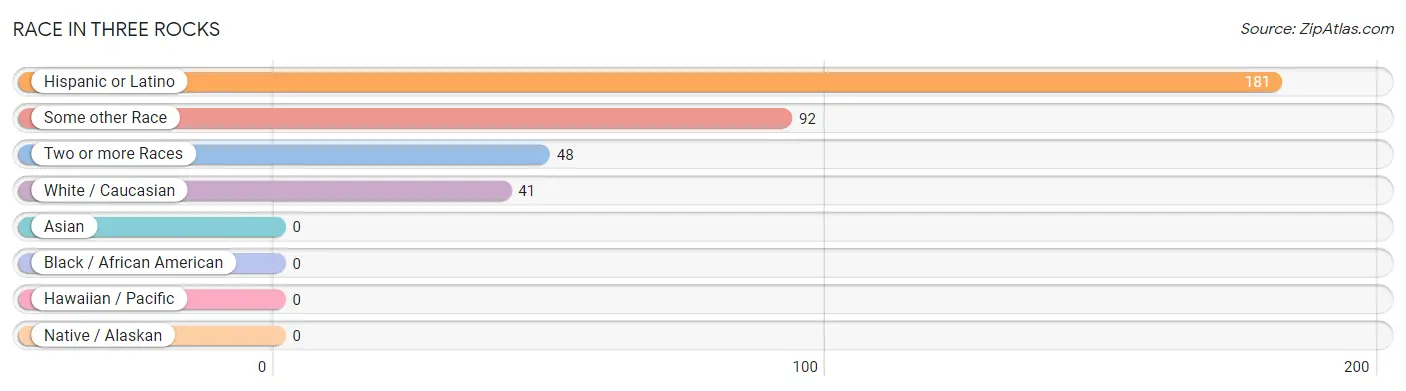
| Race | # Population | % Population |
| Asian | 0 | 0.0% |
| Black / African American | 0 | 0.0% |
| Hawaiian / Pacific | 0 | 0.0% |
| Hispanic or Latino | 181 | 100.0% |
| Native / Alaskan | 0 | 0.0% |
| White / Caucasian | 41 | 22.7% |
| Two or more Races | 48 | 26.5% |
| Some other Race | 92 | 50.8% |
| Total | 181 | 100.0% |
Ancestry in Three Rocks
The most populous ancestries reported in Three Rocks are , and Mexican (181 | 100.0%), together accounting for 100.0% of all Three Rocks residents.

| Ancestry | # Population | % Population |
| Mexican | 181 | 100.0% | View All 1 Rows |
Immigrants in Three Rocks
The most numerous immigrant groups reported in Three Rocks came from Central America (108 | 59.7%), Latin America (108 | 59.7%), Mexico (103 | 56.9%), and El Salvador (5 | 2.8%), together accounting for 179.0% of all Three Rocks residents.
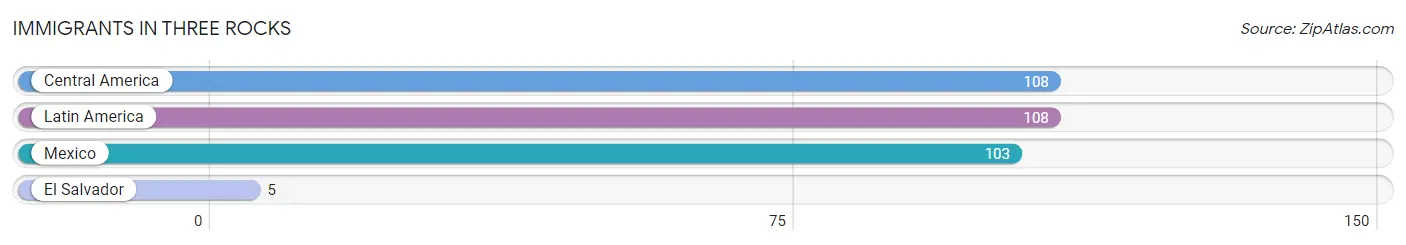
| Immigration Origin | # Population | % Population |
| Central America | 108 | 59.7% |
| El Salvador | 5 | 2.8% |
| Latin America | 108 | 59.7% |
| Mexico | 103 | 56.9% | View All 4 Rows |
Sex and Age in Three Rocks
Sex and Age in Three Rocks
The most populous age groups in Three Rocks are 65 to 69 Years (19 | 23.7%) for men and 80 to 84 Years (27 | 26.7%) for women.
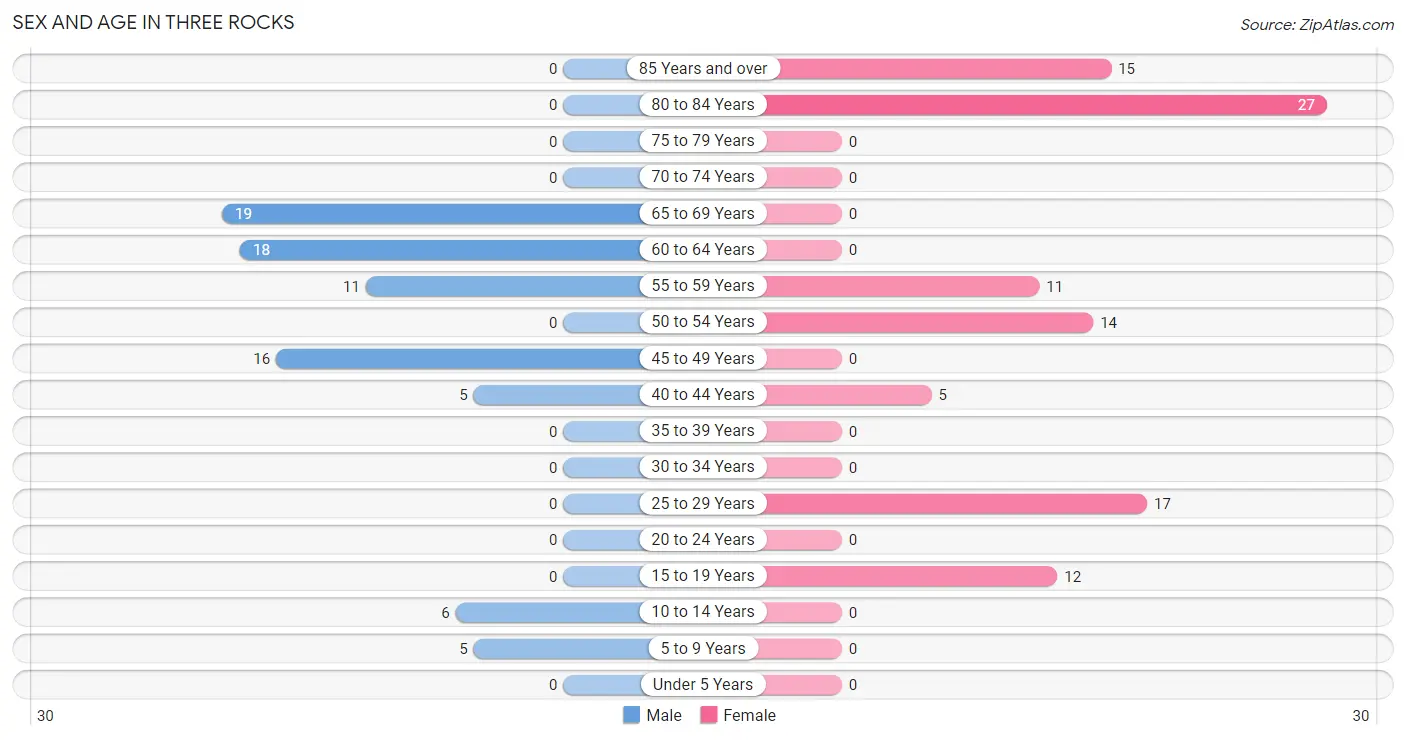
| Age Bracket | Male | Female |
| Under 5 Years | 0 (0.0%) | 0 (0.0%) |
| 5 to 9 Years | 5 (6.2%) | 0 (0.0%) |
| 10 to 14 Years | 6 (7.5%) | 0 (0.0%) |
| 15 to 19 Years | 0 (0.0%) | 12 (11.9%) |
| 20 to 24 Years | 0 (0.0%) | 0 (0.0%) |
| 25 to 29 Years | 0 (0.0%) | 17 (16.8%) |
| 30 to 34 Years | 0 (0.0%) | 0 (0.0%) |
| 35 to 39 Years | 0 (0.0%) | 0 (0.0%) |
| 40 to 44 Years | 5 (6.2%) | 5 (5.0%) |
| 45 to 49 Years | 16 (20.0%) | 0 (0.0%) |
| 50 to 54 Years | 0 (0.0%) | 14 (13.9%) |
| 55 to 59 Years | 11 (13.8%) | 11 (10.9%) |
| 60 to 64 Years | 18 (22.5%) | 0 (0.0%) |
| 65 to 69 Years | 19 (23.7%) | 0 (0.0%) |
| 70 to 74 Years | 0 (0.0%) | 0 (0.0%) |
| 75 to 79 Years | 0 (0.0%) | 0 (0.0%) |
| 80 to 84 Years | 0 (0.0%) | 27 (26.7%) |
| 85 Years and over | 0 (0.0%) | 15 (14.8%) |
| Total | 80 (100.0%) | 101 (100.0%) |
Families and Households in Three Rocks
Median Family Size in Three Rocks
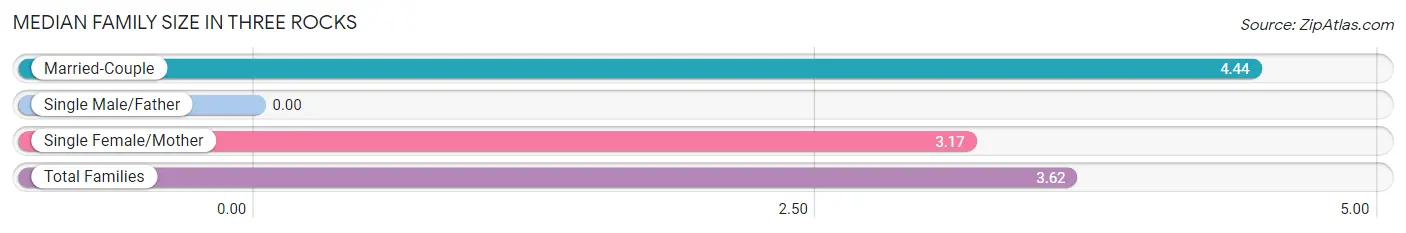
| Family Type | # Families | Family Size |
| Married-Couple | 16 (35.6%) | 4.44 |
| Single Male/Father | 0 (0.0%) | - |
| Single Female/Mother | 29 (64.4%) | 3.17 |
| Total Families | 45 (100.0%) | 3.62 |
Median Household Size in Three Rocks
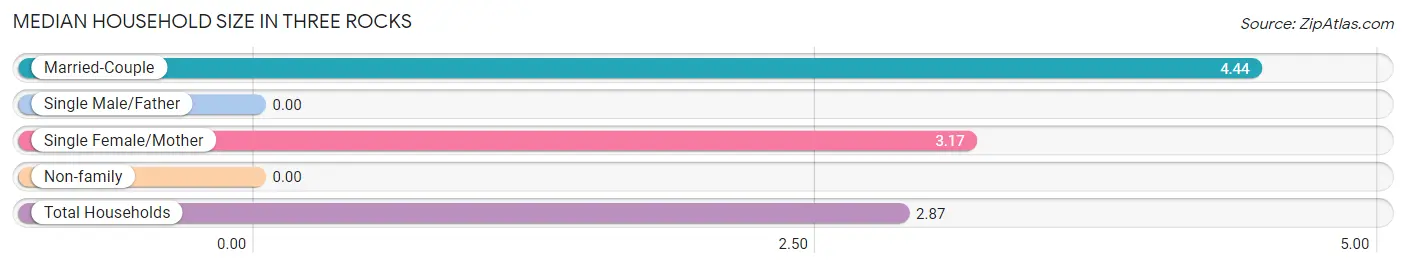
| Household Type | # Households | Household Size |
| Married-Couple | 16 (25.4%) | 4.44 |
| Single Male/Father | 0 (0.0%) | - |
| Single Female/Mother | 29 (46.0%) | 3.17 |
| Non-family | 18 (28.6%) | - |
| Total Households | 63 (100.0%) | 2.87 |
Household Size by Marriage Status in Three Rocks
Out of a total of 63 households in Three Rocks, 45 (71.4%) are family households, while 18 (28.6%) are nonfamily households. The most numerous type of family households are 3-person households, comprising 25, and the most common type of nonfamily households are 1-person households, comprising 18.
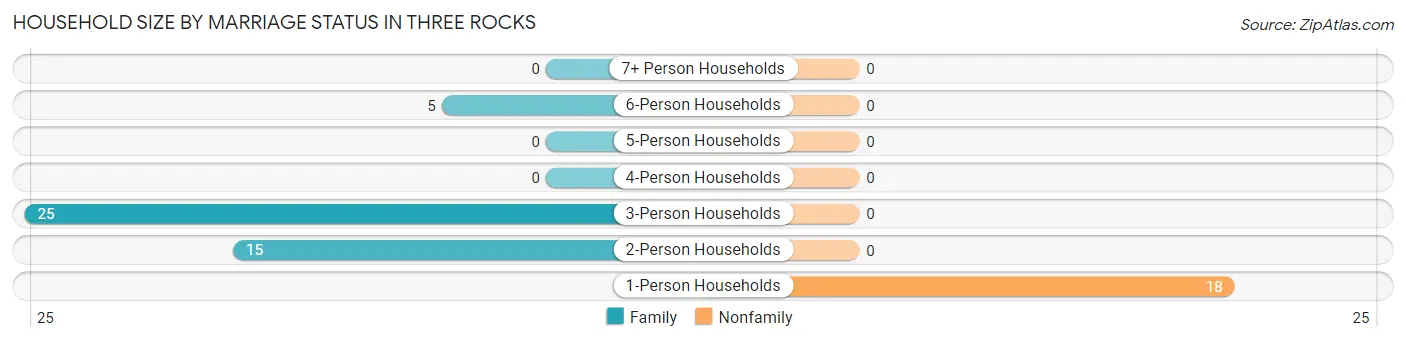
| Household Size | Family Households | Nonfamily Households |
| 1-Person Households | - | 18 (28.6%) |
| 2-Person Households | 15 (23.8%) | 0 (0.0%) |
| 3-Person Households | 25 (39.7%) | 0 (0.0%) |
| 4-Person Households | 0 (0.0%) | 0 (0.0%) |
| 5-Person Households | 0 (0.0%) | 0 (0.0%) |
| 6-Person Households | 5 (7.9%) | 0 (0.0%) |
| 7+ Person Households | 0 (0.0%) | 0 (0.0%) |
| Total | 45 (71.4%) | 18 (28.6%) |
Female Fertility in Three Rocks
Fertility by Age in Three Rocks
| Age Bracket | Women with Births | Births / 1,000 Women |
| 15 to 19 years | 0 (0.0%) | 0.0 |
| 20 to 34 years | 0 (0.0%) | 0.0 |
| 35 to 50 years | 0 (0.0%) | 0.0 |
| Total | 0 (0.0%) | 0.0 |
Fertility by Age by Marriage Status in Three Rocks
| Age Bracket | Married | Unmarried |
| 15 to 19 years | 0 (0.0%) | 0 (0.0%) |
| 20 to 34 years | 0 (0.0%) | 0 (0.0%) |
| 35 to 50 years | 0 (0.0%) | 0 (0.0%) |
| Total | 0 (0.0%) | 0 (0.0%) |
Fertility by Education in Three Rocks
| Educational Attainment | Women with Births | Births / 1,000 Women |
| Less than High School | 0 (0.0%) | 0.0 |
| High School Diploma | 0 (0.0%) | 0.0 |
| College or Associate's Degree | 0 (0.0%) | 0.0 |
| Bachelor's Degree | 0 (0.0%) | 0.0 |
| Graduate Degree | 0 (0.0%) | 0.0 |
| Total | 0 (0.0%) | 0.0 |
Fertility by Education by Marriage Status in Three Rocks
| Educational Attainment | Married | Unmarried |
| Less than High School | 0 (0.0%) | 0 (0.0%) |
| High School Diploma | 0 (0.0%) | 0 (0.0%) |
| College or Associate's Degree | 0 (0.0%) | 0 (0.0%) |
| Bachelor's Degree | 0 (0.0%) | 0 (0.0%) |
| Graduate Degree | 0 (0.0%) | 0 (0.0%) |
| Total | 0 (0.0%) | 0 (0.0%) |
Employment Characteristics in Three Rocks
Employment by Class of Employer in Three Rocks
Among the 70 employed individuals in Three Rocks, , and private company employees (70 | 100.0%) make up the most common classes of employment.
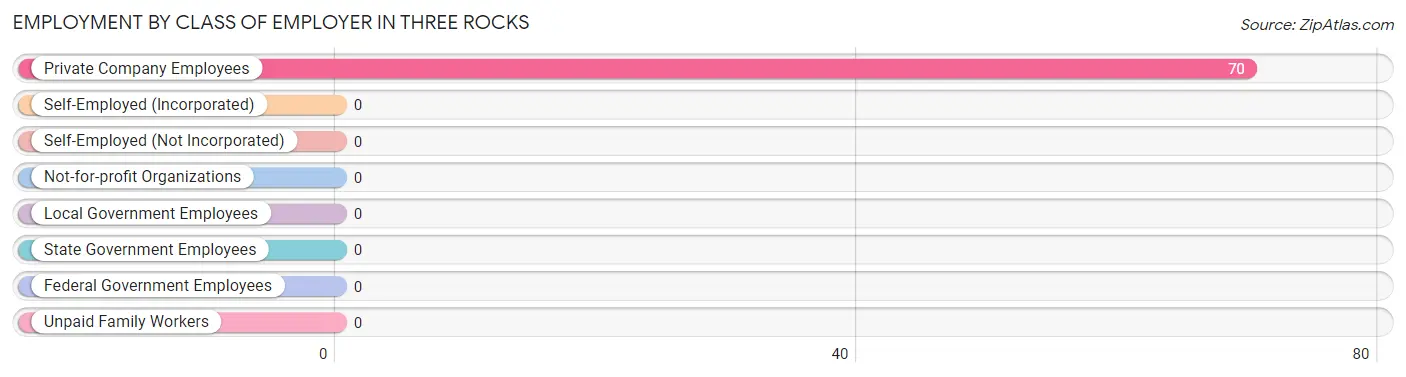
| Employer Class | # Employees | % Employees |
| Private Company Employees | 70 | 100.0% |
| Self-Employed (Incorporated) | 0 | 0.0% |
| Self-Employed (Not Incorporated) | 0 | 0.0% |
| Not-for-profit Organizations | 0 | 0.0% |
| Local Government Employees | 0 | 0.0% |
| State Government Employees | 0 | 0.0% |
| Federal Government Employees | 0 | 0.0% |
| Unpaid Family Workers | 0 | 0.0% |
| Total | 70 | 100.0% |
Employment Status by Age in Three Rocks
According to the labor force statistics for Three Rocks, out of the total population over 16 years of age (170), 44.7% or 76 individuals are in the labor force, with 7.9% or 6 of them unemployed. The age group with the highest labor force participation rate is 25 to 29 years, with 100.0% or 17 individuals in the labor force. Within the labor force, the 16 to 19 years age range has the highest percentage of unemployed individuals, with 100.0% or 6 of them being unemployed.
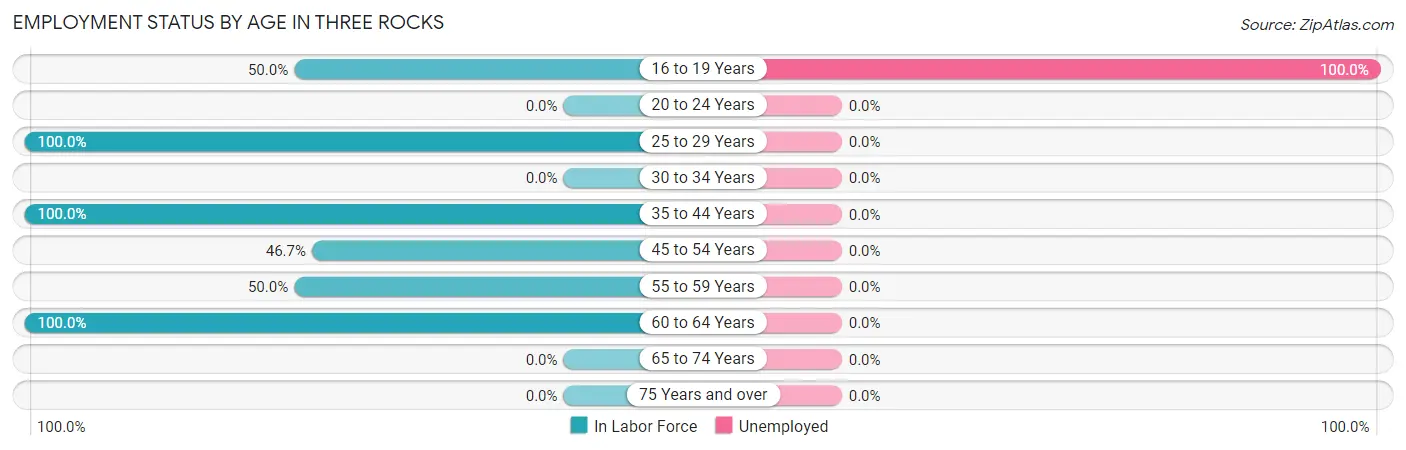
| Age Bracket | In Labor Force | Unemployed |
| 16 to 19 Years | 6 (50.0%) | 6 (100.0%) |
| 20 to 24 Years | 0 (0.0%) | 0 (0.0%) |
| 25 to 29 Years | 17 (100.0%) | 0 (0.0%) |
| 30 to 34 Years | 0 (0.0%) | 0 (0.0%) |
| 35 to 44 Years | 10 (100.0%) | 0 (0.0%) |
| 45 to 54 Years | 14 (46.7%) | 0 (0.0%) |
| 55 to 59 Years | 11 (50.0%) | 0 (0.0%) |
| 60 to 64 Years | 18 (100.0%) | 0 (0.0%) |
| 65 to 74 Years | 0 (0.0%) | 0 (0.0%) |
| 75 Years and over | 0 (0.0%) | 0 (0.0%) |
| Total | 76 (44.7%) | 6 (7.9%) |
Employment Status by Educational Attainment in Three Rocks
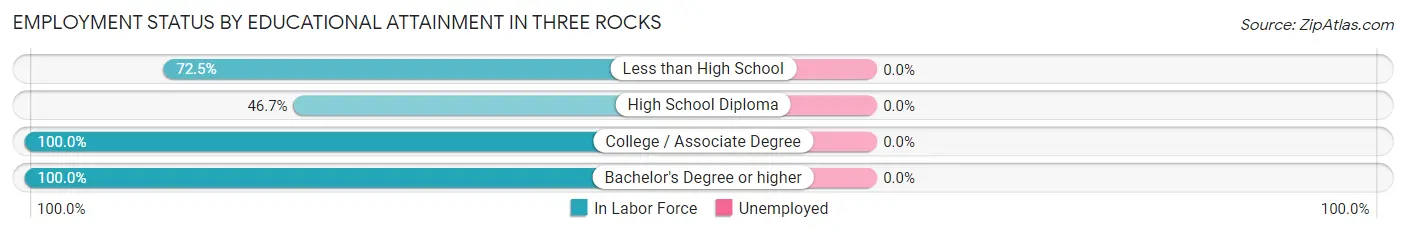
| Educational Attainment | In Labor Force | Unemployed |
| Less than High School | 29 (72.5%) | 0 (0.0%) |
| High School Diploma | 14 (46.7%) | 0 (0.0%) |
| College / Associate Degree | 22 (100.0%) | 0 (0.0%) |
| Bachelor's Degree or higher | 5 (100.0%) | 0 (0.0%) |
| Total | 70 (72.2%) | 0 (0.0%) |
Employment Occupations by Sex in Three Rocks
Management, Business, Science and Arts Occupations
The most common Management, Business, Science and Arts occupations in Three Rocks are , and Health Diagnosing & Treating (5 | 7.1%).
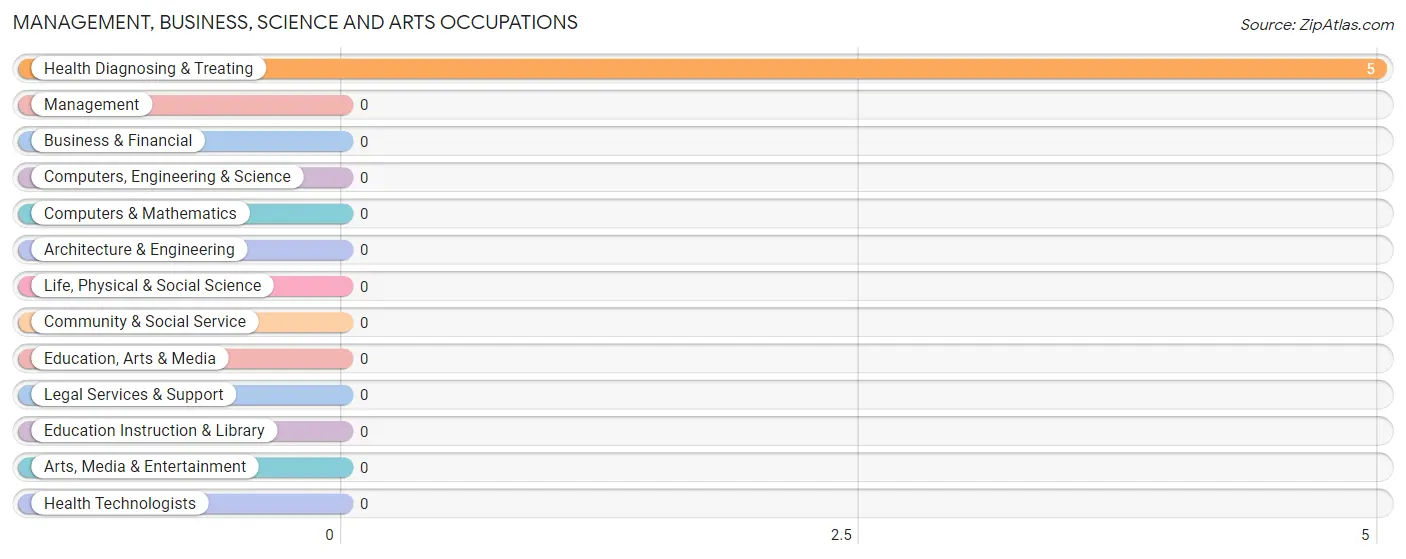
Management, Business, Science and Arts Occupations by Sex
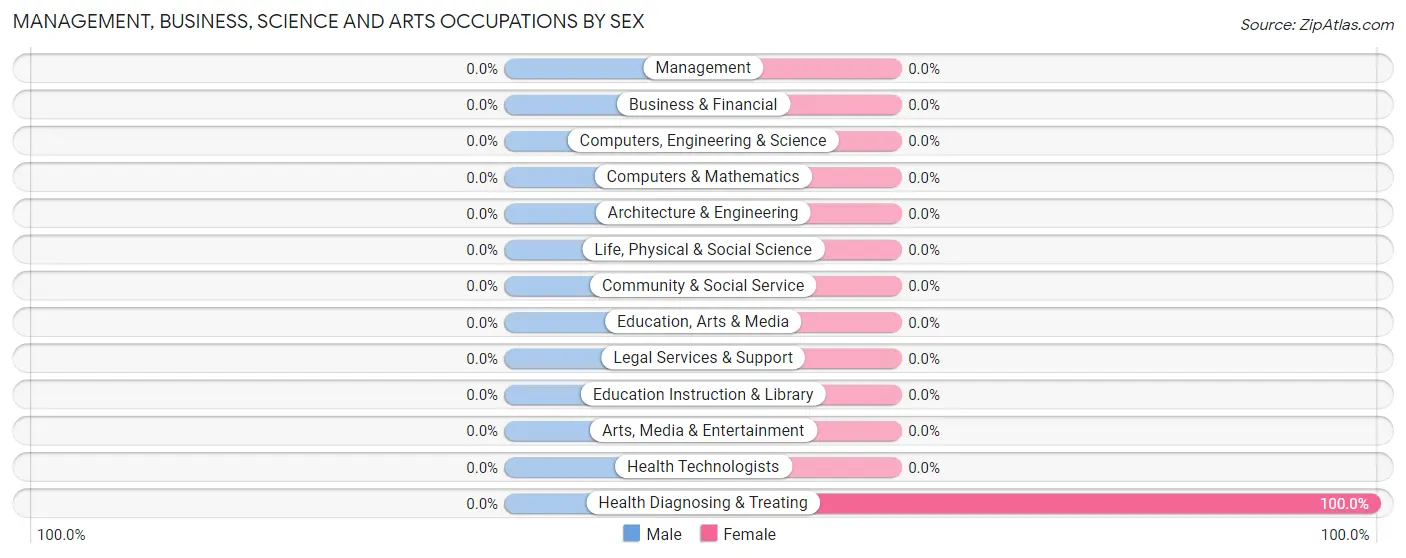
| Occupation | Male | Female |
| Management | 0 (0.0%) | 0 (0.0%) |
| Business & Financial | 0 (0.0%) | 0 (0.0%) |
| Computers, Engineering & Science | 0 (0.0%) | 0 (0.0%) |
| Computers & Mathematics | 0 (0.0%) | 0 (0.0%) |
| Architecture & Engineering | 0 (0.0%) | 0 (0.0%) |
| Life, Physical & Social Science | 0 (0.0%) | 0 (0.0%) |
| Community & Social Service | 0 (0.0%) | 0 (0.0%) |
| Education, Arts & Media | 0 (0.0%) | 0 (0.0%) |
| Legal Services & Support | 0 (0.0%) | 0 (0.0%) |
| Education Instruction & Library | 0 (0.0%) | 0 (0.0%) |
| Arts, Media & Entertainment | 0 (0.0%) | 0 (0.0%) |
| Health Diagnosing & Treating | 0 (0.0%) | 5 (100.0%) |
| Health Technologists | 0 (0.0%) | 0 (0.0%) |
| Total (Category) | 0 (0.0%) | 5 (100.0%) |
| Total (Overall) | 23 (32.9%) | 47 (67.1%) |
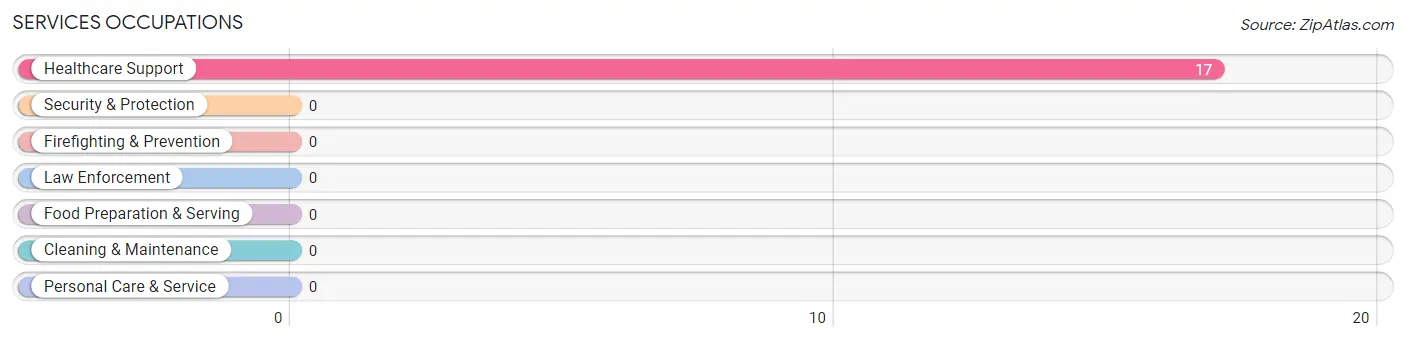
Services Occupations
The most common Services occupations in Three Rocks are , and Healthcare Support (17 | 24.3%).
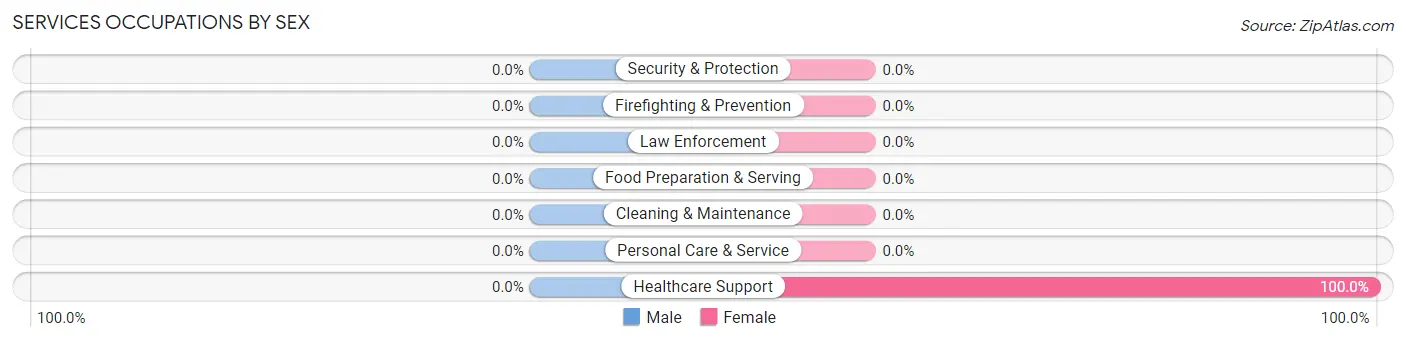
Services Occupations by Sex
| Occupation | Male | Female |
| Healthcare Support | 0 (0.0%) | 17 (100.0%) |
| Security & Protection | 0 (0.0%) | 0 (0.0%) |
| Firefighting & Prevention | 0 (0.0%) | 0 (0.0%) |
| Law Enforcement | 0 (0.0%) | 0 (0.0%) |
| Food Preparation & Serving | 0 (0.0%) | 0 (0.0%) |
| Cleaning & Maintenance | 0 (0.0%) | 0 (0.0%) |
| Personal Care & Service | 0 (0.0%) | 0 (0.0%) |
| Total (Category) | 0 (0.0%) | 17 (100.0%) |
| Total (Overall) | 23 (32.9%) | 47 (67.1%) |
Sales and Office Occupations
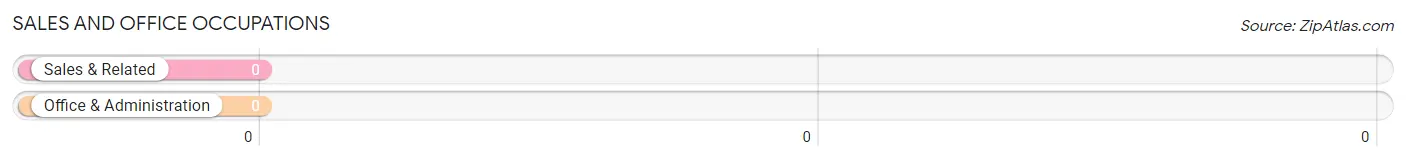
Sales and Office Occupations by Sex
| Occupation | Male | Female |
| Sales & Related | 0 (0.0%) | 0 (0.0%) |
| Office & Administration | 0 (0.0%) | 0 (0.0%) |
| Total (Category) | 0 (0.0%) | 0 (0.0%) |
| Total (Overall) | 23 (32.9%) | 47 (67.1%) |
Natural Resources, Construction and Maintenance Occupations
The most common Natural Resources, Construction and Maintenance occupations in Three Rocks are Farming, Fishing & Forestry (29 | 41.4%), and Construction & Extraction (5 | 7.1%).
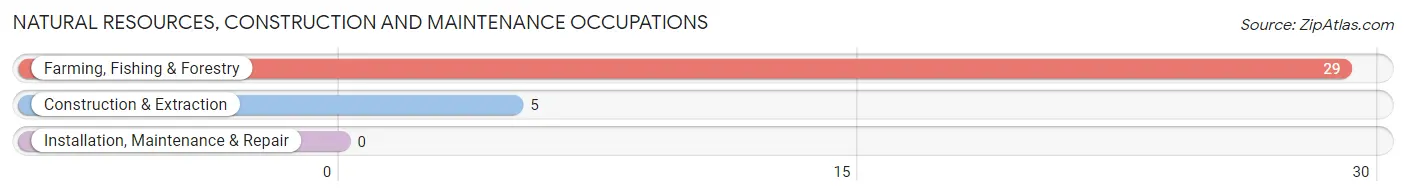
Natural Resources, Construction and Maintenance Occupations by Sex
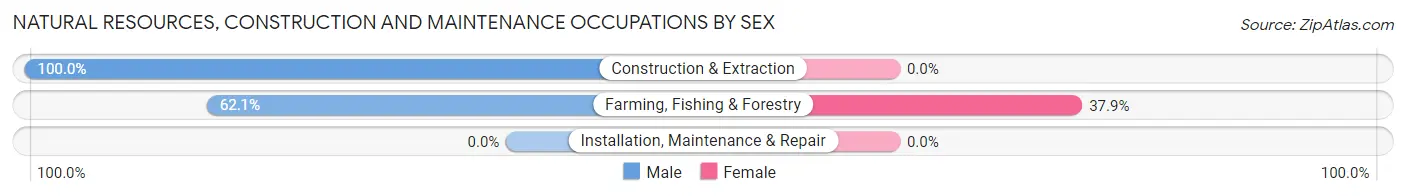
| Occupation | Male | Female |
| Farming, Fishing & Forestry | 18 (62.1%) | 11 (37.9%) |
| Construction & Extraction | 5 (100.0%) | 0 (0.0%) |
| Installation, Maintenance & Repair | 0 (0.0%) | 0 (0.0%) |
| Total (Category) | 23 (67.6%) | 11 (32.4%) |
| Total (Overall) | 23 (32.9%) | 47 (67.1%) |
Production, Transportation and Moving Occupations
The most common Production, Transportation and Moving occupations in Three Rocks are , and Transportation (14 | 20.0%).
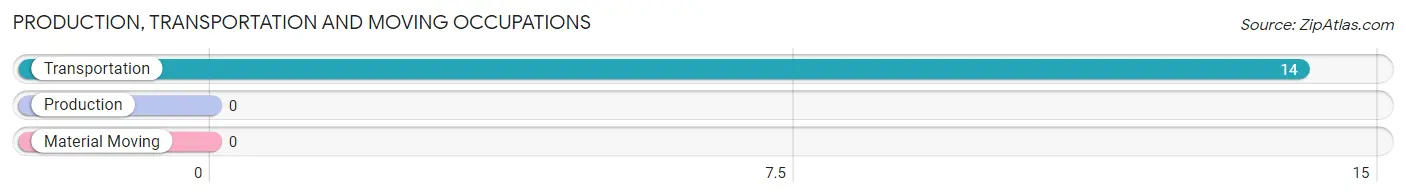
Production, Transportation and Moving Occupations by Sex
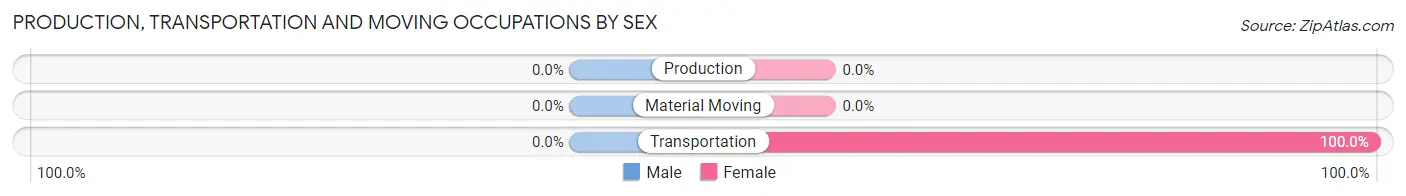
| Occupation | Male | Female |
| Production | 0 (0.0%) | 0 (0.0%) |
| Transportation | 0 (0.0%) | 14 (100.0%) |
| Material Moving | 0 (0.0%) | 0 (0.0%) |
| Total (Category) | 0 (0.0%) | 14 (100.0%) |
| Total (Overall) | 23 (32.9%) | 47 (67.1%) |
Employment Industries by Sex in Three Rocks
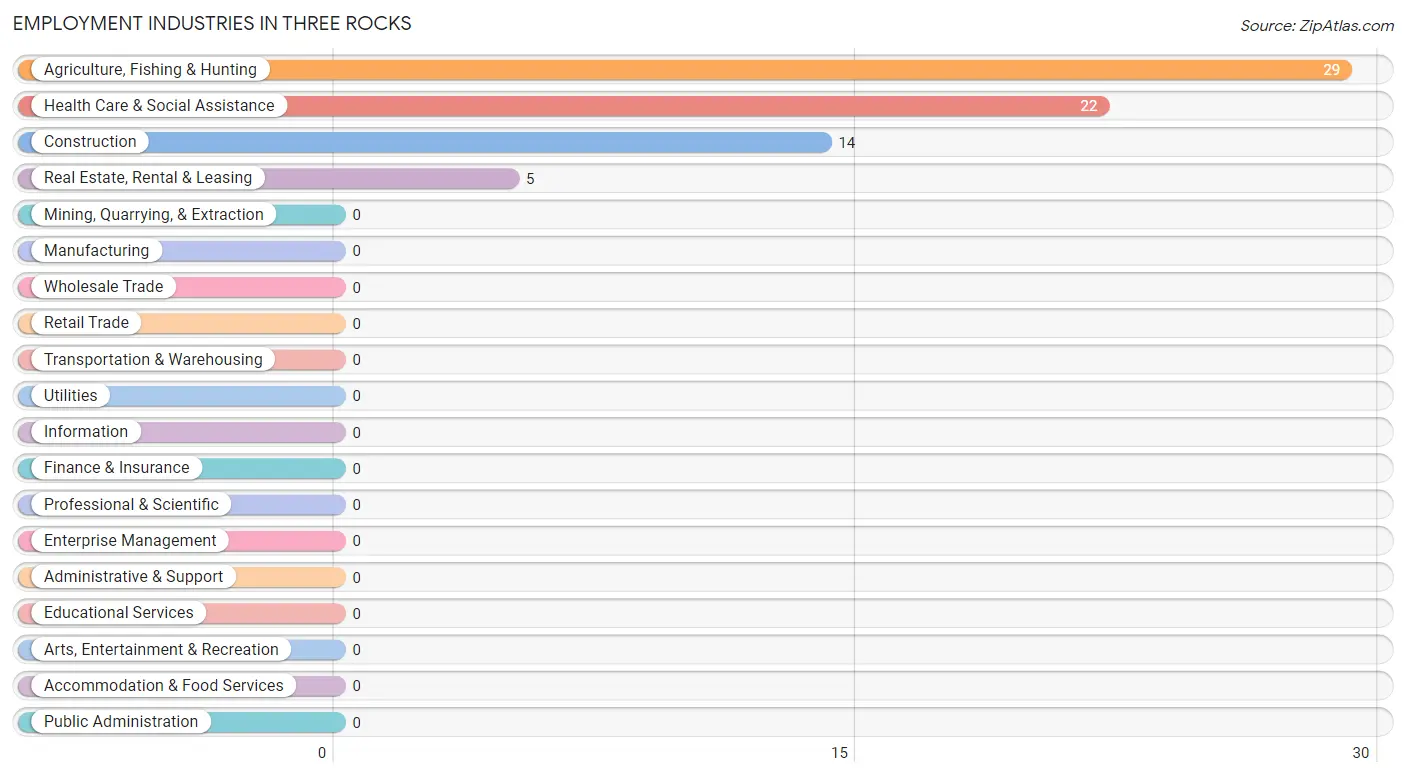
Employment Industries in Three Rocks
The major employment industries in Three Rocks include Agriculture, Fishing & Hunting (29 | 41.4%), Health Care & Social Assistance (22 | 31.4%), Construction (14 | 20.0%), and Real Estate, Rental & Leasing (5 | 7.1%).
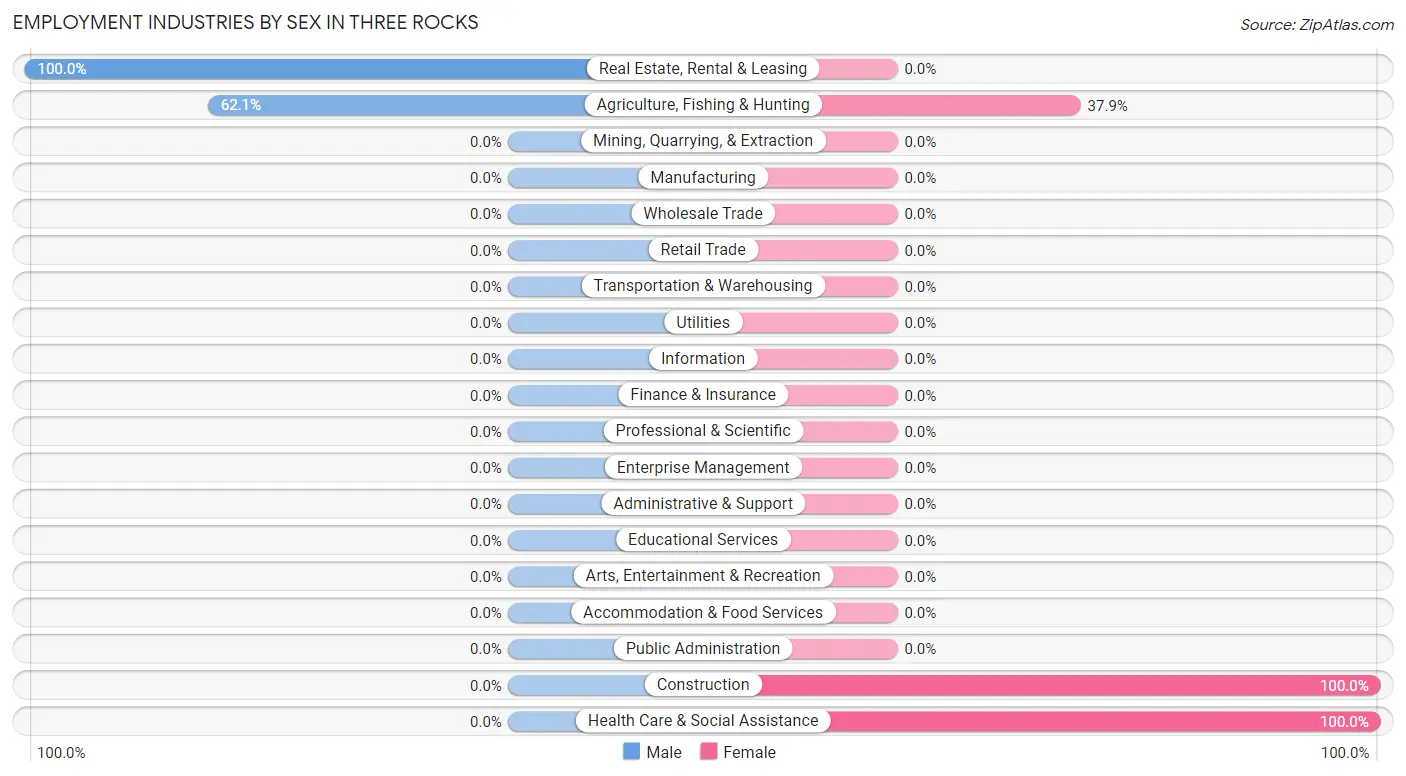
Employment Industries by Sex in Three Rocks
The Three Rocks industries that see more men than women are Real Estate, Rental & Leasing (100.0%), and Agriculture, Fishing & Hunting (62.1%), whereas the industries that tend to have a higher number of women are Construction (100.0%), Health Care & Social Assistance (100.0%), and Agriculture, Fishing & Hunting (37.9%).
| Industry | Male | Female |
| Agriculture, Fishing & Hunting | 18 (62.1%) | 11 (37.9%) |
| Mining, Quarrying, & Extraction | 0 (0.0%) | 0 (0.0%) |
| Construction | 0 (0.0%) | 14 (100.0%) |
| Manufacturing | 0 (0.0%) | 0 (0.0%) |
| Wholesale Trade | 0 (0.0%) | 0 (0.0%) |
| Retail Trade | 0 (0.0%) | 0 (0.0%) |
| Transportation & Warehousing | 0 (0.0%) | 0 (0.0%) |
| Utilities | 0 (0.0%) | 0 (0.0%) |
| Information | 0 (0.0%) | 0 (0.0%) |
| Finance & Insurance | 0 (0.0%) | 0 (0.0%) |
| Real Estate, Rental & Leasing | 5 (100.0%) | 0 (0.0%) |
| Professional & Scientific | 0 (0.0%) | 0 (0.0%) |
| Enterprise Management | 0 (0.0%) | 0 (0.0%) |
| Administrative & Support | 0 (0.0%) | 0 (0.0%) |
| Educational Services | 0 (0.0%) | 0 (0.0%) |
| Health Care & Social Assistance | 0 (0.0%) | 22 (100.0%) |
| Arts, Entertainment & Recreation | 0 (0.0%) | 0 (0.0%) |
| Accommodation & Food Services | 0 (0.0%) | 0 (0.0%) |
| Public Administration | 0 (0.0%) | 0 (0.0%) |
| Total | 23 (32.9%) | 47 (67.1%) |
Education in Three Rocks
School Enrollment in Three Rocks
The most common levels of schooling among the 23 students in Three Rocks are high school (12 | 52.2%), middle school (6 | 26.1%), and kindergarten (5 | 21.7%).
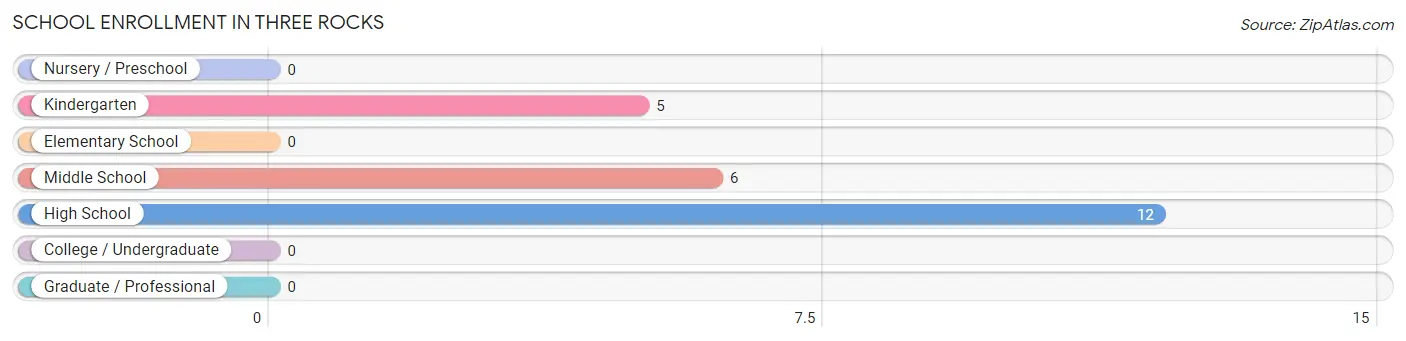
| School Level | # Students | % Students |
| Nursery / Preschool | 0 | 0.0% |
| Kindergarten | 5 | 21.7% |
| Elementary School | 0 | 0.0% |
| Middle School | 6 | 26.1% |
| High School | 12 | 52.2% |
| College / Undergraduate | 0 | 0.0% |
| Graduate / Professional | 0 | 0.0% |
| Total | 23 | 100.0% |
School Enrollment by Age by Funding Source in Three Rocks
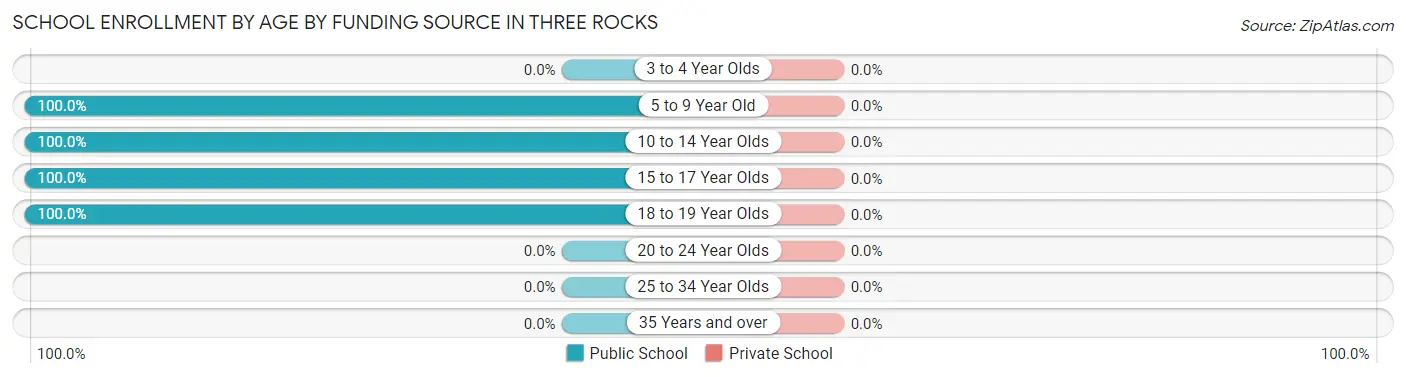
| Age Bracket | Public School | Private School |
| 3 to 4 Year Olds | 0 (0.0%) | 0 (0.0%) |
| 5 to 9 Year Old | 5 (100.0%) | 0 (0.0%) |
| 10 to 14 Year Olds | 6 (100.0%) | 0 (0.0%) |
| 15 to 17 Year Olds | 6 (100.0%) | 0 (0.0%) |
| 18 to 19 Year Olds | 6 (100.0%) | 0 (0.0%) |
| 20 to 24 Year Olds | 0 (0.0%) | 0 (0.0%) |
| 25 to 34 Year Olds | 0 (0.0%) | 0 (0.0%) |
| 35 Years and over | 0 (0.0%) | 0 (0.0%) |
| Total | 23 (100.0%) | 0 (0.0%) |
Educational Attainment by Field of Study in Three Rocks
, and business (5 | 100.0%) are the most common fields of study among 5 individuals in Three Rocks who have obtained a bachelor's degree or higher.
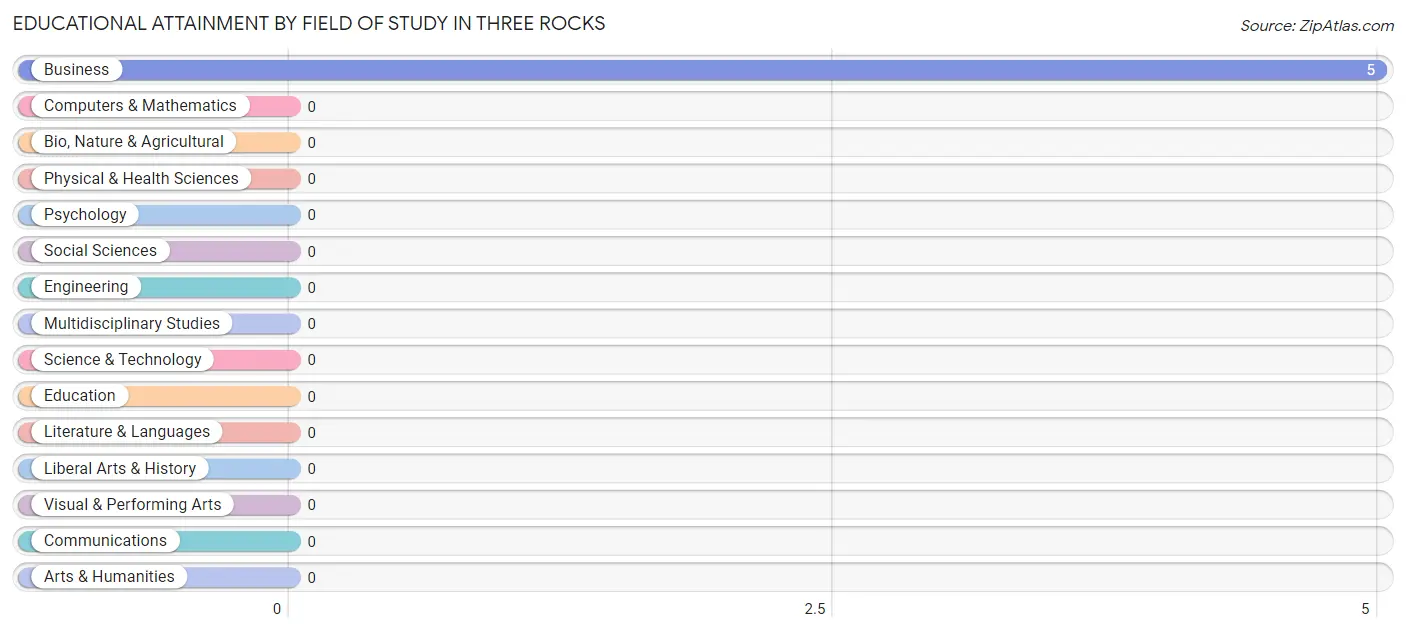
| Field of Study | # Graduates | % Graduates |
| Computers & Mathematics | 0 | 0.0% |
| Bio, Nature & Agricultural | 0 | 0.0% |
| Physical & Health Sciences | 0 | 0.0% |
| Psychology | 0 | 0.0% |
| Social Sciences | 0 | 0.0% |
| Engineering | 0 | 0.0% |
| Multidisciplinary Studies | 0 | 0.0% |
| Science & Technology | 0 | 0.0% |
| Business | 5 | 100.0% |
| Education | 0 | 0.0% |
| Literature & Languages | 0 | 0.0% |
| Liberal Arts & History | 0 | 0.0% |
| Visual & Performing Arts | 0 | 0.0% |
| Communications | 0 | 0.0% |
| Arts & Humanities | 0 | 0.0% |
| Total | 5 | 100.0% |
Transportation & Commute in Three Rocks
Vehicle Availability by Sex in Three Rocks
The most prevalent vehicle ownership categories in Three Rocks are males with 1 vehicle (18, accounting for 78.3%) and females with 1 vehicle (0, making up 38.3%).
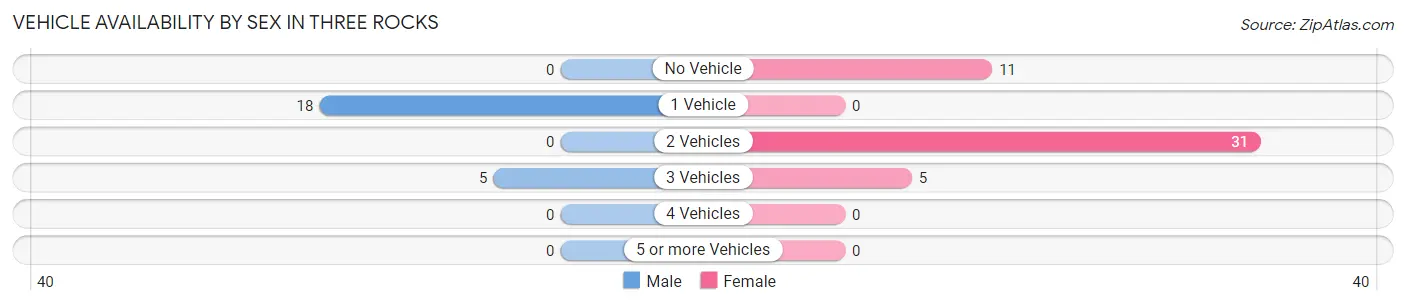
| Vehicles Available | Male | Female |
| No Vehicle | 0 (0.0%) | 11 (23.4%) |
| 1 Vehicle | 18 (78.3%) | 0 (0.0%) |
| 2 Vehicles | 0 (0.0%) | 31 (66.0%) |
| 3 Vehicles | 5 (21.7%) | 5 (10.6%) |
| 4 Vehicles | 0 (0.0%) | 0 (0.0%) |
| 5 or more Vehicles | 0 (0.0%) | 0 (0.0%) |
| Total | 23 (100.0%) | 47 (100.0%) |
Commute Time in Three Rocks
The most frequently occuring commute durations in Three Rocks are 45 to 59 minutes (32 commuters, 60.4%), 10 to 14 minutes (11 commuters, 20.7%), and 5 to 9 minutes (5 commuters, 9.4%).
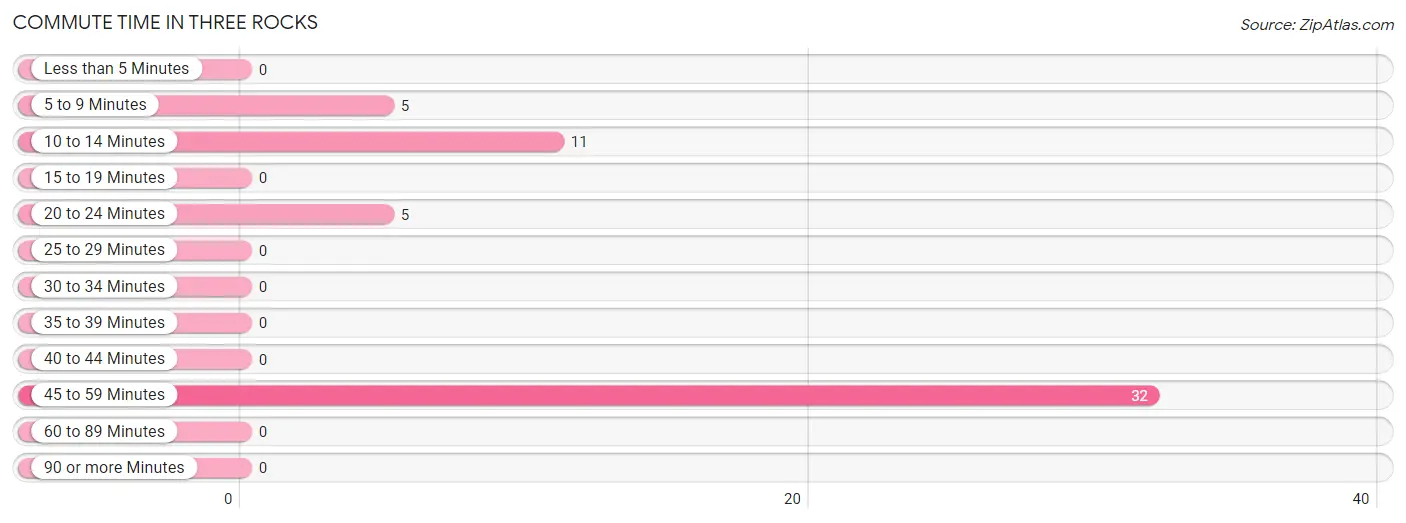
| Commute Time | # Commuters | % Commuters |
| Less than 5 Minutes | 0 | 0.0% |
| 5 to 9 Minutes | 5 | 9.4% |
| 10 to 14 Minutes | 11 | 20.7% |
| 15 to 19 Minutes | 0 | 0.0% |
| 20 to 24 Minutes | 5 | 9.4% |
| 25 to 29 Minutes | 0 | 0.0% |
| 30 to 34 Minutes | 0 | 0.0% |
| 35 to 39 Minutes | 0 | 0.0% |
| 40 to 44 Minutes | 0 | 0.0% |
| 45 to 59 Minutes | 32 | 60.4% |
| 60 to 89 Minutes | 0 | 0.0% |
| 90 or more Minutes | 0 | 0.0% |
Commute Time by Sex in Three Rocks
The most common commute times in Three Rocks are 45 to 59 minutes (18 commuters, 78.3%) for males and 45 to 59 minutes (14 commuters, 46.7%) for females.
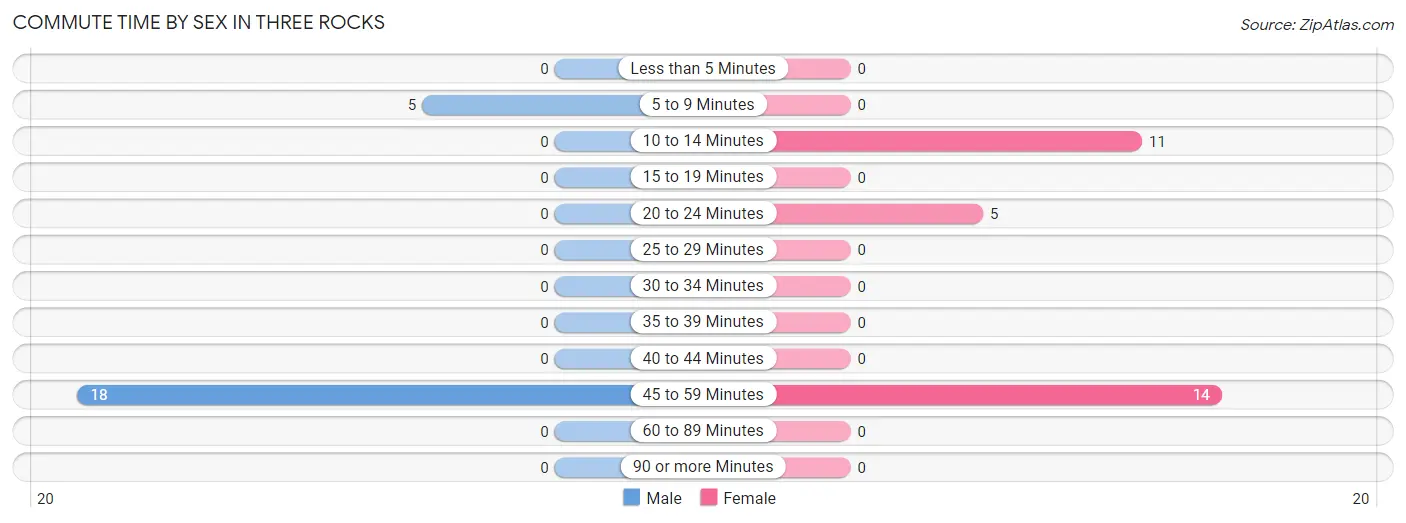
| Commute Time | Male | Female |
| Less than 5 Minutes | 0 (0.0%) | 0 (0.0%) |
| 5 to 9 Minutes | 5 (21.7%) | 0 (0.0%) |
| 10 to 14 Minutes | 0 (0.0%) | 11 (36.7%) |
| 15 to 19 Minutes | 0 (0.0%) | 0 (0.0%) |
| 20 to 24 Minutes | 0 (0.0%) | 5 (16.7%) |
| 25 to 29 Minutes | 0 (0.0%) | 0 (0.0%) |
| 30 to 34 Minutes | 0 (0.0%) | 0 (0.0%) |
| 35 to 39 Minutes | 0 (0.0%) | 0 (0.0%) |
| 40 to 44 Minutes | 0 (0.0%) | 0 (0.0%) |
| 45 to 59 Minutes | 18 (78.3%) | 14 (46.7%) |
| 60 to 89 Minutes | 0 (0.0%) | 0 (0.0%) |
| 90 or more Minutes | 0 (0.0%) | 0 (0.0%) |
Time of Departure to Work by Sex in Three Rocks
The most frequent times of departure to work in Three Rocks are 5:00 AM to 5:29 AM (18, 78.3%) for males and 9:00 AM to 9:59 AM (14, 46.7%) for females.
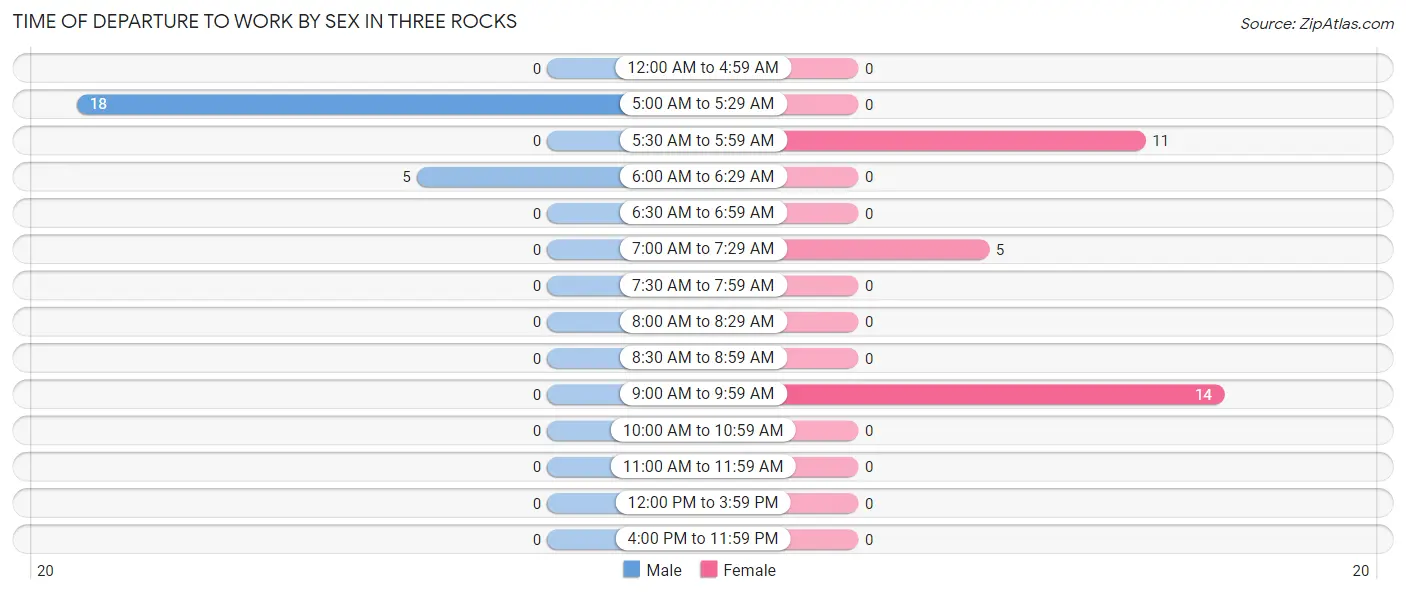
| Time of Departure | Male | Female |
| 12:00 AM to 4:59 AM | 0 (0.0%) | 0 (0.0%) |
| 5:00 AM to 5:29 AM | 18 (78.3%) | 0 (0.0%) |
| 5:30 AM to 5:59 AM | 0 (0.0%) | 11 (36.7%) |
| 6:00 AM to 6:29 AM | 5 (21.7%) | 0 (0.0%) |
| 6:30 AM to 6:59 AM | 0 (0.0%) | 0 (0.0%) |
| 7:00 AM to 7:29 AM | 0 (0.0%) | 5 (16.7%) |
| 7:30 AM to 7:59 AM | 0 (0.0%) | 0 (0.0%) |
| 8:00 AM to 8:29 AM | 0 (0.0%) | 0 (0.0%) |
| 8:30 AM to 8:59 AM | 0 (0.0%) | 0 (0.0%) |
| 9:00 AM to 9:59 AM | 0 (0.0%) | 14 (46.7%) |
| 10:00 AM to 10:59 AM | 0 (0.0%) | 0 (0.0%) |
| 11:00 AM to 11:59 AM | 0 (0.0%) | 0 (0.0%) |
| 12:00 PM to 3:59 PM | 0 (0.0%) | 0 (0.0%) |
| 4:00 PM to 11:59 PM | 0 (0.0%) | 0 (0.0%) |
| Total | 23 (100.0%) | 30 (100.0%) |
Housing Occupancy in Three Rocks
Occupancy by Ownership in Three Rocks
Of the total 63 dwellings in Three Rocks, owner-occupied units account for 47 (74.6%), while renter-occupied units make up 16 (25.4%).
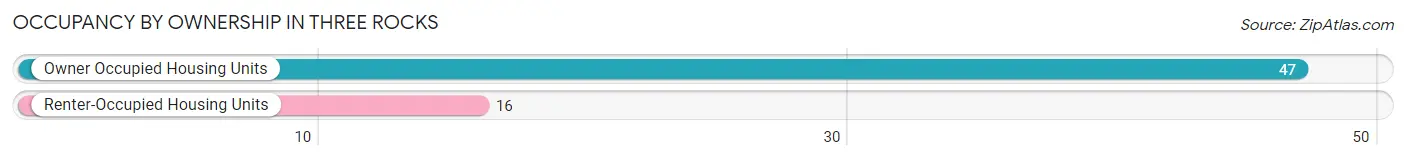
| Occupancy | # Housing Units | % Housing Units |
| Owner Occupied Housing Units | 47 | 74.6% |
| Renter-Occupied Housing Units | 16 | 25.4% |
| Total Occupied Housing Units | 63 | 100.0% |
Occupancy by Household Size in Three Rocks
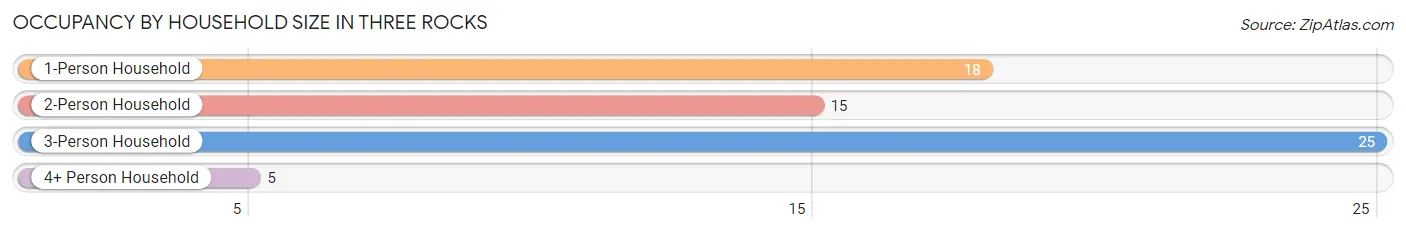
| Household Size | # Housing Units | % Housing Units |
| 1-Person Household | 18 | 28.6% |
| 2-Person Household | 15 | 23.8% |
| 3-Person Household | 25 | 39.7% |
| 4+ Person Household | 5 | 7.9% |
| Total Housing Units | 63 | 100.0% |
Occupancy by Ownership by Household Size in Three Rocks
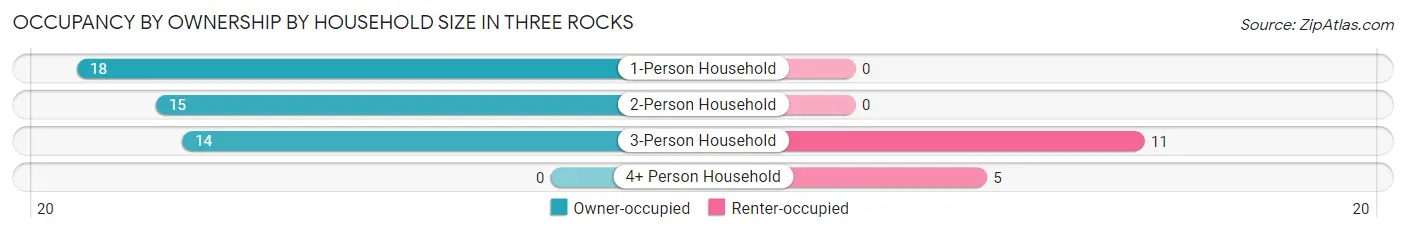
| Household Size | Owner-occupied | Renter-occupied |
| 1-Person Household | 18 (100.0%) | 0 (0.0%) |
| 2-Person Household | 15 (100.0%) | 0 (0.0%) |
| 3-Person Household | 14 (56.0%) | 11 (44.0%) |
| 4+ Person Household | 0 (0.0%) | 5 (100.0%) |
| Total Housing Units | 47 (74.6%) | 16 (25.4%) |
Occupancy by Educational Attainment in Three Rocks
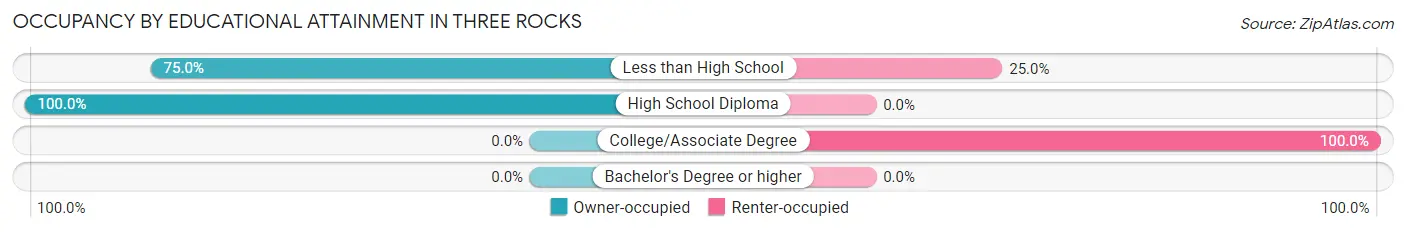
| Household Size | Owner-occupied | Renter-occupied |
| Less than High School | 33 (75.0%) | 11 (25.0%) |
| High School Diploma | 14 (100.0%) | 0 (0.0%) |
| College/Associate Degree | 0 (0.0%) | 5 (100.0%) |
| Bachelor's Degree or higher | 0 (0.0%) | 0 (0.0%) |
Occupancy by Age of Householder in Three Rocks
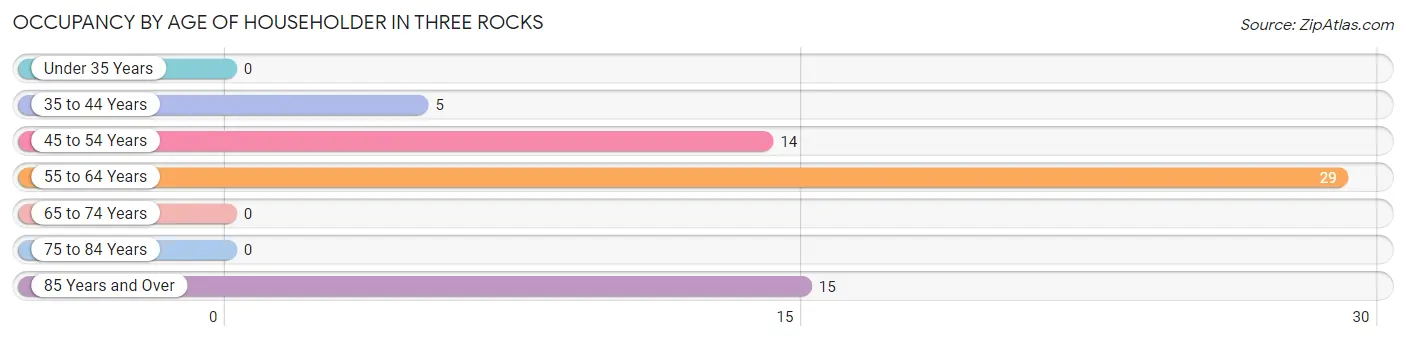
| Age Bracket | # Households | % Households |
| Under 35 Years | 0 | 0.0% |
| 35 to 44 Years | 5 | 7.9% |
| 45 to 54 Years | 14 | 22.2% |
| 55 to 64 Years | 29 | 46.0% |
| 65 to 74 Years | 0 | 0.0% |
| 75 to 84 Years | 0 | 0.0% |
| 85 Years and Over | 15 | 23.8% |
| Total | 63 | 100.0% |
Housing Finances in Three Rocks
Median Income by Occupancy in Three Rocks
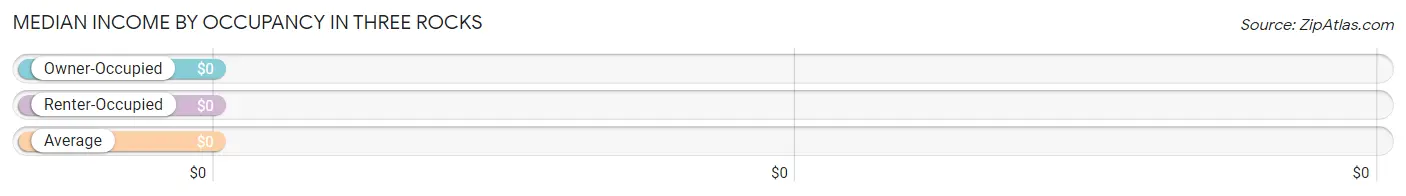
| Occupancy Type | # Households | Median Income |
| Owner-Occupied | 47 (74.6%) | $0 |
| Renter-Occupied | 16 (25.4%) | $0 |
| Average | 63 (100.0%) | $0 |
Occupancy by Householder Income Bracket in Three Rocks
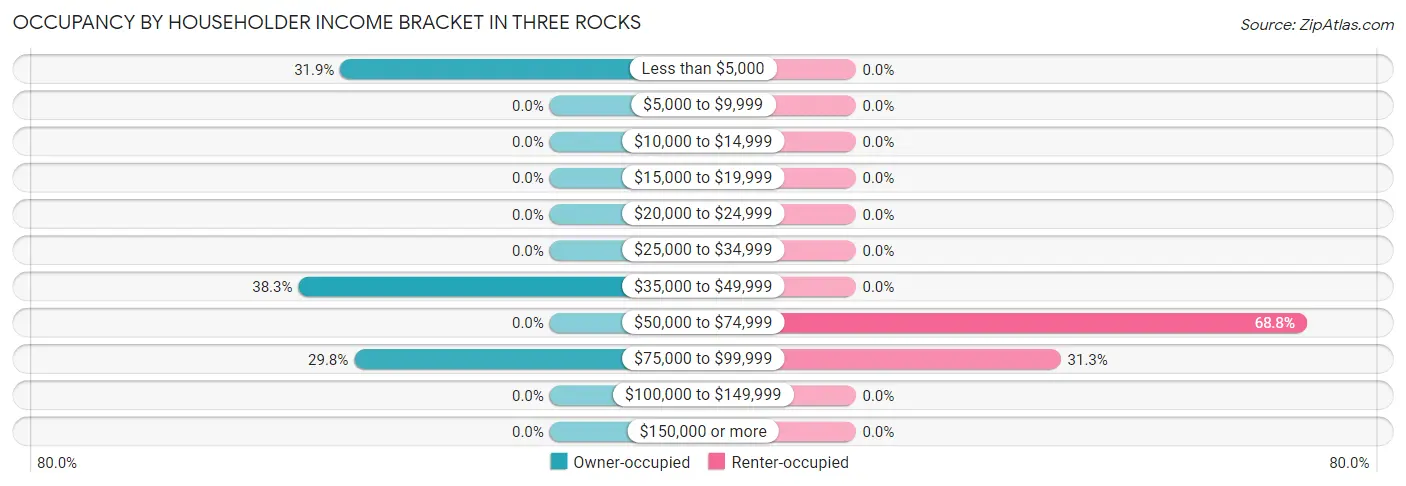
| Income Bracket | Owner-occupied | Renter-occupied |
| Less than $5,000 | 15 (31.9%) | 0 (0.0%) |
| $5,000 to $9,999 | 0 (0.0%) | 0 (0.0%) |
| $10,000 to $14,999 | 0 (0.0%) | 0 (0.0%) |
| $15,000 to $19,999 | 0 (0.0%) | 0 (0.0%) |
| $20,000 to $24,999 | 0 (0.0%) | 0 (0.0%) |
| $25,000 to $34,999 | 0 (0.0%) | 0 (0.0%) |
| $35,000 to $49,999 | 18 (38.3%) | 0 (0.0%) |
| $50,000 to $74,999 | 0 (0.0%) | 11 (68.8%) |
| $75,000 to $99,999 | 14 (29.8%) | 5 (31.2%) |
| $100,000 to $149,999 | 0 (0.0%) | 0 (0.0%) |
| $150,000 or more | 0 (0.0%) | 0 (0.0%) |
| Total | 47 (100.0%) | 16 (100.0%) |
Monthly Housing Cost Tiers in Three Rocks
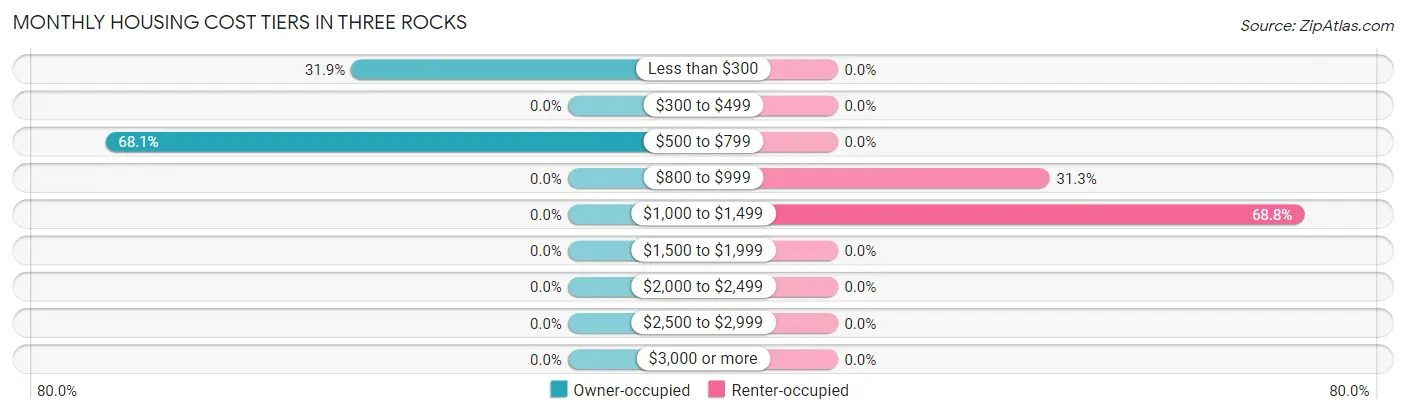
| Monthly Cost | Owner-occupied | Renter-occupied |
| Less than $300 | 15 (31.9%) | 0 (0.0%) |
| $300 to $499 | 0 (0.0%) | 0 (0.0%) |
| $500 to $799 | 32 (68.1%) | 0 (0.0%) |
| $800 to $999 | 0 (0.0%) | 5 (31.2%) |
| $1,000 to $1,499 | 0 (0.0%) | 11 (68.8%) |
| $1,500 to $1,999 | 0 (0.0%) | 0 (0.0%) |
| $2,000 to $2,499 | 0 (0.0%) | 0 (0.0%) |
| $2,500 to $2,999 | 0 (0.0%) | 0 (0.0%) |
| $3,000 or more | 0 (0.0%) | 0 (0.0%) |
| Total | 47 (100.0%) | 16 (100.0%) |
Physical Housing Characteristics in Three Rocks
Housing Structures in Three Rocks
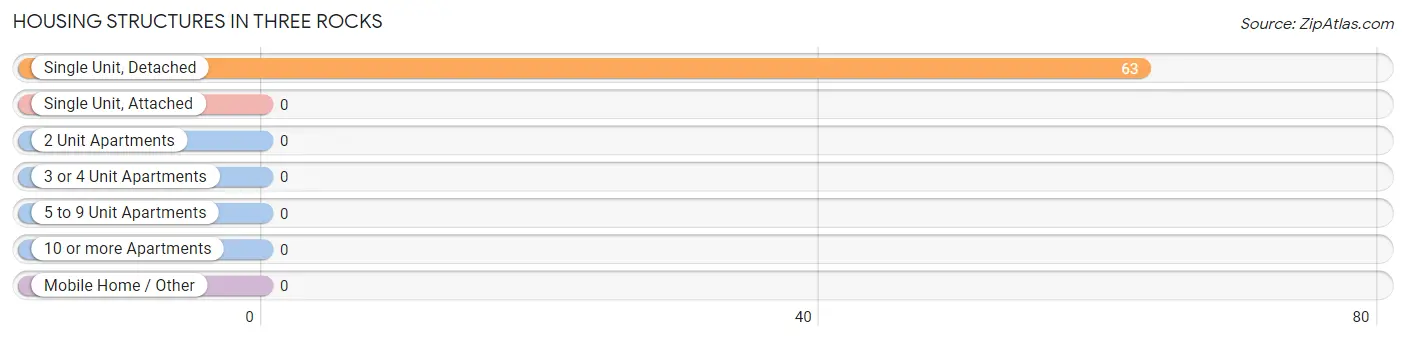
| Structure Type | # Housing Units | % Housing Units |
| Single Unit, Detached | 63 | 100.0% |
| Single Unit, Attached | 0 | 0.0% |
| 2 Unit Apartments | 0 | 0.0% |
| 3 or 4 Unit Apartments | 0 | 0.0% |
| 5 to 9 Unit Apartments | 0 | 0.0% |
| 10 or more Apartments | 0 | 0.0% |
| Mobile Home / Other | 0 | 0.0% |
| Total | 63 | 100.0% |
Housing Structures by Occupancy in Three Rocks
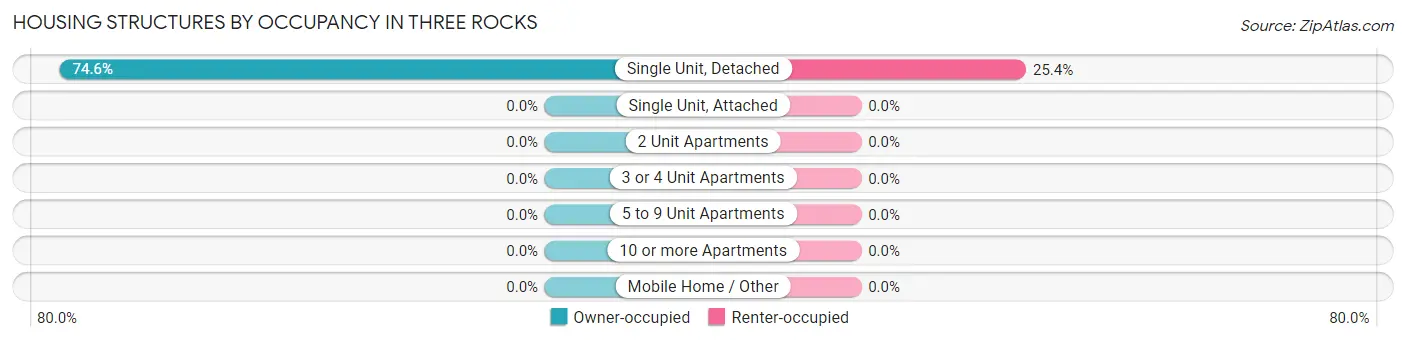
| Structure Type | Owner-occupied | Renter-occupied |
| Single Unit, Detached | 47 (74.6%) | 16 (25.4%) |
| Single Unit, Attached | 0 (0.0%) | 0 (0.0%) |
| 2 Unit Apartments | 0 (0.0%) | 0 (0.0%) |
| 3 or 4 Unit Apartments | 0 (0.0%) | 0 (0.0%) |
| 5 to 9 Unit Apartments | 0 (0.0%) | 0 (0.0%) |
| 10 or more Apartments | 0 (0.0%) | 0 (0.0%) |
| Mobile Home / Other | 0 (0.0%) | 0 (0.0%) |
| Total | 47 (74.6%) | 16 (25.4%) |
Housing Structures by Number of Rooms in Three Rocks
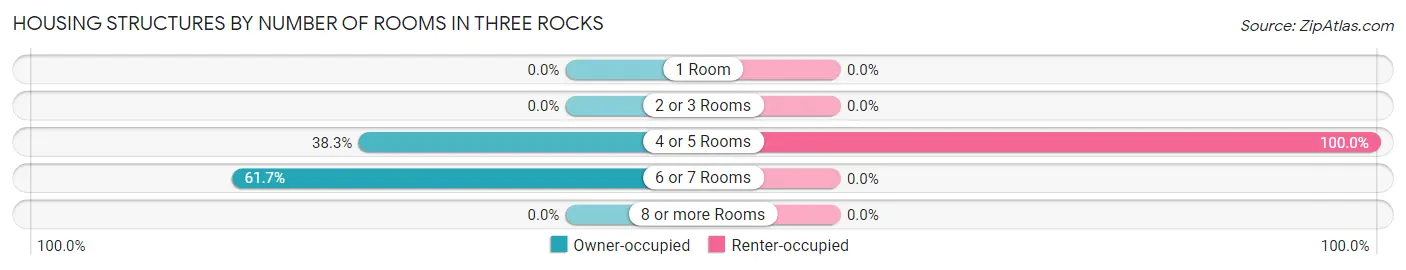
| Number of Rooms | Owner-occupied | Renter-occupied |
| 1 Room | 0 (0.0%) | 0 (0.0%) |
| 2 or 3 Rooms | 0 (0.0%) | 0 (0.0%) |
| 4 or 5 Rooms | 18 (38.3%) | 16 (100.0%) |
| 6 or 7 Rooms | 29 (61.7%) | 0 (0.0%) |
| 8 or more Rooms | 0 (0.0%) | 0 (0.0%) |
| Total | 47 (100.0%) | 16 (100.0%) |
Housing Structure by Heating Type in Three Rocks
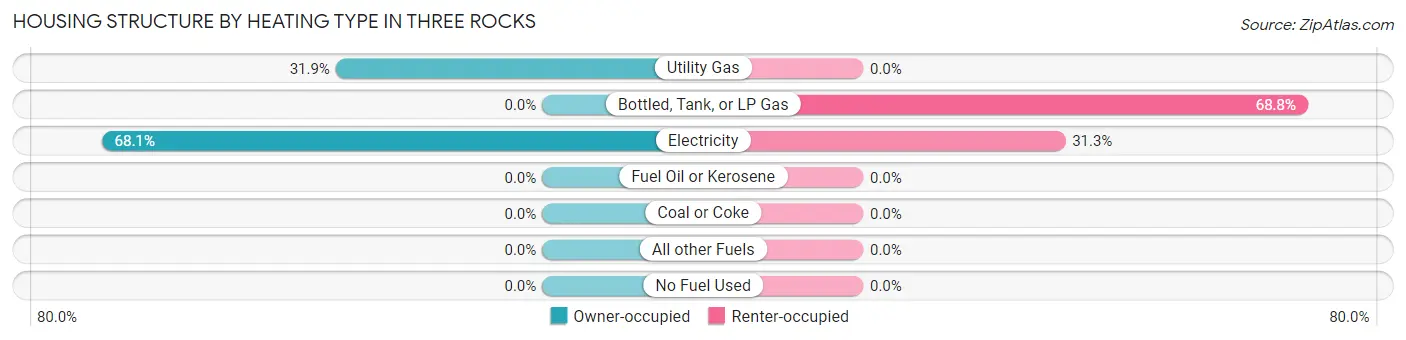
| Heating Type | Owner-occupied | Renter-occupied |
| Utility Gas | 15 (31.9%) | 0 (0.0%) |
| Bottled, Tank, or LP Gas | 0 (0.0%) | 11 (68.8%) |
| Electricity | 32 (68.1%) | 5 (31.2%) |
| Fuel Oil or Kerosene | 0 (0.0%) | 0 (0.0%) |
| Coal or Coke | 0 (0.0%) | 0 (0.0%) |
| All other Fuels | 0 (0.0%) | 0 (0.0%) |
| No Fuel Used | 0 (0.0%) | 0 (0.0%) |
| Total | 47 (100.0%) | 16 (100.0%) |
Household Vehicle Usage in Three Rocks
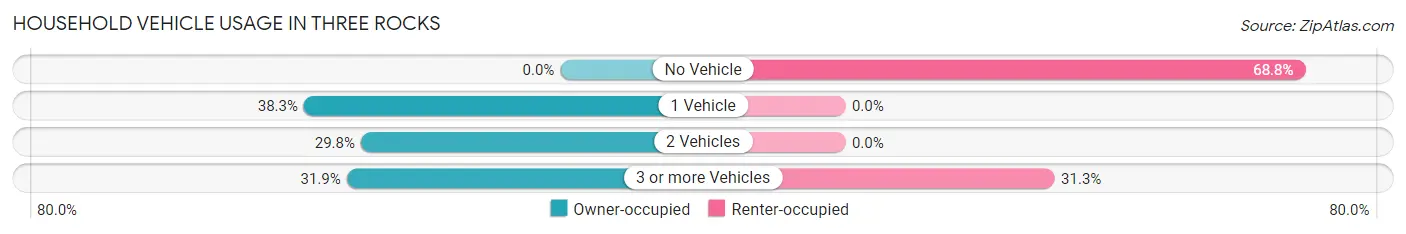
| Vehicles per Household | Owner-occupied | Renter-occupied |
| No Vehicle | 0 (0.0%) | 11 (68.8%) |
| 1 Vehicle | 18 (38.3%) | 0 (0.0%) |
| 2 Vehicles | 14 (29.8%) | 0 (0.0%) |
| 3 or more Vehicles | 15 (31.9%) | 5 (31.2%) |
| Total | 47 (100.0%) | 16 (100.0%) |
Real Estate & Mortgages in Three Rocks
Real Estate and Mortgage Overview in Three Rocks
| Characteristic | Without Mortgage | With Mortgage |
| Housing Units | 47 | 0 |
| Median Property Value | $163,200 | $0 |
| Median Household Income | - | - |
| Monthly Housing Costs | $527 | $0 |
| Real Estate Taxes | - | - |
Property Value by Mortgage Status in Three Rocks
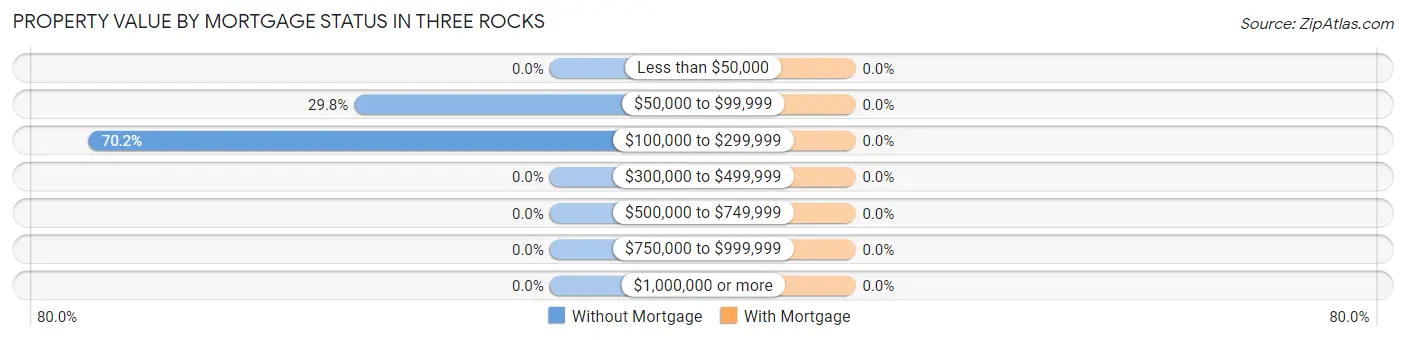
| Property Value | Without Mortgage | With Mortgage |
| Less than $50,000 | 0 (0.0%) | 0 (0.0%) |
| $50,000 to $99,999 | 14 (29.8%) | 0 (0.0%) |
| $100,000 to $299,999 | 33 (70.2%) | 0 (0.0%) |
| $300,000 to $499,999 | 0 (0.0%) | 0 (0.0%) |
| $500,000 to $749,999 | 0 (0.0%) | 0 (0.0%) |
| $750,000 to $999,999 | 0 (0.0%) | 0 (0.0%) |
| $1,000,000 or more | 0 (0.0%) | 0 (0.0%) |
| Total | 47 (100.0%) | 0 (0.0%) |
Household Income by Mortgage Status in Three Rocks
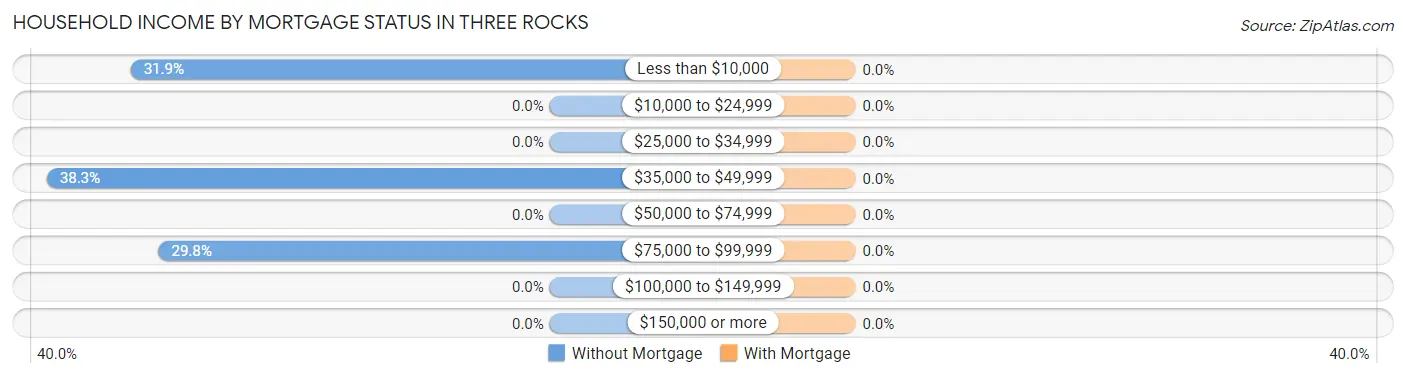
| Household Income | Without Mortgage | With Mortgage |
| Less than $10,000 | 15 (31.9%) | 0 (0.0%) |
| $10,000 to $24,999 | 0 (0.0%) | 0 (0.0%) |
| $25,000 to $34,999 | 0 (0.0%) | 0 (0.0%) |
| $35,000 to $49,999 | 18 (38.3%) | 0 (0.0%) |
| $50,000 to $74,999 | 0 (0.0%) | 0 (0.0%) |
| $75,000 to $99,999 | 14 (29.8%) | 0 (0.0%) |
| $100,000 to $149,999 | 0 (0.0%) | 0 (0.0%) |
| $150,000 or more | 0 (0.0%) | 0 (0.0%) |
| Total | 47 (100.0%) | 0 (0.0%) |
Property Value to Household Income Ratio in Three Rocks
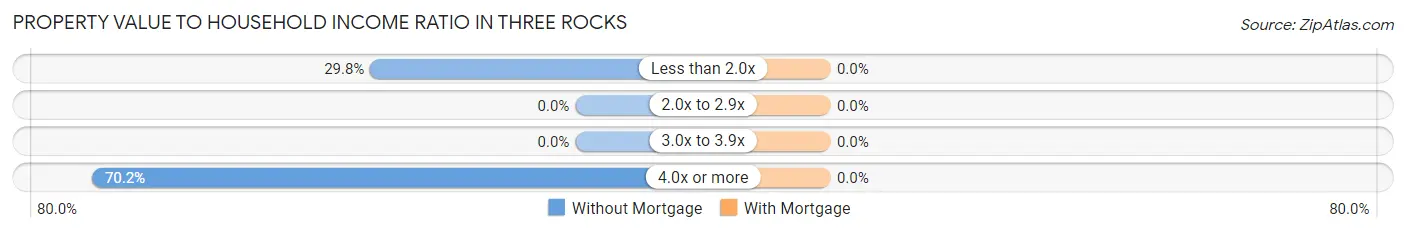
| Value-to-Income Ratio | Without Mortgage | With Mortgage |
| Less than 2.0x | 14 (29.8%) | 0 (0.0%) |
| 2.0x to 2.9x | 0 (0.0%) | 0 (0.0%) |
| 3.0x to 3.9x | 0 (0.0%) | 0 (0.0%) |
| 4.0x or more | 33 (70.2%) | 0 (0.0%) |
| Total | 47 (100.0%) | 0 (0.0%) |
Real Estate Taxes by Mortgage Status in Three Rocks
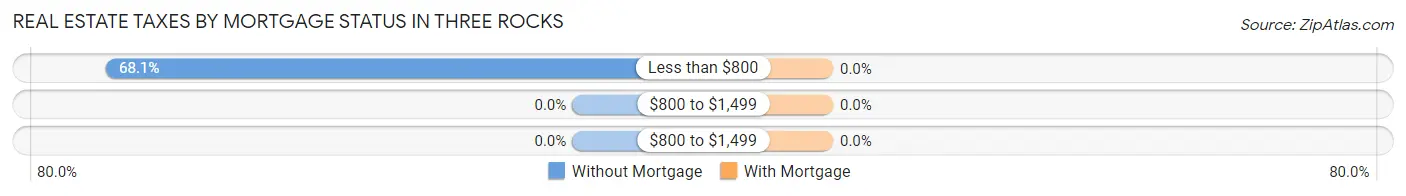
| Property Taxes | Without Mortgage | With Mortgage |
| Less than $800 | 32 (68.1%) | 0 (0.0%) |
| $800 to $1,499 | 0 (0.0%) | 0 (0.0%) |
| $800 to $1,499 | 0 (0.0%) | 0 (0.0%) |
| Total | 47 (100.0%) | 0 (0.0%) |
Health & Disability in Three Rocks
Health Insurance Coverage by Age in Three Rocks
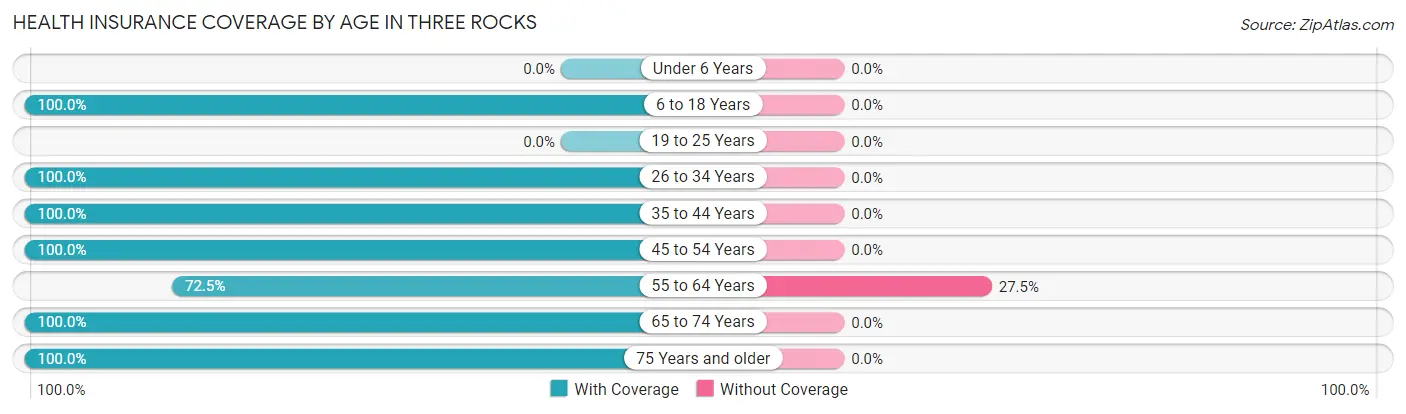
| Age Bracket | With Coverage | Without Coverage |
| Under 6 Years | 0 (0.0%) | 0 (0.0%) |
| 6 to 18 Years | 23 (100.0%) | 0 (0.0%) |
| 19 to 25 Years | 0 (0.0%) | 0 (0.0%) |
| 26 to 34 Years | 17 (100.0%) | 0 (0.0%) |
| 35 to 44 Years | 10 (100.0%) | 0 (0.0%) |
| 45 to 54 Years | 30 (100.0%) | 0 (0.0%) |
| 55 to 64 Years | 29 (72.5%) | 11 (27.5%) |
| 65 to 74 Years | 19 (100.0%) | 0 (0.0%) |
| 75 Years and older | 42 (100.0%) | 0 (0.0%) |
| Total | 170 (93.9%) | 11 (6.1%) |
Health Insurance Coverage by Citizenship Status in Three Rocks
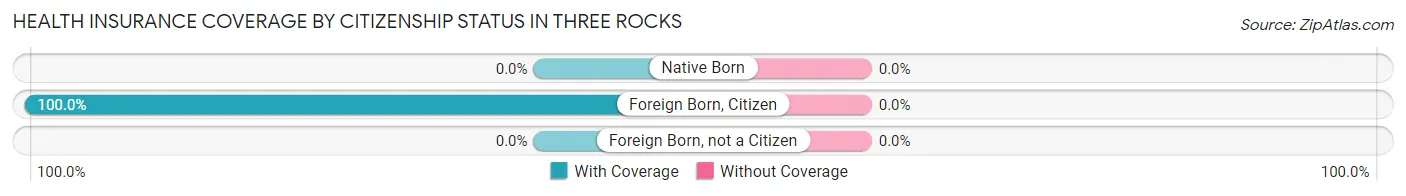
| Citizenship Status | With Coverage | Without Coverage |
| Native Born | 0 (0.0%) | 0 (0.0%) |
| Foreign Born, Citizen | 23 (100.0%) | 0 (0.0%) |
| Foreign Born, not a Citizen | 0 (0.0%) | 0 (0.0%) |
Health Insurance Coverage by Household Income in Three Rocks
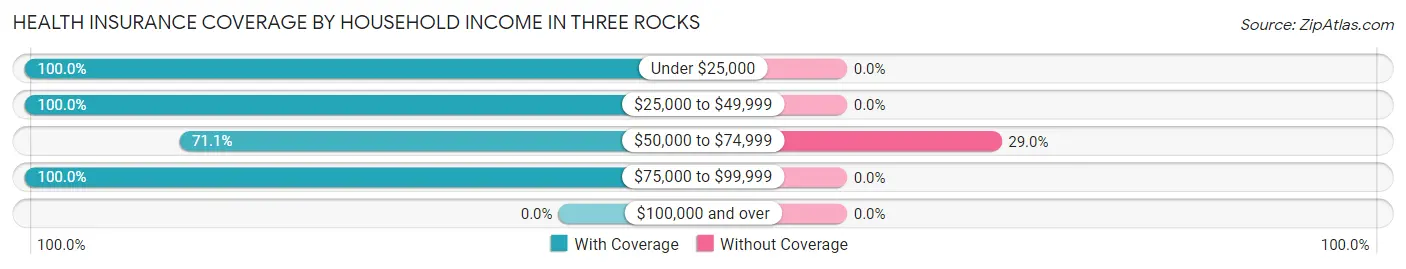
| Household Income | With Coverage | Without Coverage |
| Under $25,000 | 34 (100.0%) | 0 (0.0%) |
| $25,000 to $49,999 | 18 (100.0%) | 0 (0.0%) |
| $50,000 to $74,999 | 27 (71.1%) | 11 (28.9%) |
| $75,000 to $99,999 | 91 (100.0%) | 0 (0.0%) |
| $100,000 and over | 0 (0.0%) | 0 (0.0%) |
Public vs Private Health Insurance Coverage by Age in Three Rocks
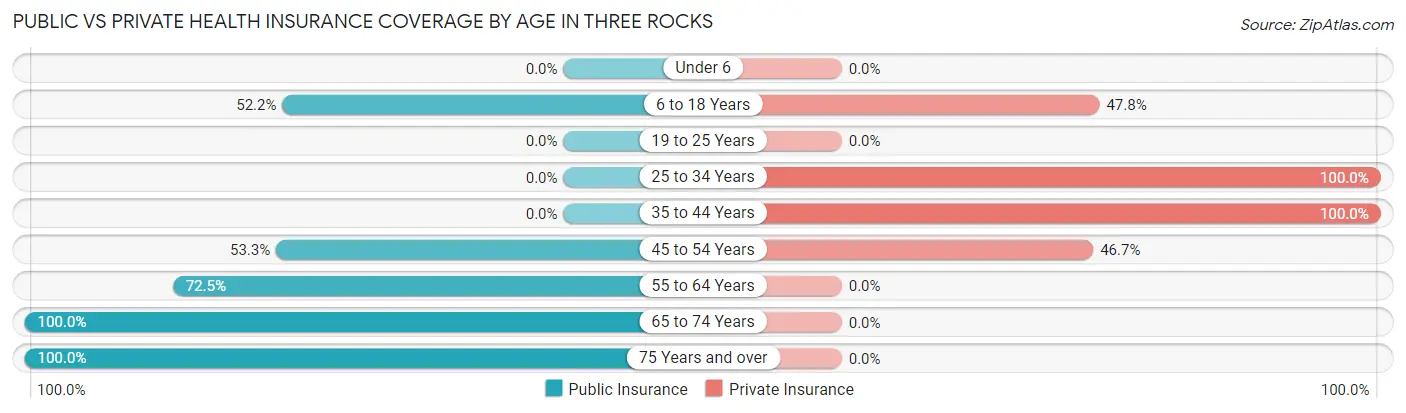
| Age Bracket | Public Insurance | Private Insurance |
| Under 6 | 0 (0.0%) | 0 (0.0%) |
| 6 to 18 Years | 12 (52.2%) | 11 (47.8%) |
| 19 to 25 Years | 0 (0.0%) | 0 (0.0%) |
| 25 to 34 Years | 0 (0.0%) | 17 (100.0%) |
| 35 to 44 Years | 0 (0.0%) | 10 (100.0%) |
| 45 to 54 Years | 16 (53.3%) | 14 (46.7%) |
| 55 to 64 Years | 29 (72.5%) | 0 (0.0%) |
| 65 to 74 Years | 19 (100.0%) | 0 (0.0%) |
| 75 Years and over | 42 (100.0%) | 0 (0.0%) |
| Total | 118 (65.2%) | 52 (28.7%) |
Disability Status by Sex by Age in Three Rocks
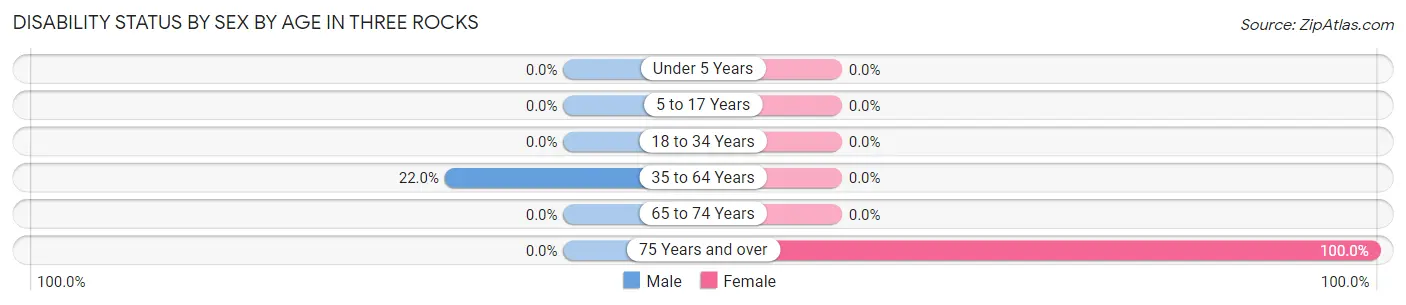
| Age Bracket | Male | Female |
| Under 5 Years | 0 (0.0%) | 0 (0.0%) |
| 5 to 17 Years | 0 (0.0%) | 0 (0.0%) |
| 18 to 34 Years | 0 (0.0%) | 0 (0.0%) |
| 35 to 64 Years | 11 (22.0%) | 0 (0.0%) |
| 65 to 74 Years | 0 (0.0%) | 0 (0.0%) |
| 75 Years and over | 0 (0.0%) | 42 (100.0%) |
Disability Class by Sex by Age in Three Rocks
Disability Class: Hearing Difficulty
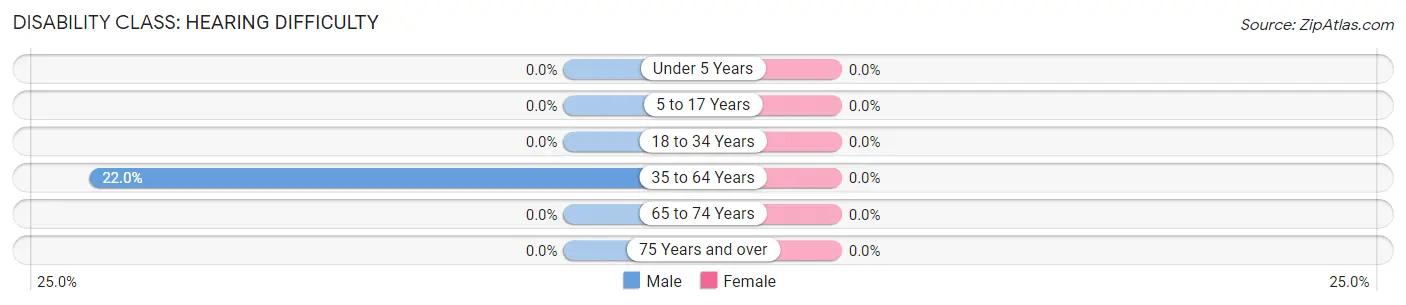
| Age Bracket | Male | Female |
| Under 5 Years | 0 (0.0%) | 0 (0.0%) |
| 5 to 17 Years | 0 (0.0%) | 0 (0.0%) |
| 18 to 34 Years | 0 (0.0%) | 0 (0.0%) |
| 35 to 64 Years | 11 (22.0%) | 0 (0.0%) |
| 65 to 74 Years | 0 (0.0%) | 0 (0.0%) |
| 75 Years and over | 0 (0.0%) | 0 (0.0%) |
Disability Class: Vision Difficulty
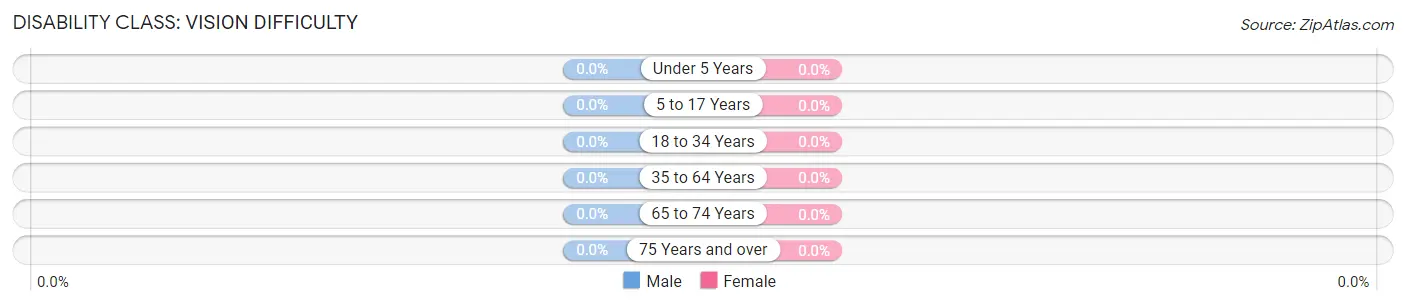
| Age Bracket | Male | Female |
| Under 5 Years | 0 (0.0%) | 0 (0.0%) |
| 5 to 17 Years | 0 (0.0%) | 0 (0.0%) |
| 18 to 34 Years | 0 (0.0%) | 0 (0.0%) |
| 35 to 64 Years | 0 (0.0%) | 0 (0.0%) |
| 65 to 74 Years | 0 (0.0%) | 0 (0.0%) |
| 75 Years and over | 0 (0.0%) | 0 (0.0%) |
Disability Class: Cognitive Difficulty
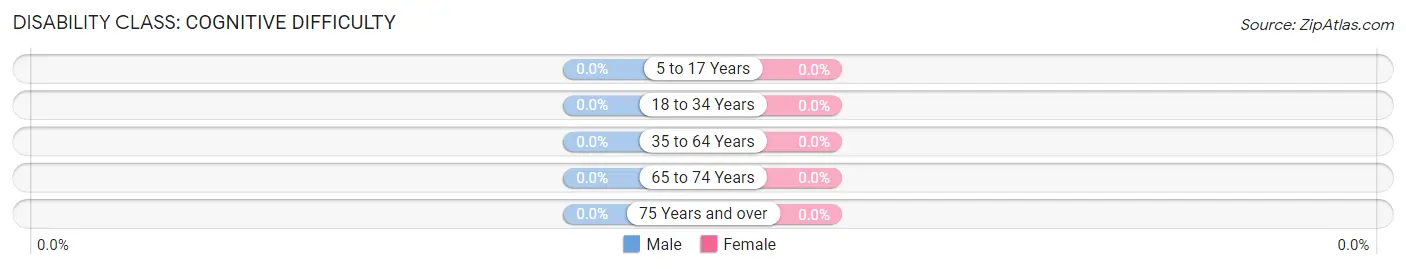
| Age Bracket | Male | Female |
| 5 to 17 Years | 0 (0.0%) | 0 (0.0%) |
| 18 to 34 Years | 0 (0.0%) | 0 (0.0%) |
| 35 to 64 Years | 0 (0.0%) | 0 (0.0%) |
| 65 to 74 Years | 0 (0.0%) | 0 (0.0%) |
| 75 Years and over | 0 (0.0%) | 0 (0.0%) |
Disability Class: Ambulatory Difficulty
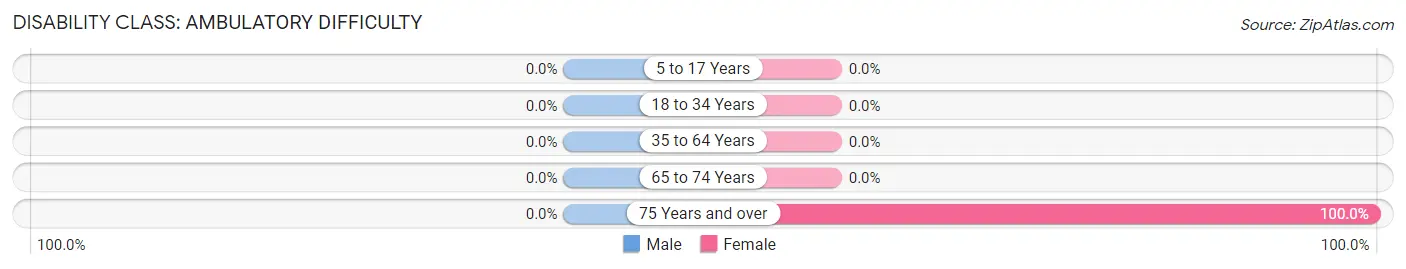
| Age Bracket | Male | Female |
| 5 to 17 Years | 0 (0.0%) | 0 (0.0%) |
| 18 to 34 Years | 0 (0.0%) | 0 (0.0%) |
| 35 to 64 Years | 0 (0.0%) | 0 (0.0%) |
| 65 to 74 Years | 0 (0.0%) | 0 (0.0%) |
| 75 Years and over | 0 (0.0%) | 42 (100.0%) |
Disability Class: Self-Care Difficulty
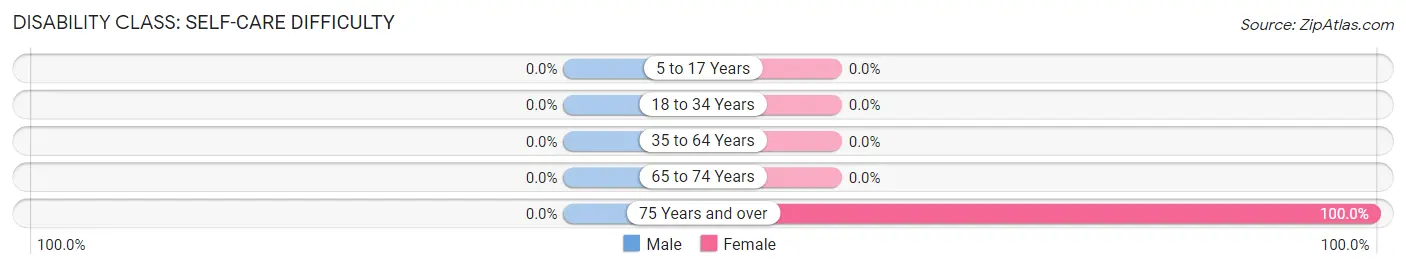
| Age Bracket | Male | Female |
| 5 to 17 Years | 0 (0.0%) | 0 (0.0%) |
| 18 to 34 Years | 0 (0.0%) | 0 (0.0%) |
| 35 to 64 Years | 0 (0.0%) | 0 (0.0%) |
| 65 to 74 Years | 0 (0.0%) | 0 (0.0%) |
| 75 Years and over | 0 (0.0%) | 42 (100.0%) |
Technology Access in Three Rocks
Computing Device Access in Three Rocks
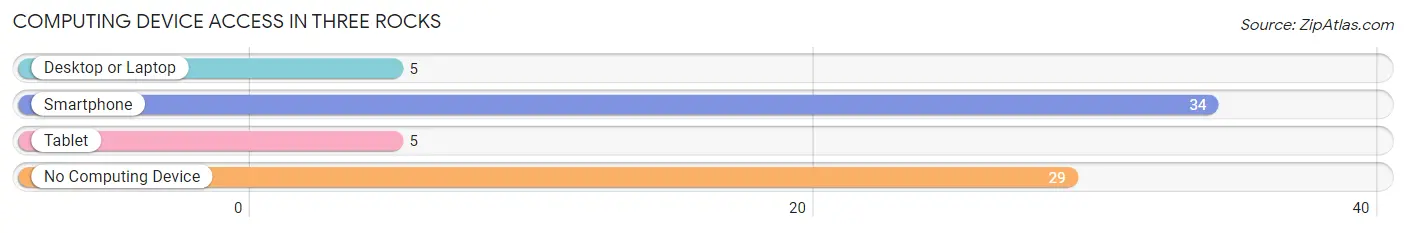
| Device Type | # Households | % Households |
| Desktop or Laptop | 5 | 7.9% |
| Smartphone | 34 | 54.0% |
| Tablet | 5 | 7.9% |
| No Computing Device | 29 | 46.0% |
| Total | 63 | 100.0% |
Internet Access in Three Rocks
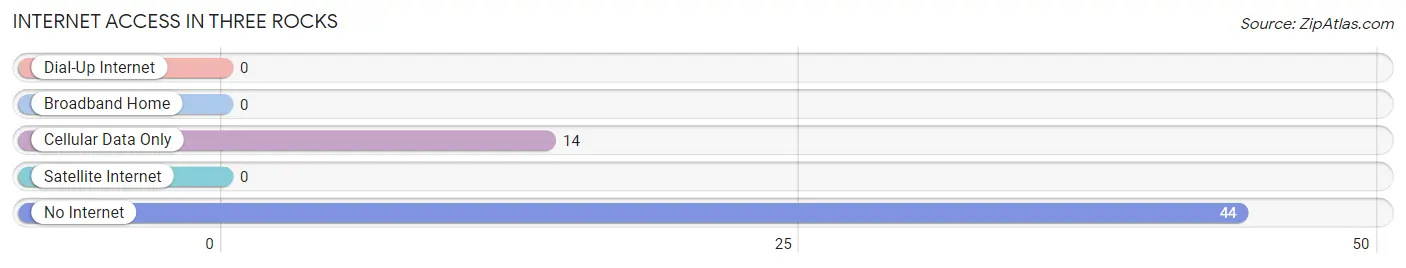
| Internet Type | # Households | % Households |
| Dial-Up Internet | 0 | 0.0% |
| Broadband Home | 0 | 0.0% |
| Cellular Data Only | 14 | 22.2% |
| Satellite Internet | 0 | 0.0% |
| No Internet | 44 | 69.8% |
| Total | 63 | 100.0% |
Three Rocks Summary
History
Three Rocks is a small unincorporated community located in the foothills of the Sierra Nevada Mountains in California. It is situated in the Sierra Valley, which is part of the Great Basin region of the United States. The area was first settled by Native Americans, who used the area for hunting and gathering. The first European settlers arrived in the area in the late 1800s, and the town was officially established in 1891.
The town was named after three large rocks that were located near the original settlement. The rocks were used as a landmark for travelers and settlers, and the town was named after them.
The town was originally a farming and ranching community, and the main crops grown were wheat, barley, and hay. The town also had a small sawmill, which provided lumber for the local area.
In the early 1900s, the town began to grow and develop. A post office was established in 1910, and the town was incorporated in 1911. The town also had a school, a general store, and a few other businesses.
In the 1950s, the town began to decline as the local economy shifted away from agriculture. The sawmill closed in the 1960s, and the post office closed in the 1970s. The town has since become a small, quiet community.
Geography
Three Rocks is located in the Sierra Valley, which is part of the Great Basin region of the United States. The town is situated at an elevation of 4,000 feet, and is surrounded by the Sierra Nevada Mountains. The area is known for its dry climate, with hot summers and cold winters.
The town is located near the Feather River, which is a major tributary of the Sacramento River. The river provides a source of water for the local area, and is also used for recreational activities such as fishing and boating.
The town is located near the Plumas National Forest, which is a popular destination for outdoor activities such as camping, hiking, and fishing. The forest is also home to a variety of wildlife, including deer, bear, and mountain lions.
Economy
The economy of Three Rocks is largely based on agriculture and tourism. The town is home to several small farms, which produce a variety of crops such as wheat, barley, hay, and alfalfa. The town also has a few small businesses, such as a general store and a gas station.
The town is also a popular destination for tourists, who come to enjoy the area’s natural beauty and outdoor activities. The nearby Plumas National Forest is a popular destination for camping, hiking, and fishing. The town also has a few small restaurants and lodging options.
Demographics
As of the 2010 census, the population of Three Rocks was 545. The town is predominantly white, with a small Hispanic population. The median age of the population is 44.7 years, and the median household income is $41,250.
The town is served by the Plumas Unified School District, which operates a K-8 school in the town. The town also has a small library, which is operated by the Plumas County Library System.
Common Questions
What is Per Capita Income in Three Rocks?
Per Capita income in Three Rocks is $18,513.
What is Inequality or Gini Index in Three Rocks?
Inequality or Gini Index in Three Rocks is 0.38.
What is the Total Population of Three Rocks?
Total Population of Three Rocks is 181.
What is the Total Male Population of Three Rocks?
Total Male Population of Three Rocks is 80.
What is the Total Female Population of Three Rocks?
Total Female Population of Three Rocks is 101.
What is the Ratio of Males per 100 Females in Three Rocks?
There are 79.21 Males per 100 Females in Three Rocks.
What is the Ratio of Females per 100 Males in Three Rocks?
There are 126.25 Females per 100 Males in Three Rocks.
What is the Median Population Age in Three Rocks?
Median Population Age in Three Rocks is 56.0 Years.
What is the Average Family Size in Three Rocks
Average Family Size in Three Rocks is 3.6 People.
What is the Average Household Size in Three Rocks
Average Household Size in Three Rocks is 2.9 People.
How Large is the Labor Force in Three Rocks?
There are 76 People in the Labor Forcein in Three Rocks.
What is the Percentage of People in the Labor Force in Three Rocks?
44.7% of People are in the Labor Force in Three Rocks.
What is the Unemployment Rate in Three Rocks?
Unemployment Rate in Three Rocks is 7.9%.