Cities with the Highest Unemployment Rate Amomg Youth Under the Age of 25 in Nevada

RELATED REPORTS & OPTIONS

Highest Unemployment | Youth < 25
Population
Families and Households
Female Fertility
Female Fertility (Unmarried)
Race (Community Size)
Race (Percentage)
Ancestry (Community Size)
AfghanAfricanAlaska NativeAlaskan AthabascanAlbanianAleutAlsatianAmericanApacheArabArapahoArgentineanArmenianAssyrian / Chaldean / SyriacAustralianAustrianBahamianBangladeshiBarbadianBasqueBelgianBelizeanBermudanBhutaneseBlackfeetBolivianBrazilianBritishBritish West IndianBulgarianBurmeseCajunCambodianCanadianCape VerdeanCarpatho RusynCelticCentral AmericanCentral American IndianCherokeeCheyenneChickasawChileanChineseChippewaChoctawColombianColvilleComancheCosta RicanCreeCreekCroatianCrowCubanCypriotCzechCzechoslovakianDanishDelawareDominicanDutchDutch West IndianEastern EuropeanEcuadorianEgyptianEnglishEstonianEthiopianEuropeanFijianFilipinoFinnishFrenchFrench American IndianFrench CanadianGermanGerman RussianGhanaianGreekGuamanian / ChamorroGuatemalanGuyaneseHaitianHmongHonduranHopiHoumaHungarianIcelanderIndian (Asian)IndonesianInupiatIranianIraqiIrishIroquoisIsraeliItalianJamaicanJapaneseJordanianKenyanKiowaKoreanLaotianLatvianLebaneseLiberianLithuanianLumbeeLuxembourgerMacedonianMalaysianMalteseMarshalleseMenomineeMexicanMexican American IndianMongolianMoroccanNative HawaiianNavajoNepaleseNew ZealanderNicaraguanNigerianNorthern EuropeanNorwegianOkinawanOsageOttawaPaiutePakistaniPalestinianPanamanianParaguayanPennsylvania GermanPeruvianPimaPolishPortuguesePotawatomiPuebloPuerto RicanPuget Sound SalishRomanianRussianSalvadoranSamoanScandinavianScotch-IrishScottishSeminoleSenegaleseSerbianShoshoneSierra LeoneanSiouxSlavicSlovakSloveneSomaliSouth AfricanSouth AmericanSouth American IndianSoviet UnionSpaniardSpanishSpanish AmericanSpanish American IndianSri LankanSubsaharan AfricanSudaneseSwedishSwissSyrianTaiwaneseThaiTlingit-HaidaTohono O'OdhamTonganTrinidadian and TobagonianTsimshianTurkishU.S. Virgin IslanderUgandanUkrainianUruguayanUteVenezuelanVietnameseWelshWest IndianYakamaYaquiYugoslavianYumanYup'ikZimbabwean
Ancestry (Percentage)
AfghanAfricanAlaska NativeAlaskan AthabascanAlbanianAleutAlsatianAmericanApacheArabArapahoArgentineanArmenianAssyrian / Chaldean / SyriacAustralianAustrianBahamianBangladeshiBarbadianBasqueBelgianBelizeanBermudanBhutaneseBlackfeetBolivianBrazilianBritishBritish West IndianBulgarianBurmeseCajunCambodianCanadianCape VerdeanCarpatho RusynCelticCentral AmericanCentral American IndianCherokeeCheyenneChickasawChileanChineseChippewaChoctawColombianColvilleComancheCosta RicanCreeCreekCroatianCrowCubanCypriotCzechCzechoslovakianDanishDelawareDominicanDutchDutch West IndianEastern EuropeanEcuadorianEgyptianEnglishEstonianEthiopianEuropeanFijianFilipinoFinnishFrenchFrench American IndianFrench CanadianGermanGerman RussianGhanaianGreekGuamanian / ChamorroGuatemalanGuyaneseHaitianHmongHonduranHopiHoumaHungarianIcelanderIndian (Asian)IndonesianInupiatIranianIraqiIrishIroquoisIsraeliItalianJamaicanJapaneseJordanianKenyanKiowaKoreanLaotianLatvianLebaneseLiberianLithuanianLumbeeLuxembourgerMacedonianMalaysianMalteseMarshalleseMenomineeMexicanMexican American IndianMongolianMoroccanNative HawaiianNavajoNepaleseNew ZealanderNicaraguanNigerianNorthern EuropeanNorwegianOkinawanOsageOttawaPaiutePakistaniPalestinianPanamanianParaguayanPennsylvania GermanPeruvianPimaPolishPortuguesePotawatomiPuebloPuerto RicanPuget Sound SalishRomanianRussianSalvadoranSamoanScandinavianScotch-IrishScottishSeminoleSenegaleseSerbianShoshoneSierra LeoneanSiouxSlavicSlovakSloveneSomaliSouth AfricanSouth AmericanSouth American IndianSoviet UnionSpaniardSpanishSpanish AmericanSpanish American IndianSri LankanSubsaharan AfricanSudaneseSwedishSwissSyrianTaiwaneseThaiTlingit-HaidaTohono O'OdhamTonganTrinidadian and TobagonianTsimshianTurkishU.S. Virgin IslanderUgandanUkrainianUruguayanUteVenezuelanVietnameseWelshWest IndianYakamaYaquiYugoslavianYumanYup'ikZimbabwean
Immigrant Origin (Total)
AfghanistanAfricaAlbaniaArgentinaArmeniaAsiaAustraliaAustriaAzoresBahamasBangladeshBarbadosBelarusBelgiumBelizeBoliviaBosnia and HerzegovinaBrazilBulgariaBurma / MyanmarCabo VerdeCambodiaCameroonCanadaCaribbeanCentral AmericaChileChinaColombiaCongoCosta RicaCroatiaCubaCzechoslovakiaDenmarkDominicaDominican RepublicEastern AfricaEastern AsiaEastern EuropeEcuadorEgyptEl SalvadorEnglandEritreaEthiopiaEuropeFijiFranceGermanyGhanaGreeceGrenadaGuatemalaGuyanaHaitiHondurasHong KongHungaryIndiaIndonesiaIranIraqIrelandIsraelItalyJamaicaJapanJordanKazakhstanKenyaKoreaKuwaitLaosLatin AmericaLatviaLebanonLiberiaLithuaniaMalaysiaMexicoMicronesiaMiddle AfricaMoldovaMoroccoNepalNetherlandsNicaraguaNigeriaNorth MacedoniaNorthern AfricaNorthern EuropeNorwayOceaniaPakistanPanamaPeruPhilippinesPolandPortugalRomaniaRussiaSaudi ArabiaScotlandSenegalSerbiaSierra LeoneSingaporeSomaliaSouth AfricaSouth AmericaSouth Central AsiaSouth Eastern AsiaSouthern EuropeSpainSri LankaSt. Vincent and the GrenadinesSudanSwedenSwitzerlandSyriaTaiwanThailandTrinidad and TobagoTurkeyUgandaUkraineUruguayUzbekistanVenezuelaVietnamWest IndiesWestern AfricaWestern AsiaWestern EuropeYemenZaireZimbabwe
Immigrant Origin (Percentage)
AfghanistanAfricaAlbaniaArgentinaArmeniaAsiaAustraliaAustriaAzoresBahamasBangladeshBarbadosBelarusBelgiumBelizeBoliviaBosnia and HerzegovinaBrazilBulgariaBurma / MyanmarCabo VerdeCambodiaCameroonCanadaCaribbeanCentral AmericaChileChinaColombiaCongoCosta RicaCroatiaCubaCzechoslovakiaDenmarkDominicaDominican RepublicEastern AfricaEastern AsiaEastern EuropeEcuadorEgyptEl SalvadorEnglandEritreaEthiopiaEuropeFijiFranceGermanyGhanaGreeceGrenadaGuatemalaGuyanaHaitiHondurasHong KongHungaryIndiaIndonesiaIranIraqIrelandIsraelItalyJamaicaJapanJordanKazakhstanKenyaKoreaKuwaitLaosLatin AmericaLatviaLebanonLiberiaLithuaniaMalaysiaMexicoMicronesiaMiddle AfricaMoldovaMoroccoNepalNetherlandsNicaraguaNigeriaNorth MacedoniaNorthern AfricaNorthern EuropeNorwayOceaniaPakistanPanamaPeruPhilippinesPolandPortugalRomaniaRussiaSaudi ArabiaScotlandSenegalSerbiaSierra LeoneSingaporeSomaliaSouth AfricaSouth AmericaSouth Central AsiaSouth Eastern AsiaSouthern EuropeSpainSri LankaSt. Vincent and the GrenadinesSudanSwedenSwitzerlandSyriaTaiwanThailandTrinidad and TobagoTurkeyUgandaUkraineUruguayUzbekistanVenezuelaVietnamWest IndiesWestern AfricaWestern AsiaWestern EuropeYemenZaireZimbabwe
Income
Income (Families)
Income (Households)
Poverty
Poverty (Families)
Unemployment
Employment Occupations
Employment Industries
Employer Class
Commute Time
Commute Means
School Enrollment
Education by Degree Field
Occupancy
Finances
Physical Characteristics
Nevada
Compare Cities
Comparison Subject

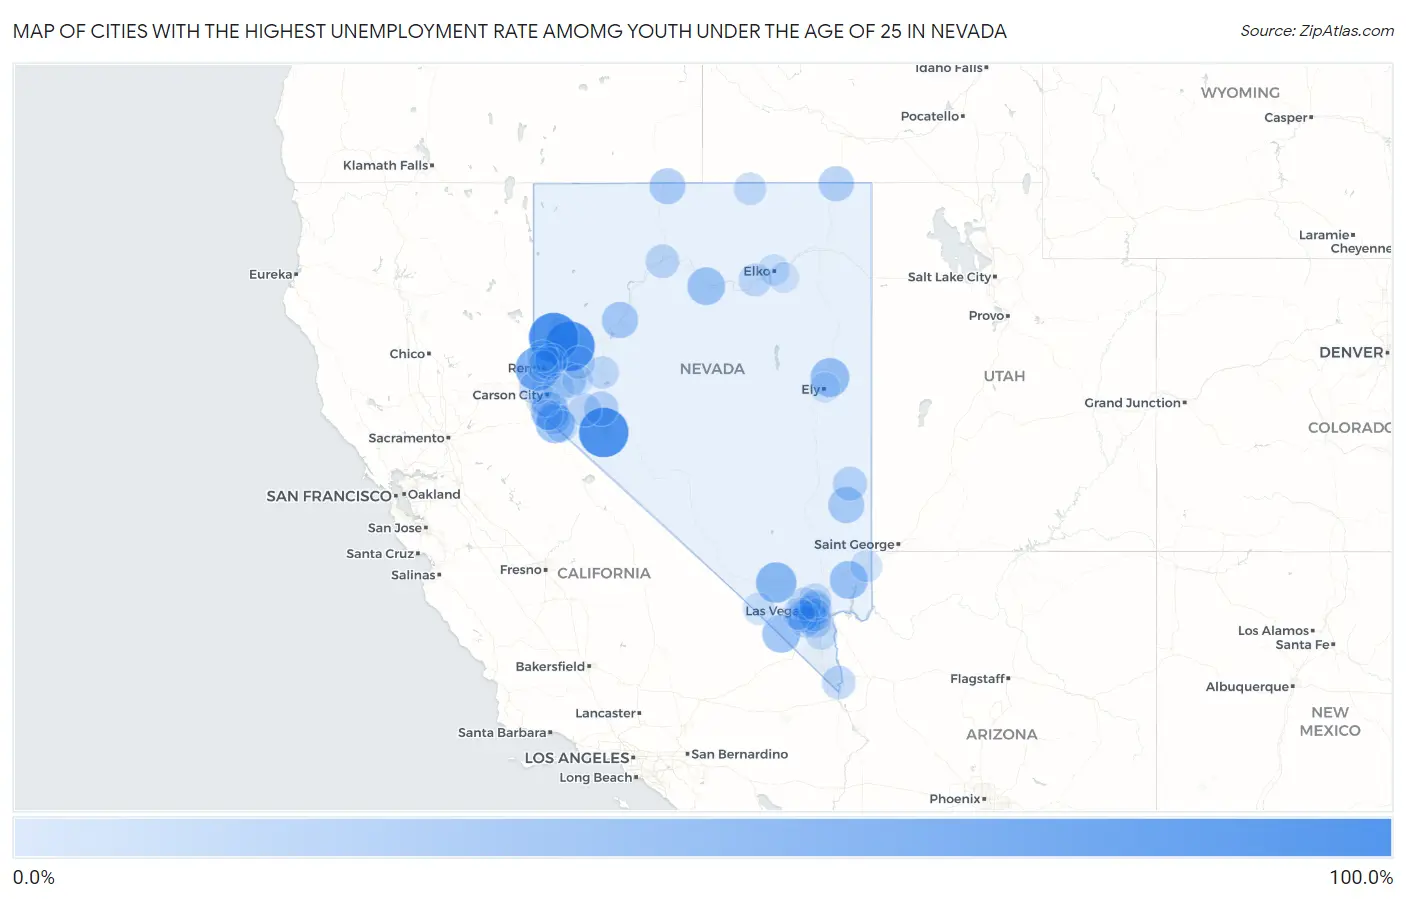
Map of Cities with the Highest Unemployment Rate Amomg Youth Under the Age of 25 in Nevada

0.0%
100.0%
Cities with the Highest Unemployment Rate Amomg Youth Under the Age of 25 in Nevada Map

Cities with the Highest Unemployment Rate Amomg Youth Under the Age of 25 in Nevada

City Youth Unemployment vs State vs National
1.Walker Lake100.0%12.3%(+87.7)#110.9%(+89.1)#123
2.Nixon100.0%12.3%(+87.7)#210.9%(+89.1)#131
3.Sutcliffe100.0%12.3%(+87.7)#310.9%(+89.1)#153
4.Mogul69.9%12.3%(+57.6)#410.9%(+59.0)#585
5.Indian Springs52.2%12.3%(+39.9)#510.9%(+41.3)#1,017
6.Mcgill43.3%12.3%(+31.0)#610.9%(+32.4)#1,469
7.Double Spring42.8%12.3%(+30.5)#710.9%(+31.9)#1,517
8.East Valley41.6%12.3%(+29.3)#810.9%(+30.7)#1,588
9.Moapa Valley39.5%12.3%(+27.2)#910.9%(+28.6)#1,745
10.Sandy Valley39.2%12.3%(+26.9)#1010.9%(+28.3)#1,765
11.Battle Mountain38.0%12.3%(+25.7)#1110.9%(+27.1)#1,848
12.Lovelock31.2%12.3%(+18.9)#1210.9%(+20.3)#2,538
13.Caliente29.9%12.3%(+17.6)#1310.9%(+19.0)#2,703
14.Fort Mcdermitt28.5%12.3%(+16.2)#1410.9%(+17.6)#2,890
15.Stagecoach25.5%12.3%(+13.2)#1510.9%(+14.6)#3,391
16.Jackpot24.5%12.3%(+12.2)#1610.9%(+13.6)#3,611
17.Schurz21.7%12.3%(+9.40)#1710.9%(+10.8)#4,257
18.Pioche19.7%12.3%(+7.40)#1810.9%(+8.80)#4,831
19.Carter Springs18.7%12.3%(+6.40)#1910.9%(+7.80)#5,154
20.Incline Village18.3%12.3%(+6.00)#2010.9%(+7.40)#5,251
21.Winnemucca17.4%12.3%(+5.10)#2110.9%(+6.50)#5,641
22.Laughlin16.8%12.3%(+4.50)#2210.9%(+5.90)#5,861
23.Yerington15.0%12.3%(+2.70)#2310.9%(+4.10)#6,674
24.Paradise14.9%12.3%(+2.60)#2410.9%(+4.00)#6,699
25.Sunrise Manor14.6%12.3%(+2.30)#2510.9%(+3.70)#6,862
26.Winchester14.3%12.3%(+2.00)#2610.9%(+3.40)#6,993
27.Henderson14.2%12.3%(+1.90)#2710.9%(+3.30)#7,029
28.North Las Vegas13.8%12.3%(+1.50)#2810.9%(+2.90)#7,287
29.Sparks13.8%12.3%(+1.50)#2910.9%(+2.90)#7,289
30.Carlin13.2%12.3%(+0.900)#3010.9%(+2.30)#7,708
31.Enterprise13.1%12.3%(+0.800)#3110.9%(+2.20)#7,725
32.Whitney12.8%12.3%(+0.500)#3210.9%(+1.90)#7,906
33.Fallon12.4%12.3%(+0.100)#3310.9%(+1.50)#8,185
34.Fernley12.2%12.3%(-0.100)#3410.9%(+1.30)#8,288
35.Las Vegas12.1%12.3%(-0.200)#3510.9%(+1.20)#8,327
36.Spring Valley12.1%12.3%(-0.200)#3610.9%(+1.20)#8,329
37.Owyhee11.7%12.3%(-0.600)#3710.9%(+0.800)#8,608
38.Sun Valley10.8%12.3%(-1.50)#3810.9%(-0.100)#9,184
39.Spanish Springs10.6%12.3%(-1.70)#3910.9%(-0.300)#9,321
40.Summerlin South10.5%12.3%(-1.80)#4010.9%(-0.400)#9,387
41.Topaz Ranch Estates10.2%12.3%(-2.10)#4110.9%(-0.700)#9,678
42.Pahrump9.7%12.3%(-2.60)#4210.9%(-1.20)#10,021
43.Boulder City9.0%12.3%(-3.30)#4310.9%(-1.90)#10,561
44.Mesquite8.8%12.3%(-3.50)#4410.9%(-2.10)#10,740
45.Reno8.6%12.3%(-3.70)#4510.9%(-2.30)#10,896
46.Carson8.2%12.3%(-4.10)#4610.9%(-2.70)#11,257
47.Lemmon Valley7.9%12.3%(-4.40)#4710.9%(-3.00)#11,493
48.Dayton6.7%12.3%(-5.60)#4810.9%(-4.20)#12,415
49.Elko6.5%12.3%(-5.80)#4910.9%(-4.40)#12,563
50.Nellis Afb6.4%12.3%(-5.90)#5010.9%(-4.50)#12,655
51.Indian Hills5.6%12.3%(-6.70)#5110.9%(-5.30)#13,297
52.Silver Springs4.1%12.3%(-8.20)#5210.9%(-6.80)#14,406
53.Spring Creek3.2%12.3%(-9.10)#5310.9%(-7.70)#14,977
54.Gardnerville Ranchos2.4%12.3%(-9.90)#5410.9%(-8.50)#15,499
55.Ely2.4%12.3%(-9.90)#5510.9%(-8.50)#15,517

Common Questions

What are the Top 10 Cities with the Highest Unemployment Rate Amomg Youth Under the Age of 25 in Nevada?
Top 10 Cities with the Highest Unemployment Rate Amomg Youth Under the Age of 25 in Nevada are:
#1
100.0%
#2
100.0%
#3
100.0%
#4
69.9%
#5
52.2%
#6
43.3%
#7
42.8%
#8
41.6%
#9
39.5%
#10
39.2%
What city has the Highest Unemployment Rate Amomg Youth Under the Age of 25 in Nevada?
Walker Lake has the Highest Unemployment Rate Amomg Youth Under the Age of 25 in Nevada with 100.0%.
What is the Unemployment Rate Amomg Youth Under the Age of 25 in the State of Nevada?
Unemployment Rate Amomg Youth Under the Age of 25 in Nevada is 12.3%.
What is the Unemployment Rate Amomg Youth Under the Age of 25 in the United States?
Unemployment Rate Amomg Youth Under the Age of 25 in the United States is 10.9%.