Cities with the Highest Unemployment Rate Amomg Youth Under the Age of 25 in Delaware

RELATED REPORTS & OPTIONS

Highest Unemployment | Youth < 25
Population
Families and Households
Female Fertility
Female Fertility (Unmarried)
Race (Community Size)
Race (Percentage)
Ancestry (Community Size)
AfghanAfricanAlaska NativeAlaskan AthabascanAlbanianAleutAlsatianAmericanApacheArabArapahoArgentineanArmenianAssyrian / Chaldean / SyriacAustralianAustrianBahamianBangladeshiBarbadianBasqueBelgianBelizeanBermudanBhutaneseBlackfeetBolivianBrazilianBritishBritish West IndianBulgarianBurmeseCajunCambodianCanadianCape VerdeanCarpatho RusynCelticCentral AmericanCentral American IndianCherokeeCheyenneChickasawChileanChineseChippewaChoctawColombianColvilleComancheCosta RicanCreeCreekCroatianCrowCubanCypriotCzechCzechoslovakianDanishDelawareDominicanDutchDutch West IndianEastern EuropeanEcuadorianEgyptianEnglishEstonianEthiopianEuropeanFijianFilipinoFinnishFrenchFrench American IndianFrench CanadianGermanGerman RussianGhanaianGreekGuamanian / ChamorroGuatemalanGuyaneseHaitianHmongHonduranHopiHoumaHungarianIcelanderIndian (Asian)IndonesianInupiatIranianIraqiIrishIroquoisIsraeliItalianJamaicanJapaneseJordanianKenyanKiowaKoreanLaotianLatvianLebaneseLiberianLithuanianLumbeeLuxembourgerMacedonianMalaysianMalteseMarshalleseMenomineeMexicanMexican American IndianMongolianMoroccanNative HawaiianNavajoNepaleseNew ZealanderNicaraguanNigerianNorthern EuropeanNorwegianOkinawanOsageOttawaPaiutePakistaniPalestinianPanamanianParaguayanPennsylvania GermanPeruvianPimaPolishPortuguesePotawatomiPuebloPuerto RicanPuget Sound SalishRomanianRussianSalvadoranSamoanScandinavianScotch-IrishScottishSeminoleSenegaleseSerbianShoshoneSierra LeoneanSiouxSlavicSlovakSloveneSomaliSouth AfricanSouth AmericanSouth American IndianSoviet UnionSpaniardSpanishSpanish AmericanSpanish American IndianSri LankanSubsaharan AfricanSudaneseSwedishSwissSyrianTaiwaneseThaiTlingit-HaidaTohono O'OdhamTonganTrinidadian and TobagonianTsimshianTurkishU.S. Virgin IslanderUgandanUkrainianUruguayanUteVenezuelanVietnameseWelshWest IndianYakamaYaquiYugoslavianYumanYup'ikZimbabwean
Ancestry (Percentage)
AfghanAfricanAlaska NativeAlaskan AthabascanAlbanianAleutAlsatianAmericanApacheArabArapahoArgentineanArmenianAssyrian / Chaldean / SyriacAustralianAustrianBahamianBangladeshiBarbadianBasqueBelgianBelizeanBermudanBhutaneseBlackfeetBolivianBrazilianBritishBritish West IndianBulgarianBurmeseCajunCambodianCanadianCape VerdeanCarpatho RusynCelticCentral AmericanCentral American IndianCherokeeCheyenneChickasawChileanChineseChippewaChoctawColombianColvilleComancheCosta RicanCreeCreekCroatianCrowCubanCypriotCzechCzechoslovakianDanishDelawareDominicanDutchDutch West IndianEastern EuropeanEcuadorianEgyptianEnglishEstonianEthiopianEuropeanFijianFilipinoFinnishFrenchFrench American IndianFrench CanadianGermanGerman RussianGhanaianGreekGuamanian / ChamorroGuatemalanGuyaneseHaitianHmongHonduranHopiHoumaHungarianIcelanderIndian (Asian)IndonesianInupiatIranianIraqiIrishIroquoisIsraeliItalianJamaicanJapaneseJordanianKenyanKiowaKoreanLaotianLatvianLebaneseLiberianLithuanianLumbeeLuxembourgerMacedonianMalaysianMalteseMarshalleseMenomineeMexicanMexican American IndianMongolianMoroccanNative HawaiianNavajoNepaleseNew ZealanderNicaraguanNigerianNorthern EuropeanNorwegianOkinawanOsageOttawaPaiutePakistaniPalestinianPanamanianParaguayanPennsylvania GermanPeruvianPimaPolishPortuguesePotawatomiPuebloPuerto RicanPuget Sound SalishRomanianRussianSalvadoranSamoanScandinavianScotch-IrishScottishSeminoleSenegaleseSerbianShoshoneSierra LeoneanSiouxSlavicSlovakSloveneSomaliSouth AfricanSouth AmericanSouth American IndianSoviet UnionSpaniardSpanishSpanish AmericanSpanish American IndianSri LankanSubsaharan AfricanSudaneseSwedishSwissSyrianTaiwaneseThaiTlingit-HaidaTohono O'OdhamTonganTrinidadian and TobagonianTsimshianTurkishU.S. Virgin IslanderUgandanUkrainianUruguayanUteVenezuelanVietnameseWelshWest IndianYakamaYaquiYugoslavianYumanYup'ikZimbabwean
Immigrant Origin (Total)
AfghanistanAfricaAlbaniaArgentinaArmeniaAsiaAustraliaAustriaAzoresBahamasBangladeshBarbadosBelarusBelgiumBelizeBoliviaBosnia and HerzegovinaBrazilBulgariaBurma / MyanmarCabo VerdeCambodiaCameroonCanadaCaribbeanCentral AmericaChileChinaColombiaCongoCosta RicaCroatiaCubaCzechoslovakiaDenmarkDominicaDominican RepublicEastern AfricaEastern AsiaEastern EuropeEcuadorEgyptEl SalvadorEnglandEritreaEthiopiaEuropeFijiFranceGermanyGhanaGreeceGrenadaGuatemalaGuyanaHaitiHondurasHong KongHungaryIndiaIndonesiaIranIraqIrelandIsraelItalyJamaicaJapanJordanKazakhstanKenyaKoreaKuwaitLaosLatin AmericaLatviaLebanonLiberiaLithuaniaMalaysiaMexicoMicronesiaMiddle AfricaMoldovaMoroccoNepalNetherlandsNicaraguaNigeriaNorth MacedoniaNorthern AfricaNorthern EuropeNorwayOceaniaPakistanPanamaPeruPhilippinesPolandPortugalRomaniaRussiaSaudi ArabiaScotlandSenegalSerbiaSierra LeoneSingaporeSomaliaSouth AfricaSouth AmericaSouth Central AsiaSouth Eastern AsiaSouthern EuropeSpainSri LankaSt. Vincent and the GrenadinesSudanSwedenSwitzerlandSyriaTaiwanThailandTrinidad and TobagoTurkeyUgandaUkraineUruguayUzbekistanVenezuelaVietnamWest IndiesWestern AfricaWestern AsiaWestern EuropeYemenZaireZimbabwe
Immigrant Origin (Percentage)
AfghanistanAfricaAlbaniaArgentinaArmeniaAsiaAustraliaAustriaAzoresBahamasBangladeshBarbadosBelarusBelgiumBelizeBoliviaBosnia and HerzegovinaBrazilBulgariaBurma / MyanmarCabo VerdeCambodiaCameroonCanadaCaribbeanCentral AmericaChileChinaColombiaCongoCosta RicaCroatiaCubaCzechoslovakiaDenmarkDominicaDominican RepublicEastern AfricaEastern AsiaEastern EuropeEcuadorEgyptEl SalvadorEnglandEritreaEthiopiaEuropeFijiFranceGermanyGhanaGreeceGrenadaGuatemalaGuyanaHaitiHondurasHong KongHungaryIndiaIndonesiaIranIraqIrelandIsraelItalyJamaicaJapanJordanKazakhstanKenyaKoreaKuwaitLaosLatin AmericaLatviaLebanonLiberiaLithuaniaMalaysiaMexicoMicronesiaMiddle AfricaMoldovaMoroccoNepalNetherlandsNicaraguaNigeriaNorth MacedoniaNorthern AfricaNorthern EuropeNorwayOceaniaPakistanPanamaPeruPhilippinesPolandPortugalRomaniaRussiaSaudi ArabiaScotlandSenegalSerbiaSierra LeoneSingaporeSomaliaSouth AfricaSouth AmericaSouth Central AsiaSouth Eastern AsiaSouthern EuropeSpainSri LankaSt. Vincent and the GrenadinesSudanSwedenSwitzerlandSyriaTaiwanThailandTrinidad and TobagoTurkeyUgandaUkraineUruguayUzbekistanVenezuelaVietnamWest IndiesWestern AfricaWestern AsiaWestern EuropeYemenZaireZimbabwe
Income
Income (Families)
Income (Households)
Poverty
Poverty (Families)
Unemployment
Employment Occupations
Employment Industries
Employer Class
Commute Time
Commute Means
School Enrollment
Education by Degree Field
Occupancy
Finances
Physical Characteristics
Delaware
Compare Cities
Comparison Subject

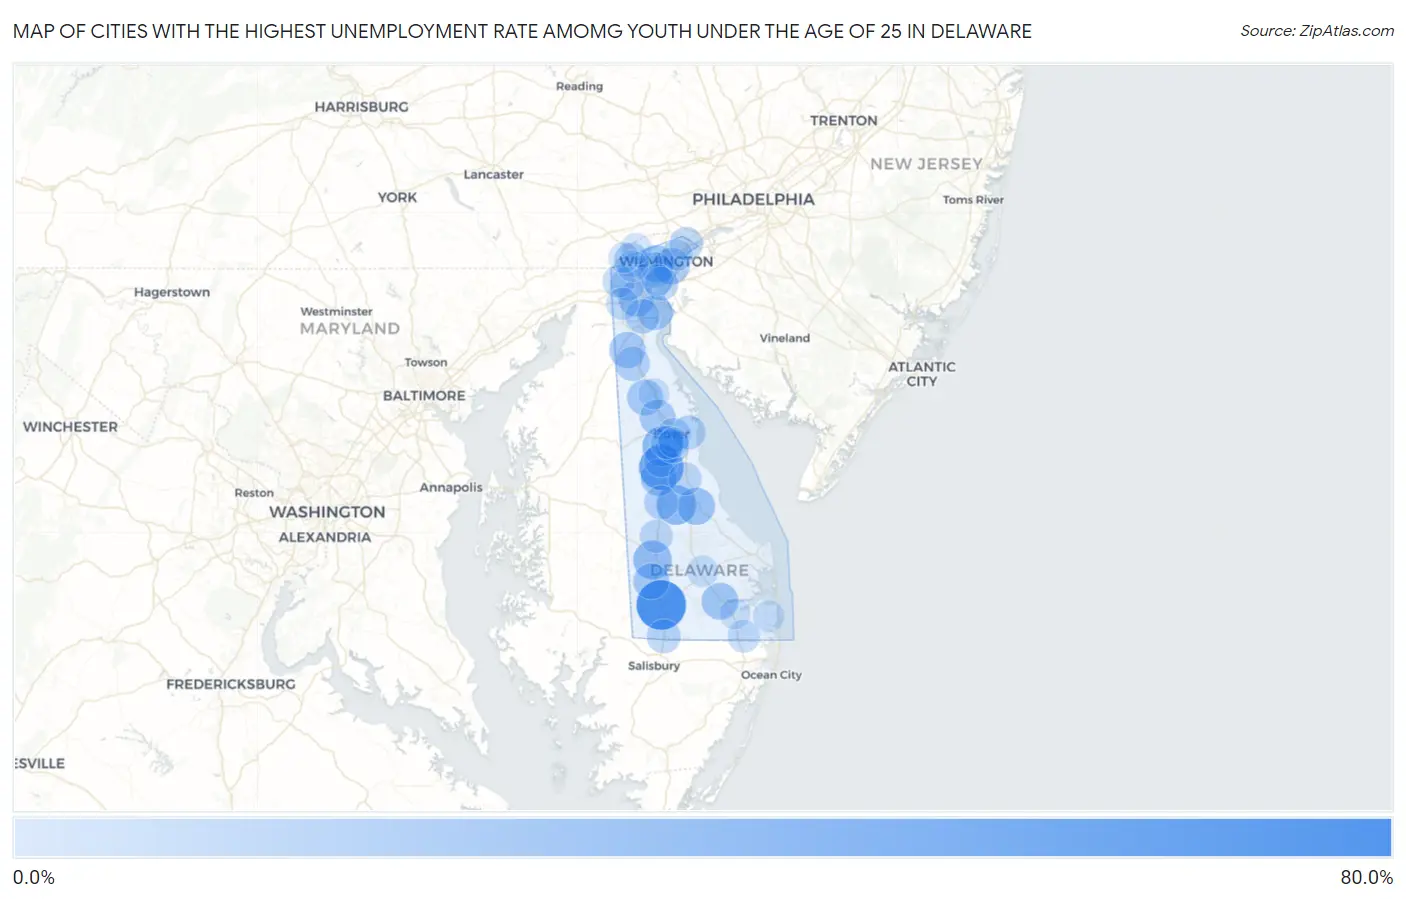
Map of Cities with the Highest Unemployment Rate Amomg Youth Under the Age of 25 in Delaware

0.0%
80.0%
Cities with the Highest Unemployment Rate Amomg Youth Under the Age of 25 in Delaware Map

Cities with the Highest Unemployment Rate Amomg Youth Under the Age of 25 in Delaware

City Youth Unemployment vs State vs National
1.Laurel67.5%11.7%(+55.8)#110.9%(+56.6)#620
2.Viola50.0%11.7%(+38.3)#210.9%(+39.1)#1,151
3.Wyoming33.8%11.7%(+22.1)#310.9%(+22.9)#2,217
4.Houston32.5%11.7%(+20.8)#410.9%(+21.6)#2,404
5.Bridgeville29.1%11.7%(+17.4)#510.9%(+18.2)#2,799
6.Milford24.6%11.7%(+12.9)#610.9%(+13.7)#3,578
7.Elsmere23.4%11.7%(+11.7)#710.9%(+12.5)#3,831
8.Felton22.6%11.7%(+10.9)#810.9%(+11.7)#4,031
9.Millsboro22.4%11.7%(+10.7)#910.9%(+11.5)#4,063
10.Wilmington21.6%11.7%(+9.90)#1010.9%(+10.7)#4,268
11.Middletown20.9%11.7%(+9.20)#1110.9%(+10.00)#4,462
12.Seaford19.9%11.7%(+8.20)#1210.9%(+9.00)#4,754
13.Clayton19.4%11.7%(+7.70)#1310.9%(+8.50)#4,900
14.Cheswold19.3%11.7%(+7.60)#1410.9%(+8.40)#4,944
15.Bear18.5%11.7%(+6.80)#1510.9%(+7.60)#5,196
16.Newport18.0%11.7%(+6.30)#1610.9%(+7.10)#5,391
17.Delaware City16.9%11.7%(+5.20)#1710.9%(+6.00)#5,840
18.St Georges14.9%11.7%(+3.20)#1810.9%(+4.00)#6,739
19.Townsend14.2%11.7%(+2.50)#1910.9%(+3.30)#7,065
20.Woodside14.2%11.7%(+2.50)#2010.9%(+3.30)#7,124
21.Pike Creek13.9%11.7%(+2.20)#2110.9%(+3.00)#7,255
22.Dover13.5%11.7%(+1.80)#2210.9%(+2.60)#7,514
23.Harrington13.5%11.7%(+1.80)#2310.9%(+2.60)#7,538
24.Brookside13.4%11.7%(+1.70)#2410.9%(+2.50)#7,574
25.New Castle12.8%11.7%(+1.10)#2510.9%(+1.90)#7,927
26.Delmar12.8%11.7%(+1.10)#2610.9%(+1.90)#7,933
27.Little Creek12.5%11.7%(+0.800)#2710.9%(+1.60)#8,142
28.Highland Acres11.7%11.7%(=0.000)#2810.9%(+0.800)#8,589
29.Claymont11.2%11.7%(-0.500)#2910.9%(+0.300)#8,906
30.Rodney Village10.5%11.7%(-1.20)#3010.9%(-0.400)#9,431
31.Greenwood10.3%11.7%(-1.40)#3110.9%(-0.600)#9,602
32.Frederica9.6%11.7%(-2.10)#3210.9%(-1.30)#10,145
33.Selbyville8.2%11.7%(-3.50)#3310.9%(-2.70)#11,292
34.Newark7.6%11.7%(-4.10)#3410.9%(-3.30)#11,691
35.Glasgow7.6%11.7%(-4.10)#3510.9%(-3.30)#11,701
36.Ocean View5.2%11.7%(-6.50)#3610.9%(-5.70)#13,623
37.Hockessin4.5%11.7%(-7.20)#3710.9%(-6.40)#14,102
38.Wilmington Manor4.5%11.7%(-7.20)#3810.9%(-6.40)#14,111
39.Georgetown4.4%11.7%(-7.30)#3910.9%(-6.50)#14,192
40.Pike Creek Valley4.1%11.7%(-7.60)#4010.9%(-6.80)#14,391
41.Bellefonte3.4%11.7%(-8.30)#4110.9%(-7.50)#14,891
42.Smyrna3.1%11.7%(-8.60)#4210.9%(-7.80)#15,051
43.North Star2.9%11.7%(-8.80)#4310.9%(-8.00)#15,191
44.Dagsboro2.7%11.7%(-9.00)#4410.9%(-8.20)#15,345
45.Kent Acres0.30%11.7%(-11.4)#4510.9%(-10.6)#16,175

Common Questions

What are the Top 10 Cities with the Highest Unemployment Rate Amomg Youth Under the Age of 25 in Delaware?
Top 10 Cities with the Highest Unemployment Rate Amomg Youth Under the Age of 25 in Delaware are:
#1
67.5%
#2
50.0%
#3
33.8%
#4
32.5%
#5
29.1%
#6
24.6%
#7
23.4%
#8
22.6%
#9
22.4%
#10
21.6%
What city has the Highest Unemployment Rate Amomg Youth Under the Age of 25 in Delaware?
Laurel has the Highest Unemployment Rate Amomg Youth Under the Age of 25 in Delaware with 67.5%.
What is the Unemployment Rate Amomg Youth Under the Age of 25 in the State of Delaware?
Unemployment Rate Amomg Youth Under the Age of 25 in Delaware is 11.7%.
What is the Unemployment Rate Amomg Youth Under the Age of 25 in the United States?
Unemployment Rate Amomg Youth Under the Age of 25 in the United States is 10.9%.