Cities with the Highest Unemployment Rate Amomg Youth Under the Age of 25 in Iowa
RELATED REPORTS & OPTIONS
Highest Unemployment | Youth < 25
Iowa
Compare Cities
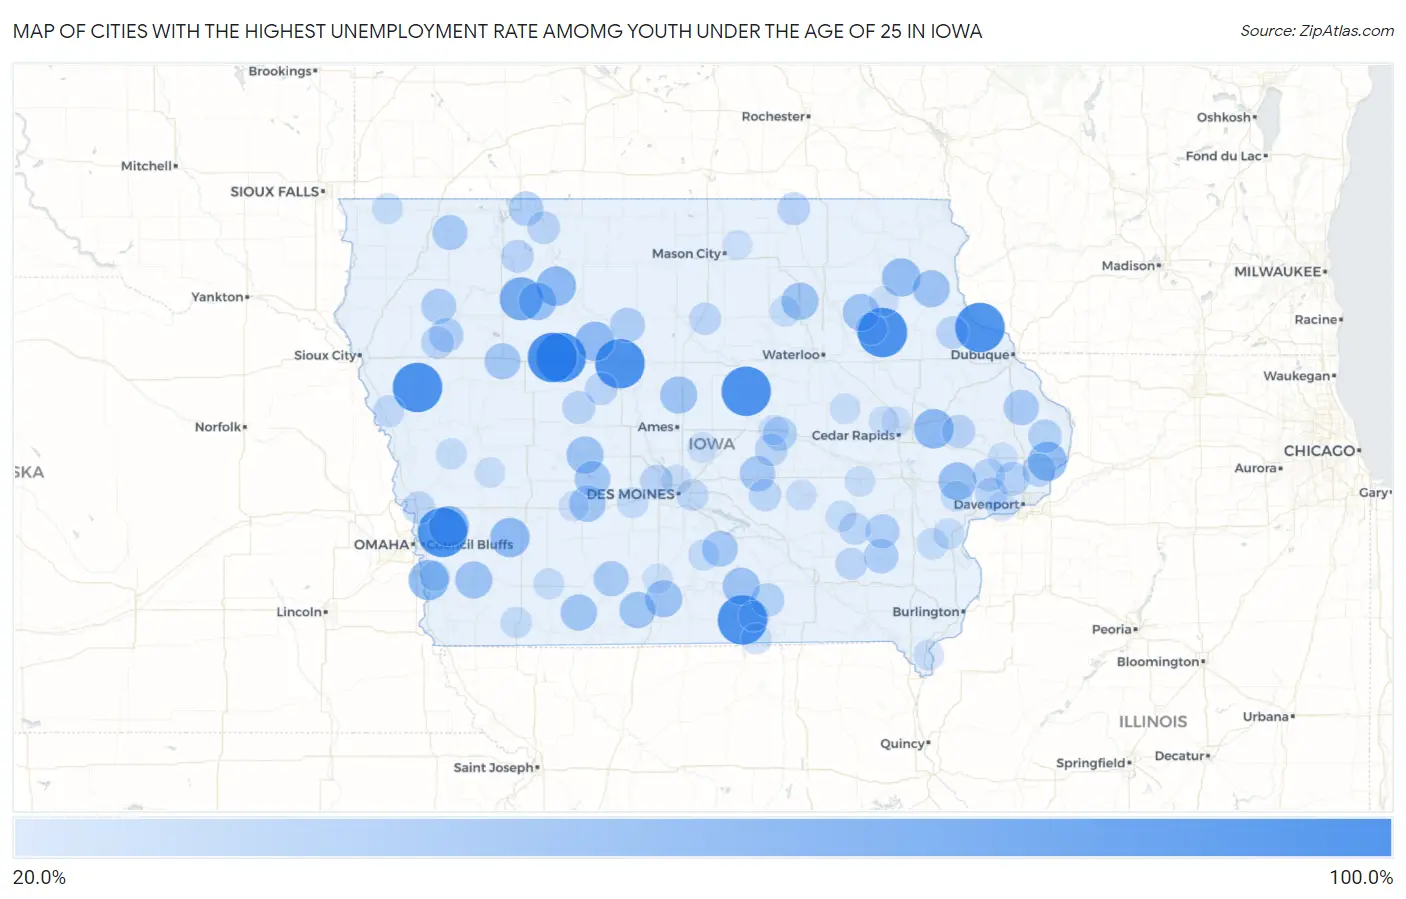
Map of Cities with the Highest Unemployment Rate Amomg Youth Under the Age of 25 in Iowa
0.0%
100.0%
Cities with the Highest Unemployment Rate Amomg Youth Under the Age of 25 in Iowa
| City | Youth Unemployment | vs State | vs National | |
| 1. | Coalville | 100.0% | 7.9%(+92.1)#1 | 10.9%(+89.1)#92 |
| 2. | Twin Lakes | 100.0% | 7.9%(+92.1)#2 | 10.9%(+89.1)#112 |
| 3. | Mcclelland | 100.0% | 7.9%(+92.1)#3 | 10.9%(+89.1)#219 |
| 4. | Whitten | 100.0% | 7.9%(+92.1)#4 | 10.9%(+89.1)#235 |
| 5. | North Buena Vista | 100.0% | 7.9%(+92.1)#5 | 10.9%(+89.1)#260 |
| 6. | Plano | 100.0% | 7.9%(+92.1)#6 | 10.9%(+89.1)#281 |
| 7. | Stanley | 100.0% | 7.9%(+92.1)#7 | 10.9%(+89.1)#284 |
| 8. | Oto | 100.0% | 7.9%(+92.1)#8 | 10.9%(+89.1)#285 |
| 9. | Jolley | 100.0% | 7.9%(+92.1)#9 | 10.9%(+89.1)#318 |
| 10. | Marathon | 73.9% | 7.9%(+66.0)#10 | 10.9%(+63.0)#531 |
| 11. | Bentley | 63.2% | 7.9%(+55.3)#11 | 10.9%(+52.3)#710 |
| 12. | Pacific Junction | 62.5% | 7.9%(+54.6)#12 | 10.9%(+51.6)#722 |
| 13. | Mallard | 60.0% | 7.9%(+52.1)#13 | 10.9%(+49.1)#772 |
| 14. | Martelle | 59.9% | 7.9%(+52.0)#14 | 10.9%(+49.0)#784 |
| 15. | Lewis | 58.8% | 7.9%(+50.9)#15 | 10.9%(+47.9)#807 |
| 16. | Clare | 58.3% | 7.9%(+50.4)#16 | 10.9%(+47.4)#819 |
| 17. | Low Moor | 57.1% | 7.9%(+49.2)#17 | 10.9%(+46.2)#855 |
| 18. | Clermont | 55.5% | 7.9%(+47.6)#18 | 10.9%(+44.6)#902 |
| 19. | Rochester | 53.3% | 7.9%(+45.4)#19 | 10.9%(+42.4)#985 |
| 20. | Laurens | 52.3% | 7.9%(+44.4)#20 | 10.9%(+41.4)#1,013 |
| 21. | Plainfield | 50.0% | 7.9%(+42.1)#21 | 10.9%(+39.1)#1,104 |
| 22. | Bagley | 50.0% | 7.9%(+42.1)#22 | 10.9%(+39.1)#1,117 |
| 23. | Westgate | 50.0% | 7.9%(+42.1)#23 | 10.9%(+39.1)#1,127 |
| 24. | Wever | 50.0% | 7.9%(+42.1)#24 | 10.9%(+39.1)#1,131 |
| 25. | Randall | 50.0% | 7.9%(+42.1)#25 | 10.9%(+39.1)#1,137 |
| 26. | St Olaf | 50.0% | 7.9%(+42.1)#26 | 10.9%(+39.1)#1,142 |
| 27. | Emerson | 49.9% | 7.9%(+42.0)#27 | 10.9%(+39.0)#1,169 |
| 28. | Melrose | 49.9% | 7.9%(+42.0)#28 | 10.9%(+39.0)#1,183 |
| 29. | Weldon | 49.9% | 7.9%(+42.0)#29 | 10.9%(+39.0)#1,185 |
| 30. | Menlo | 47.1% | 7.9%(+39.2)#30 | 10.9%(+36.2)#1,264 |
| 31. | Clearfield | 46.8% | 7.9%(+38.9)#31 | 10.9%(+35.9)#1,273 |
| 32. | Grand River | 46.6% | 7.9%(+38.7)#32 | 10.9%(+35.7)#1,287 |
| 33. | Early | 46.0% | 7.9%(+38.1)#33 | 10.9%(+35.1)#1,317 |
| 34. | Panora | 44.4% | 7.9%(+36.5)#34 | 10.9%(+33.5)#1,390 |
| 35. | Melcher Dallas | 44.2% | 7.9%(+36.3)#35 | 10.9%(+33.3)#1,409 |
| 36. | Kellogg | 43.3% | 7.9%(+35.4)#36 | 10.9%(+32.4)#1,471 |
| 37. | Andrew | 42.8% | 7.9%(+34.9)#37 | 10.9%(+31.9)#1,510 |
| 38. | Afton | 42.6% | 7.9%(+34.7)#38 | 10.9%(+31.7)#1,532 |
| 39. | Melvin | 41.7% | 7.9%(+33.8)#39 | 10.9%(+30.8)#1,586 |
| 40. | Cleghorn | 41.1% | 7.9%(+33.2)#40 | 10.9%(+30.2)#1,638 |
| 41. | Thor | 40.0% | 7.9%(+32.1)#41 | 10.9%(+29.1)#1,700 |
| 42. | Superior | 40.0% | 7.9%(+32.1)#42 | 10.9%(+29.1)#1,704 |
| 43. | Brighton | 39.0% | 7.9%(+31.1)#43 | 10.9%(+28.1)#1,785 |
| 44. | Quimby | 38.4% | 7.9%(+30.5)#44 | 10.9%(+27.5)#1,818 |
| 45. | West Chester | 38.0% | 7.9%(+30.1)#45 | 10.9%(+27.1)#1,855 |
| 46. | Montour | 37.5% | 7.9%(+29.6)#46 | 10.9%(+26.6)#1,900 |
| 47. | Moravia | 37.0% | 7.9%(+29.1)#47 | 10.9%(+26.1)#1,938 |
| 48. | Goose Lake | 36.4% | 7.9%(+28.5)#48 | 10.9%(+25.5)#1,974 |
| 49. | Donahue | 36.3% | 7.9%(+28.4)#49 | 10.9%(+25.4)#1,985 |
| 50. | Mccausland | 35.7% | 7.9%(+27.8)#50 | 10.9%(+24.8)#2,043 |
| 51. | Olin | 34.3% | 7.9%(+26.4)#51 | 10.9%(+23.4)#2,172 |
| 52. | Churdan | 33.9% | 7.9%(+26.0)#52 | 10.9%(+23.0)#2,212 |
| 53. | Grimes | 33.4% | 7.9%(+25.5)#53 | 10.9%(+22.5)#2,235 |
| 54. | New Liberty | 33.3% | 7.9%(+25.4)#54 | 10.9%(+22.4)#2,324 |
| 55. | Wallingford | 33.3% | 7.9%(+25.4)#55 | 10.9%(+22.4)#2,325 |
| 56. | Washta | 33.3% | 7.9%(+25.4)#56 | 10.9%(+22.4)#2,327 |
| 57. | Dickens | 33.3% | 7.9%(+25.4)#57 | 10.9%(+22.4)#2,329 |
| 58. | Mcintire | 33.3% | 7.9%(+25.4)#58 | 10.9%(+22.4)#2,339 |
| 59. | Gilman | 32.8% | 7.9%(+24.9)#59 | 10.9%(+21.9)#2,375 |
| 60. | Gowrie | 32.7% | 7.9%(+24.8)#60 | 10.9%(+21.8)#2,378 |
| 61. | Colesburg | 32.5% | 7.9%(+24.6)#61 | 10.9%(+21.6)#2,403 |
| 62. | Loveland | 32.1% | 7.9%(+24.2)#62 | 10.9%(+21.2)#2,442 |
| 63. | Stockton | 31.8% | 7.9%(+23.9)#63 | 10.9%(+20.9)#2,479 |
| 64. | Sully | 31.5% | 7.9%(+23.6)#64 | 10.9%(+20.6)#2,507 |
| 65. | Coulter | 30.7% | 7.9%(+22.8)#65 | 10.9%(+19.8)#2,603 |
| 66. | Oelwein | 30.3% | 7.9%(+22.4)#66 | 10.9%(+19.4)#2,643 |
| 67. | Packwood | 29.9% | 7.9%(+22.0)#67 | 10.9%(+19.0)#2,704 |
| 68. | Harper | 29.9% | 7.9%(+22.0)#68 | 10.9%(+19.0)#2,712 |
| 69. | Pleasant Hill | 29.6% | 7.9%(+21.7)#69 | 10.9%(+18.7)#2,732 |
| 70. | Whiting | 29.1% | 7.9%(+21.2)#70 | 10.9%(+18.2)#2,803 |
| 71. | Clarinda | 27.7% | 7.9%(+19.8)#71 | 10.9%(+16.8)#2,998 |
| 72. | Columbus City | 27.7% | 7.9%(+19.8)#72 | 10.9%(+16.8)#3,017 |
| 73. | Lacona | 27.4% | 7.9%(+19.5)#73 | 10.9%(+16.5)#3,054 |
| 74. | Cincinnati | 27.2% | 7.9%(+19.3)#74 | 10.9%(+16.3)#3,088 |
| 75. | Webster | 27.2% | 7.9%(+19.3)#75 | 10.9%(+16.3)#3,093 |
| 76. | De Soto | 27.0% | 7.9%(+19.1)#76 | 10.9%(+16.1)#3,122 |
| 77. | Corning | 26.8% | 7.9%(+18.9)#77 | 10.9%(+15.9)#3,144 |
| 78. | Dunlap | 26.6% | 7.9%(+18.7)#78 | 10.9%(+15.7)#3,176 |
| 79. | Letts | 26.6% | 7.9%(+18.7)#79 | 10.9%(+15.7)#3,185 |
| 80. | Rock Rapids | 26.5% | 7.9%(+18.6)#80 | 10.9%(+15.6)#3,205 |
| 81. | Clarksville | 26.3% | 7.9%(+18.4)#81 | 10.9%(+15.4)#3,242 |
| 82. | Atalissa | 26.3% | 7.9%(+18.4)#82 | 10.9%(+15.4)#3,251 |
| 83. | Montezuma | 25.6% | 7.9%(+17.7)#83 | 10.9%(+14.7)#3,382 |
| 84. | Williamsburg | 25.0% | 7.9%(+17.1)#84 | 10.9%(+14.1)#3,455 |
| 85. | Mystic | 25.0% | 7.9%(+17.1)#85 | 10.9%(+14.1)#3,491 |
| 86. | Garrison | 25.0% | 7.9%(+17.1)#86 | 10.9%(+14.1)#3,492 |
| 87. | Kirkman | 25.0% | 7.9%(+17.1)#87 | 10.9%(+14.1)#3,514 |
| 88. | Maxwell | 24.9% | 7.9%(+17.0)#88 | 10.9%(+14.0)#3,529 |
| 89. | Montrose | 24.9% | 7.9%(+17.0)#89 | 10.9%(+14.0)#3,531 |
| 90. | Saylorville | 24.6% | 7.9%(+16.7)#90 | 10.9%(+13.7)#3,584 |
| 91. | Le Grand | 24.3% | 7.9%(+16.4)#91 | 10.9%(+13.4)#3,651 |
| 92. | Palo | 23.9% | 7.9%(+16.0)#92 | 10.9%(+13.0)#3,720 |
| 93. | Casey | 23.8% | 7.9%(+15.9)#93 | 10.9%(+12.9)#3,756 |
| 94. | Blue Grass | 23.4% | 7.9%(+15.5)#94 | 10.9%(+12.5)#3,836 |
| 95. | Osceola | 23.3% | 7.9%(+15.4)#95 | 10.9%(+12.4)#3,850 |
| 96. | Glenwood | 23.2% | 7.9%(+15.3)#96 | 10.9%(+12.3)#3,874 |
| 97. | Hiawatha | 23.1% | 7.9%(+15.2)#97 | 10.9%(+12.2)#3,895 |
| 98. | Fayette | 23.0% | 7.9%(+15.1)#98 | 10.9%(+12.1)#3,931 |
| 99. | Calamus | 23.0% | 7.9%(+15.1)#99 | 10.9%(+12.1)#3,942 |
| 100. | Rock Falls | 22.7% | 7.9%(+14.8)#100 | 10.9%(+11.8)#4,015 |
Common Questions
What are the Top 10 Cities with the Highest Unemployment Rate Amomg Youth Under the Age of 25 in Iowa?
Top 10 Cities with the Highest Unemployment Rate Amomg Youth Under the Age of 25 in Iowa are:
#1
100.0%
#2
100.0%
#3
100.0%
#4
100.0%
#5
100.0%
#6
100.0%
#7
100.0%
#8
100.0%
#9
100.0%
#10
73.9%
What city has the Highest Unemployment Rate Amomg Youth Under the Age of 25 in Iowa?
Coalville has the Highest Unemployment Rate Amomg Youth Under the Age of 25 in Iowa with 100.0%.
What is the Unemployment Rate Amomg Youth Under the Age of 25 in the State of Iowa?
Unemployment Rate Amomg Youth Under the Age of 25 in Iowa is 7.9%.
What is the Unemployment Rate Amomg Youth Under the Age of 25 in the United States?
Unemployment Rate Amomg Youth Under the Age of 25 in the United States is 10.9%.