Cities with the Highest Unemployment Rate Amomg Youth Under the Age of 25 in Kentucky
RELATED REPORTS & OPTIONS
Highest Unemployment | Youth < 25
Kentucky
Compare Cities
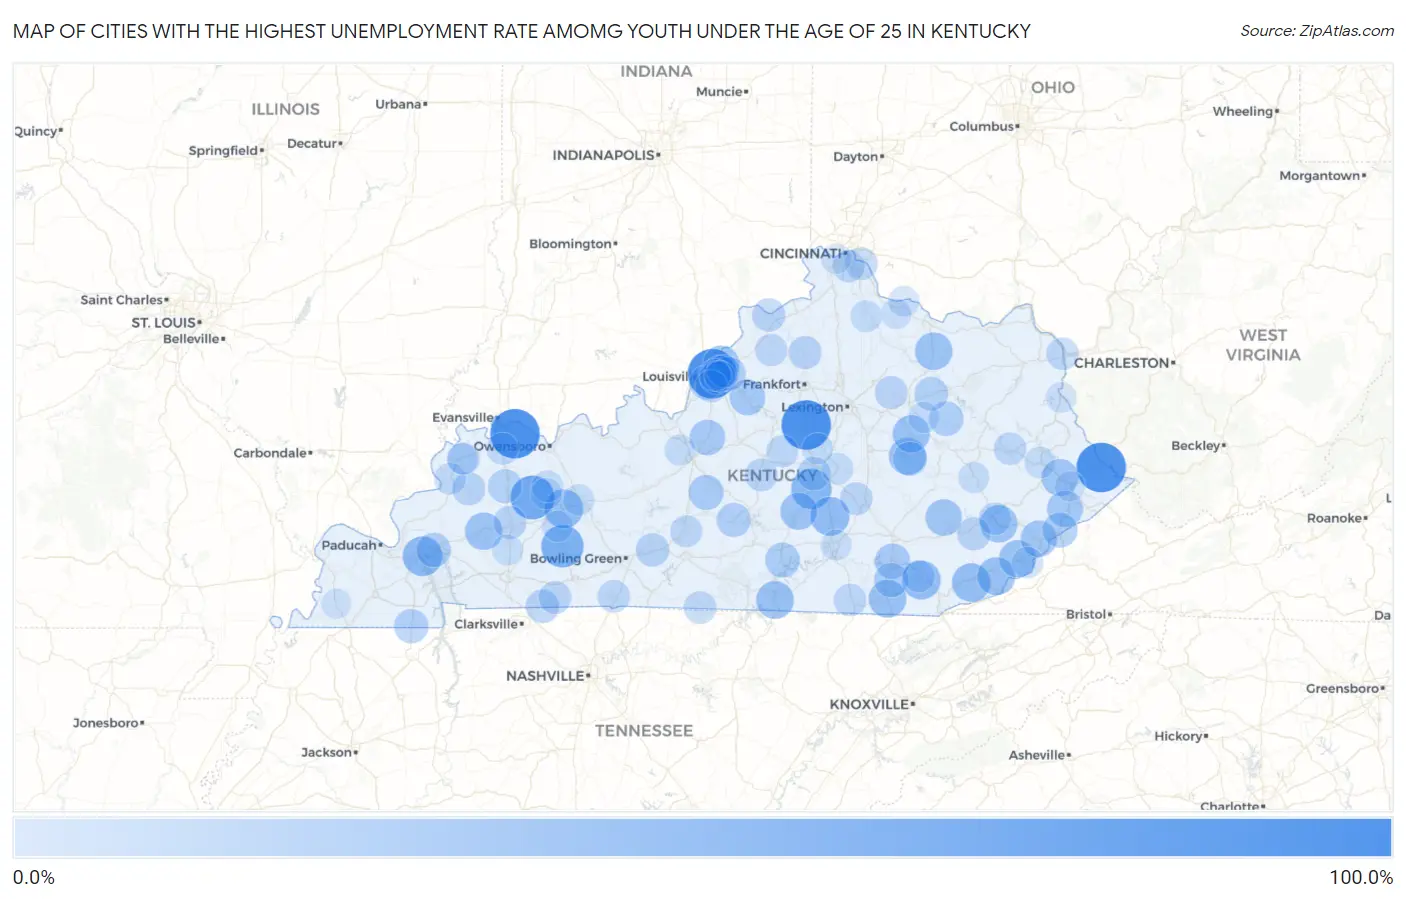
Map of Cities with the Highest Unemployment Rate Amomg Youth Under the Age of 25 in Kentucky
0.0%
100.0%
Cities with the Highest Unemployment Rate Amomg Youth Under the Age of 25 in Kentucky
| City | Youth Unemployment | vs State | vs National | |
| 1. | Salvisa | 100.0% | 10.2%(+89.8)#1 | 10.9%(+89.1)#160 |
| 2. | Belfry | 100.0% | 10.2%(+89.8)#2 | 10.9%(+89.1)#173 |
| 3. | Spottsville | 100.0% | 10.2%(+89.8)#3 | 10.9%(+89.1)#191 |
| 4. | Mockingbird Valley | 100.0% | 10.2%(+89.8)#4 | 10.9%(+89.1)#216 |
| 5. | Curdsville | 100.0% | 10.2%(+89.8)#5 | 10.9%(+89.1)#251 |
| 6. | Philpot | 75.8% | 10.2%(+65.6)#6 | 10.9%(+64.9)#500 |
| 7. | Sacramento | 75.0% | 10.2%(+64.8)#7 | 10.9%(+64.1)#509 |
| 8. | Dunmor | 69.2% | 10.2%(+59.0)#8 | 10.9%(+58.3)#599 |
| 9. | Hustonville | 60.0% | 10.2%(+49.8)#9 | 10.9%(+49.1)#768 |
| 10. | Grand Rivers | 57.1% | 10.2%(+46.9)#10 | 10.9%(+46.2)#851 |
| 11. | Eubank | 55.0% | 10.2%(+44.8)#11 | 10.9%(+44.1)#932 |
| 12. | Rockport | 54.5% | 10.2%(+44.3)#12 | 10.9%(+43.6)#942 |
| 13. | Artemus | 53.5% | 10.2%(+43.3)#13 | 10.9%(+42.6)#972 |
| 14. | South Wallins | 52.6% | 10.2%(+42.4)#14 | 10.9%(+41.7)#1,003 |
| 15. | Evarts | 49.9% | 10.2%(+39.7)#15 | 10.9%(+39.0)#1,163 |
| 16. | Albany | 49.4% | 10.2%(+39.2)#16 | 10.9%(+38.5)#1,195 |
| 17. | Emlyn | 49.4% | 10.2%(+39.2)#17 | 10.9%(+38.5)#1,197 |
| 18. | Diablock | 48.5% | 10.2%(+38.3)#18 | 10.9%(+37.6)#1,225 |
| 19. | Flemingsburg | 48.2% | 10.2%(+38.0)#19 | 10.9%(+37.3)#1,233 |
| 20. | Dawson Springs | 48.0% | 10.2%(+37.8)#20 | 10.9%(+37.1)#1,240 |
| 21. | Irvine | 47.4% | 10.2%(+37.2)#21 | 10.9%(+36.5)#1,256 |
| 22. | Clay City | 47.4% | 10.2%(+37.2)#22 | 10.9%(+36.5)#1,257 |
| 23. | Cumberland | 46.6% | 10.2%(+36.4)#23 | 10.9%(+35.7)#1,276 |
| 24. | Liberty | 46.1% | 10.2%(+35.9)#24 | 10.9%(+35.2)#1,301 |
| 25. | Betsy Layne | 45.8% | 10.2%(+35.6)#25 | 10.9%(+34.9)#1,325 |
| 26. | Oneida | 43.7% | 10.2%(+33.5)#26 | 10.9%(+32.8)#1,437 |
| 27. | Whitesburg | 43.6% | 10.2%(+33.4)#27 | 10.9%(+32.7)#1,442 |
| 28. | Prospect | 43.4% | 10.2%(+33.2)#28 | 10.9%(+32.5)#1,456 |
| 29. | Virgie | 42.1% | 10.2%(+31.9)#29 | 10.9%(+31.2)#1,554 |
| 30. | Elk Creek | 40.5% | 10.2%(+30.3)#30 | 10.9%(+29.6)#1,667 |
| 31. | Lebanon Junction | 40.3% | 10.2%(+30.1)#31 | 10.9%(+29.4)#1,673 |
| 32. | North Corbin | 39.2% | 10.2%(+29.0)#32 | 10.9%(+28.3)#1,764 |
| 33. | Jenkins | 38.0% | 10.2%(+27.8)#33 | 10.9%(+27.1)#1,851 |
| 34. | Magnolia | 37.8% | 10.2%(+27.6)#34 | 10.9%(+26.9)#1,866 |
| 35. | Jamestown | 36.9% | 10.2%(+26.7)#35 | 10.9%(+26.0)#1,942 |
| 36. | Frenchburg | 35.9% | 10.2%(+25.7)#36 | 10.9%(+25.0)#2,025 |
| 37. | Kuttawa | 35.7% | 10.2%(+25.5)#37 | 10.9%(+24.8)#2,042 |
| 38. | Rockholds | 35.2% | 10.2%(+25.0)#38 | 10.9%(+24.3)#2,095 |
| 39. | Hazel | 34.7% | 10.2%(+24.5)#39 | 10.9%(+23.8)#2,135 |
| 40. | Greensburg | 34.0% | 10.2%(+23.8)#40 | 10.9%(+23.1)#2,195 |
| 41. | Anchorage | 33.7% | 10.2%(+23.5)#41 | 10.9%(+22.8)#2,223 |
| 42. | Ravenna | 33.3% | 10.2%(+23.1)#42 | 10.9%(+22.4)#2,265 |
| 43. | Parkway Village | 33.3% | 10.2%(+23.1)#43 | 10.9%(+22.4)#2,267 |
| 44. | Slaughters | 33.3% | 10.2%(+23.1)#44 | 10.9%(+22.4)#2,320 |
| 45. | Owingsville | 32.6% | 10.2%(+22.4)#45 | 10.9%(+21.7)#2,387 |
| 46. | Guthrie | 31.8% | 10.2%(+21.6)#46 | 10.9%(+20.9)#2,469 |
| 47. | Bancroft | 31.8% | 10.2%(+21.6)#47 | 10.9%(+20.9)#2,473 |
| 48. | Smiths Grove | 31.7% | 10.2%(+21.5)#48 | 10.9%(+20.8)#2,486 |
| 49. | Junction City | 31.0% | 10.2%(+20.8)#49 | 10.9%(+20.1)#2,567 |
| 50. | Prestonville | 30.7% | 10.2%(+20.5)#50 | 10.9%(+19.8)#2,607 |
| 51. | Hyden | 30.5% | 10.2%(+20.3)#51 | 10.9%(+19.6)#2,621 |
| 52. | Clay | 30.3% | 10.2%(+20.1)#52 | 10.9%(+19.4)#2,647 |
| 53. | Thruston | 30.0% | 10.2%(+19.8)#53 | 10.9%(+19.1)#2,673 |
| 54. | Mortons Gap | 30.0% | 10.2%(+19.8)#54 | 10.9%(+19.1)#2,678 |
| 55. | Monterey | 30.0% | 10.2%(+19.8)#55 | 10.9%(+19.1)#2,685 |
| 56. | North Middletown | 29.1% | 10.2%(+18.9)#56 | 10.9%(+18.2)#2,804 |
| 57. | Brodhead | 28.8% | 10.2%(+18.6)#57 | 10.9%(+17.9)#2,838 |
| 58. | Norbourne Estates | 28.5% | 10.2%(+18.3)#58 | 10.9%(+17.6)#2,881 |
| 59. | Allensville | 28.5% | 10.2%(+18.3)#59 | 10.9%(+17.6)#2,898 |
| 60. | Lebanon | 28.3% | 10.2%(+18.1)#60 | 10.9%(+17.4)#2,917 |
| 61. | Melbourne | 28.0% | 10.2%(+17.8)#61 | 10.9%(+17.1)#2,966 |
| 62. | Gamaliel | 27.9% | 10.2%(+17.7)#62 | 10.9%(+17.0)#2,979 |
| 63. | Franklin | 27.7% | 10.2%(+17.5)#63 | 10.9%(+16.8)#2,995 |
| 64. | Stearns | 27.7% | 10.2%(+17.5)#64 | 10.9%(+16.8)#3,008 |
| 65. | Hazard | 27.6% | 10.2%(+17.4)#65 | 10.9%(+16.7)#3,021 |
| 66. | Salyersville | 27.5% | 10.2%(+17.3)#66 | 10.9%(+16.6)#3,035 |
| 67. | Murray Hill | 27.2% | 10.2%(+17.0)#67 | 10.9%(+16.3)#3,079 |
| 68. | Catlettsburg | 27.1% | 10.2%(+16.9)#68 | 10.9%(+16.2)#3,101 |
| 69. | New Castle | 26.6% | 10.2%(+16.4)#69 | 10.9%(+15.7)#3,177 |
| 70. | Breckinridge Center | 26.5% | 10.2%(+16.3)#70 | 10.9%(+15.6)#3,207 |
| 71. | Watterson Park | 26.3% | 10.2%(+16.1)#71 | 10.9%(+15.4)#3,243 |
| 72. | Mackville | 26.3% | 10.2%(+16.1)#72 | 10.9%(+15.4)#3,252 |
| 73. | Taylor Mill | 26.1% | 10.2%(+15.9)#73 | 10.9%(+15.2)#3,281 |
| 74. | Barbourville | 25.8% | 10.2%(+15.6)#74 | 10.9%(+14.9)#3,340 |
| 75. | Horse Cave | 25.5% | 10.2%(+15.3)#75 | 10.9%(+14.6)#3,388 |
| 76. | Brownsboro Village | 25.0% | 10.2%(+14.8)#76 | 10.9%(+14.1)#3,493 |
| 77. | Anthoston | 25.0% | 10.2%(+14.8)#77 | 10.9%(+14.1)#3,495 |
| 78. | Sturgis | 24.3% | 10.2%(+14.1)#78 | 10.9%(+13.4)#3,646 |
| 79. | Lancaster | 24.0% | 10.2%(+13.8)#79 | 10.9%(+13.1)#3,693 |
| 80. | Falmouth | 23.9% | 10.2%(+13.7)#80 | 10.9%(+13.0)#3,715 |
| 81. | Livermore | 23.6% | 10.2%(+13.4)#81 | 10.9%(+12.7)#3,797 |
| 82. | Prestonsburg | 23.2% | 10.2%(+13.0)#82 | 10.9%(+12.3)#3,876 |
| 83. | Lynch | 22.7% | 10.2%(+12.5)#83 | 10.9%(+11.8)#4,008 |
| 84. | Island | 22.7% | 10.2%(+12.5)#84 | 10.9%(+11.8)#4,010 |
| 85. | Beaver Dam | 22.2% | 10.2%(+12.0)#85 | 10.9%(+11.3)#4,117 |
| 86. | Burgin | 22.2% | 10.2%(+12.0)#86 | 10.9%(+11.3)#4,137 |
| 87. | Rineyville | 21.9% | 10.2%(+11.7)#87 | 10.9%(+11.0)#4,212 |
| 88. | Jeffersonville | 21.7% | 10.2%(+11.5)#88 | 10.9%(+10.8)#4,252 |
| 89. | Drakesboro | 21.7% | 10.2%(+11.5)#89 | 10.9%(+10.8)#4,264 |
| 90. | Morganfield | 21.5% | 10.2%(+11.3)#90 | 10.9%(+10.6)#4,304 |
| 91. | Jackson | 21.5% | 10.2%(+11.3)#91 | 10.9%(+10.6)#4,308 |
| 92. | Crofton | 21.4% | 10.2%(+11.2)#92 | 10.9%(+10.5)#4,346 |
| 93. | Augusta | 20.4% | 10.2%(+10.2)#93 | 10.9%(+9.50)#4,602 |
| 94. | Somerset | 20.2% | 10.2%(+10.00)#94 | 10.9%(+9.30)#4,642 |
| 95. | Norwood | 20.0% | 10.2%(+9.80)#95 | 10.9%(+9.10)#4,712 |
| 96. | Louisa | 19.9% | 10.2%(+9.70)#96 | 10.9%(+9.00)#4,767 |
| 97. | Brooksville | 19.0% | 10.2%(+8.80)#97 | 10.9%(+8.10)#5,046 |
| 98. | Pikeville | 18.6% | 10.2%(+8.40)#98 | 10.9%(+7.70)#5,169 |
| 99. | Villa Hills | 18.3% | 10.2%(+8.10)#99 | 10.9%(+7.40)#5,253 |
| 100. | Clinton | 17.9% | 10.2%(+7.70)#100 | 10.9%(+7.00)#5,424 |
Common Questions
What are the Top 10 Cities with the Highest Unemployment Rate Amomg Youth Under the Age of 25 in Kentucky?
Top 10 Cities with the Highest Unemployment Rate Amomg Youth Under the Age of 25 in Kentucky are:
#1
100.0%
#2
100.0%
#3
100.0%
#4
100.0%
#5
75.0%
#6
69.2%
#7
60.0%
#8
57.1%
#9
55.0%
#10
54.5%
What city has the Highest Unemployment Rate Amomg Youth Under the Age of 25 in Kentucky?
Salvisa has the Highest Unemployment Rate Amomg Youth Under the Age of 25 in Kentucky with 100.0%.
What is the Unemployment Rate Amomg Youth Under the Age of 25 in the State of Kentucky?
Unemployment Rate Amomg Youth Under the Age of 25 in Kentucky is 10.2%.
What is the Unemployment Rate Amomg Youth Under the Age of 25 in the United States?
Unemployment Rate Amomg Youth Under the Age of 25 in the United States is 10.9%.