Cities with the Highest Unemployment Rate Amomg Youth Under the Age of 25 in Oregon
RELATED REPORTS & OPTIONS
Highest Unemployment | Youth < 25
Oregon
Compare Cities
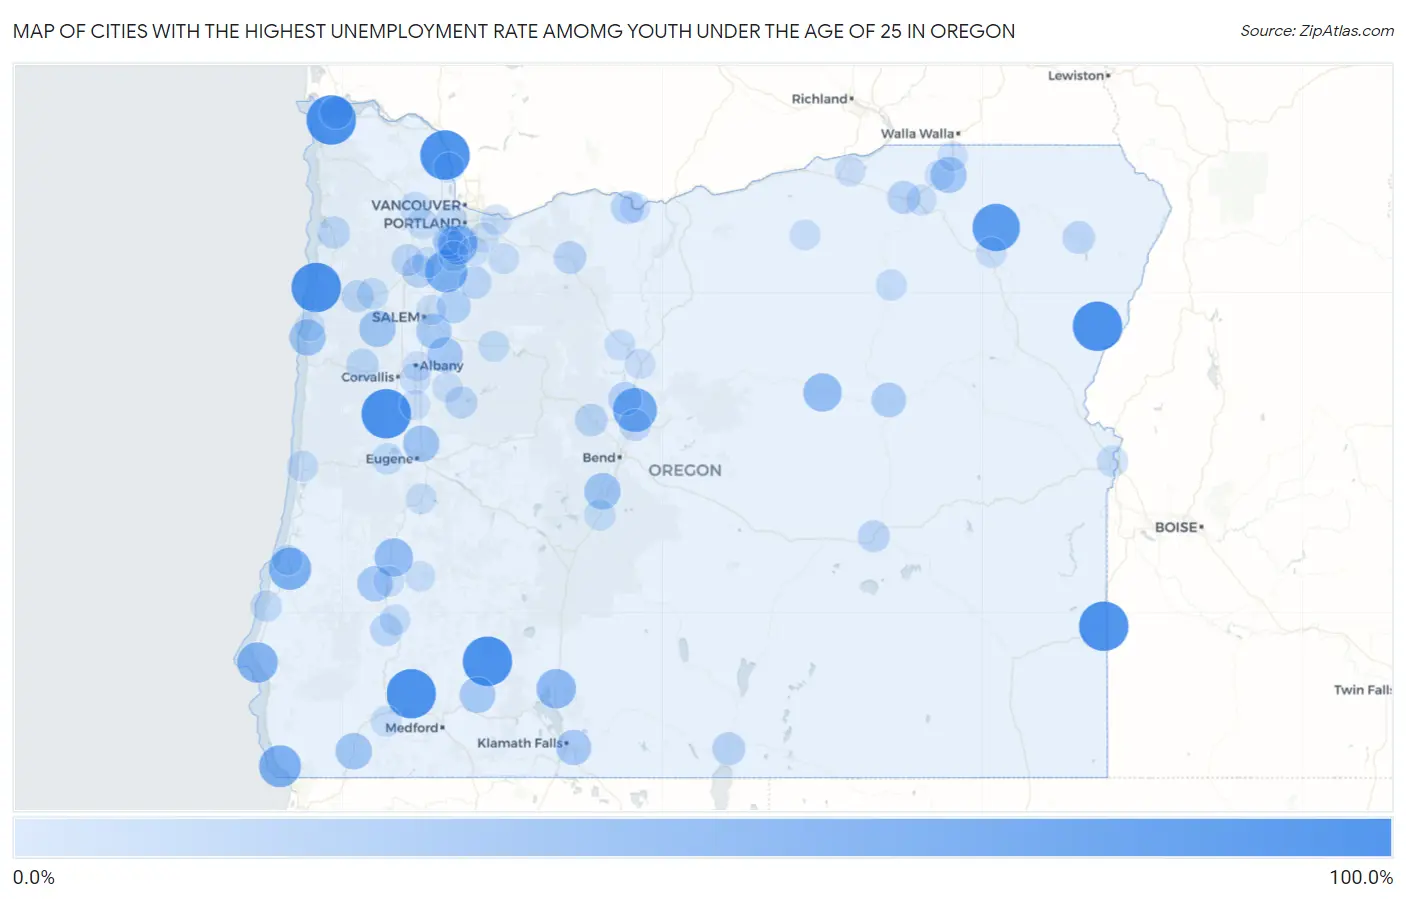
Map of Cities with the Highest Unemployment Rate Amomg Youth Under the Age of 25 in Oregon
0.0%
100.0%
Cities with the Highest Unemployment Rate Amomg Youth Under the Age of 25 in Oregon
| City | Youth Unemployment | vs State | vs National | |
| 1. | Halfway | 100.0% | 11.7%(+88.3)#1 | 10.9%(+89.1)#13 |
| 2. | Deer Island | 100.0% | 11.7%(+88.3)#2 | 10.9%(+89.1)#19 |
| 3. | Wimer | 100.0% | 11.7%(+88.3)#3 | 10.9%(+89.1)#108 |
| 4. | Alpine | 100.0% | 11.7%(+88.3)#4 | 10.9%(+89.1)#166 |
| 5. | Neskowin | 100.0% | 11.7%(+88.3)#5 | 10.9%(+89.1)#201 |
| 6. | Jordan Valley | 100.0% | 11.7%(+88.3)#6 | 10.9%(+89.1)#213 |
| 7. | Jeffers Gardens | 100.0% | 11.7%(+88.3)#7 | 10.9%(+89.1)#246 |
| 8. | Prospect | 99.9% | 11.7%(+88.2)#8 | 10.9%(+89.0)#344 |
| 9. | Summerville | 90.0% | 11.7%(+78.3)#9 | 10.9%(+79.1)#405 |
| 10. | Terrebonne | 74.7% | 11.7%(+63.0)#10 | 10.9%(+63.8)#525 |
| 11. | Jasper | 74.6% | 11.7%(+62.9)#11 | 10.9%(+63.7)#527 |
| 12. | Bunker Hill | 67.0% | 11.7%(+55.3)#12 | 10.9%(+56.1)#627 |
| 13. | Donald | 66.9% | 11.7%(+55.2)#13 | 10.9%(+56.0)#629 |
| 14. | Brookings | 65.9% | 11.7%(+54.2)#14 | 10.9%(+55.0)#662 |
| 15. | Port Orford | 59.4% | 11.7%(+47.7)#15 | 10.9%(+48.5)#791 |
| 16. | Rivergrove | 55.1% | 11.7%(+43.4)#16 | 10.9%(+44.2)#923 |
| 17. | Chiloquin | 54.7% | 11.7%(+43.0)#17 | 10.9%(+43.8)#938 |
| 18. | Oakland | 49.9% | 11.7%(+38.2)#18 | 10.9%(+39.0)#1,161 |
| 19. | Dayville | 49.8% | 11.7%(+38.1)#19 | 10.9%(+38.9)#1,187 |
| 20. | Falls City | 42.0% | 11.7%(+30.3)#20 | 10.9%(+31.1)#1,563 |
| 21. | Cave Junction | 41.6% | 11.7%(+29.9)#21 | 10.9%(+30.7)#1,587 |
| 22. | Three Rivers | 41.3% | 11.7%(+29.6)#22 | 10.9%(+30.4)#1,618 |
| 23. | Depoe Bay | 41.2% | 11.7%(+29.5)#23 | 10.9%(+30.3)#1,623 |
| 24. | Coburg | 41.0% | 11.7%(+29.3)#24 | 10.9%(+30.1)#1,644 |
| 25. | Weston | 39.9% | 11.7%(+28.2)#25 | 10.9%(+29.0)#1,728 |
| 26. | Butte Falls | 38.8% | 11.7%(+27.1)#26 | 10.9%(+27.9)#1,797 |
| 27. | Scio | 36.8% | 11.7%(+25.1)#27 | 10.9%(+25.9)#1,948 |
| 28. | Altamont | 36.6% | 11.7%(+24.9)#28 | 10.9%(+25.7)#1,961 |
| 29. | Melrose | 36.6% | 11.7%(+24.9)#29 | 10.9%(+25.7)#1,965 |
| 30. | Turner | 35.5% | 11.7%(+23.8)#30 | 10.9%(+24.6)#2,057 |
| 31. | John Day | 33.3% | 11.7%(+21.6)#31 | 10.9%(+22.4)#2,250 |
| 32. | Pleasant Valley | 32.3% | 11.7%(+20.6)#32 | 10.9%(+21.4)#2,421 |
| 33. | Silverton | 30.0% | 11.7%(+18.3)#33 | 10.9%(+19.1)#2,668 |
| 34. | Crooked River Ranch | 28.7% | 11.7%(+17.0)#34 | 10.9%(+17.8)#2,845 |
| 35. | Lakeview | 27.0% | 11.7%(+15.3)#35 | 10.9%(+16.1)#3,117 |
| 36. | Chenoweth | 26.7% | 11.7%(+15.0)#36 | 10.9%(+15.8)#3,160 |
| 37. | Pendleton | 26.6% | 11.7%(+14.9)#37 | 10.9%(+15.7)#3,164 |
| 38. | Dayton | 26.4% | 11.7%(+14.7)#38 | 10.9%(+15.5)#3,218 |
| 39. | King City | 26.3% | 11.7%(+14.6)#39 | 10.9%(+15.4)#3,236 |
| 40. | Dilley | 26.3% | 11.7%(+14.6)#40 | 10.9%(+15.4)#3,257 |
| 41. | Running Y Ranch | 26.1% | 11.7%(+14.4)#41 | 10.9%(+15.2)#3,292 |
| 42. | Astoria | 25.7% | 11.7%(+14.0)#42 | 10.9%(+14.8)#3,352 |
| 43. | Sisters | 25.4% | 11.7%(+13.7)#43 | 10.9%(+14.5)#3,401 |
| 44. | Elmira | 25.0% | 11.7%(+13.3)#44 | 10.9%(+14.1)#3,488 |
| 45. | Government Camp | 25.0% | 11.7%(+13.3)#45 | 10.9%(+14.1)#3,511 |
| 46. | Enterprise | 24.9% | 11.7%(+13.2)#46 | 10.9%(+14.0)#3,522 |
| 47. | Boring | 24.9% | 11.7%(+13.2)#47 | 10.9%(+14.0)#3,523 |
| 48. | San Marine | 24.2% | 11.7%(+12.5)#48 | 10.9%(+13.3)#3,670 |
| 49. | Summit | 24.2% | 11.7%(+12.5)#49 | 10.9%(+13.3)#3,673 |
| 50. | Molalla | 24.1% | 11.7%(+12.4)#50 | 10.9%(+13.2)#3,677 |
| 51. | Tillamook | 24.1% | 11.7%(+12.4)#51 | 10.9%(+13.2)#3,679 |
| 52. | Riddle | 23.5% | 11.7%(+11.8)#52 | 10.9%(+12.6)#3,818 |
| 53. | Sweet Home | 22.8% | 11.7%(+11.1)#53 | 10.9%(+11.9)#3,977 |
| 54. | Redmond | 22.4% | 11.7%(+10.7)#54 | 10.9%(+11.5)#4,058 |
| 55. | Carlton | 22.2% | 11.7%(+10.5)#55 | 10.9%(+11.3)#4,120 |
| 56. | Hines | 22.2% | 11.7%(+10.5)#56 | 10.9%(+11.3)#4,125 |
| 57. | Grand Ronde | 22.2% | 11.7%(+10.5)#57 | 10.9%(+11.3)#4,129 |
| 58. | Veneta | 20.4% | 11.7%(+8.70)#58 | 10.9%(+9.50)#4,590 |
| 59. | Banks | 20.4% | 11.7%(+8.70)#59 | 10.9%(+9.50)#4,599 |
| 60. | Bandon | 19.8% | 11.7%(+8.10)#60 | 10.9%(+8.90)#4,814 |
| 61. | Ontario | 19.4% | 11.7%(+7.70)#61 | 10.9%(+8.50)#4,891 |
| 62. | Cedar Mill | 19.3% | 11.7%(+7.60)#62 | 10.9%(+8.40)#4,924 |
| 63. | Willamina | 19.3% | 11.7%(+7.60)#63 | 10.9%(+8.40)#4,939 |
| 64. | Cornelius | 18.9% | 11.7%(+7.20)#64 | 10.9%(+8.00)#5,062 |
| 65. | Ukiah | 18.7% | 11.7%(+7.00)#65 | 10.9%(+7.80)#5,158 |
| 66. | La Pine | 18.4% | 11.7%(+6.70)#66 | 10.9%(+7.50)#5,234 |
| 67. | Florence | 18.1% | 11.7%(+6.40)#67 | 10.9%(+7.20)#5,303 |
| 68. | New Hope | 18.1% | 11.7%(+6.40)#68 | 10.9%(+7.20)#5,321 |
| 69. | Gates | 18.1% | 11.7%(+6.40)#69 | 10.9%(+7.20)#5,341 |
| 70. | Myrtle Creek | 17.9% | 11.7%(+6.20)#70 | 10.9%(+7.00)#5,417 |
| 71. | Warm Springs | 17.6% | 11.7%(+5.90)#71 | 10.9%(+6.70)#5,551 |
| 72. | Tangent | 17.6% | 11.7%(+5.90)#72 | 10.9%(+6.70)#5,561 |
| 73. | Roseburg North | 17.4% | 11.7%(+5.70)#73 | 10.9%(+6.50)#5,646 |
| 74. | Dundee | 17.3% | 11.7%(+5.60)#74 | 10.9%(+6.40)#5,685 |
| 75. | Troutdale | 17.1% | 11.7%(+5.40)#75 | 10.9%(+6.20)#5,758 |
| 76. | North Bend | 16.9% | 11.7%(+5.20)#76 | 10.9%(+6.00)#5,821 |
| 77. | Island City | 16.9% | 11.7%(+5.20)#77 | 10.9%(+6.00)#5,846 |
| 78. | Mission | 16.9% | 11.7%(+5.20)#78 | 10.9%(+6.00)#5,849 |
| 79. | Estacada | 16.8% | 11.7%(+5.10)#79 | 10.9%(+5.90)#5,867 |
| 80. | Glide | 16.6% | 11.7%(+4.90)#80 | 10.9%(+5.70)#5,943 |
| 81. | Lexington | 16.6% | 11.7%(+4.90)#81 | 10.9%(+5.70)#6,008 |
| 82. | Cottage Grove | 16.5% | 11.7%(+4.80)#82 | 10.9%(+5.60)#6,033 |
| 83. | River Road | 16.5% | 11.7%(+4.80)#83 | 10.9%(+5.60)#6,037 |
| 84. | Albany | 16.3% | 11.7%(+4.60)#84 | 10.9%(+5.40)#6,073 |
| 85. | Halsey | 16.3% | 11.7%(+4.60)#85 | 10.9%(+5.40)#6,100 |
| 86. | Tualatin | 16.0% | 11.7%(+4.30)#86 | 10.9%(+5.10)#6,193 |
| 87. | Bull Mountain | 15.8% | 11.7%(+4.10)#87 | 10.9%(+4.90)#6,299 |
| 88. | Lake Oswego | 15.4% | 11.7%(+3.70)#88 | 10.9%(+4.50)#6,471 |
| 89. | The Dalles | 15.4% | 11.7%(+3.70)#89 | 10.9%(+4.50)#6,479 |
| 90. | Madras | 15.4% | 11.7%(+3.70)#90 | 10.9%(+4.50)#6,487 |
| 91. | Athena | 15.3% | 11.7%(+3.60)#91 | 10.9%(+4.40)#6,546 |
| 92. | Waterloo | 15.3% | 11.7%(+3.60)#92 | 10.9%(+4.40)#6,567 |
| 93. | Hermiston | 15.2% | 11.7%(+3.50)#93 | 10.9%(+4.30)#6,579 |
| 94. | Wilsonville | 15.0% | 11.7%(+3.30)#94 | 10.9%(+4.10)#6,653 |
| 95. | Hayesville | 15.0% | 11.7%(+3.30)#95 | 10.9%(+4.10)#6,656 |
| 96. | Happy Valley | 14.9% | 11.7%(+3.20)#96 | 10.9%(+4.00)#6,706 |
| 97. | Milton Freewater | 14.9% | 11.7%(+3.20)#97 | 10.9%(+4.00)#6,713 |
| 98. | St Helens | 14.8% | 11.7%(+3.10)#98 | 10.9%(+3.90)#6,771 |
| 99. | Lincoln Beach | 14.3% | 11.7%(+2.60)#99 | 10.9%(+3.40)#7,019 |
| 100. | Oregon City | 14.2% | 11.7%(+2.50)#100 | 10.9%(+3.30)#7,034 |
Common Questions
What are the Top 10 Cities with the Highest Unemployment Rate Amomg Youth Under the Age of 25 in Oregon?
Top 10 Cities with the Highest Unemployment Rate Amomg Youth Under the Age of 25 in Oregon are:
#1
100.0%
#2
100.0%
#3
100.0%
#4
100.0%
#5
100.0%
#6
100.0%
#7
100.0%
#8
99.9%
#9
90.0%
#10
74.7%
What city has the Highest Unemployment Rate Amomg Youth Under the Age of 25 in Oregon?
Halfway has the Highest Unemployment Rate Amomg Youth Under the Age of 25 in Oregon with 100.0%.
What is the Unemployment Rate Amomg Youth Under the Age of 25 in the State of Oregon?
Unemployment Rate Amomg Youth Under the Age of 25 in Oregon is 11.7%.
What is the Unemployment Rate Amomg Youth Under the Age of 25 in the United States?
Unemployment Rate Amomg Youth Under the Age of 25 in the United States is 10.9%.