Coalinga, CA Map & Demographics
Coalinga Map
Coalinga Overview
$23,456
PER CAPITA INCOME
$69,500
AVG FAMILY INCOME
$68,976
AVG HOUSEHOLD INCOME
13.2%
WAGE / INCOME GAP [ % ]
86.8¢/ $1
WAGE / INCOME GAP [ $ ]
0.41
INEQUALITY / GINI INDEX
17,488
TOTAL POPULATION
10,442
MALE POPULATION
7,046
FEMALE POPULATION
148.20
MALES / 100 FEMALES
67.48
FEMALES / 100 MALES
35.0
MEDIAN AGE
3.7
AVG FAMILY SIZE
3.2
AVG HOUSEHOLD SIZE
6,405
LABOR FORCE [ PEOPLE ]
45.7%
PERCENT IN LABOR FORCE
11.8%
UNEMPLOYMENT RATE
Coalinga Zip Codes
Coalinga Area Codes
Income in Coalinga
Income Overview in Coalinga
Per Capita Income in Coalinga is $23,456, while median incomes of families and households are $69,500 and $68,976 respectively.
| Characteristic | Number | Measure |
| Per Capita Income | 17,488 | $23,456 |
| Median Family Income | 3,226 | $69,500 |
| Mean Family Income | 3,226 | $84,779 |
| Median Household Income | 4,219 | $68,976 |
| Mean Household Income | 4,219 | $81,548 |
| Income Deficit | 3,226 | $0 |
| Wage / Income Gap (%) | 17,488 | 13.18% |
| Wage / Income Gap ($) | 17,488 | 86.82¢ per $1 |
| Gini / Inequality Index | 17,488 | 0.41 |
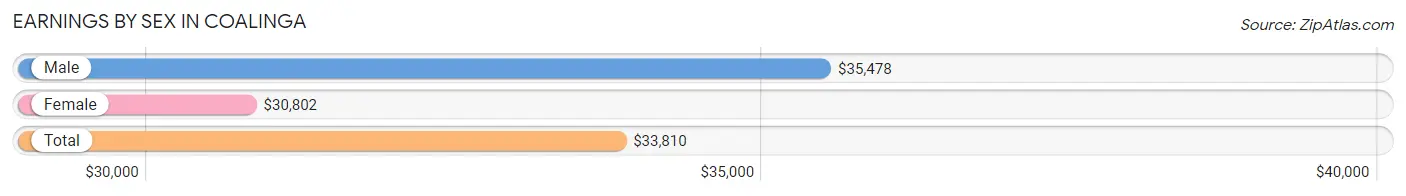
Earnings by Sex in Coalinga
Average Earnings in Coalinga are $33,810, $35,478 for men and $30,802 for women, a difference of 13.2%.
| Sex | Number | Average Earnings |
| Male | 4,290 (60.7%) | $35,478 |
| Female | 2,776 (39.3%) | $30,802 |
| Total | 7,066 (100.0%) | $33,810 |
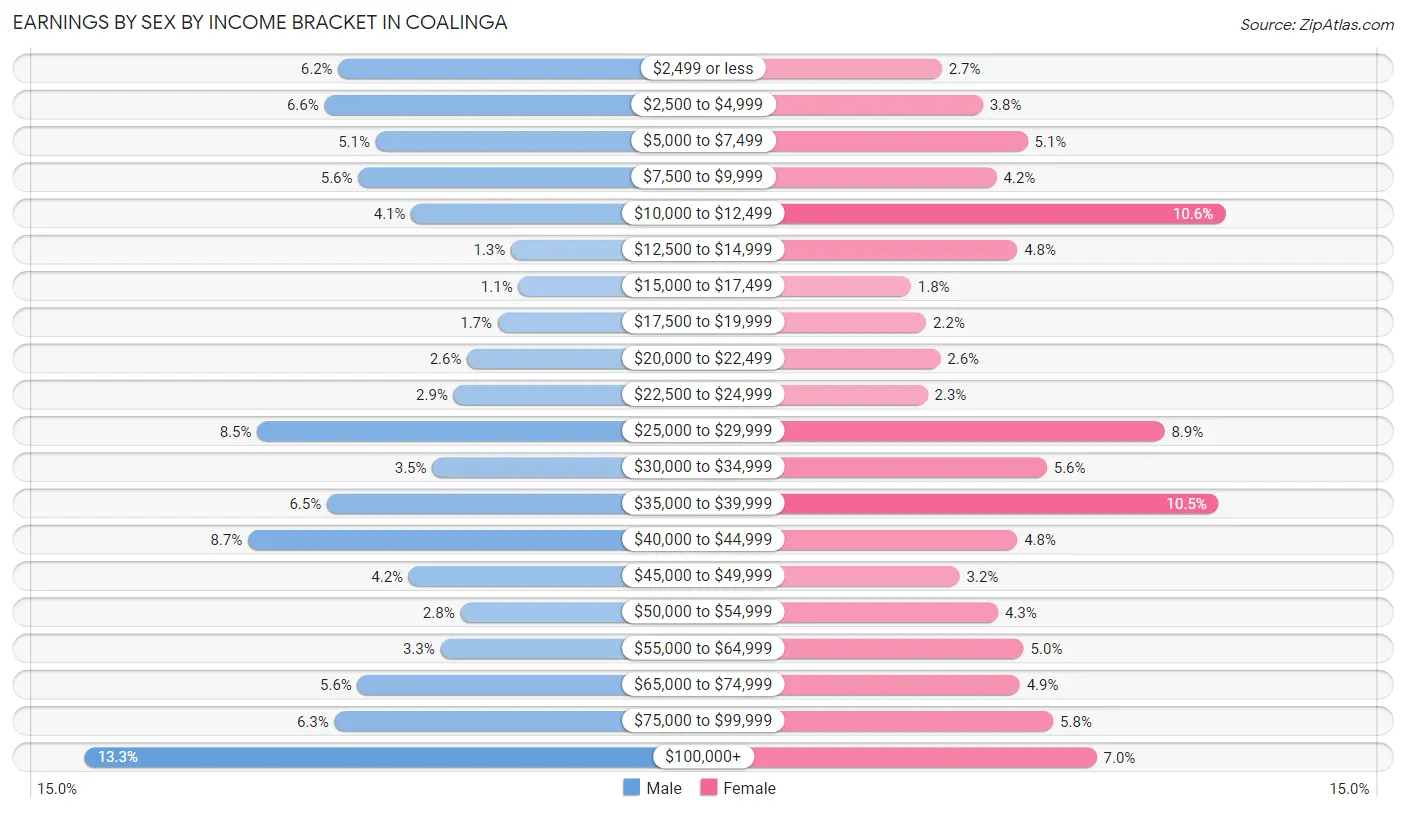
Earnings by Sex by Income Bracket in Coalinga
The most common earnings brackets in Coalinga are $100,000+ for men (571 | 13.3%) and $10,000 to $12,499 for women (295 | 10.6%).
| Income | Male | Female |
| $2,499 or less | 265 (6.2%) | 74 (2.7%) |
| $2,500 to $4,999 | 282 (6.6%) | 106 (3.8%) |
| $5,000 to $7,499 | 220 (5.1%) | 141 (5.1%) |
| $7,500 to $9,999 | 241 (5.6%) | 117 (4.2%) |
| $10,000 to $12,499 | 177 (4.1%) | 295 (10.6%) |
| $12,500 to $14,999 | 57 (1.3%) | 133 (4.8%) |
| $15,000 to $17,499 | 48 (1.1%) | 50 (1.8%) |
| $17,500 to $19,999 | 73 (1.7%) | 62 (2.2%) |
| $20,000 to $22,499 | 110 (2.6%) | 73 (2.6%) |
| $22,500 to $24,999 | 126 (2.9%) | 63 (2.3%) |
| $25,000 to $29,999 | 363 (8.5%) | 248 (8.9%) |
| $30,000 to $34,999 | 152 (3.5%) | 156 (5.6%) |
| $35,000 to $39,999 | 279 (6.5%) | 290 (10.4%) |
| $40,000 to $44,999 | 374 (8.7%) | 133 (4.8%) |
| $45,000 to $49,999 | 180 (4.2%) | 88 (3.2%) |
| $50,000 to $54,999 | 118 (2.8%) | 118 (4.3%) |
| $55,000 to $64,999 | 142 (3.3%) | 138 (5.0%) |
| $65,000 to $74,999 | 242 (5.6%) | 135 (4.9%) |
| $75,000 to $99,999 | 270 (6.3%) | 161 (5.8%) |
| $100,000+ | 571 (13.3%) | 195 (7.0%) |
| Total | 4,290 (100.0%) | 2,776 (100.0%) |
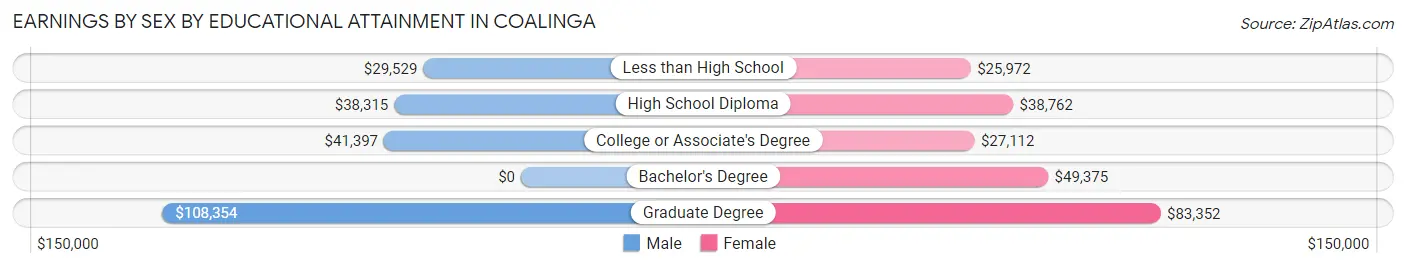
Earnings by Sex by Educational Attainment in Coalinga
Average earnings in Coalinga are $38,686 for men and $36,192 for women, a difference of 6.5%. Men with an educational attainment of graduate degree enjoy the highest average annual earnings of $108,354, while those with less than high school education earn the least with $29,529. Women with an educational attainment of graduate degree earn the most with the average annual earnings of $83,352, while those with less than high school education have the smallest earnings of $25,972.
| Educational Attainment | Male Income | Female Income |
| Less than High School | $29,529 | $25,972 |
| High School Diploma | $38,315 | $38,762 |
| College or Associate's Degree | $41,397 | $27,112 |
| Bachelor's Degree | - | - |
| Graduate Degree | $108,354 | $83,352 |
| Total | $38,686 | $36,192 |
Family Income in Coalinga
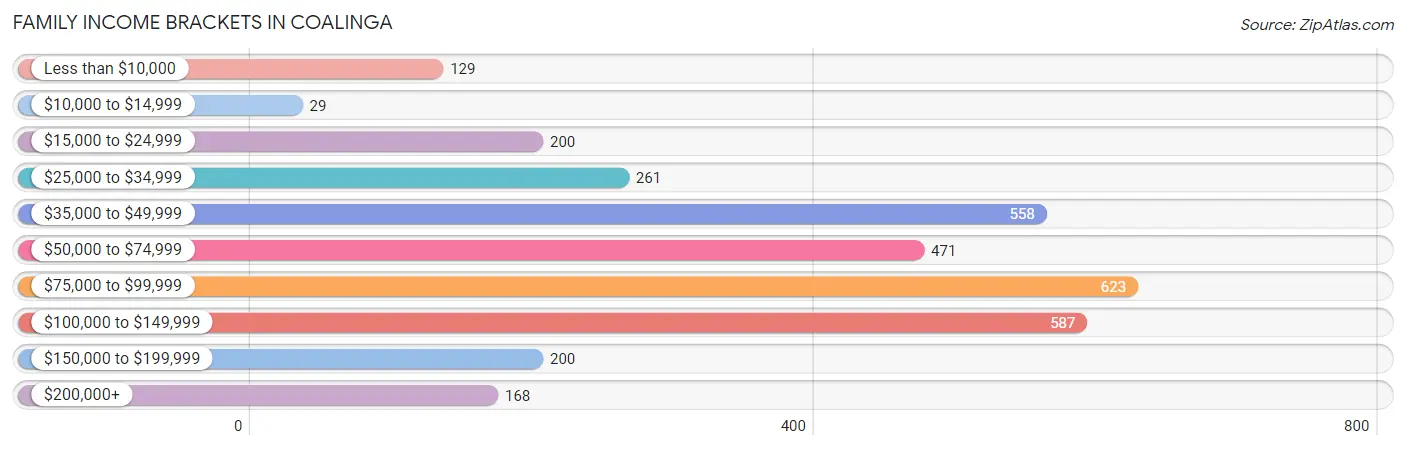
Family Income Brackets in Coalinga
According to the Coalinga family income data, there are 623 families falling into the $75,000 to $99,999 income range, which is the most common income bracket and makes up 19.3% of all families. Conversely, the $10,000 to $14,999 income bracket is the least frequent group with only 29 families (0.9%) belonging to this category.
| Income Bracket | # Families | % Families |
| Less than $10,000 | 129 | 4.0% |
| $10,000 to $14,999 | 29 | 0.9% |
| $15,000 to $24,999 | 200 | 6.2% |
| $25,000 to $34,999 | 261 | 8.1% |
| $35,000 to $49,999 | 558 | 17.3% |
| $50,000 to $74,999 | 471 | 14.6% |
| $75,000 to $99,999 | 623 | 19.3% |
| $100,000 to $149,999 | 587 | 18.2% |
| $150,000 to $199,999 | 200 | 6.2% |
| $200,000+ | 168 | 5.2% |
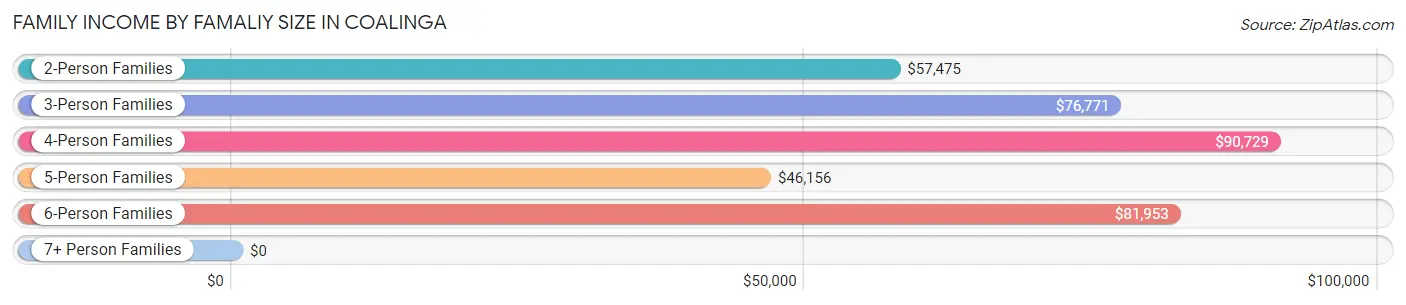
Family Income by Famaliy Size in Coalinga
4-person families (617 | 19.1%) account for the highest median family income in Coalinga with $90,729 per family, while 2-person families (1,069 | 33.1%) have the highest median income of $28,738 per family member.
| Income Bracket | # Families | Median Income |
| 2-Person Families | 1,069 (33.1%) | $57,475 |
| 3-Person Families | 793 (24.6%) | $76,771 |
| 4-Person Families | 617 (19.1%) | $90,729 |
| 5-Person Families | 405 (12.6%) | $46,156 |
| 6-Person Families | 269 (8.3%) | $81,953 |
| 7+ Person Families | 73 (2.3%) | $0 |
| Total | 3,226 (100.0%) | $69,500 |
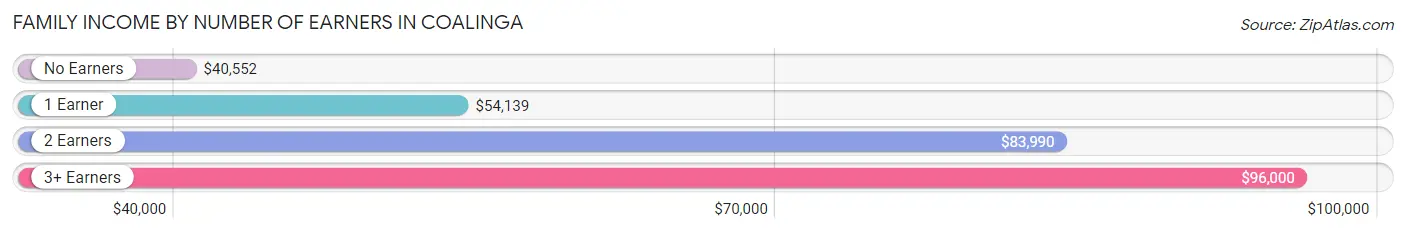
Family Income by Number of Earners in Coalinga
The median family income in Coalinga is $69,500, with families comprising 3+ earners (420) having the highest median family income of $96,000, while families with no earners (461) have the lowest median family income of $40,552, accounting for 13.0% and 14.3% of families, respectively.
| Number of Earners | # Families | Median Income |
| No Earners | 461 (14.3%) | $40,552 |
| 1 Earner | 1,422 (44.1%) | $54,139 |
| 2 Earners | 923 (28.6%) | $83,990 |
| 3+ Earners | 420 (13.0%) | $96,000 |
| Total | 3,226 (100.0%) | $69,500 |
Household Income in Coalinga
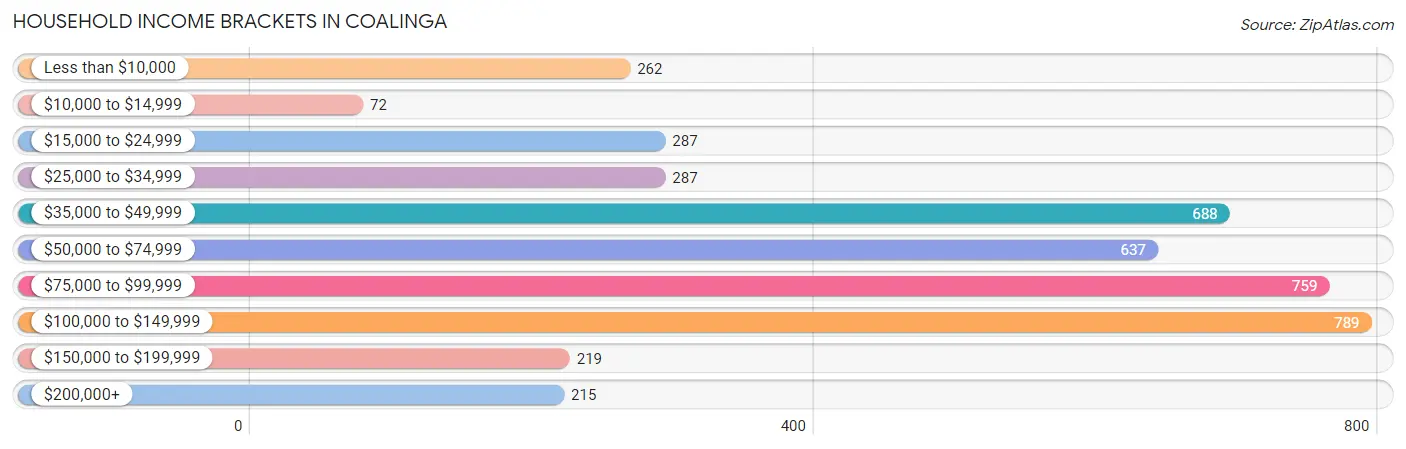
Household Income Brackets in Coalinga
With 789 households falling in the category, the $100,000 to $149,999 income range is the most frequent in Coalinga, accounting for 18.7% of all households. In contrast, only 72 households (1.7%) fall into the $10,000 to $14,999 income bracket, making it the least populous group.
| Income Bracket | # Households | % Households |
| Less than $10,000 | 262 | 6.2% |
| $10,000 to $14,999 | 72 | 1.7% |
| $15,000 to $24,999 | 287 | 6.8% |
| $25,000 to $34,999 | 287 | 6.8% |
| $35,000 to $49,999 | 688 | 16.3% |
| $50,000 to $74,999 | 637 | 15.1% |
| $75,000 to $99,999 | 759 | 18.0% |
| $100,000 to $149,999 | 789 | 18.7% |
| $150,000 to $199,999 | 219 | 5.2% |
| $200,000+ | 215 | 5.1% |
Household Income by Householder Age in Coalinga
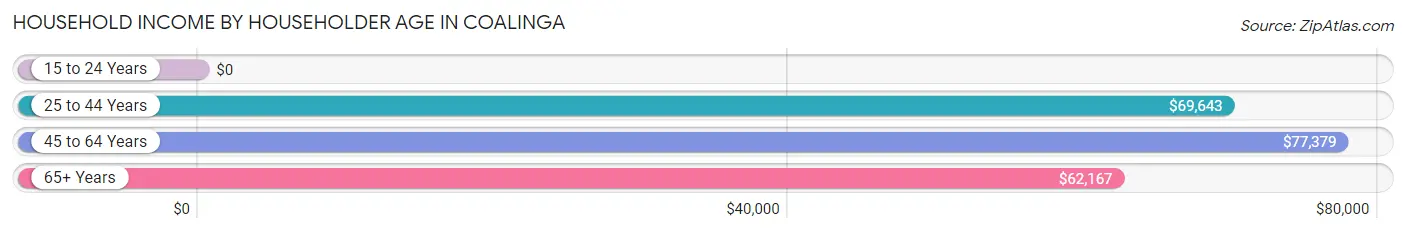
The median household income in Coalinga is $68,976, with the highest median household income of $77,379 found in the 45 to 64 years age bracket for the primary householder. A total of 1,547 households (36.7%) fall into this category. Meanwhile, the 15 to 24 years age bracket for the primary householder has the lowest median household income of $0, with 44 households (1.0%) in this group.
| Income Bracket | # Households | Median Income |
| 15 to 24 Years | 44 (1.0%) | $0 |
| 25 to 44 Years | 1,780 (42.2%) | $69,643 |
| 45 to 64 Years | 1,547 (36.7%) | $77,379 |
| 65+ Years | 848 (20.1%) | $62,167 |
| Total | 4,219 (100.0%) | $68,976 |
Poverty in Coalinga
Income Below Poverty by Sex and Age in Coalinga
With 15.8% poverty level for males and 21.8% for females among the residents of Coalinga, 65 to 74 year old males and 5 year old females are the most vulnerable to poverty, with 195 males (34.0%) and 17 females (100.0%) in their respective age groups living below the poverty level.
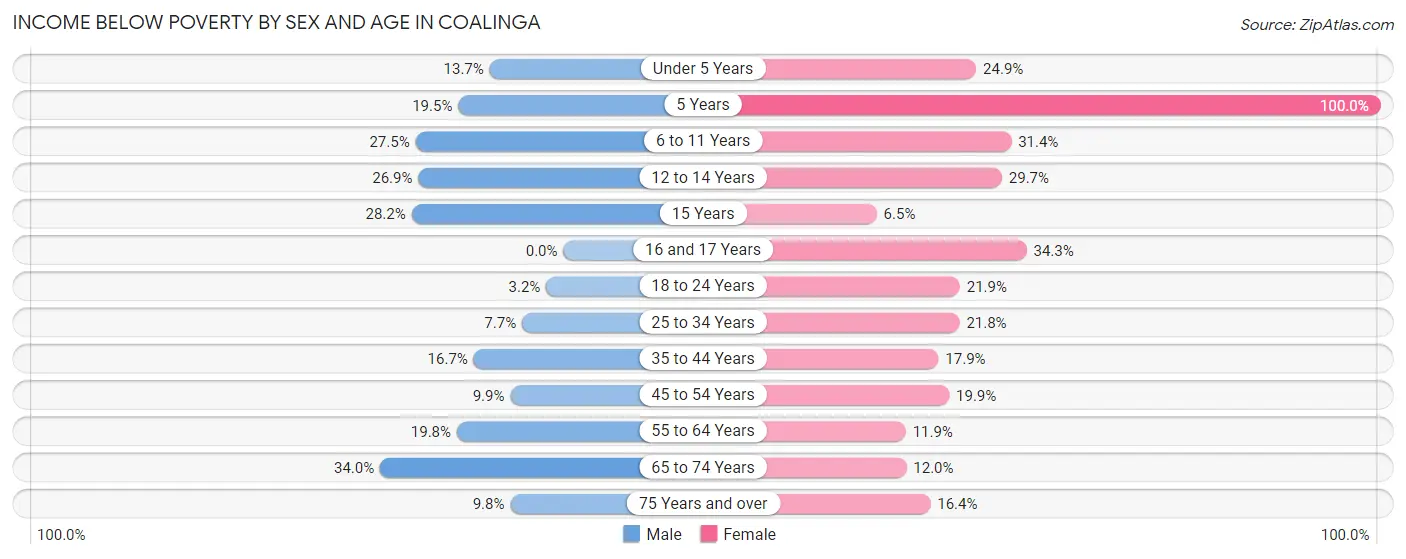
| Age Bracket | Male | Female |
| Under 5 Years | 56 (13.7%) | 97 (24.9%) |
| 5 Years | 16 (19.5%) | 17 (100.0%) |
| 6 to 11 Years | 202 (27.5%) | 283 (31.4%) |
| 12 to 14 Years | 49 (26.9%) | 123 (29.7%) |
| 15 Years | 40 (28.2%) | 11 (6.5%) |
| 16 and 17 Years | 0 (0.0%) | 132 (34.3%) |
| 18 to 24 Years | 25 (3.2%) | 145 (21.9%) |
| 25 to 34 Years | 50 (7.7%) | 207 (21.8%) |
| 35 to 44 Years | 181 (16.7%) | 182 (17.9%) |
| 45 to 54 Years | 77 (9.9%) | 145 (19.9%) |
| 55 to 64 Years | 193 (19.8%) | 76 (11.9%) |
| 65 to 74 Years | 195 (34.0%) | 43 (12.0%) |
| 75 Years and over | 54 (9.8%) | 55 (16.4%) |
| Total | 1,138 (15.8%) | 1,516 (21.8%) |
Income Above Poverty by Sex and Age in Coalinga
According to the poverty statistics in Coalinga, males aged 16 and 17 years and females aged 15 years are the age groups that are most secure financially, with 100.0% of males and 93.5% of females in these age groups living above the poverty line.
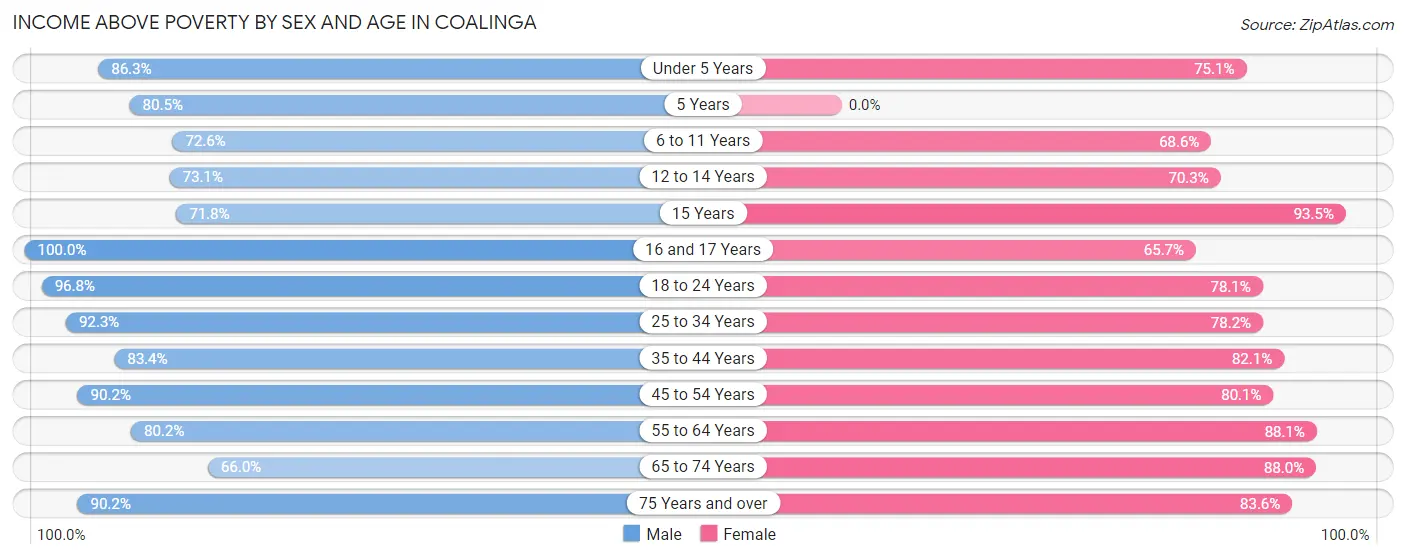
| Age Bracket | Male | Female |
| Under 5 Years | 353 (86.3%) | 292 (75.1%) |
| 5 Years | 66 (80.5%) | 0 (0.0%) |
| 6 to 11 Years | 534 (72.6%) | 617 (68.6%) |
| 12 to 14 Years | 133 (73.1%) | 291 (70.3%) |
| 15 Years | 102 (71.8%) | 159 (93.5%) |
| 16 and 17 Years | 266 (100.0%) | 253 (65.7%) |
| 18 to 24 Years | 762 (96.8%) | 517 (78.1%) |
| 25 to 34 Years | 601 (92.3%) | 741 (78.2%) |
| 35 to 44 Years | 906 (83.4%) | 833 (82.1%) |
| 45 to 54 Years | 705 (90.1%) | 583 (80.1%) |
| 55 to 64 Years | 783 (80.2%) | 565 (88.1%) |
| 65 to 74 Years | 378 (66.0%) | 316 (88.0%) |
| 75 Years and over | 495 (90.2%) | 280 (83.6%) |
| Total | 6,084 (84.2%) | 5,447 (78.2%) |
Income Below Poverty Among Married-Couple Families in Coalinga
The poverty statistics for married-couple families in Coalinga show that 5.7% or 116 of the total 2,027 families live below the poverty line. Families with 3 or 4 children have the highest poverty rate of 15.1%, comprising of 45 families. On the other hand, families with 5 or more children have the lowest poverty rate of 0.0%, which includes 0 families.
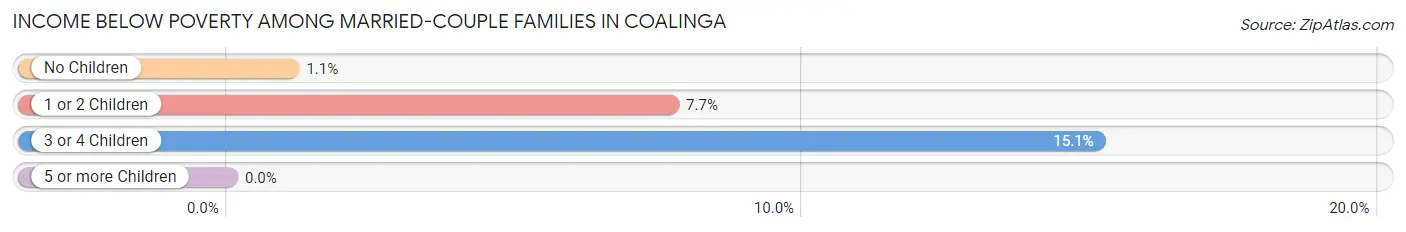
| Children | Above Poverty | Below Poverty |
| No Children | 923 (98.9%) | 10 (1.1%) |
| 1 or 2 Children | 733 (92.3%) | 61 (7.7%) |
| 3 or 4 Children | 253 (84.9%) | 45 (15.1%) |
| 5 or more Children | 2 (100.0%) | 0 (0.0%) |
| Total | 1,911 (94.3%) | 116 (5.7%) |
Income Below Poverty Among Single-Parent Households in Coalinga
According to the poverty data in Coalinga, 5.0% or 19 single-father households and 36.6% or 299 single-mother households are living below the poverty line. Among single-father households, those with 3 or 4 children have the highest poverty rate, with 8 households (10.4%) experiencing poverty. Likewise, among single-mother households, those with 3 or 4 children have the highest poverty rate, with 138 households (83.6%) falling below the poverty line.
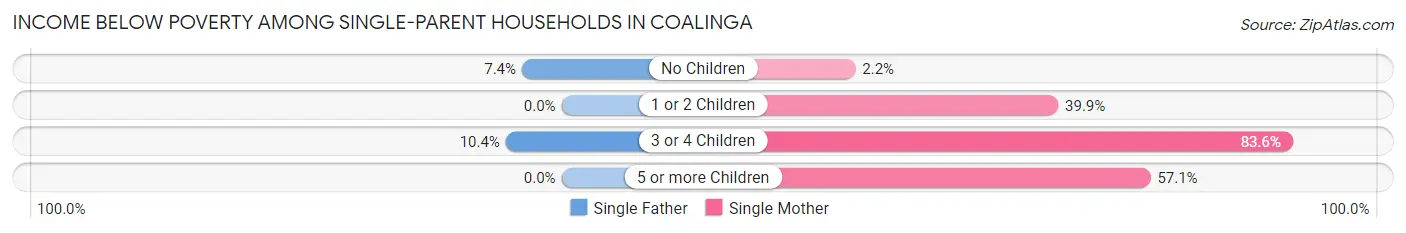
| Children | Single Father | Single Mother |
| No Children | 11 (7.4%) | 6 (2.2%) |
| 1 or 2 Children | 0 (0.0%) | 139 (39.9%) |
| 3 or 4 Children | 8 (10.4%) | 138 (83.6%) |
| 5 or more Children | 0 (0.0%) | 16 (57.1%) |
| Total | 19 (5.0%) | 299 (36.6%) |
Income Below Poverty Among Married-Couple vs Single-Parent Households in Coalinga
The poverty data for Coalinga shows that 116 of the married-couple family households (5.7%) and 318 of the single-parent households (26.5%) are living below the poverty level. Within the married-couple family households, those with 3 or 4 children have the highest poverty rate, with 45 households (15.1%) falling below the poverty line. Among the single-parent households, those with 3 or 4 children have the highest poverty rate, with 146 household (60.3%) living below poverty.
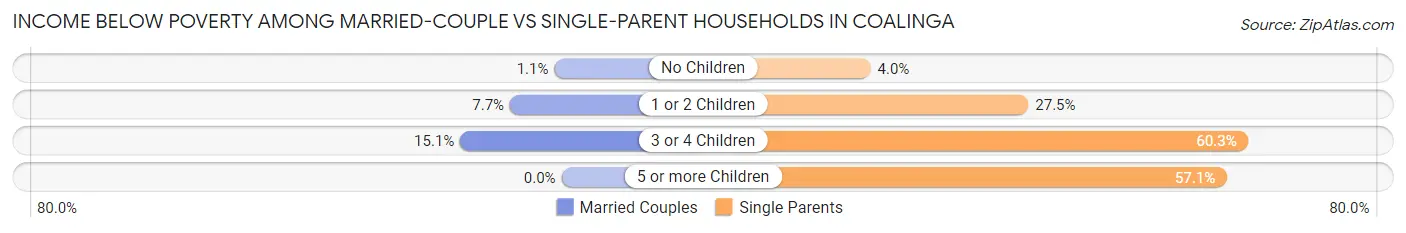
| Children | Married-Couple Families | Single-Parent Households |
| No Children | 10 (1.1%) | 17 (4.0%) |
| 1 or 2 Children | 61 (7.7%) | 139 (27.5%) |
| 3 or 4 Children | 45 (15.1%) | 146 (60.3%) |
| 5 or more Children | 0 (0.0%) | 16 (57.1%) |
| Total | 116 (5.7%) | 318 (26.5%) |
Race in Coalinga
The most populous races in Coalinga are Hispanic or Latino (11,037 | 63.1%), White / Caucasian (6,911 | 39.5%), and Some other Race (5,936 | 33.9%).
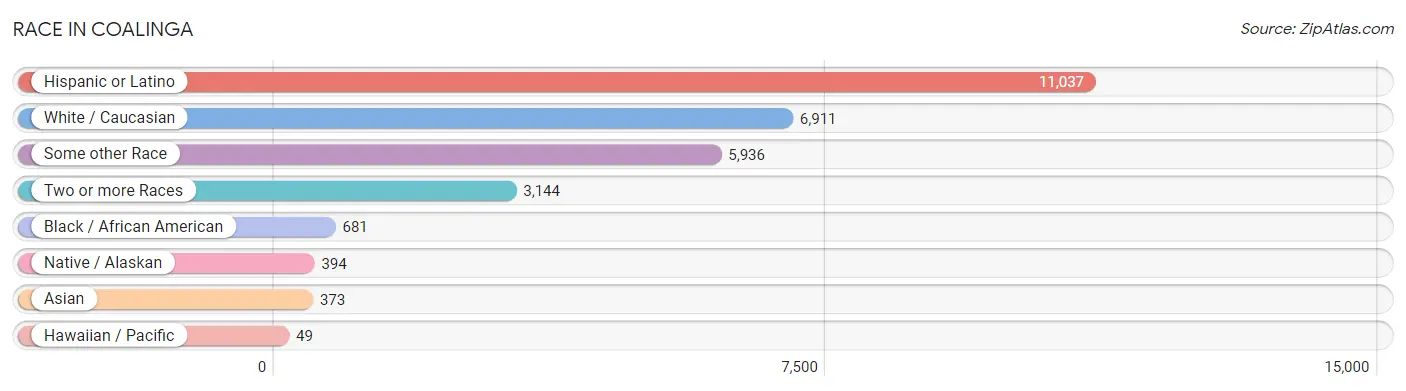
| Race | # Population | % Population |
| Asian | 373 | 2.1% |
| Black / African American | 681 | 3.9% |
| Hawaiian / Pacific | 49 | 0.3% |
| Hispanic or Latino | 11,037 | 63.1% |
| Native / Alaskan | 394 | 2.2% |
| White / Caucasian | 6,911 | 39.5% |
| Two or more Races | 3,144 | 18.0% |
| Some other Race | 5,936 | 33.9% |
| Total | 17,488 | 100.0% |
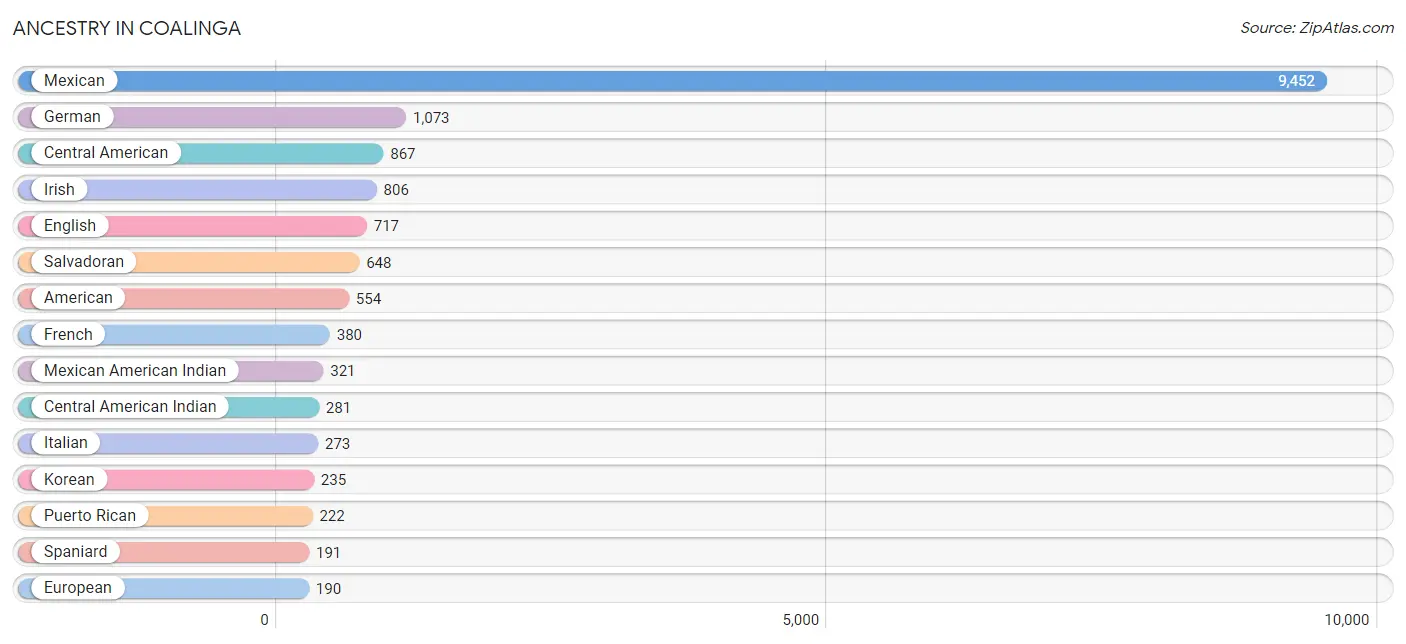
Ancestry in Coalinga
The most populous ancestries reported in Coalinga are Mexican (9,452 | 54.0%), German (1,073 | 6.1%), Central American (867 | 5.0%), Irish (806 | 4.6%), and English (717 | 4.1%), together accounting for 73.9% of all Coalinga residents.
| Ancestry | # Population | % Population |
| African | 40 | 0.2% |
| American | 554 | 3.2% |
| Apache | 55 | 0.3% |
| Arab | 44 | 0.3% |
| Armenian | 27 | 0.2% |
| Bangladeshi | 12 | 0.1% |
| Bhutanese | 138 | 0.8% |
| Blackfeet | 44 | 0.3% |
| Bolivian | 42 | 0.2% |
| British | 43 | 0.3% |
| Burmese | 25 | 0.1% |
| Canadian | 7 | 0.0% |
| Central American | 867 | 5.0% |
| Central American Indian | 281 | 1.6% |
| Cherokee | 119 | 0.7% |
| Choctaw | 186 | 1.1% |
| Costa Rican | 2 | 0.0% |
| Creek | 14 | 0.1% |
| Cuban | 15 | 0.1% |
| Czech | 24 | 0.1% |
| Czechoslovakian | 8 | 0.1% |
| Danish | 14 | 0.1% |
| Delaware | 27 | 0.2% |
| Dutch | 100 | 0.6% |
| English | 717 | 4.1% |
| European | 190 | 1.1% |
| French | 380 | 2.2% |
| French American Indian | 27 | 0.2% |
| French Canadian | 4 | 0.0% |
| German | 1,073 | 6.1% |
| Greek | 1 | 0.0% |
| Guatemalan | 69 | 0.4% |
| Honduran | 148 | 0.9% |
| Hungarian | 18 | 0.1% |
| Indian (Asian) | 83 | 0.5% |
| Irish | 806 | 4.6% |
| Israeli | 13 | 0.1% |
| Italian | 273 | 1.6% |
| Japanese | 5 | 0.0% |
| Jordanian | 17 | 0.1% |
| Korean | 235 | 1.3% |
| Laotian | 42 | 0.2% |
| Lithuanian | 4 | 0.0% |
| Lumbee | 54 | 0.3% |
| Malaysian | 36 | 0.2% |
| Mexican | 9,452 | 54.0% |
| Mexican American Indian | 321 | 1.8% |
| Moroccan | 7 | 0.0% |
| Native Hawaiian | 11 | 0.1% |
| Navajo | 19 | 0.1% |
| Northern European | 15 | 0.1% |
| Norwegian | 99 | 0.6% |
| Polish | 63 | 0.4% |
| Portuguese | 149 | 0.9% |
| Potawatomi | 10 | 0.1% |
| Puerto Rican | 222 | 1.3% |
| Romanian | 9 | 0.1% |
| Russian | 168 | 1.0% |
| Salvadoran | 648 | 3.7% |
| Samoan | 52 | 0.3% |
| Scandinavian | 12 | 0.1% |
| Scotch-Irish | 21 | 0.1% |
| Scottish | 146 | 0.8% |
| Sioux | 4 | 0.0% |
| South American | 42 | 0.2% |
| Spaniard | 191 | 1.1% |
| Spanish | 28 | 0.2% |
| Sri Lankan | 28 | 0.2% |
| Subsaharan African | 45 | 0.3% |
| Swedish | 85 | 0.5% |
| Swiss | 45 | 0.3% |
| Syrian | 11 | 0.1% |
| Thai | 12 | 0.1% |
| Ukrainian | 32 | 0.2% |
| Welsh | 25 | 0.1% |
| Yaqui | 147 | 0.8% | View All 76 Rows |
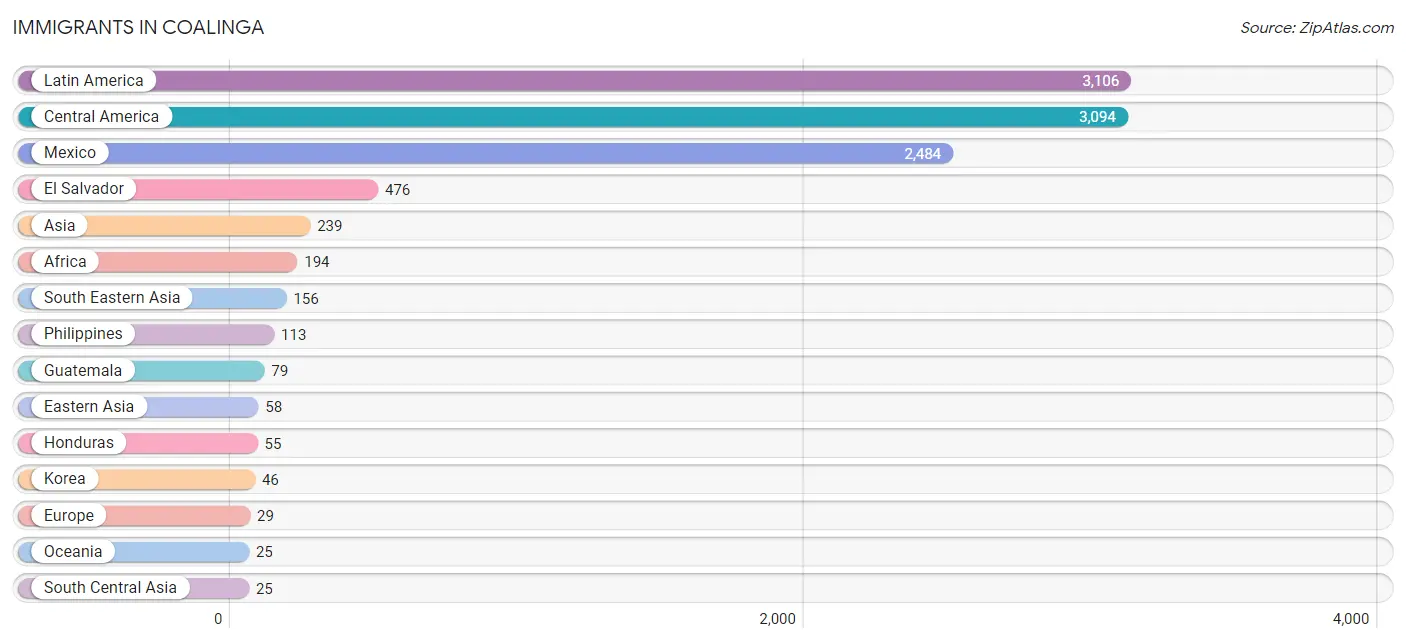
Immigrants in Coalinga
The most numerous immigrant groups reported in Coalinga came from Latin America (3,106 | 17.8%), Central America (3,094 | 17.7%), Mexico (2,484 | 14.2%), El Salvador (476 | 2.7%), and Asia (239 | 1.4%), together accounting for 53.7% of all Coalinga residents.
| Immigration Origin | # Population | % Population |
| Africa | 194 | 1.1% |
| Asia | 239 | 1.4% |
| Australia | 12 | 0.1% |
| Bolivia | 12 | 0.1% |
| Canada | 8 | 0.1% |
| Central America | 3,094 | 17.7% |
| China | 5 | 0.0% |
| Eastern Africa | 15 | 0.1% |
| Eastern Asia | 58 | 0.3% |
| Eastern Europe | 17 | 0.1% |
| Egypt | 5 | 0.0% |
| El Salvador | 476 | 2.7% |
| England | 1 | 0.0% |
| Europe | 29 | 0.2% |
| Fiji | 7 | 0.0% |
| Germany | 11 | 0.1% |
| Guatemala | 79 | 0.4% |
| Honduras | 55 | 0.3% |
| India | 1 | 0.0% |
| Indonesia | 19 | 0.1% |
| Japan | 7 | 0.0% |
| Korea | 46 | 0.3% |
| Latin America | 3,106 | 17.8% |
| Mexico | 2,484 | 14.2% |
| Morocco | 13 | 0.1% |
| Nepal | 24 | 0.1% |
| Nigeria | 12 | 0.1% |
| Northern Africa | 18 | 0.1% |
| Northern Europe | 1 | 0.0% |
| Oceania | 25 | 0.1% |
| Philippines | 113 | 0.6% |
| Russia | 11 | 0.1% |
| South America | 12 | 0.1% |
| South Central Asia | 25 | 0.1% |
| South Eastern Asia | 156 | 0.9% |
| Thailand | 5 | 0.0% |
| Uganda | 10 | 0.1% |
| Ukraine | 6 | 0.0% |
| Vietnam | 19 | 0.1% |
| Western Africa | 12 | 0.1% |
| Western Europe | 11 | 0.1% | View All 41 Rows |
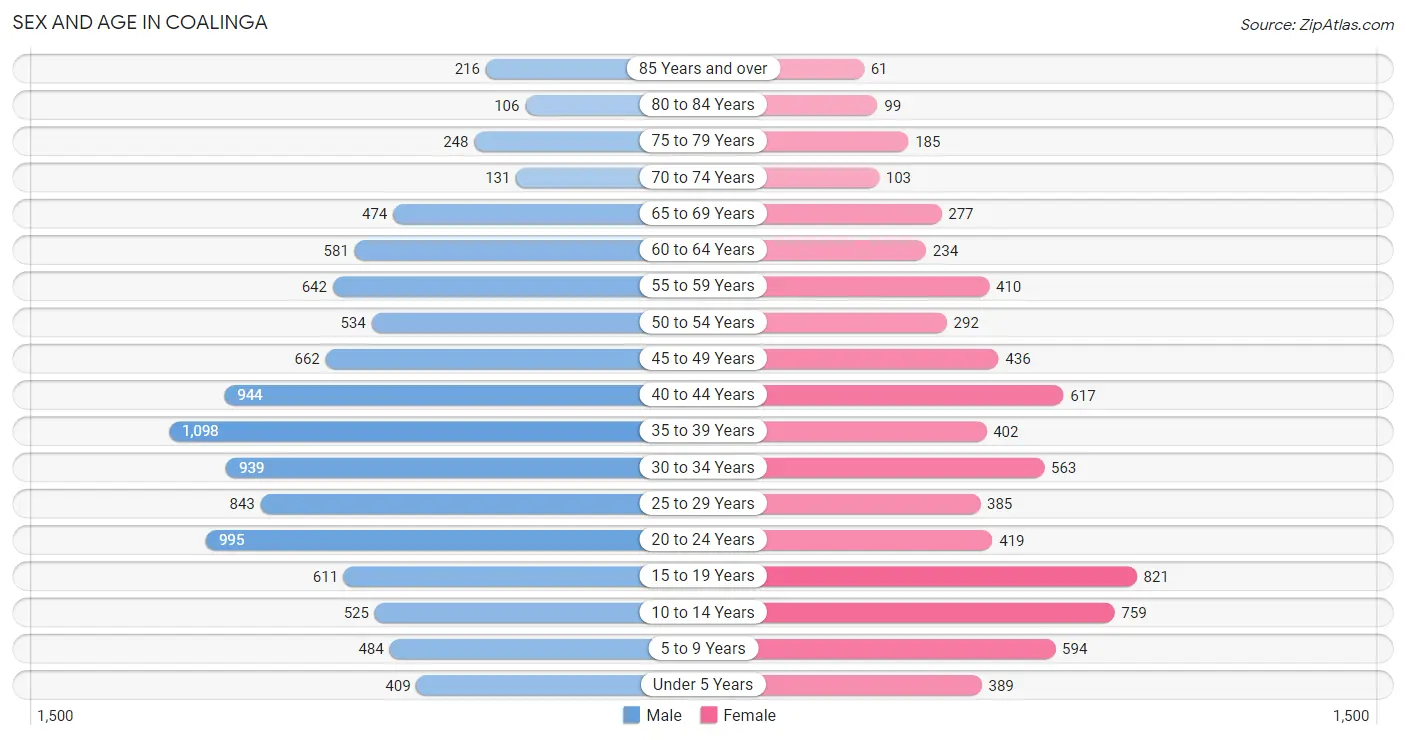
Sex and Age in Coalinga
Sex and Age in Coalinga
The most populous age groups in Coalinga are 35 to 39 Years (1,098 | 10.5%) for men and 15 to 19 Years (821 | 11.7%) for women.
| Age Bracket | Male | Female |
| Under 5 Years | 409 (3.9%) | 389 (5.5%) |
| 5 to 9 Years | 484 (4.6%) | 594 (8.4%) |
| 10 to 14 Years | 525 (5.0%) | 759 (10.8%) |
| 15 to 19 Years | 611 (5.9%) | 821 (11.7%) |
| 20 to 24 Years | 995 (9.5%) | 419 (5.9%) |
| 25 to 29 Years | 843 (8.1%) | 385 (5.5%) |
| 30 to 34 Years | 939 (9.0%) | 563 (8.0%) |
| 35 to 39 Years | 1,098 (10.5%) | 402 (5.7%) |
| 40 to 44 Years | 944 (9.0%) | 617 (8.8%) |
| 45 to 49 Years | 662 (6.3%) | 436 (6.2%) |
| 50 to 54 Years | 534 (5.1%) | 292 (4.1%) |
| 55 to 59 Years | 642 (6.1%) | 410 (5.8%) |
| 60 to 64 Years | 581 (5.6%) | 234 (3.3%) |
| 65 to 69 Years | 474 (4.5%) | 277 (3.9%) |
| 70 to 74 Years | 131 (1.3%) | 103 (1.5%) |
| 75 to 79 Years | 248 (2.4%) | 185 (2.6%) |
| 80 to 84 Years | 106 (1.0%) | 99 (1.4%) |
| 85 Years and over | 216 (2.1%) | 61 (0.9%) |
| Total | 10,442 (100.0%) | 7,046 (100.0%) |
Families and Households in Coalinga
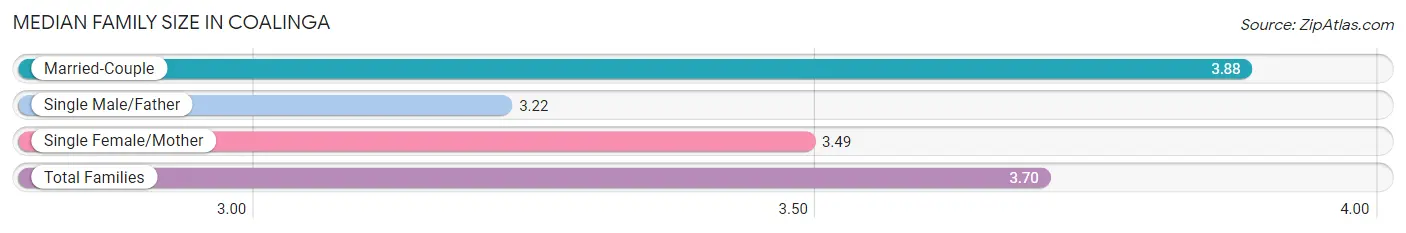
Median Family Size in Coalinga
The median family size in Coalinga is 3.70 persons per family, with married-couple families (2,027 | 62.8%) accounting for the largest median family size of 3.88 persons per family. On the other hand, single male/father families (383 | 11.9%) represent the smallest median family size with 3.22 persons per family.
| Family Type | # Families | Family Size |
| Married-Couple | 2,027 (62.8%) | 3.88 |
| Single Male/Father | 383 (11.9%) | 3.22 |
| Single Female/Mother | 816 (25.3%) | 3.49 |
| Total Families | 3,226 (100.0%) | 3.70 |
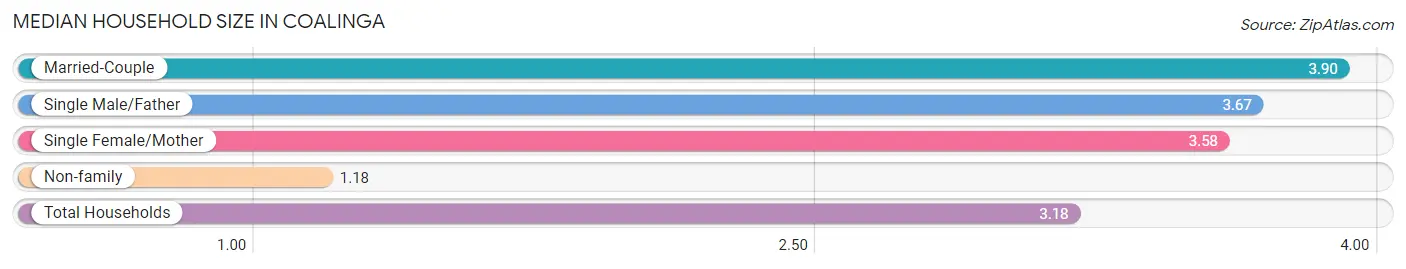
Median Household Size in Coalinga
The median household size in Coalinga is 3.18 persons per household, with married-couple households (2,027 | 48.0%) accounting for the largest median household size of 3.9 persons per household. non-family households (993 | 23.5%) represent the smallest median household size with 1.18 persons per household.
| Household Type | # Households | Household Size |
| Married-Couple | 2,027 (48.0%) | 3.90 |
| Single Male/Father | 383 (9.1%) | 3.67 |
| Single Female/Mother | 816 (19.3%) | 3.58 |
| Non-family | 993 (23.5%) | 1.18 |
| Total Households | 4,219 (100.0%) | 3.18 |
Household Size by Marriage Status in Coalinga
Out of a total of 4,219 households in Coalinga, 3,226 (76.5%) are family households, while 993 (23.5%) are nonfamily households. The most numerous type of family households are 2-person households, comprising 982, and the most common type of nonfamily households are 1-person households, comprising 839.
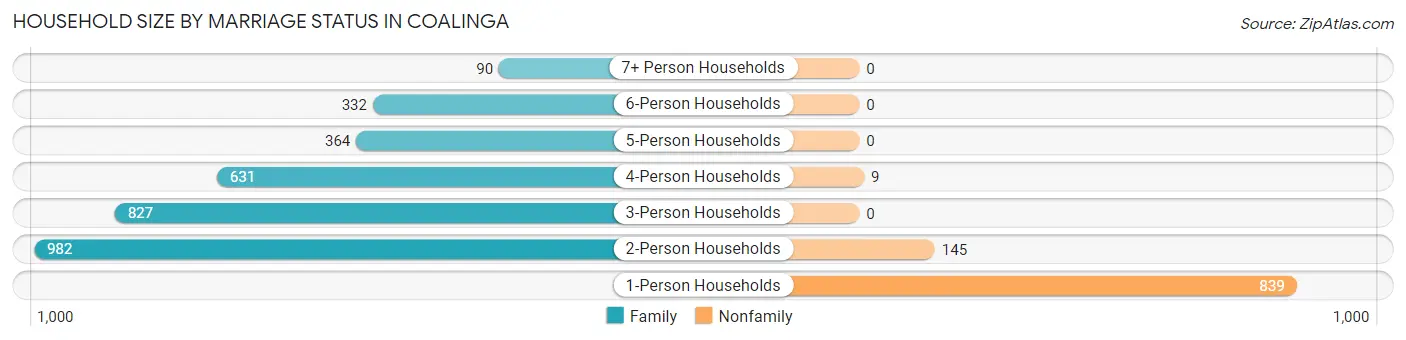
| Household Size | Family Households | Nonfamily Households |
| 1-Person Households | - | 839 (19.9%) |
| 2-Person Households | 982 (23.3%) | 145 (3.4%) |
| 3-Person Households | 827 (19.6%) | 0 (0.0%) |
| 4-Person Households | 631 (15.0%) | 9 (0.2%) |
| 5-Person Households | 364 (8.6%) | 0 (0.0%) |
| 6-Person Households | 332 (7.9%) | 0 (0.0%) |
| 7+ Person Households | 90 (2.1%) | 0 (0.0%) |
| Total | 3,226 (76.5%) | 993 (23.5%) |
Female Fertility in Coalinga
Fertility by Age in Coalinga
Average fertility rate in Coalinga is 39.0 births per 1,000 women. Women in the age bracket of 20 to 34 years have the highest fertility rate with 74.0 births per 1,000 women. Women in the age bracket of 20 to 34 years acount for 69.7% of all women with births.
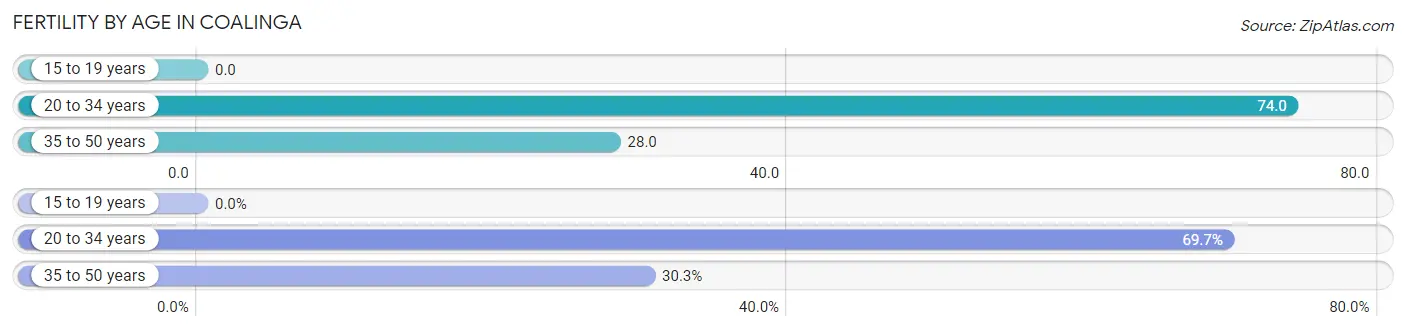
| Age Bracket | Women with Births | Births / 1,000 Women |
| 15 to 19 years | 0 (0.0%) | 0.0 |
| 20 to 34 years | 101 (69.7%) | 74.0 |
| 35 to 50 years | 44 (30.3%) | 28.0 |
| Total | 145 (100.0%) | 39.0 |
Fertility by Age by Marriage Status in Coalinga
57.2% of women with births (145) in Coalinga are married. The highest percentage of unmarried women with births falls into 35 to 50 years age bracket with 52.3% of them unmarried at the time of birth, while the lowest percentage of unmarried women with births belong to 20 to 34 years age bracket with 38.6% of them unmarried.
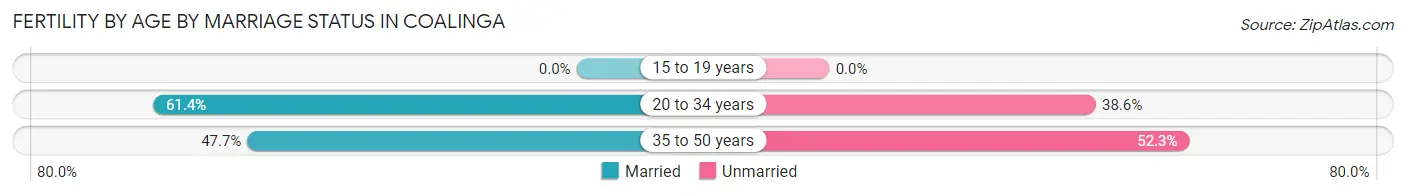
| Age Bracket | Married | Unmarried |
| 15 to 19 years | 0 (0.0%) | 0 (0.0%) |
| 20 to 34 years | 62 (61.4%) | 39 (38.6%) |
| 35 to 50 years | 21 (47.7%) | 23 (52.3%) |
| Total | 83 (57.2%) | 62 (42.8%) |
Fertility by Education in Coalinga
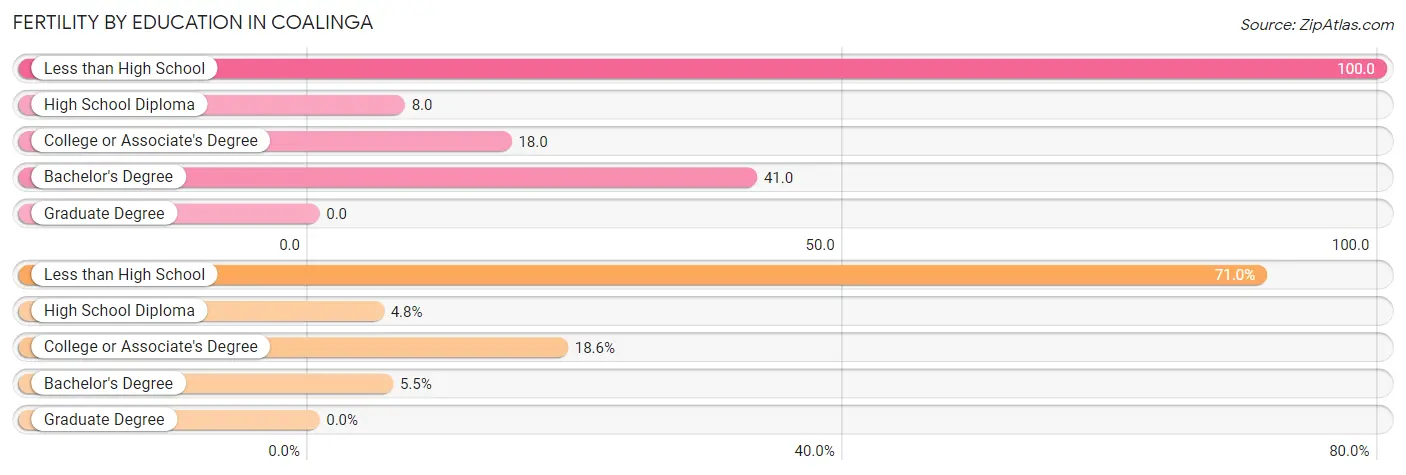
| Educational Attainment | Women with Births | Births / 1,000 Women |
| Less than High School | 103 (71.0%) | 100.0 |
| High School Diploma | 7 (4.8%) | 8.0 |
| College or Associate's Degree | 27 (18.6%) | 18.0 |
| Bachelor's Degree | 8 (5.5%) | 41.0 |
| Graduate Degree | 0 (0.0%) | 0.0 |
| Total | 145 (100.0%) | 39.0 |
Fertility by Education by Marriage Status in Coalinga
42.8% of women with births in Coalinga are unmarried. Women with the educational attainment of high school diploma are most likely to be married with 100.0% of them married at childbirth, while women with the educational attainment of college or associate's degree are least likely to be married with 100.0% of them unmarried at childbirth.
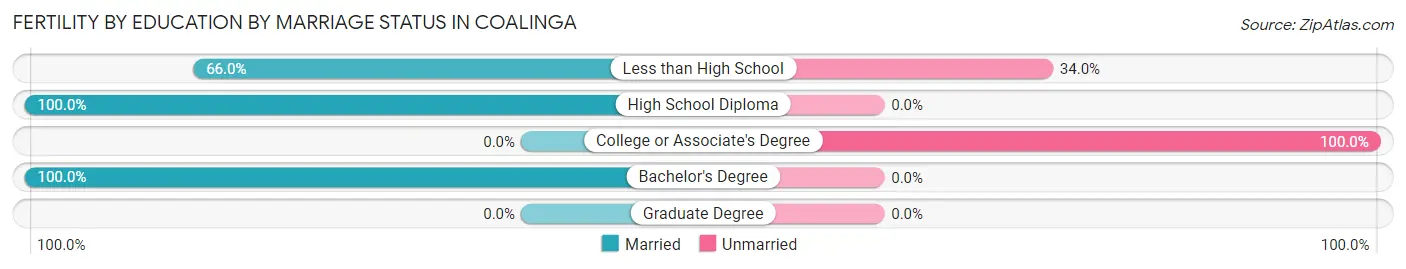
| Educational Attainment | Married | Unmarried |
| Less than High School | 68 (66.0%) | 35 (34.0%) |
| High School Diploma | 7 (100.0%) | 0 (0.0%) |
| College or Associate's Degree | 0 (0.0%) | 27 (100.0%) |
| Bachelor's Degree | 8 (100.0%) | 0 (0.0%) |
| Graduate Degree | 0 (0.0%) | 0 (0.0%) |
| Total | 83 (57.2%) | 62 (42.8%) |
Employment Characteristics in Coalinga
Employment by Class of Employer in Coalinga
Among the 5,463 employed individuals in Coalinga, private company employees (2,703 | 49.5%), state government employees (1,150 | 21.0%), and local government employees (845 | 15.5%) make up the most common classes of employment.
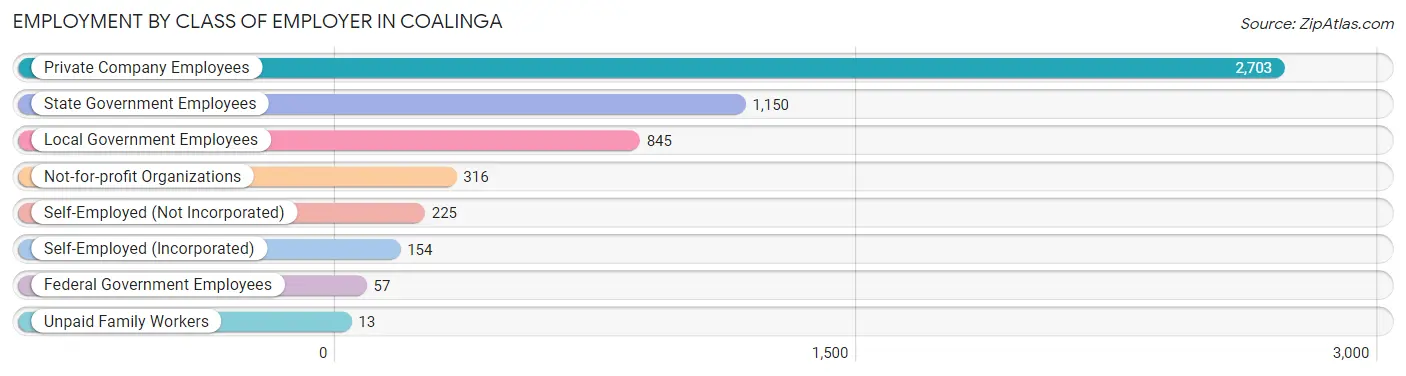
| Employer Class | # Employees | % Employees |
| Private Company Employees | 2,703 | 49.5% |
| Self-Employed (Incorporated) | 154 | 2.8% |
| Self-Employed (Not Incorporated) | 225 | 4.1% |
| Not-for-profit Organizations | 316 | 5.8% |
| Local Government Employees | 845 | 15.5% |
| State Government Employees | 1,150 | 21.0% |
| Federal Government Employees | 57 | 1.0% |
| Unpaid Family Workers | 13 | 0.2% |
| Total | 5,463 | 100.0% |
Employment Status by Age in Coalinga
According to the labor force statistics for Coalinga, out of the total population over 16 years of age (14,016), 45.7% or 6,405 individuals are in the labor force, with 11.8% or 756 of them unemployed. The age group with the highest labor force participation rate is 55 to 59 years, with 80.8% or 850 individuals in the labor force. Within the labor force, the 16 to 19 years age range has the highest percentage of unemployed individuals, with 36.3% or 143 of them being unemployed.
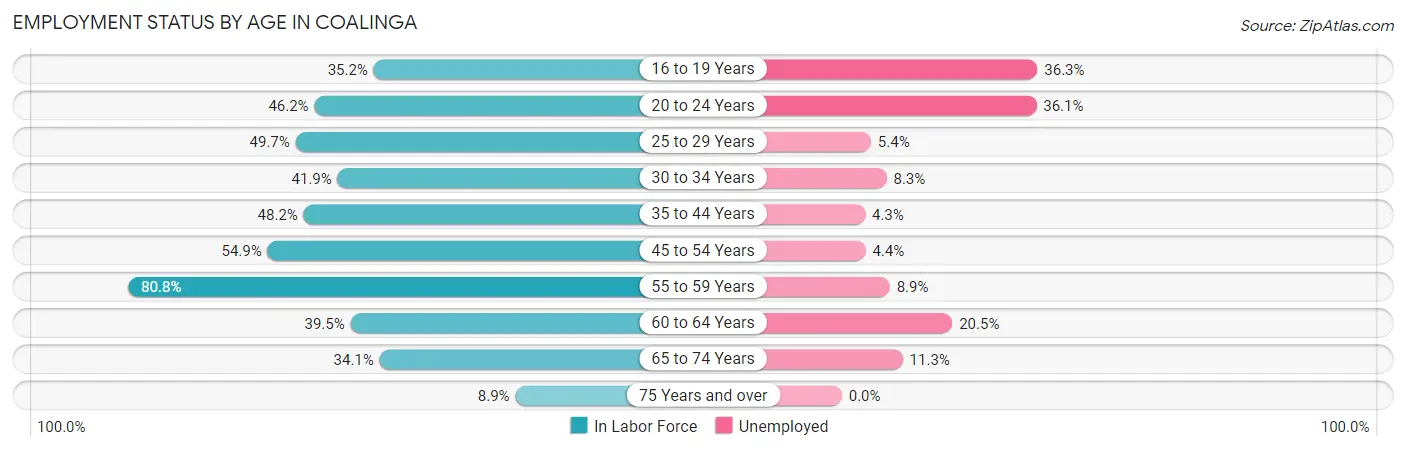
| Age Bracket | In Labor Force | Unemployed |
| 16 to 19 Years | 394 (35.2%) | 143 (36.3%) |
| 20 to 24 Years | 653 (46.2%) | 236 (36.1%) |
| 25 to 29 Years | 610 (49.7%) | 33 (5.4%) |
| 30 to 34 Years | 629 (41.9%) | 52 (8.3%) |
| 35 to 44 Years | 1,475 (48.2%) | 63 (4.3%) |
| 45 to 54 Years | 1,056 (54.9%) | 46 (4.4%) |
| 55 to 59 Years | 850 (80.8%) | 76 (8.9%) |
| 60 to 64 Years | 322 (39.5%) | 66 (20.5%) |
| 65 to 74 Years | 336 (34.1%) | 38 (11.3%) |
| 75 Years and over | 81 (8.9%) | 0 (0.0%) |
| Total | 6,405 (45.7%) | 756 (11.8%) |
Employment Status by Educational Attainment in Coalinga
According to labor force statistics for Coalinga, 51.6% of individuals (4,944) out of the total population between 25 and 64 years of age (9,582) are in the labor force, with 6.8% or 336 of them being unemployed. The group with the highest labor force participation rate are those with the educational attainment of bachelor's degree or higher, with 83.7% or 838 individuals in the labor force. Within the labor force, individuals with less than high school education have the highest percentage of unemployment, with 9.8% or 102 of them being unemployed.
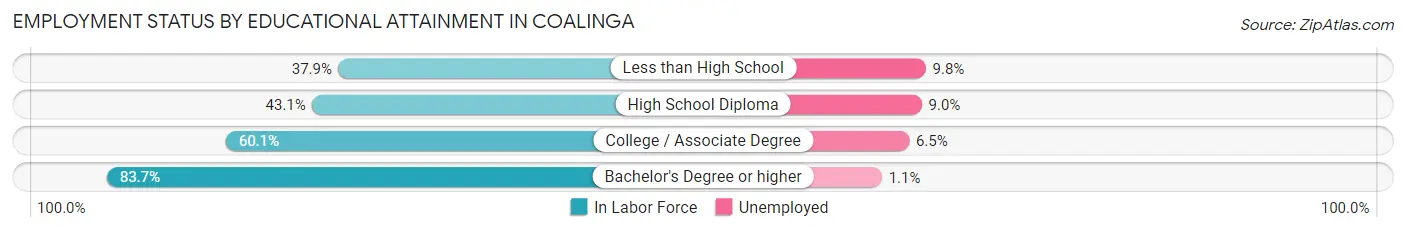
| Educational Attainment | In Labor Force | Unemployed |
| Less than High School | 1,045 (37.9%) | 270 (9.8%) |
| High School Diploma | 1,114 (43.1%) | 233 (9.0%) |
| College / Associate Degree | 1,946 (60.1%) | 210 (6.5%) |
| Bachelor's Degree or higher | 838 (83.7%) | 11 (1.1%) |
| Total | 4,944 (51.6%) | 652 (6.8%) |
Employment Occupations by Sex in Coalinga
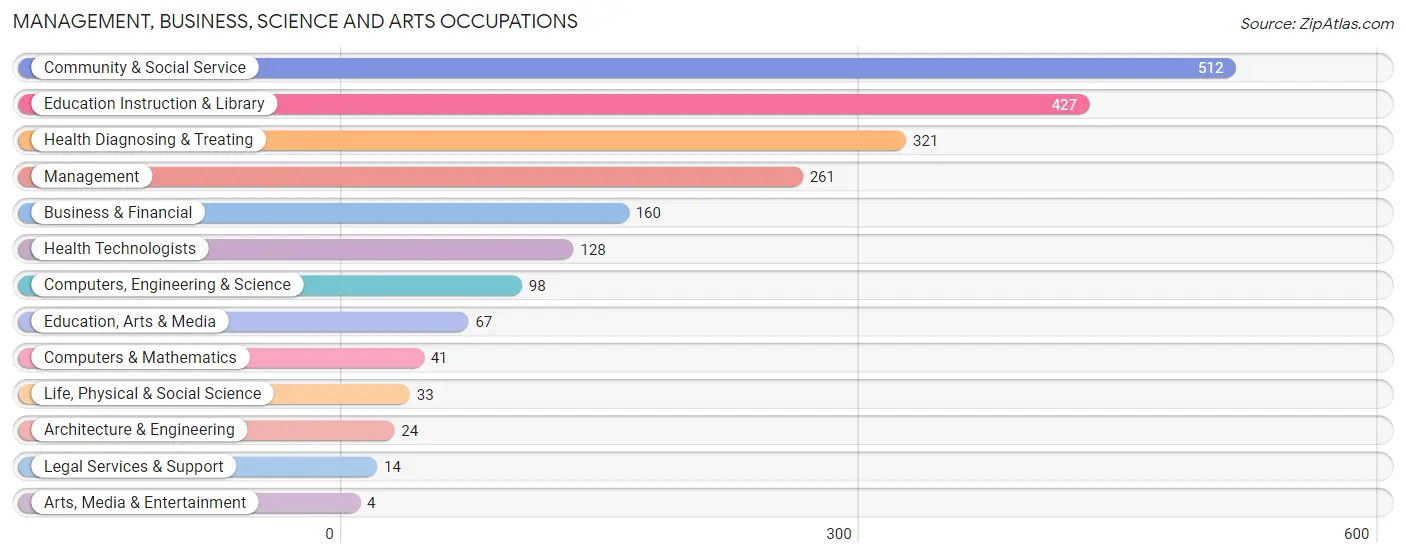
Management, Business, Science and Arts Occupations
The most common Management, Business, Science and Arts occupations in Coalinga are Community & Social Service (512 | 9.1%), Education Instruction & Library (427 | 7.5%), Health Diagnosing & Treating (321 | 5.7%), Management (261 | 4.6%), and Business & Financial (160 | 2.8%).
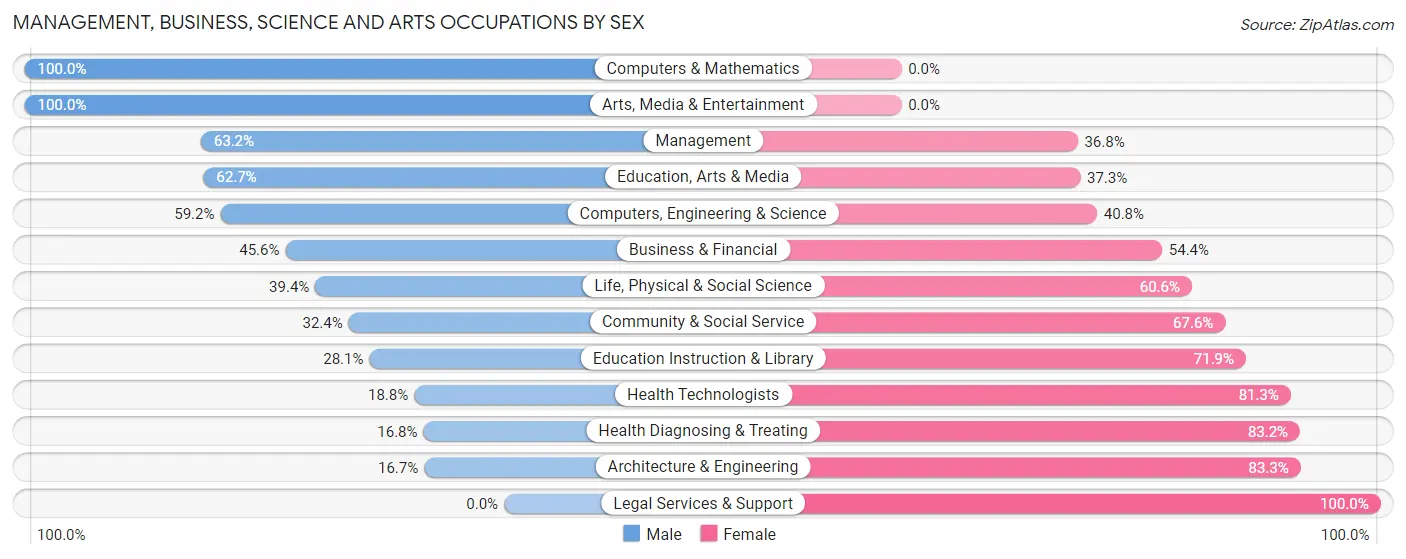
Management, Business, Science and Arts Occupations by Sex
Within the Management, Business, Science and Arts occupations in Coalinga, the most male-oriented occupations are Computers & Mathematics (100.0%), Arts, Media & Entertainment (100.0%), and Management (63.2%), while the most female-oriented occupations are Legal Services & Support (100.0%), Architecture & Engineering (83.3%), and Health Diagnosing & Treating (83.2%).
| Occupation | Male | Female |
| Management | 165 (63.2%) | 96 (36.8%) |
| Business & Financial | 73 (45.6%) | 87 (54.4%) |
| Computers, Engineering & Science | 58 (59.2%) | 40 (40.8%) |
| Computers & Mathematics | 41 (100.0%) | 0 (0.0%) |
| Architecture & Engineering | 4 (16.7%) | 20 (83.3%) |
| Life, Physical & Social Science | 13 (39.4%) | 20 (60.6%) |
| Community & Social Service | 166 (32.4%) | 346 (67.6%) |
| Education, Arts & Media | 42 (62.7%) | 25 (37.3%) |
| Legal Services & Support | 0 (0.0%) | 14 (100.0%) |
| Education Instruction & Library | 120 (28.1%) | 307 (71.9%) |
| Arts, Media & Entertainment | 4 (100.0%) | 0 (0.0%) |
| Health Diagnosing & Treating | 54 (16.8%) | 267 (83.2%) |
| Health Technologists | 24 (18.8%) | 104 (81.2%) |
| Total (Category) | 516 (38.2%) | 836 (61.8%) |
| Total (Overall) | 3,334 (59.0%) | 2,319 (41.0%) |
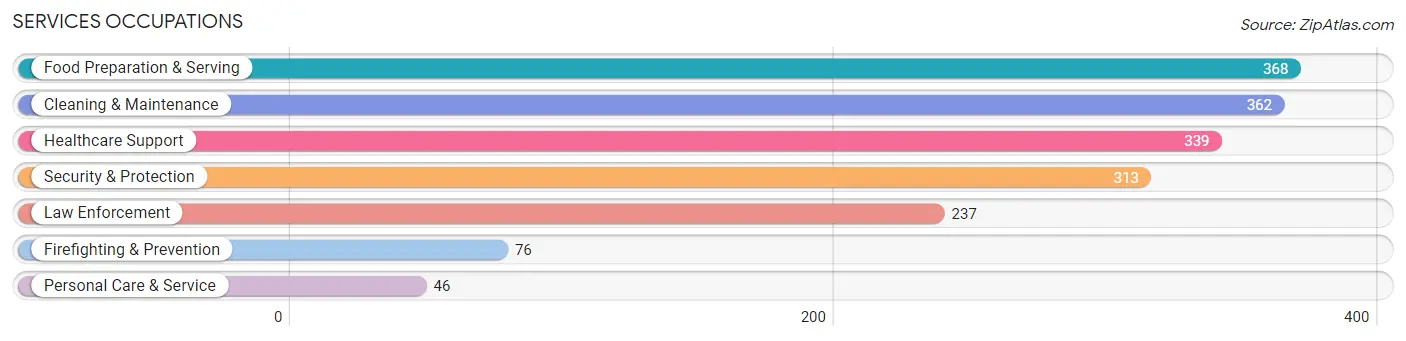
Services Occupations
The most common Services occupations in Coalinga are Food Preparation & Serving (368 | 6.5%), Cleaning & Maintenance (362 | 6.4%), Healthcare Support (339 | 6.0%), Security & Protection (313 | 5.5%), and Law Enforcement (237 | 4.2%).
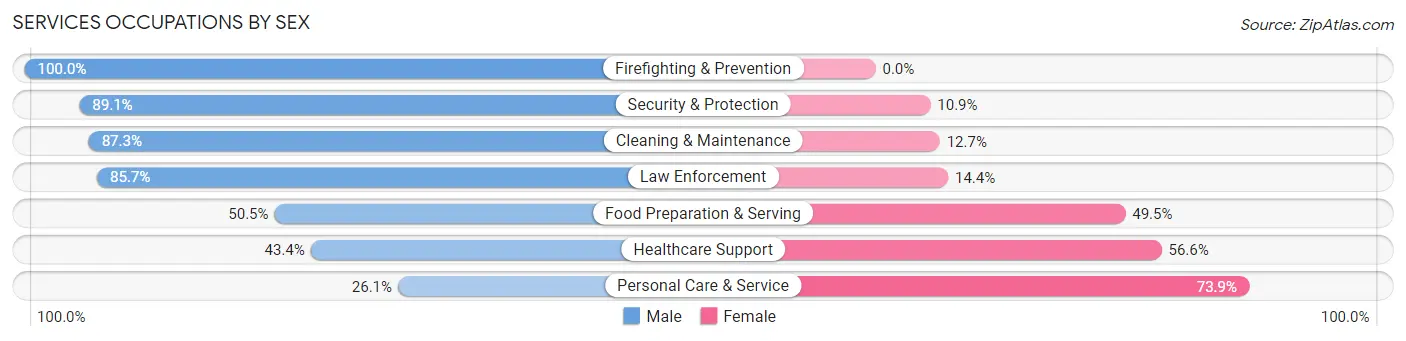
Services Occupations by Sex
Within the Services occupations in Coalinga, the most male-oriented occupations are Firefighting & Prevention (100.0%), Security & Protection (89.1%), and Cleaning & Maintenance (87.3%), while the most female-oriented occupations are Personal Care & Service (73.9%), Healthcare Support (56.6%), and Food Preparation & Serving (49.5%).
| Occupation | Male | Female |
| Healthcare Support | 147 (43.4%) | 192 (56.6%) |
| Security & Protection | 279 (89.1%) | 34 (10.9%) |
| Firefighting & Prevention | 76 (100.0%) | 0 (0.0%) |
| Law Enforcement | 203 (85.7%) | 34 (14.3%) |
| Food Preparation & Serving | 186 (50.5%) | 182 (49.5%) |
| Cleaning & Maintenance | 316 (87.3%) | 46 (12.7%) |
| Personal Care & Service | 12 (26.1%) | 34 (73.9%) |
| Total (Category) | 940 (65.8%) | 488 (34.2%) |
| Total (Overall) | 3,334 (59.0%) | 2,319 (41.0%) |
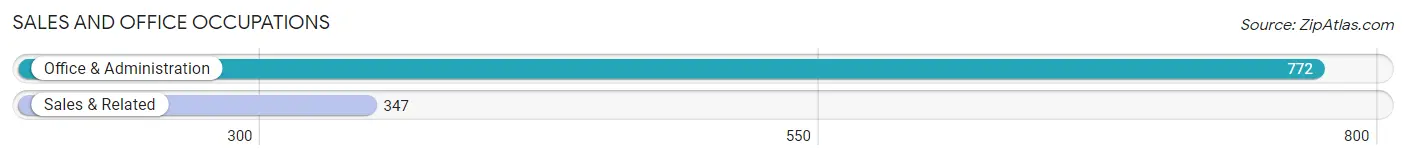
Sales and Office Occupations
The most common Sales and Office occupations in Coalinga are Office & Administration (772 | 13.7%), and Sales & Related (347 | 6.1%).
Sales and Office Occupations by Sex
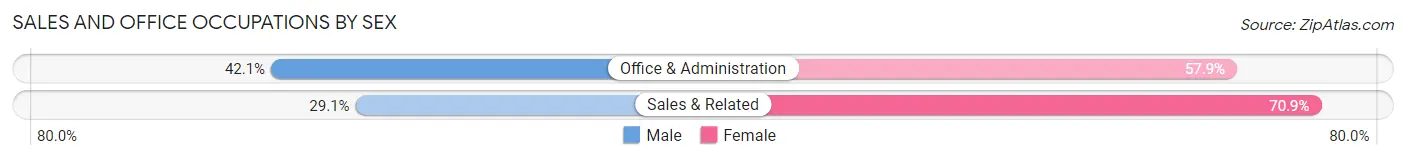
| Occupation | Male | Female |
| Sales & Related | 101 (29.1%) | 246 (70.9%) |
| Office & Administration | 325 (42.1%) | 447 (57.9%) |
| Total (Category) | 426 (38.1%) | 693 (61.9%) |
| Total (Overall) | 3,334 (59.0%) | 2,319 (41.0%) |
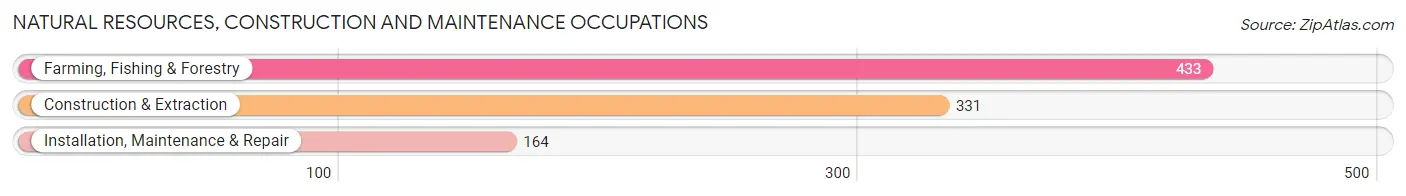
Natural Resources, Construction and Maintenance Occupations
The most common Natural Resources, Construction and Maintenance occupations in Coalinga are Farming, Fishing & Forestry (433 | 7.7%), Construction & Extraction (331 | 5.9%), and Installation, Maintenance & Repair (164 | 2.9%).
Natural Resources, Construction and Maintenance Occupations by Sex
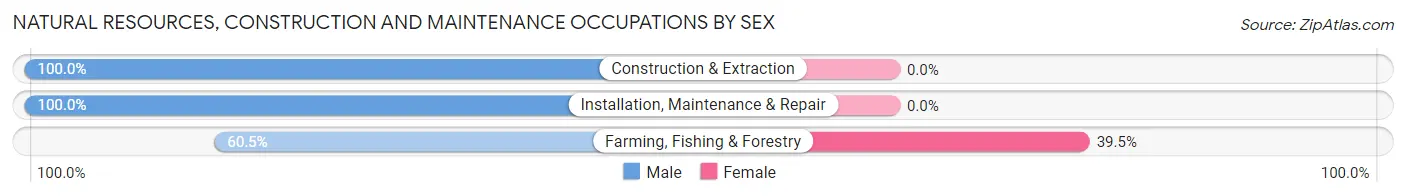
| Occupation | Male | Female |
| Farming, Fishing & Forestry | 262 (60.5%) | 171 (39.5%) |
| Construction & Extraction | 331 (100.0%) | 0 (0.0%) |
| Installation, Maintenance & Repair | 164 (100.0%) | 0 (0.0%) |
| Total (Category) | 757 (81.6%) | 171 (18.4%) |
| Total (Overall) | 3,334 (59.0%) | 2,319 (41.0%) |
Production, Transportation and Moving Occupations
The most common Production, Transportation and Moving occupations in Coalinga are Production (303 | 5.4%), Transportation (291 | 5.1%), and Material Moving (232 | 4.1%).
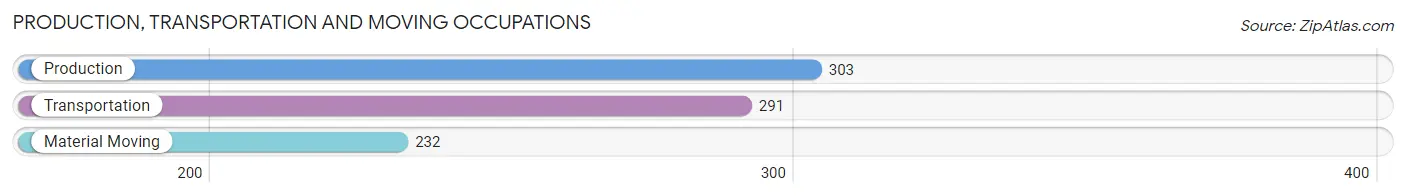
Production, Transportation and Moving Occupations by Sex
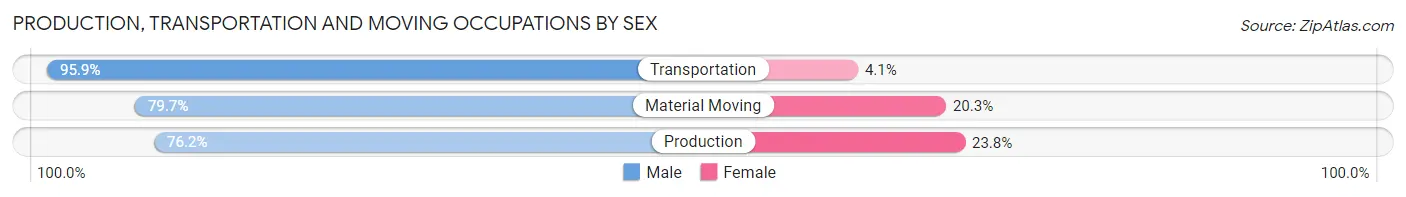
| Occupation | Male | Female |
| Production | 231 (76.2%) | 72 (23.8%) |
| Transportation | 279 (95.9%) | 12 (4.1%) |
| Material Moving | 185 (79.7%) | 47 (20.3%) |
| Total (Category) | 695 (84.1%) | 131 (15.9%) |
| Total (Overall) | 3,334 (59.0%) | 2,319 (41.0%) |
Employment Industries by Sex in Coalinga
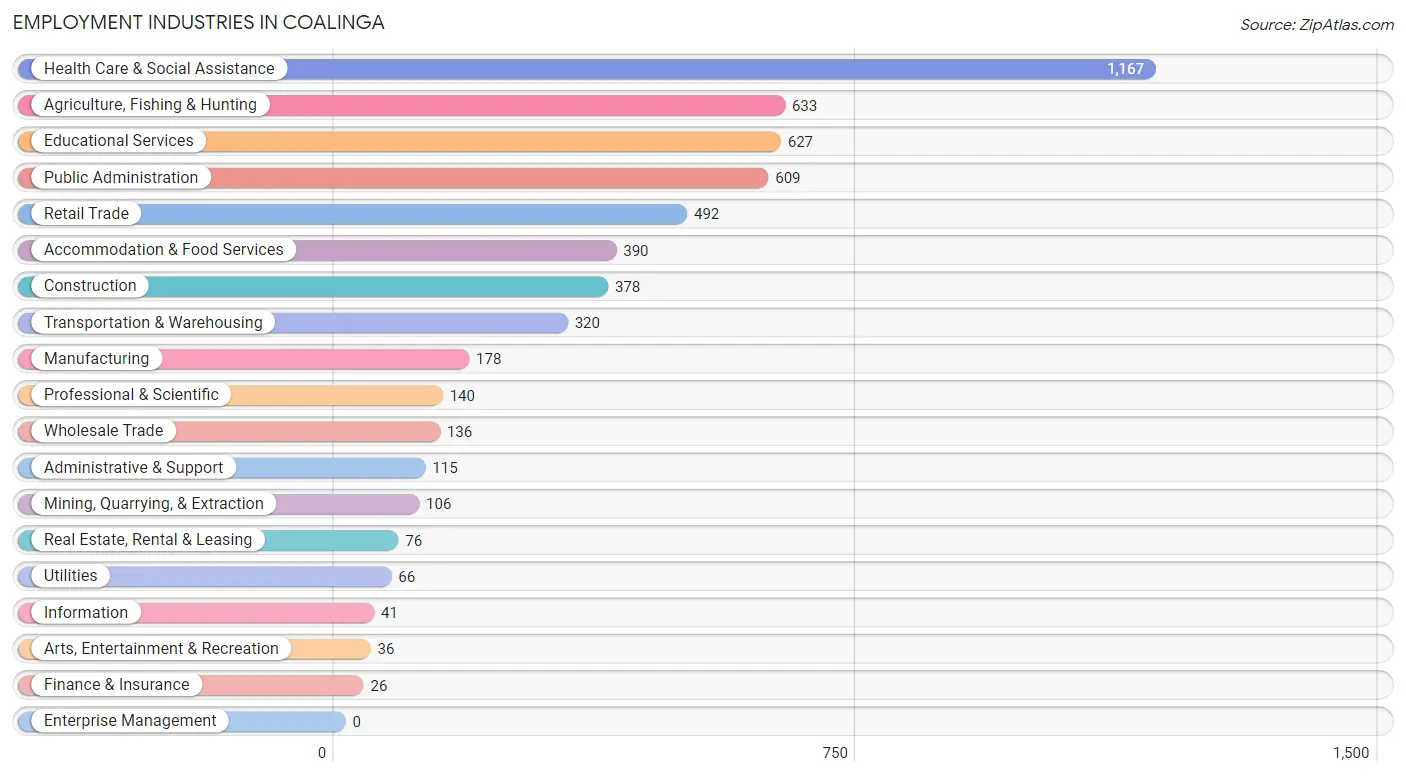
Employment Industries in Coalinga
The major employment industries in Coalinga include Health Care & Social Assistance (1,167 | 20.6%), Agriculture, Fishing & Hunting (633 | 11.2%), Educational Services (627 | 11.1%), Public Administration (609 | 10.8%), and Retail Trade (492 | 8.7%).
Employment Industries by Sex in Coalinga
The Coalinga industries that see more men than women are Mining, Quarrying, & Extraction (100.0%), Utilities (100.0%), and Information (100.0%), whereas the industries that tend to have a higher number of women are Professional & Scientific (95.0%), Finance & Insurance (80.8%), and Retail Trade (66.1%).
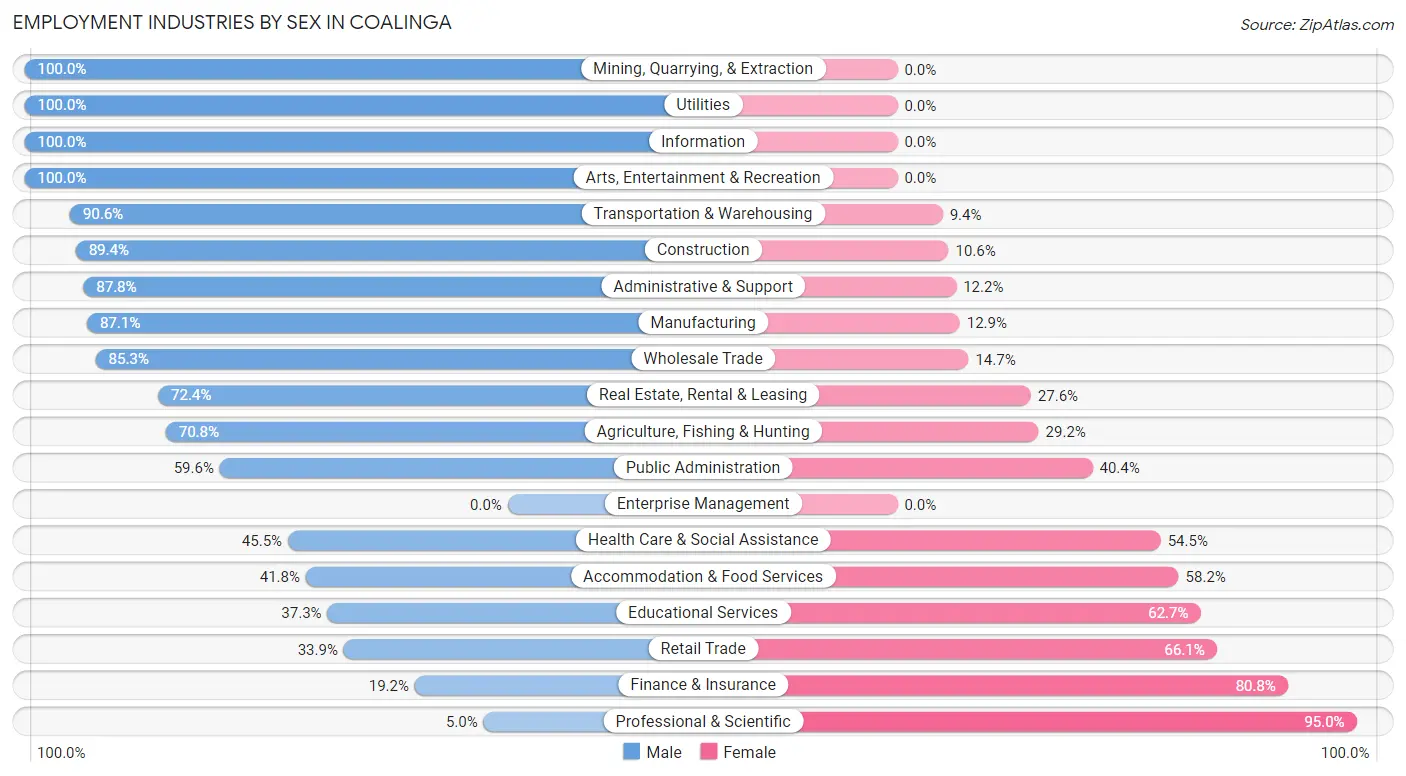
| Industry | Male | Female |
| Agriculture, Fishing & Hunting | 448 (70.8%) | 185 (29.2%) |
| Mining, Quarrying, & Extraction | 106 (100.0%) | 0 (0.0%) |
| Construction | 338 (89.4%) | 40 (10.6%) |
| Manufacturing | 155 (87.1%) | 23 (12.9%) |
| Wholesale Trade | 116 (85.3%) | 20 (14.7%) |
| Retail Trade | 167 (33.9%) | 325 (66.1%) |
| Transportation & Warehousing | 290 (90.6%) | 30 (9.4%) |
| Utilities | 66 (100.0%) | 0 (0.0%) |
| Information | 41 (100.0%) | 0 (0.0%) |
| Finance & Insurance | 5 (19.2%) | 21 (80.8%) |
| Real Estate, Rental & Leasing | 55 (72.4%) | 21 (27.6%) |
| Professional & Scientific | 7 (5.0%) | 133 (95.0%) |
| Enterprise Management | 0 (0.0%) | 0 (0.0%) |
| Administrative & Support | 101 (87.8%) | 14 (12.2%) |
| Educational Services | 234 (37.3%) | 393 (62.7%) |
| Health Care & Social Assistance | 531 (45.5%) | 636 (54.5%) |
| Arts, Entertainment & Recreation | 36 (100.0%) | 0 (0.0%) |
| Accommodation & Food Services | 163 (41.8%) | 227 (58.2%) |
| Public Administration | 363 (59.6%) | 246 (40.4%) |
| Total | 3,334 (59.0%) | 2,319 (41.0%) |
Education in Coalinga
School Enrollment in Coalinga
The most common levels of schooling among the 5,300 students in Coalinga are high school (1,724 | 32.5%), college / undergraduate (1,293 | 24.4%), and elementary school (963 | 18.2%).
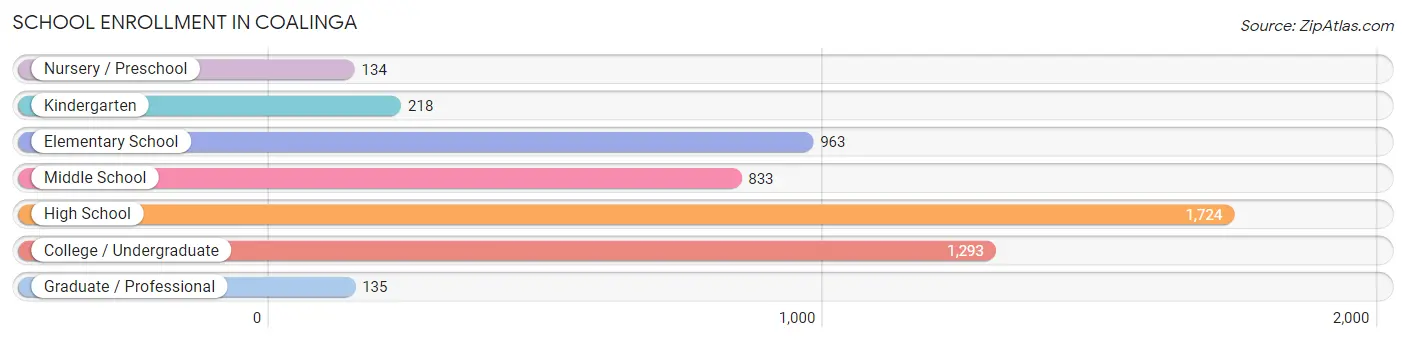
| School Level | # Students | % Students |
| Nursery / Preschool | 134 | 2.5% |
| Kindergarten | 218 | 4.1% |
| Elementary School | 963 | 18.2% |
| Middle School | 833 | 15.7% |
| High School | 1,724 | 32.5% |
| College / Undergraduate | 1,293 | 24.4% |
| Graduate / Professional | 135 | 2.5% |
| Total | 5,300 | 100.0% |
School Enrollment by Age by Funding Source in Coalinga
Out of a total of 5,300 students who are enrolled in schools in Coalinga, 737 (13.9%) attend a private institution, while the remaining 4,563 (86.1%) are enrolled in public schools. The age group of 25 to 34 year olds has the highest likelihood of being enrolled in private schools, with 224 (40.5% in the age bracket) enrolled. Conversely, the age group of 3 to 4 year olds has the lowest likelihood of being enrolled in a private school, with 115 (100.0% in the age bracket) attending a public institution.
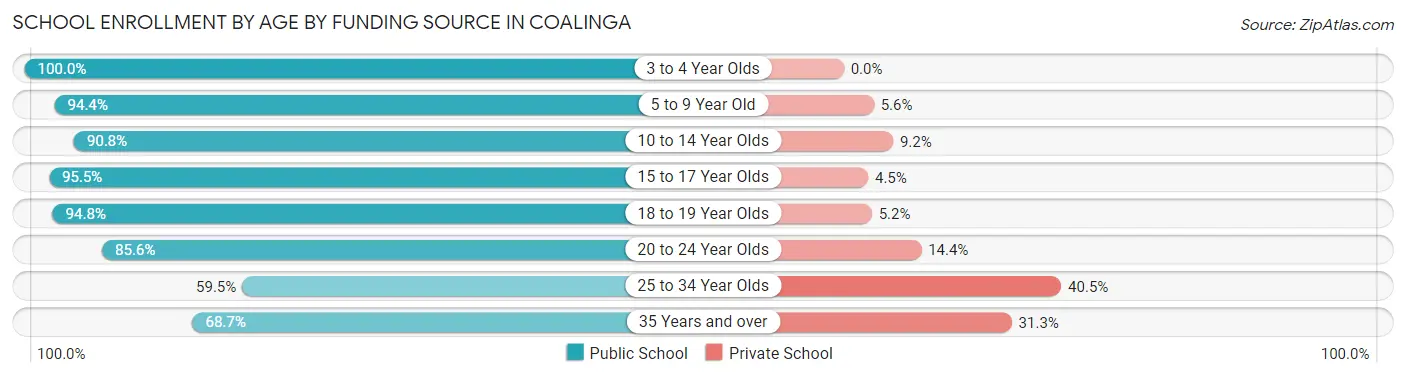
| Age Bracket | Public School | Private School |
| 3 to 4 Year Olds | 115 (100.0%) | 0 (0.0%) |
| 5 to 9 Year Old | 960 (94.4%) | 57 (5.6%) |
| 10 to 14 Year Olds | 1,108 (90.8%) | 112 (9.2%) |
| 15 to 17 Year Olds | 841 (95.5%) | 40 (4.5%) |
| 18 to 19 Year Olds | 290 (94.8%) | 16 (5.2%) |
| 20 to 24 Year Olds | 462 (85.6%) | 78 (14.4%) |
| 25 to 34 Year Olds | 329 (59.5%) | 224 (40.5%) |
| 35 Years and over | 459 (68.7%) | 209 (31.3%) |
| Total | 4,563 (86.1%) | 737 (13.9%) |
Educational Attainment by Field of Study in Coalinga
Social sciences (233 | 16.1%), business (219 | 15.1%), bio, nature & agricultural (210 | 14.5%), education (188 | 13.0%), and psychology (151 | 10.4%) are the most common fields of study among 1,449 individuals in Coalinga who have obtained a bachelor's degree or higher.
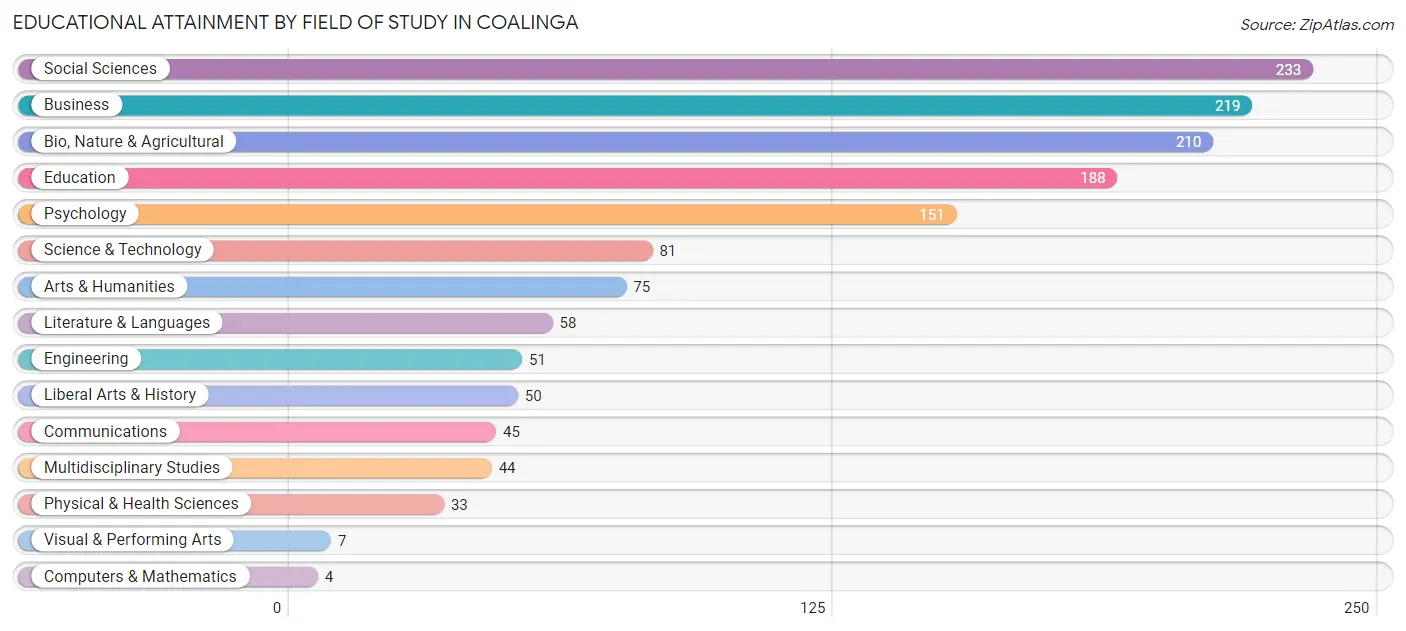
| Field of Study | # Graduates | % Graduates |
| Computers & Mathematics | 4 | 0.3% |
| Bio, Nature & Agricultural | 210 | 14.5% |
| Physical & Health Sciences | 33 | 2.3% |
| Psychology | 151 | 10.4% |
| Social Sciences | 233 | 16.1% |
| Engineering | 51 | 3.5% |
| Multidisciplinary Studies | 44 | 3.0% |
| Science & Technology | 81 | 5.6% |
| Business | 219 | 15.1% |
| Education | 188 | 13.0% |
| Literature & Languages | 58 | 4.0% |
| Liberal Arts & History | 50 | 3.5% |
| Visual & Performing Arts | 7 | 0.5% |
| Communications | 45 | 3.1% |
| Arts & Humanities | 75 | 5.2% |
| Total | 1,449 | 100.0% |
Transportation & Commute in Coalinga
Vehicle Availability by Sex in Coalinga
The most prevalent vehicle ownership categories in Coalinga are males with 2 vehicles (1,126, accounting for 39.7%) and females with 2 vehicles (769, making up 51.5%).
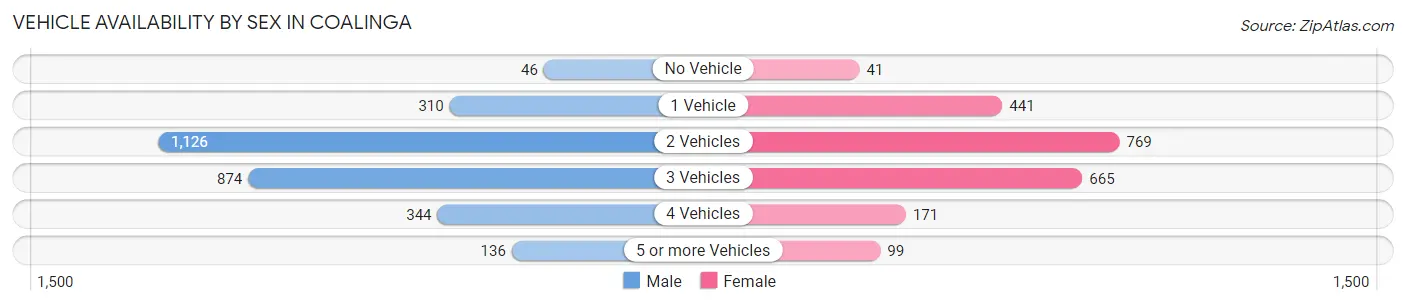
| Vehicles Available | Male | Female |
| No Vehicle | 46 (1.6%) | 41 (1.9%) |
| 1 Vehicle | 310 (10.9%) | 441 (20.2%) |
| 2 Vehicles | 1,126 (39.7%) | 769 (35.2%) |
| 3 Vehicles | 874 (30.8%) | 665 (30.4%) |
| 4 Vehicles | 344 (12.1%) | 171 (7.8%) |
| 5 or more Vehicles | 136 (4.8%) | 99 (4.5%) |
| Total | 2,836 (100.0%) | 2,186 (100.0%) |
Commute Time in Coalinga
The most frequently occuring commute durations in Coalinga are 5 to 9 minutes (1,174 commuters, 23.1%), 15 to 19 minutes (708 commuters, 13.9%), and 10 to 14 minutes (674 commuters, 13.3%).
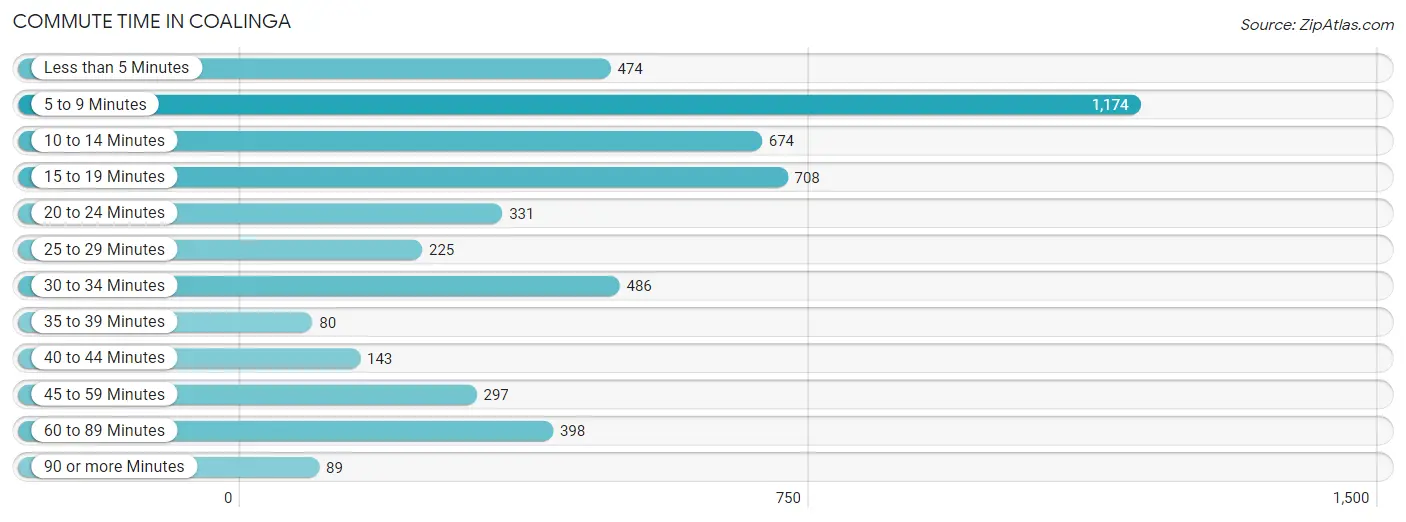
| Commute Time | # Commuters | % Commuters |
| Less than 5 Minutes | 474 | 9.3% |
| 5 to 9 Minutes | 1,174 | 23.1% |
| 10 to 14 Minutes | 674 | 13.3% |
| 15 to 19 Minutes | 708 | 13.9% |
| 20 to 24 Minutes | 331 | 6.5% |
| 25 to 29 Minutes | 225 | 4.4% |
| 30 to 34 Minutes | 486 | 9.6% |
| 35 to 39 Minutes | 80 | 1.6% |
| 40 to 44 Minutes | 143 | 2.8% |
| 45 to 59 Minutes | 297 | 5.9% |
| 60 to 89 Minutes | 398 | 7.8% |
| 90 or more Minutes | 89 | 1.8% |
Commute Time by Sex in Coalinga
The most common commute times in Coalinga are 5 to 9 minutes (504 commuters, 16.5%) for males and 5 to 9 minutes (670 commuters, 33.0%) for females.
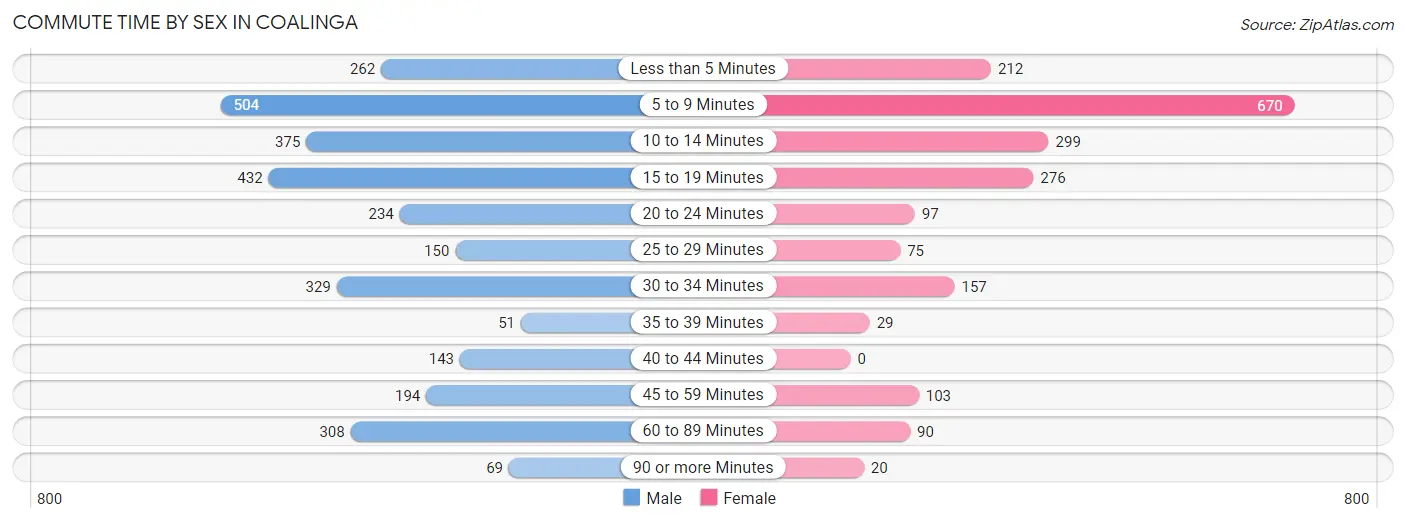
| Commute Time | Male | Female |
| Less than 5 Minutes | 262 (8.6%) | 212 (10.4%) |
| 5 to 9 Minutes | 504 (16.5%) | 670 (33.0%) |
| 10 to 14 Minutes | 375 (12.3%) | 299 (14.7%) |
| 15 to 19 Minutes | 432 (14.2%) | 276 (13.6%) |
| 20 to 24 Minutes | 234 (7.7%) | 97 (4.8%) |
| 25 to 29 Minutes | 150 (4.9%) | 75 (3.7%) |
| 30 to 34 Minutes | 329 (10.8%) | 157 (7.7%) |
| 35 to 39 Minutes | 51 (1.7%) | 29 (1.4%) |
| 40 to 44 Minutes | 143 (4.7%) | 0 (0.0%) |
| 45 to 59 Minutes | 194 (6.4%) | 103 (5.1%) |
| 60 to 89 Minutes | 308 (10.1%) | 90 (4.4%) |
| 90 or more Minutes | 69 (2.3%) | 20 (1.0%) |
Time of Departure to Work by Sex in Coalinga
The most frequent times of departure to work in Coalinga are 12:00 AM to 4:59 AM (489, 16.0%) for males and 7:30 AM to 7:59 AM (669, 33.0%) for females.
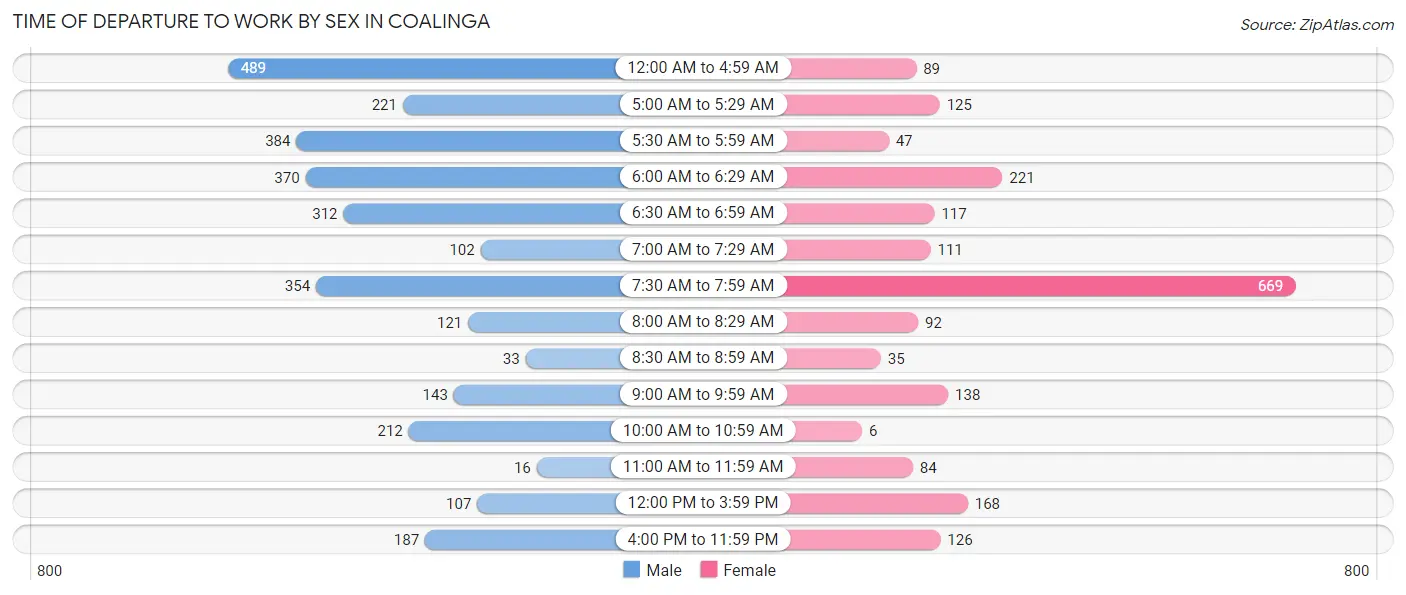
| Time of Departure | Male | Female |
| 12:00 AM to 4:59 AM | 489 (16.0%) | 89 (4.4%) |
| 5:00 AM to 5:29 AM | 221 (7.2%) | 125 (6.2%) |
| 5:30 AM to 5:59 AM | 384 (12.6%) | 47 (2.3%) |
| 6:00 AM to 6:29 AM | 370 (12.1%) | 221 (10.9%) |
| 6:30 AM to 6:59 AM | 312 (10.2%) | 117 (5.8%) |
| 7:00 AM to 7:29 AM | 102 (3.3%) | 111 (5.5%) |
| 7:30 AM to 7:59 AM | 354 (11.6%) | 669 (33.0%) |
| 8:00 AM to 8:29 AM | 121 (4.0%) | 92 (4.5%) |
| 8:30 AM to 8:59 AM | 33 (1.1%) | 35 (1.7%) |
| 9:00 AM to 9:59 AM | 143 (4.7%) | 138 (6.8%) |
| 10:00 AM to 10:59 AM | 212 (7.0%) | 6 (0.3%) |
| 11:00 AM to 11:59 AM | 16 (0.5%) | 84 (4.1%) |
| 12:00 PM to 3:59 PM | 107 (3.5%) | 168 (8.3%) |
| 4:00 PM to 11:59 PM | 187 (6.1%) | 126 (6.2%) |
| Total | 3,051 (100.0%) | 2,028 (100.0%) |
Housing Occupancy in Coalinga
Occupancy by Ownership in Coalinga
Of the total 4,219 dwellings in Coalinga, owner-occupied units account for 2,234 (52.9%), while renter-occupied units make up 1,985 (47.0%).
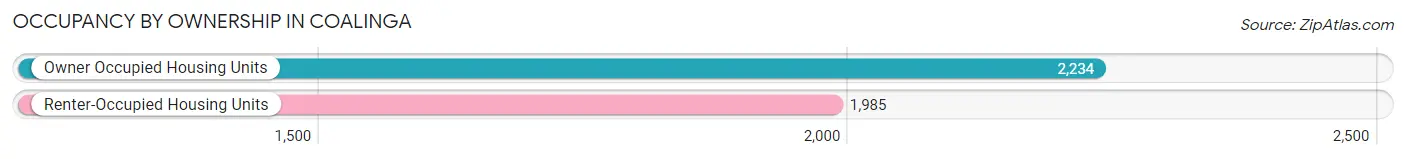
| Occupancy | # Housing Units | % Housing Units |
| Owner Occupied Housing Units | 2,234 | 52.9% |
| Renter-Occupied Housing Units | 1,985 | 47.0% |
| Total Occupied Housing Units | 4,219 | 100.0% |
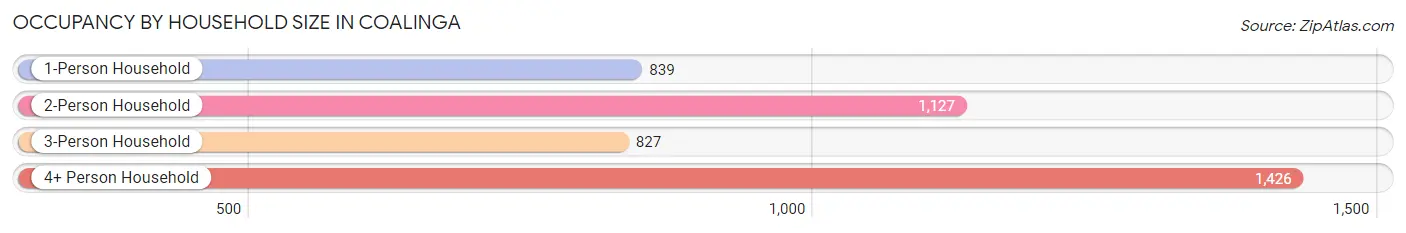
Occupancy by Household Size in Coalinga
| Household Size | # Housing Units | % Housing Units |
| 1-Person Household | 839 | 19.9% |
| 2-Person Household | 1,127 | 26.7% |
| 3-Person Household | 827 | 19.6% |
| 4+ Person Household | 1,426 | 33.8% |
| Total Housing Units | 4,219 | 100.0% |
Occupancy by Ownership by Household Size in Coalinga
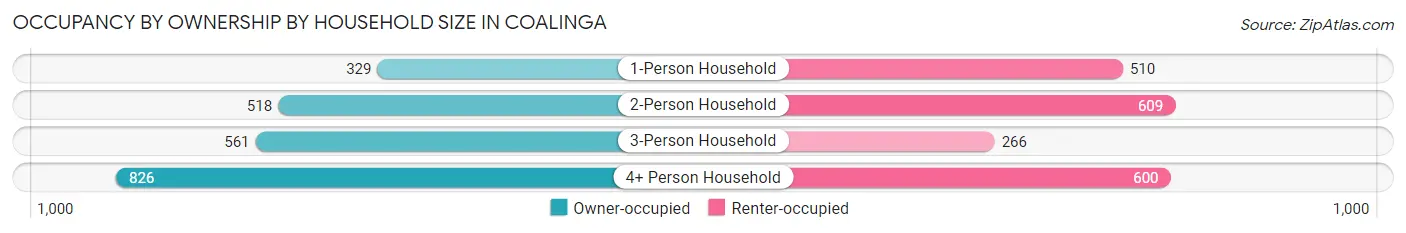
| Household Size | Owner-occupied | Renter-occupied |
| 1-Person Household | 329 (39.2%) | 510 (60.8%) |
| 2-Person Household | 518 (46.0%) | 609 (54.0%) |
| 3-Person Household | 561 (67.8%) | 266 (32.2%) |
| 4+ Person Household | 826 (57.9%) | 600 (42.1%) |
| Total Housing Units | 2,234 (52.9%) | 1,985 (47.0%) |
Occupancy by Educational Attainment in Coalinga
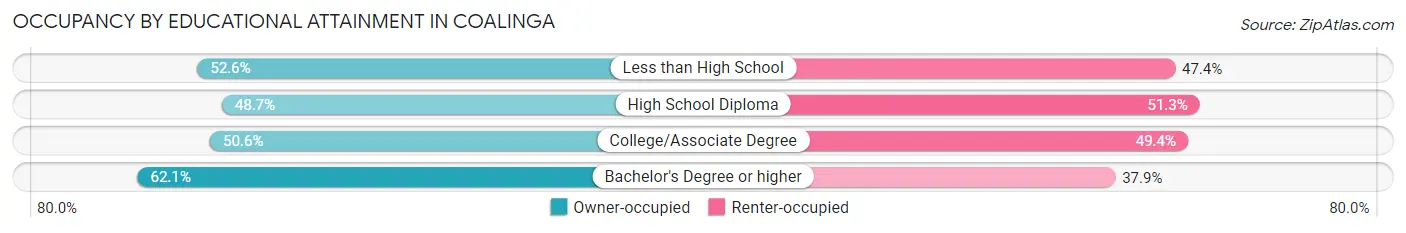
| Household Size | Owner-occupied | Renter-occupied |
| Less than High School | 506 (52.6%) | 456 (47.4%) |
| High School Diploma | 490 (48.7%) | 516 (51.3%) |
| College/Associate Degree | 701 (50.6%) | 685 (49.4%) |
| Bachelor's Degree or higher | 537 (62.1%) | 328 (37.9%) |
Occupancy by Age of Householder in Coalinga
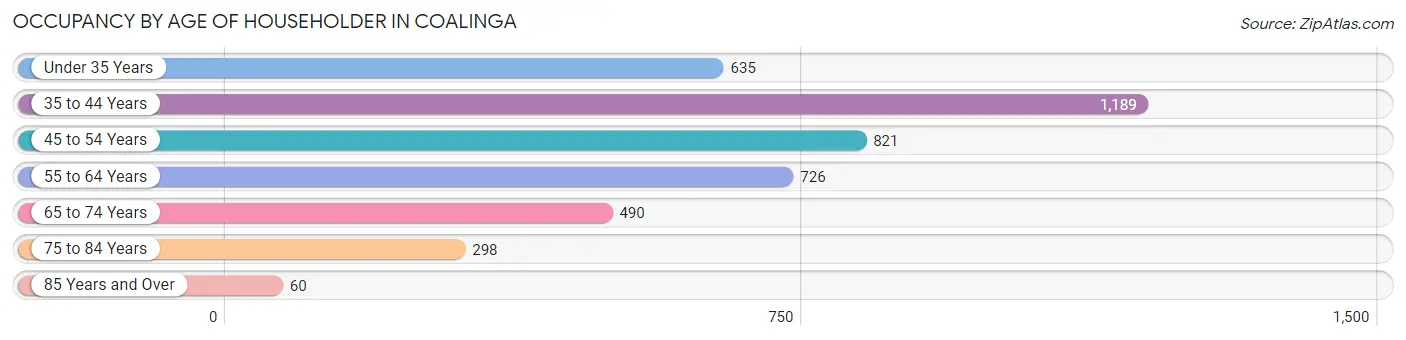
| Age Bracket | # Households | % Households |
| Under 35 Years | 635 | 15.0% |
| 35 to 44 Years | 1,189 | 28.2% |
| 45 to 54 Years | 821 | 19.5% |
| 55 to 64 Years | 726 | 17.2% |
| 65 to 74 Years | 490 | 11.6% |
| 75 to 84 Years | 298 | 7.1% |
| 85 Years and Over | 60 | 1.4% |
| Total | 4,219 | 100.0% |
Housing Finances in Coalinga
Median Income by Occupancy in Coalinga
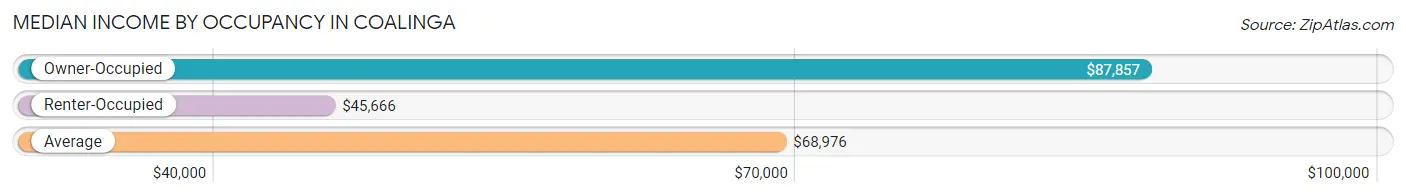
| Occupancy Type | # Households | Median Income |
| Owner-Occupied | 2,234 (52.9%) | $87,857 |
| Renter-Occupied | 1,985 (47.0%) | $45,666 |
| Average | 4,219 (100.0%) | $68,976 |
Occupancy by Householder Income Bracket in Coalinga
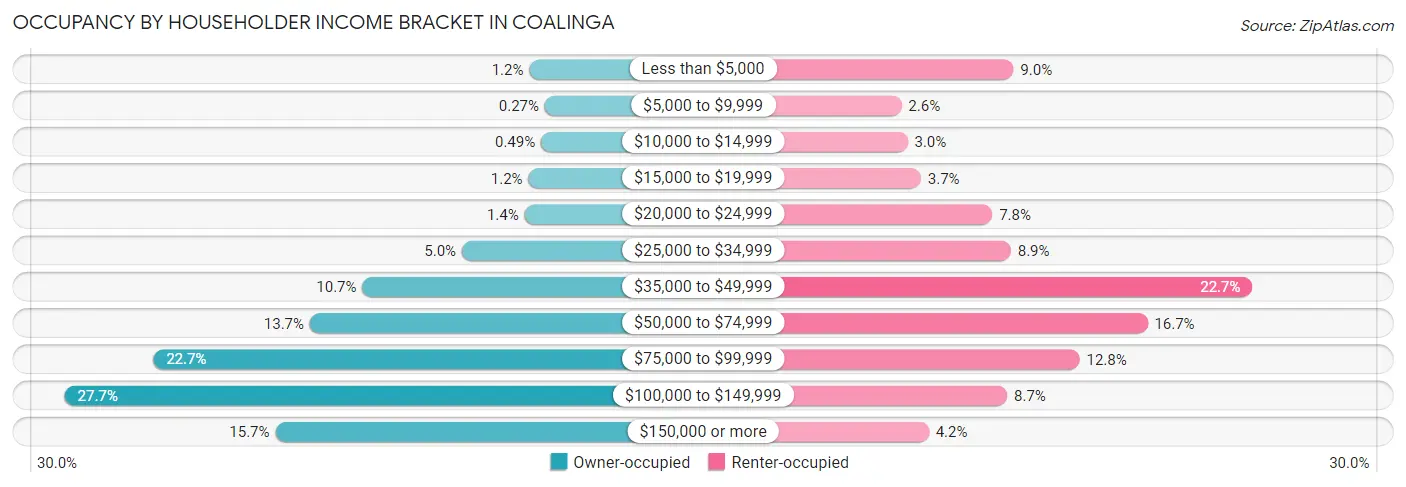
| Income Bracket | Owner-occupied | Renter-occupied |
| Less than $5,000 | 26 (1.2%) | 179 (9.0%) |
| $5,000 to $9,999 | 6 (0.3%) | 52 (2.6%) |
| $10,000 to $14,999 | 11 (0.5%) | 59 (3.0%) |
| $15,000 to $19,999 | 27 (1.2%) | 74 (3.7%) |
| $20,000 to $24,999 | 32 (1.4%) | 155 (7.8%) |
| $25,000 to $34,999 | 112 (5.0%) | 176 (8.9%) |
| $35,000 to $49,999 | 239 (10.7%) | 450 (22.7%) |
| $50,000 to $74,999 | 306 (13.7%) | 331 (16.7%) |
| $75,000 to $99,999 | 506 (22.7%) | 254 (12.8%) |
| $100,000 to $149,999 | 619 (27.7%) | 172 (8.7%) |
| $150,000 or more | 350 (15.7%) | 83 (4.2%) |
| Total | 2,234 (100.0%) | 1,985 (100.0%) |
Monthly Housing Cost Tiers in Coalinga

| Monthly Cost | Owner-occupied | Renter-occupied |
| Less than $300 | 117 (5.2%) | 115 (5.8%) |
| $300 to $499 | 148 (6.6%) | 139 (7.0%) |
| $500 to $799 | 273 (12.2%) | 368 (18.5%) |
| $800 to $999 | 113 (5.1%) | 467 (23.5%) |
| $1,000 to $1,499 | 612 (27.4%) | 594 (29.9%) |
| $1,500 to $1,999 | 642 (28.7%) | 181 (9.1%) |
| $2,000 to $2,499 | 201 (9.0%) | 37 (1.9%) |
| $2,500 to $2,999 | 82 (3.7%) | 11 (0.5%) |
| $3,000 or more | 46 (2.1%) | 0 (0.0%) |
| Total | 2,234 (100.0%) | 1,985 (100.0%) |
Physical Housing Characteristics in Coalinga
Housing Structures in Coalinga
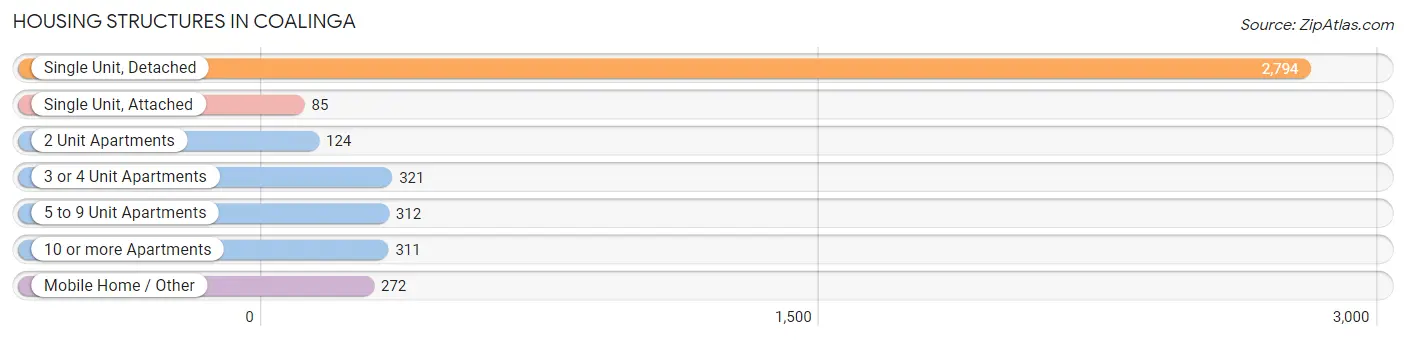
| Structure Type | # Housing Units | % Housing Units |
| Single Unit, Detached | 2,794 | 66.2% |
| Single Unit, Attached | 85 | 2.0% |
| 2 Unit Apartments | 124 | 2.9% |
| 3 or 4 Unit Apartments | 321 | 7.6% |
| 5 to 9 Unit Apartments | 312 | 7.4% |
| 10 or more Apartments | 311 | 7.4% |
| Mobile Home / Other | 272 | 6.5% |
| Total | 4,219 | 100.0% |
Housing Structures by Occupancy in Coalinga
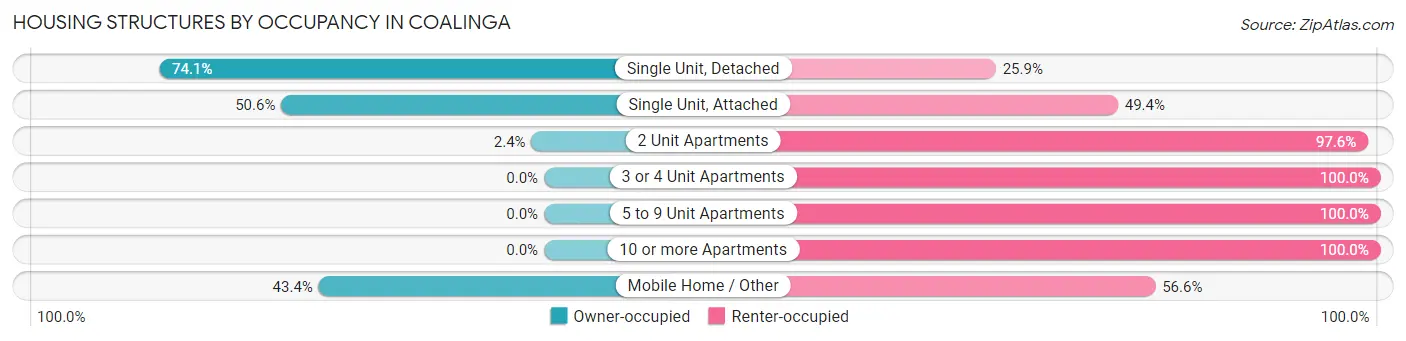
| Structure Type | Owner-occupied | Renter-occupied |
| Single Unit, Detached | 2,070 (74.1%) | 724 (25.9%) |
| Single Unit, Attached | 43 (50.6%) | 42 (49.4%) |
| 2 Unit Apartments | 3 (2.4%) | 121 (97.6%) |
| 3 or 4 Unit Apartments | 0 (0.0%) | 321 (100.0%) |
| 5 to 9 Unit Apartments | 0 (0.0%) | 312 (100.0%) |
| 10 or more Apartments | 0 (0.0%) | 311 (100.0%) |
| Mobile Home / Other | 118 (43.4%) | 154 (56.6%) |
| Total | 2,234 (52.9%) | 1,985 (47.0%) |
Housing Structures by Number of Rooms in Coalinga
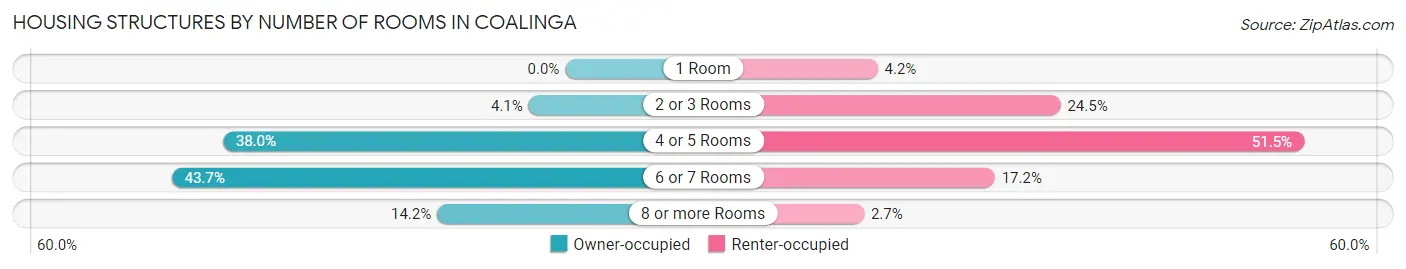
| Number of Rooms | Owner-occupied | Renter-occupied |
| 1 Room | 0 (0.0%) | 83 (4.2%) |
| 2 or 3 Rooms | 91 (4.1%) | 486 (24.5%) |
| 4 or 5 Rooms | 849 (38.0%) | 1,022 (51.5%) |
| 6 or 7 Rooms | 976 (43.7%) | 341 (17.2%) |
| 8 or more Rooms | 318 (14.2%) | 53 (2.7%) |
| Total | 2,234 (100.0%) | 1,985 (100.0%) |
Housing Structure by Heating Type in Coalinga
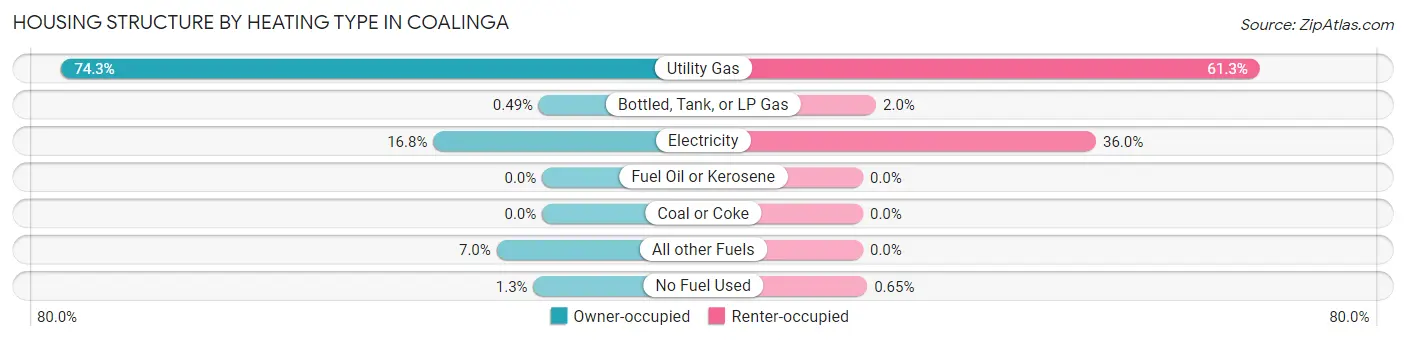
| Heating Type | Owner-occupied | Renter-occupied |
| Utility Gas | 1,660 (74.3%) | 1,217 (61.3%) |
| Bottled, Tank, or LP Gas | 11 (0.5%) | 40 (2.0%) |
| Electricity | 376 (16.8%) | 715 (36.0%) |
| Fuel Oil or Kerosene | 0 (0.0%) | 0 (0.0%) |
| Coal or Coke | 0 (0.0%) | 0 (0.0%) |
| All other Fuels | 157 (7.0%) | 0 (0.0%) |
| No Fuel Used | 30 (1.3%) | 13 (0.6%) |
| Total | 2,234 (100.0%) | 1,985 (100.0%) |
Household Vehicle Usage in Coalinga
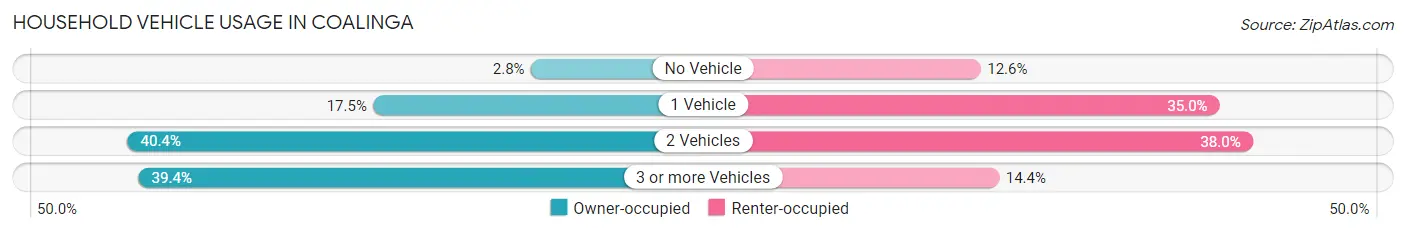
| Vehicles per Household | Owner-occupied | Renter-occupied |
| No Vehicle | 62 (2.8%) | 251 (12.6%) |
| 1 Vehicle | 391 (17.5%) | 694 (35.0%) |
| 2 Vehicles | 902 (40.4%) | 755 (38.0%) |
| 3 or more Vehicles | 879 (39.4%) | 285 (14.4%) |
| Total | 2,234 (100.0%) | 1,985 (100.0%) |
Real Estate & Mortgages in Coalinga
Real Estate and Mortgage Overview in Coalinga
| Characteristic | Without Mortgage | With Mortgage |
| Housing Units | 551 | 1,683 |
| Median Property Value | $221,100 | $227,400 |
| Median Household Income | $81,343 | $258 |
| Monthly Housing Costs | $550 | $46 |
| Real Estate Taxes | $1,442 | $7 |
Property Value by Mortgage Status in Coalinga
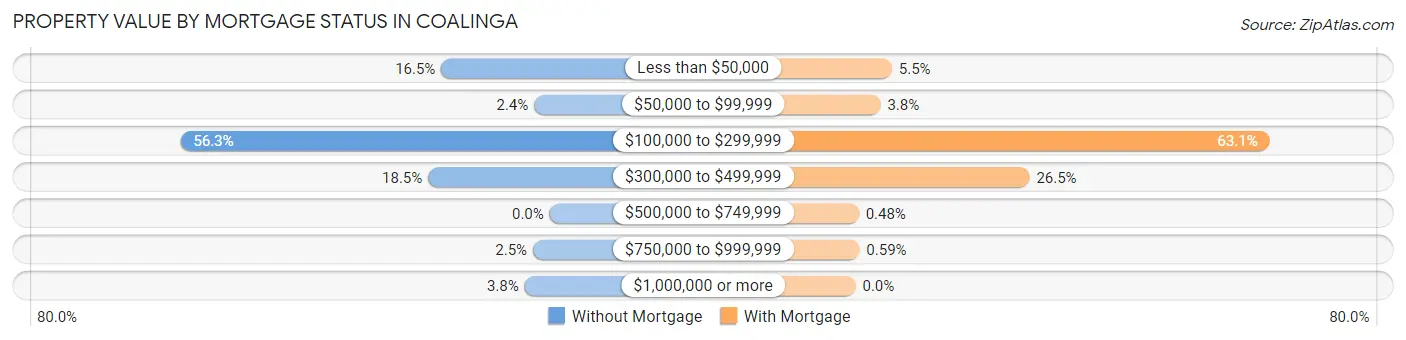
| Property Value | Without Mortgage | With Mortgage |
| Less than $50,000 | 91 (16.5%) | 93 (5.5%) |
| $50,000 to $99,999 | 13 (2.4%) | 64 (3.8%) |
| $100,000 to $299,999 | 310 (56.3%) | 1,062 (63.1%) |
| $300,000 to $499,999 | 102 (18.5%) | 446 (26.5%) |
| $500,000 to $749,999 | 0 (0.0%) | 8 (0.5%) |
| $750,000 to $999,999 | 14 (2.5%) | 10 (0.6%) |
| $1,000,000 or more | 21 (3.8%) | 0 (0.0%) |
| Total | 551 (100.0%) | 1,683 (100.0%) |
Household Income by Mortgage Status in Coalinga
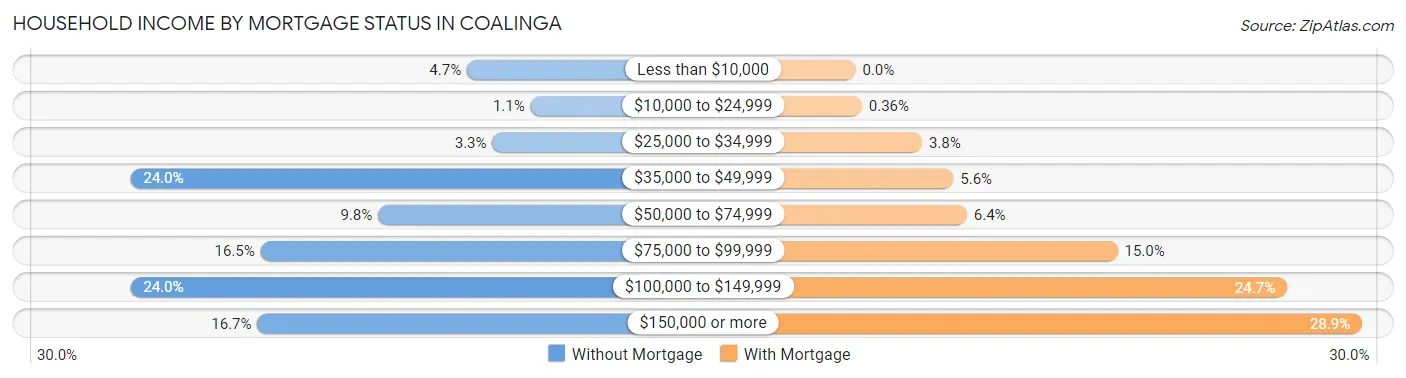
| Household Income | Without Mortgage | With Mortgage |
| Less than $10,000 | 26 (4.7%) | 0 (0.0%) |
| $10,000 to $24,999 | 6 (1.1%) | 6 (0.4%) |
| $25,000 to $34,999 | 18 (3.3%) | 64 (3.8%) |
| $35,000 to $49,999 | 132 (24.0%) | 94 (5.6%) |
| $50,000 to $74,999 | 54 (9.8%) | 107 (6.4%) |
| $75,000 to $99,999 | 91 (16.5%) | 252 (15.0%) |
| $100,000 to $149,999 | 132 (24.0%) | 415 (24.7%) |
| $150,000 or more | 92 (16.7%) | 487 (28.9%) |
| Total | 551 (100.0%) | 1,683 (100.0%) |
Property Value to Household Income Ratio in Coalinga
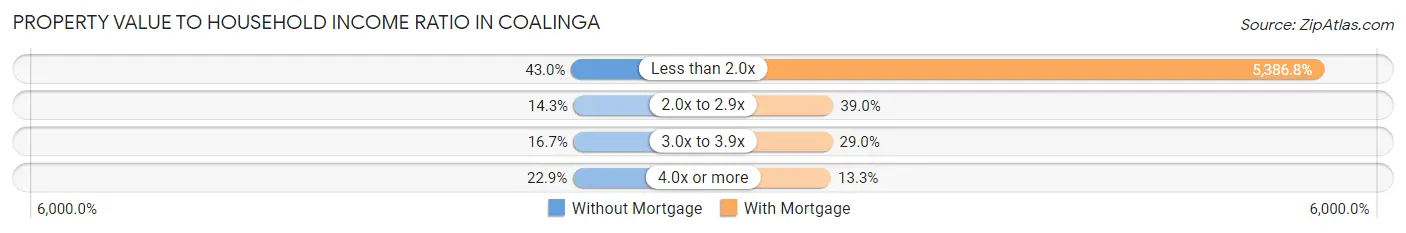
| Value-to-Income Ratio | Without Mortgage | With Mortgage |
| Less than 2.0x | 237 (43.0%) | 90,659 (5,386.7%) |
| 2.0x to 2.9x | 79 (14.3%) | 657 (39.0%) |
| 3.0x to 3.9x | 92 (16.7%) | 488 (29.0%) |
| 4.0x or more | 126 (22.9%) | 223 (13.3%) |
| Total | 551 (100.0%) | 1,683 (100.0%) |
Real Estate Taxes by Mortgage Status in Coalinga
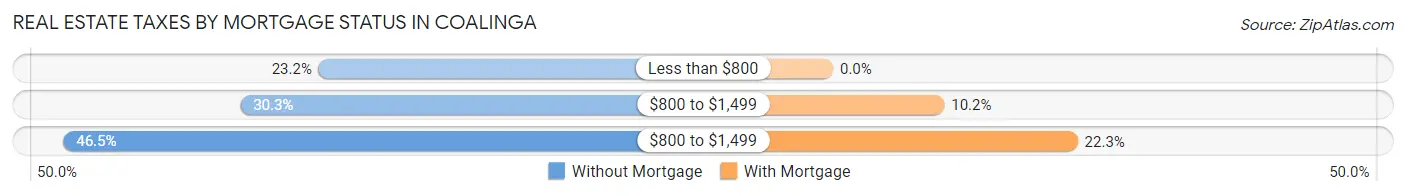
| Property Taxes | Without Mortgage | With Mortgage |
| Less than $800 | 128 (23.2%) | 0 (0.0%) |
| $800 to $1,499 | 167 (30.3%) | 171 (10.2%) |
| $800 to $1,499 | 256 (46.5%) | 376 (22.3%) |
| Total | 551 (100.0%) | 1,683 (100.0%) |
Health & Disability in Coalinga
Health Insurance Coverage by Age in Coalinga
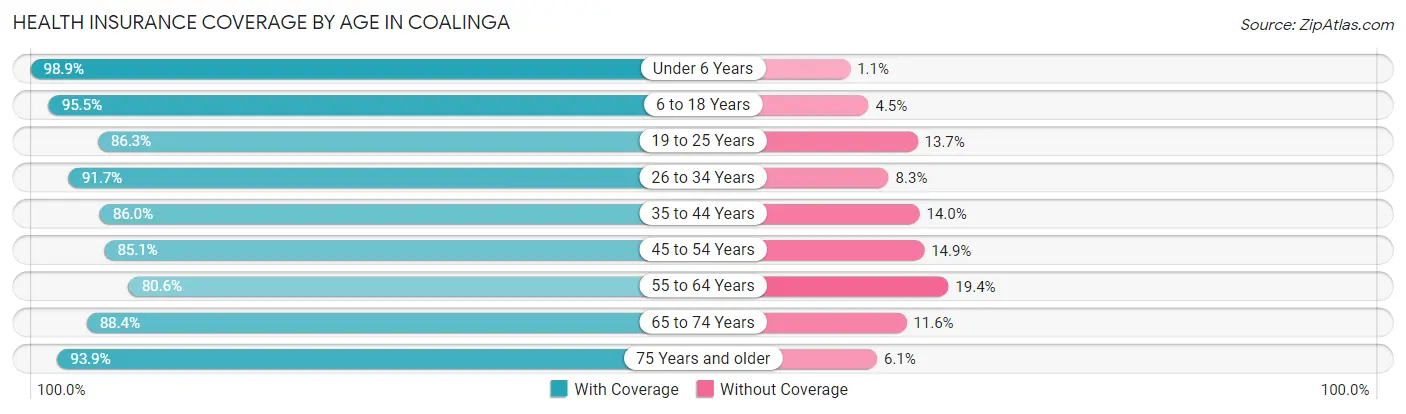
| Age Bracket | With Coverage | Without Coverage |
| Under 6 Years | 887 (98.9%) | 10 (1.1%) |
| 6 to 18 Years | 3,377 (95.5%) | 160 (4.5%) |
| 19 to 25 Years | 1,238 (86.3%) | 196 (13.7%) |
| 26 to 34 Years | 1,298 (91.7%) | 117 (8.3%) |
| 35 to 44 Years | 1,807 (86.0%) | 295 (14.0%) |
| 45 to 54 Years | 1,285 (85.1%) | 225 (14.9%) |
| 55 to 64 Years | 1,303 (80.6%) | 314 (19.4%) |
| 65 to 74 Years | 824 (88.4%) | 108 (11.6%) |
| 75 Years and older | 830 (93.9%) | 54 (6.1%) |
| Total | 12,849 (89.7%) | 1,479 (10.3%) |
Health Insurance Coverage by Citizenship Status in Coalinga
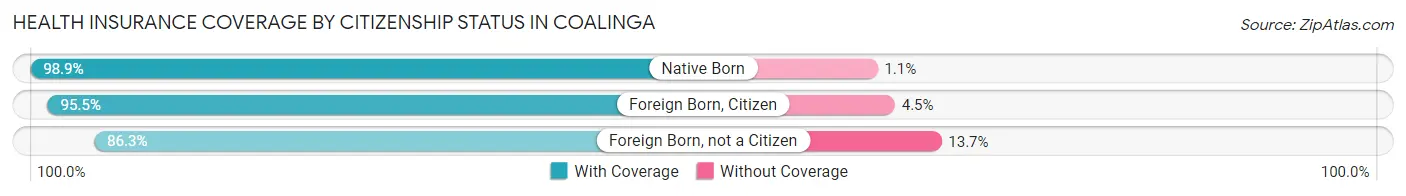
| Citizenship Status | With Coverage | Without Coverage |
| Native Born | 887 (98.9%) | 10 (1.1%) |
| Foreign Born, Citizen | 3,377 (95.5%) | 160 (4.5%) |
| Foreign Born, not a Citizen | 1,238 (86.3%) | 196 (13.7%) |
Health Insurance Coverage by Household Income in Coalinga
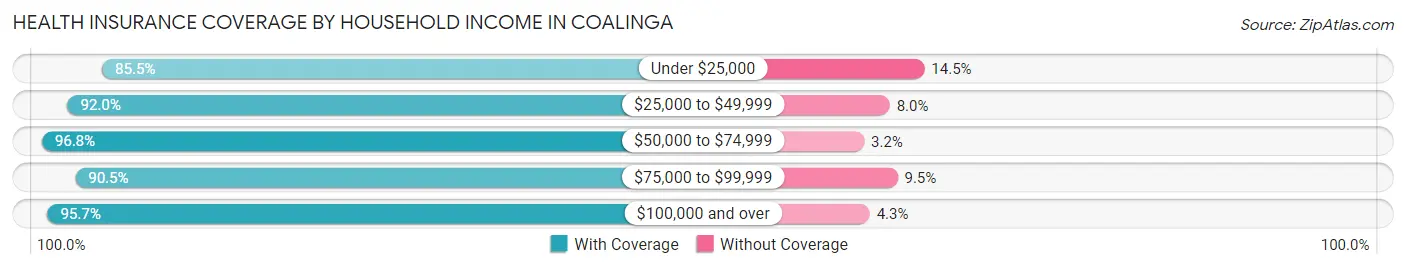
| Household Income | With Coverage | Without Coverage |
| Under $25,000 | 1,287 (85.5%) | 219 (14.5%) |
| $25,000 to $49,999 | 2,802 (92.0%) | 245 (8.0%) |
| $50,000 to $74,999 | 1,971 (96.8%) | 66 (3.2%) |
| $75,000 to $99,999 | 2,502 (90.5%) | 263 (9.5%) |
| $100,000 and over | 3,879 (95.7%) | 174 (4.3%) |
Public vs Private Health Insurance Coverage by Age in Coalinga
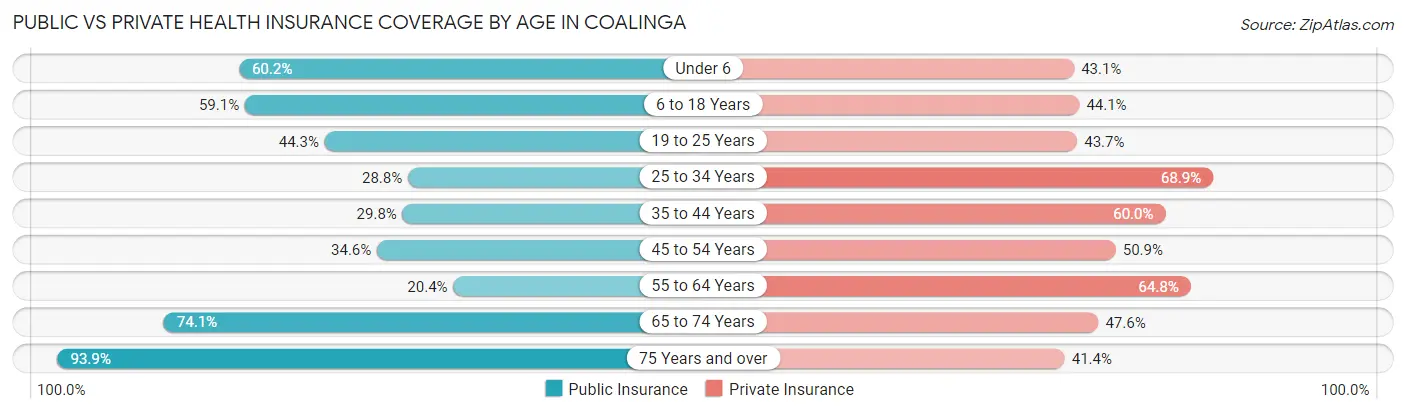
| Age Bracket | Public Insurance | Private Insurance |
| Under 6 | 540 (60.2%) | 387 (43.1%) |
| 6 to 18 Years | 2,090 (59.1%) | 1,560 (44.1%) |
| 19 to 25 Years | 635 (44.3%) | 627 (43.7%) |
| 25 to 34 Years | 408 (28.8%) | 975 (68.9%) |
| 35 to 44 Years | 627 (29.8%) | 1,262 (60.0%) |
| 45 to 54 Years | 522 (34.6%) | 768 (50.9%) |
| 55 to 64 Years | 330 (20.4%) | 1,047 (64.7%) |
| 65 to 74 Years | 691 (74.1%) | 444 (47.6%) |
| 75 Years and over | 830 (93.9%) | 366 (41.4%) |
| Total | 6,673 (46.6%) | 7,436 (51.9%) |
Disability Status by Sex by Age in Coalinga
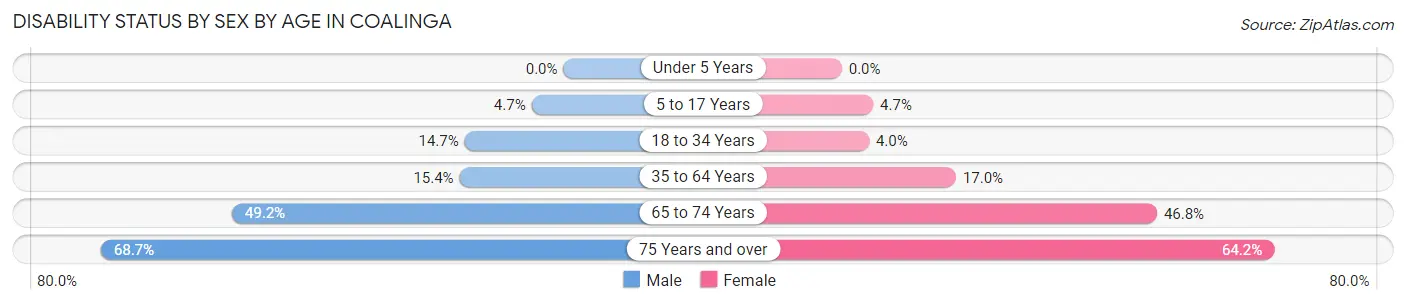
| Age Bracket | Male | Female |
| Under 5 Years | 0 (0.0%) | 0 (0.0%) |
| 5 to 17 Years | 67 (4.7%) | 89 (4.7%) |
| 18 to 34 Years | 224 (14.7%) | 66 (4.0%) |
| 35 to 64 Years | 439 (15.4%) | 404 (17.0%) |
| 65 to 74 Years | 282 (49.2%) | 168 (46.8%) |
| 75 Years and over | 377 (68.7%) | 215 (64.2%) |
Disability Class by Sex by Age in Coalinga
Disability Class: Hearing Difficulty
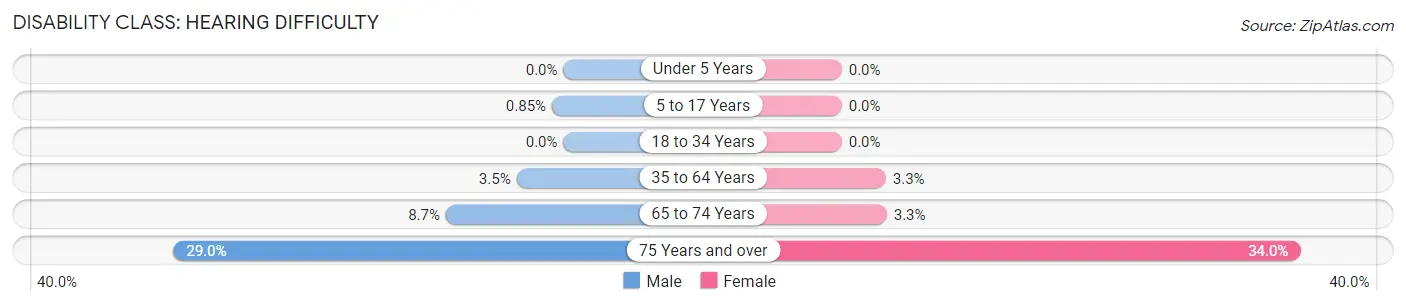
| Age Bracket | Male | Female |
| Under 5 Years | 0 (0.0%) | 0 (0.0%) |
| 5 to 17 Years | 12 (0.9%) | 0 (0.0%) |
| 18 to 34 Years | 0 (0.0%) | 0 (0.0%) |
| 35 to 64 Years | 99 (3.5%) | 78 (3.3%) |
| 65 to 74 Years | 50 (8.7%) | 12 (3.3%) |
| 75 Years and over | 159 (29.0%) | 114 (34.0%) |
Disability Class: Vision Difficulty
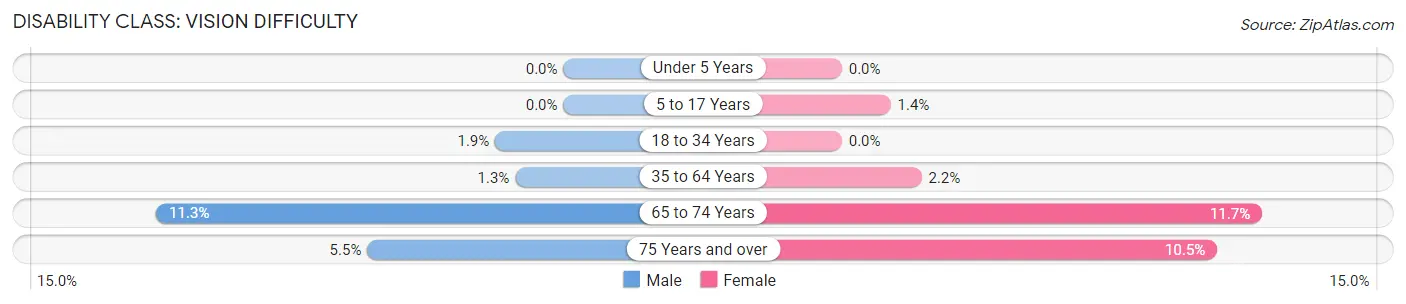
| Age Bracket | Male | Female |
| Under 5 Years | 0 (0.0%) | 0 (0.0%) |
| 5 to 17 Years | 0 (0.0%) | 26 (1.4%) |
| 18 to 34 Years | 29 (1.9%) | 0 (0.0%) |
| 35 to 64 Years | 38 (1.3%) | 53 (2.2%) |
| 65 to 74 Years | 65 (11.3%) | 42 (11.7%) |
| 75 Years and over | 30 (5.5%) | 35 (10.4%) |
Disability Class: Cognitive Difficulty
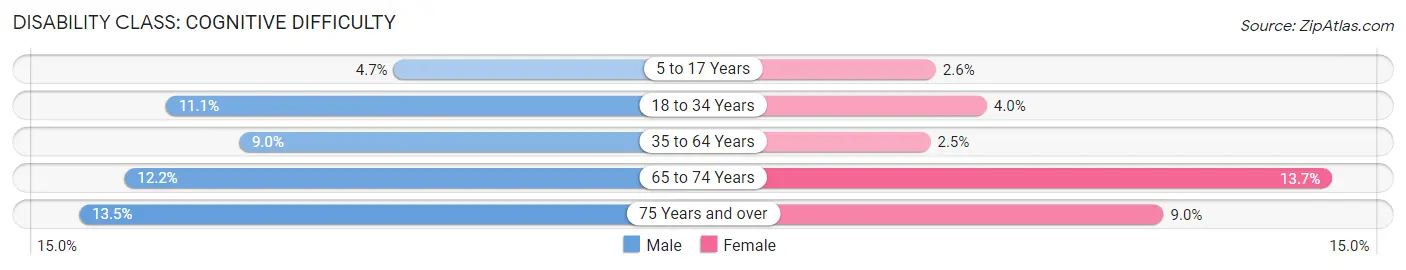
| Age Bracket | Male | Female |
| 5 to 17 Years | 67 (4.7%) | 50 (2.6%) |
| 18 to 34 Years | 169 (11.1%) | 66 (4.0%) |
| 35 to 64 Years | 257 (9.0%) | 59 (2.5%) |
| 65 to 74 Years | 70 (12.2%) | 49 (13.7%) |
| 75 Years and over | 74 (13.5%) | 30 (9.0%) |
Disability Class: Ambulatory Difficulty
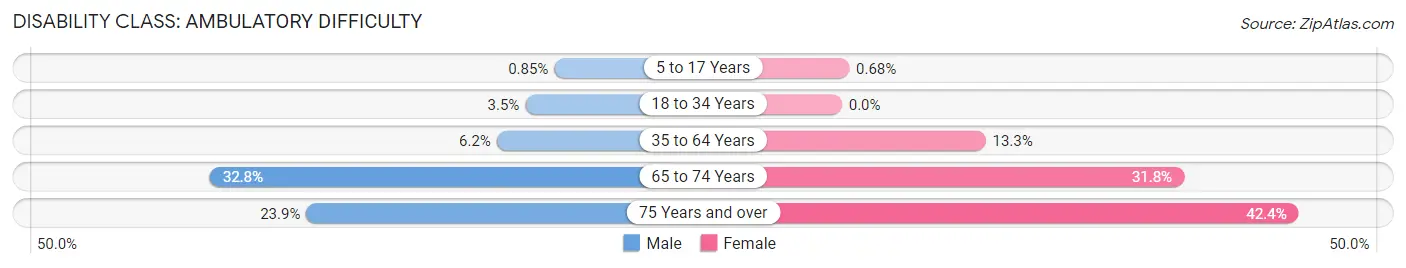
| Age Bracket | Male | Female |
| 5 to 17 Years | 12 (0.9%) | 13 (0.7%) |
| 18 to 34 Years | 54 (3.5%) | 0 (0.0%) |
| 35 to 64 Years | 176 (6.2%) | 318 (13.3%) |
| 65 to 74 Years | 188 (32.8%) | 114 (31.8%) |
| 75 Years and over | 131 (23.9%) | 142 (42.4%) |
Disability Class: Self-Care Difficulty
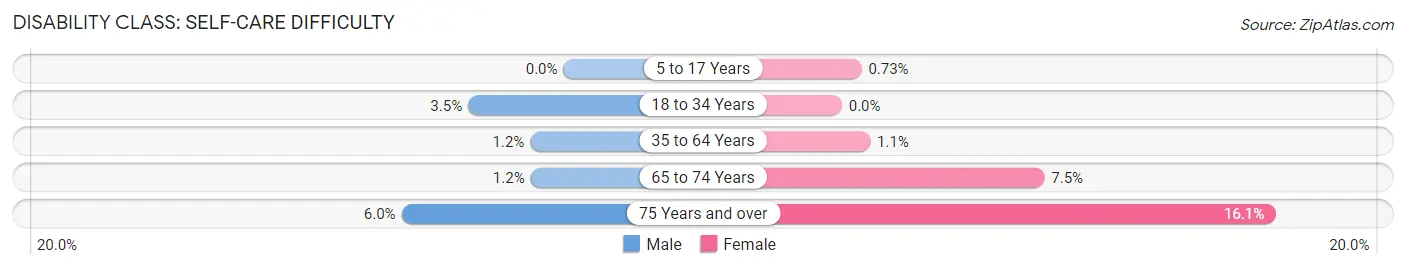
| Age Bracket | Male | Female |
| 5 to 17 Years | 0 (0.0%) | 14 (0.7%) |
| 18 to 34 Years | 54 (3.5%) | 0 (0.0%) |
| 35 to 64 Years | 35 (1.2%) | 25 (1.1%) |
| 65 to 74 Years | 7 (1.2%) | 27 (7.5%) |
| 75 Years and over | 33 (6.0%) | 54 (16.1%) |
Technology Access in Coalinga
Computing Device Access in Coalinga
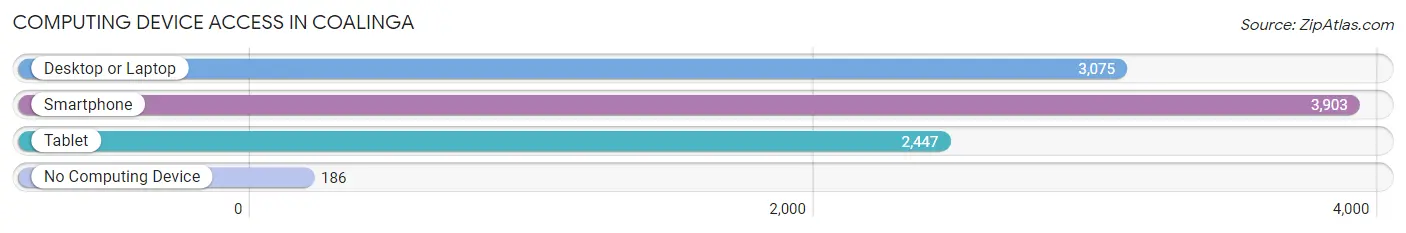
| Device Type | # Households | % Households |
| Desktop or Laptop | 3,075 | 72.9% |
| Smartphone | 3,903 | 92.5% |
| Tablet | 2,447 | 58.0% |
| No Computing Device | 186 | 4.4% |
| Total | 4,219 | 100.0% |
Internet Access in Coalinga
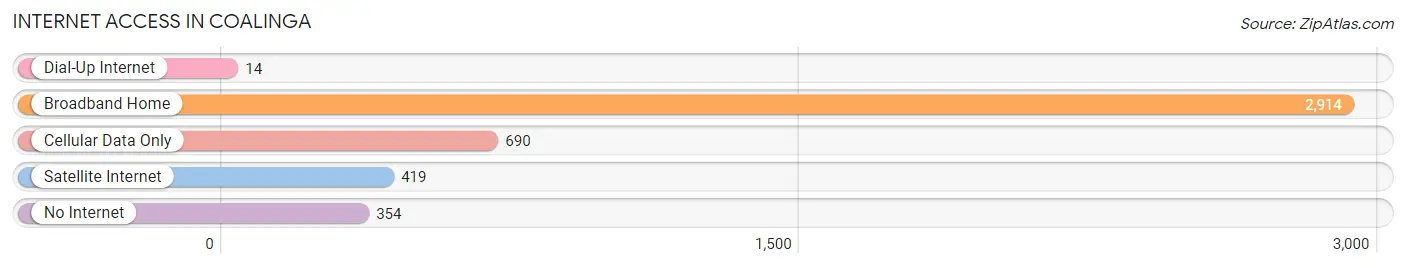
| Internet Type | # Households | % Households |
| Dial-Up Internet | 14 | 0.3% |
| Broadband Home | 2,914 | 69.1% |
| Cellular Data Only | 690 | 16.4% |
| Satellite Internet | 419 | 9.9% |
| No Internet | 354 | 8.4% |
| Total | 4,219 | 100.0% |
Coalinga Summary
Coalinga is a city located in Fresno County, California, United States. It is situated in the San Joaquin Valley, approximately halfway between Los Angeles and San Francisco. The city was founded in 1887 and incorporated in 1910. As of the 2010 census, the population of Coalinga was 13,380.
History
Coalinga was founded in 1887 by the Southern Pacific Railroad. The city was named after the nearby Coaling Station, which was used to fuel steam locomotives. The station was named after the coal deposits found in the area. The city was incorporated in 1910 and was the site of a major oil discovery in the 1930s. The discovery of oil in the Coalinga area led to a population boom and the city quickly became a major oil producer.
Geography
Coalinga is located at 36°09'25"N 120°13'45"W (36.156944, -120.229167). It is situated in the San Joaquin Valley, approximately halfway between Los Angeles and San Francisco. The city has a total area of 5.3 square miles, all of which is land.
Economy
Coalinga’s economy is largely based on oil production. The city is home to several oil companies, including Chevron, Occidental Petroleum, and Aera Energy. The city also has a large agricultural sector, with crops such as cotton, tomatoes, and grapes being grown in the area.
Demographics
As of the 2010 census, the population of Coalinga was 13,380. The racial makeup of the city was 57.2% White, 1.2% African American, 1.3% Native American, 0.7% Asian, 0.1% Pacific Islander, 36.2% from other races, and 3.4% from two or more races. Hispanic or Latino of any race were 58.2% of the population.
The median income for a household in Coalinga was $37,917, and the median income for a family was $45,938. The per capita income for the city was $17,845. About 18.2% of families and 22.2% of the population were below the poverty line, including 28.3% of those under age 18 and 11.2% of those age 65 or over.
Common Questions
What is Per Capita Income in Coalinga?
Per Capita income in Coalinga is $23,456.
What is the Median Family Income in Coalinga?
Median Family Income in Coalinga is $69,500.
What is the Median Household income in Coalinga?
Median Household Income in Coalinga is $68,976.
What is Income or Wage Gap in Coalinga?
Income or Wage Gap in Coalinga is 13.2%.
Women in Coalinga earn 86.8 cents for every dollar earned by a man.
What is Inequality or Gini Index in Coalinga?
Inequality or Gini Index in Coalinga is 0.41.
What is the Total Population of Coalinga?
Total Population of Coalinga is 17,488.
What is the Total Male Population of Coalinga?
Total Male Population of Coalinga is 10,442.
What is the Total Female Population of Coalinga?
Total Female Population of Coalinga is 7,046.
What is the Ratio of Males per 100 Females in Coalinga?
There are 148.20 Males per 100 Females in Coalinga.
What is the Ratio of Females per 100 Males in Coalinga?
There are 67.48 Females per 100 Males in Coalinga.
What is the Median Population Age in Coalinga?
Median Population Age in Coalinga is 35.0 Years.
What is the Average Family Size in Coalinga
Average Family Size in Coalinga is 3.7 People.
What is the Average Household Size in Coalinga
Average Household Size in Coalinga is 3.2 People.
How Large is the Labor Force in Coalinga?
There are 6,405 People in the Labor Forcein in Coalinga.
What is the Percentage of People in the Labor Force in Coalinga?
45.7% of People are in the Labor Force in Coalinga.
What is the Unemployment Rate in Coalinga?
Unemployment Rate in Coalinga is 11.8%.