Cities with the Highest Unemployment Rate Amomg Youth Under the Age of 25 in New York
RELATED REPORTS & OPTIONS
Highest Unemployment | Youth < 25
New York
Compare Cities
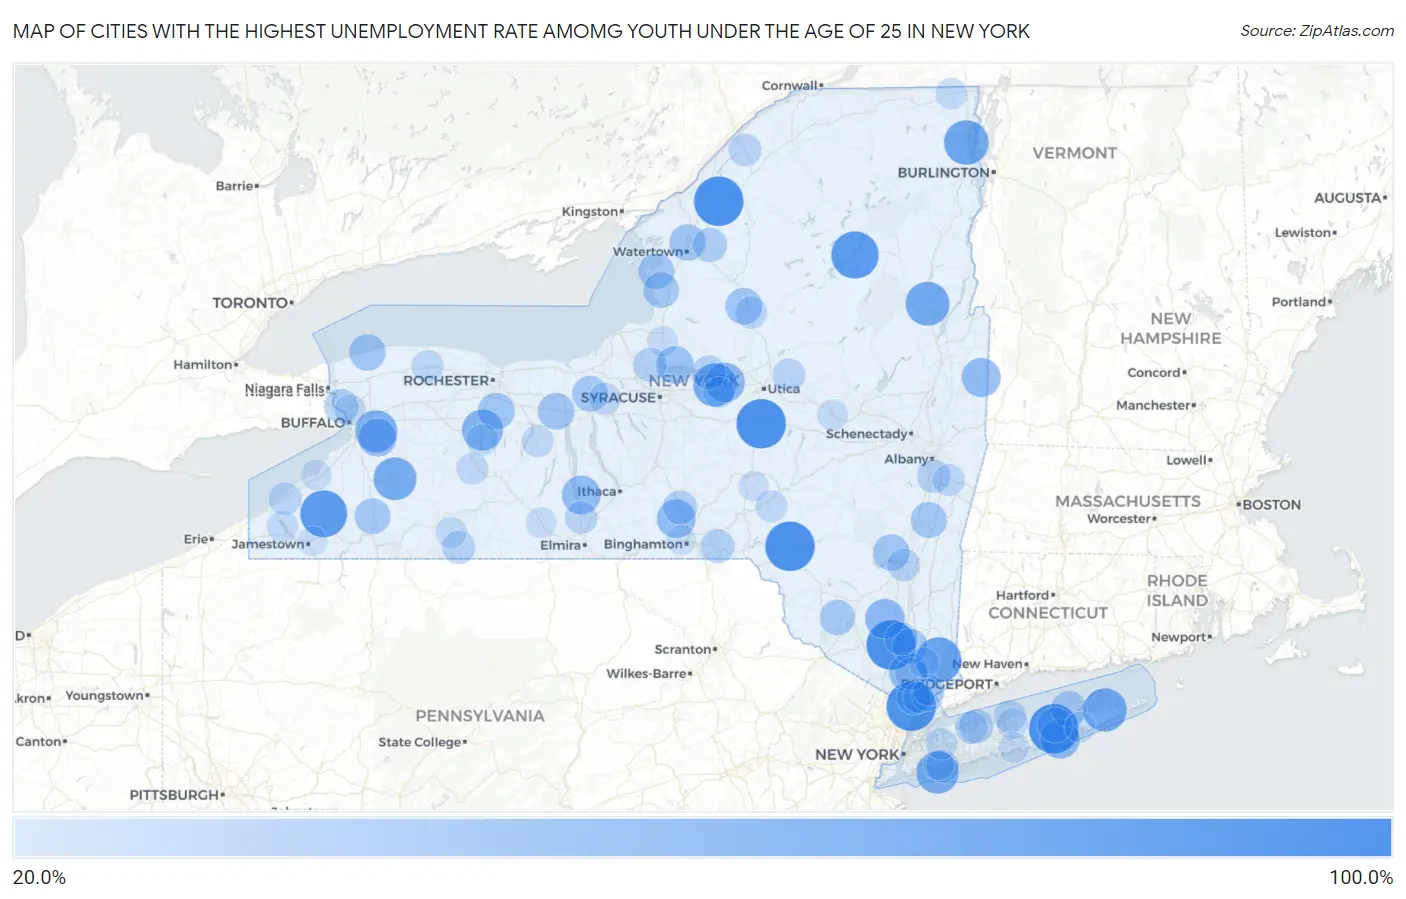
Map of Cities with the Highest Unemployment Rate Amomg Youth Under the Age of 25 in New York
0.0%
100.0%
Cities with the Highest Unemployment Rate Amomg Youth Under the Age of 25 in New York
| City | Youth Unemployment | vs State | vs National | |
| 1. | Bridgewater | 100.0% | 13.2%(+86.8)#1 | 10.9%(+89.1)#1 |
| 2. | Sparkill | 100.0% | 13.2%(+86.8)#2 | 10.9%(+89.1)#8 |
| 3. | Wassaic | 100.0% | 13.2%(+86.8)#3 | 10.9%(+89.1)#12 |
| 4. | New Hamburg | 100.0% | 13.2%(+86.8)#4 | 10.9%(+89.1)#67 |
| 5. | Wurtsboro Hills | 100.0% | 13.2%(+86.8)#5 | 10.9%(+89.1)#130 |
| 6. | Downsville | 100.0% | 13.2%(+86.8)#6 | 10.9%(+89.1)#145 |
| 7. | Salisbury Mills | 100.0% | 13.2%(+86.8)#7 | 10.9%(+89.1)#154 |
| 8. | Jefferson | 100.0% | 13.2%(+86.8)#8 | 10.9%(+89.1)#229 |
| 9. | Oxbow | 100.0% | 13.2%(+86.8)#9 | 10.9%(+89.1)#244 |
| 10. | Northampton | 99.9% | 13.2%(+86.7)#10 | 10.9%(+89.0)#328 |
| 11. | Long Lake | 92.1% | 13.2%(+78.9)#11 | 10.9%(+81.2)#398 |
| 12. | Cherry Creek | 90.4% | 13.2%(+77.2)#12 | 10.9%(+79.5)#402 |
| 13. | Heritage Hills | 84.9% | 13.2%(+71.7)#13 | 10.9%(+74.0)#428 |
| 14. | Parc | 81.7% | 13.2%(+68.5)#14 | 10.9%(+70.8)#451 |
| 15. | Chestertown | 79.2% | 13.2%(+66.0)#15 | 10.9%(+68.3)#467 |
| 16. | Northwest Harbor | 77.7% | 13.2%(+64.5)#16 | 10.9%(+66.8)#480 |
| 17. | Durhamville | 77.7% | 13.2%(+64.5)#17 | 10.9%(+66.8)#482 |
| 18. | Yorkshire | 75.7% | 13.2%(+62.5)#18 | 10.9%(+64.8)#502 |
| 19. | East Atlantic Beach | 73.9% | 13.2%(+60.7)#19 | 10.9%(+63.0)#529 |
| 20. | Unadilla Forks | 73.8% | 13.2%(+60.6)#20 | 10.9%(+62.9)#536 |
| 21. | Elma Center | 72.4% | 13.2%(+59.2)#21 | 10.9%(+61.5)#549 |
| 22. | Lakeville | 68.9% | 13.2%(+55.7)#22 | 10.9%(+58.0)#603 |
| 23. | Burlington Flats | 66.6% | 13.2%(+53.4)#23 | 10.9%(+55.7)#645 |
| 24. | Verona | 64.0% | 13.2%(+50.8)#24 | 10.9%(+53.1)#687 |
| 25. | Wallkill | 63.6% | 13.2%(+50.4)#25 | 10.9%(+52.7)#696 |
| 26. | Quiogue | 63.3% | 13.2%(+50.1)#26 | 10.9%(+52.4)#706 |
| 27. | Verplanck | 62.0% | 13.2%(+48.8)#27 | 10.9%(+51.1)#730 |
| 28. | Salem | 61.7% | 13.2%(+48.5)#28 | 10.9%(+50.8)#734 |
| 29. | Burdett | 60.3% | 13.2%(+47.1)#29 | 10.9%(+49.4)#762 |
| 30. | Glen Aubrey | 60.0% | 13.2%(+46.8)#30 | 10.9%(+49.1)#773 |
| 31. | Billington Heights | 58.2% | 13.2%(+45.0)#31 | 10.9%(+47.3)#820 |
| 32. | Constantia | 55.8% | 13.2%(+42.6)#32 | 10.9%(+44.9)#889 |
| 33. | Honeoye Falls | 53.7% | 13.2%(+40.5)#33 | 10.9%(+42.8)#962 |
| 34. | Phelps | 52.9% | 13.2%(+39.7)#34 | 10.9%(+42.0)#995 |
| 35. | Turin | 52.9% | 13.2%(+39.7)#35 | 10.9%(+42.0)#998 |
| 36. | Olcott | 52.0% | 13.2%(+38.8)#36 | 10.9%(+41.1)#1,021 |
| 37. | Woodstock | 51.9% | 13.2%(+38.7)#37 | 10.9%(+41.0)#1,025 |
| 38. | Pamelia Center | 51.6% | 13.2%(+38.4)#38 | 10.9%(+40.7)#1,041 |
| 39. | Ruby | 51.2% | 13.2%(+38.0)#39 | 10.9%(+40.3)#1,051 |
| 40. | Hudson | 50.4% | 13.2%(+37.2)#40 | 10.9%(+39.5)#1,072 |
| 41. | Henderson | 50.0% | 13.2%(+36.8)#41 | 10.9%(+39.1)#1,116 |
| 42. | Ellisburg | 50.0% | 13.2%(+36.8)#42 | 10.9%(+39.1)#1,130 |
| 43. | Savannah | 49.9% | 13.2%(+36.7)#43 | 10.9%(+39.0)#1,172 |
| 44. | Ellicottville | 49.9% | 13.2%(+36.7)#44 | 10.9%(+39.0)#1,173 |
| 45. | Mattituck | 48.9% | 13.2%(+35.7)#45 | 10.9%(+38.0)#1,209 |
| 46. | Rock Hill | 48.6% | 13.2%(+35.4)#46 | 10.9%(+37.7)#1,219 |
| 47. | Nelsonville | 47.4% | 13.2%(+34.2)#47 | 10.9%(+36.5)#1,259 |
| 48. | Riverside | 46.9% | 13.2%(+33.7)#48 | 10.9%(+36.0)#1,272 |
| 49. | Grandyle Village | 44.9% | 13.2%(+31.7)#49 | 10.9%(+34.0)#1,367 |
| 50. | Great Bend | 44.3% | 13.2%(+31.1)#50 | 10.9%(+33.4)#1,403 |
| 51. | Whitney Point | 44.3% | 13.2%(+31.1)#51 | 10.9%(+33.4)#1,404 |
| 52. | Nyack | 43.6% | 13.2%(+30.4)#52 | 10.9%(+32.7)#1,438 |
| 53. | Centerport | 43.5% | 13.2%(+30.3)#53 | 10.9%(+32.6)#1,450 |
| 54. | Sylvan Beach | 43.3% | 13.2%(+30.1)#54 | 10.9%(+32.4)#1,470 |
| 55. | Sand Ridge | 43.2% | 13.2%(+30.0)#55 | 10.9%(+32.3)#1,479 |
| 56. | Windsor | 43.0% | 13.2%(+29.8)#56 | 10.9%(+32.1)#1,489 |
| 57. | Castleton On Hudson | 41.7% | 13.2%(+28.5)#57 | 10.9%(+30.8)#1,584 |
| 58. | Clifton Gardens | 41.0% | 13.2%(+27.8)#58 | 10.9%(+30.1)#1,641 |
| 59. | New Windsor | 40.8% | 13.2%(+27.6)#59 | 10.9%(+29.9)#1,651 |
| 60. | Stannards | 40.7% | 13.2%(+27.5)#60 | 10.9%(+29.8)#1,659 |
| 61. | Newport | 39.6% | 13.2%(+26.4)#61 | 10.9%(+28.7)#1,744 |
| 62. | Heuvelton | 39.3% | 13.2%(+26.1)#62 | 10.9%(+28.4)#1,760 |
| 63. | Lincoln Park | 39.1% | 13.2%(+25.9)#63 | 10.9%(+28.2)#1,768 |
| 64. | Millport | 39.1% | 13.2%(+25.9)#64 | 10.9%(+28.2)#1,773 |
| 65. | Belle Terre | 38.6% | 13.2%(+25.4)#65 | 10.9%(+27.7)#1,804 |
| 66. | Bay Park | 38.5% | 13.2%(+25.3)#66 | 10.9%(+27.6)#1,808 |
| 67. | Brocton | 38.3% | 13.2%(+25.1)#67 | 10.9%(+27.4)#1,829 |
| 68. | Halesite | 38.1% | 13.2%(+24.9)#68 | 10.9%(+27.2)#1,842 |
| 69. | Hawthorne | 37.8% | 13.2%(+24.6)#69 | 10.9%(+26.9)#1,863 |
| 70. | Port Leyden | 37.5% | 13.2%(+24.3)#70 | 10.9%(+26.6)#1,888 |
| 71. | East Frankfort | 37.5% | 13.2%(+24.3)#71 | 10.9%(+26.6)#1,890 |
| 72. | Albion | 37.0% | 13.2%(+23.8)#72 | 10.9%(+26.1)#1,934 |
| 73. | Montrose | 37.0% | 13.2%(+23.8)#73 | 10.9%(+26.1)#1,935 |
| 74. | Nassau | 37.0% | 13.2%(+23.8)#74 | 10.9%(+26.1)#1,937 |
| 75. | Port Byron | 36.6% | 13.2%(+23.4)#75 | 10.9%(+25.7)#1,964 |
| 76. | Rushville | 36.3% | 13.2%(+23.1)#76 | 10.9%(+25.4)#1,983 |
| 77. | Byersville | 36.3% | 13.2%(+23.1)#77 | 10.9%(+25.4)#1,998 |
| 78. | Franklin | 36.0% | 13.2%(+22.8)#78 | 10.9%(+25.1)#2,018 |
| 79. | North Hills | 35.3% | 13.2%(+22.1)#79 | 10.9%(+24.4)#2,073 |
| 80. | Mooers | 34.8% | 13.2%(+21.6)#80 | 10.9%(+23.9)#2,130 |
| 81. | Scio | 34.5% | 13.2%(+21.3)#81 | 10.9%(+23.6)#2,157 |
| 82. | Conesus Lake | 34.3% | 13.2%(+21.1)#82 | 10.9%(+23.4)#2,171 |
| 83. | Kenmore | 34.2% | 13.2%(+21.0)#83 | 10.9%(+23.3)#2,175 |
| 84. | Chautauqua | 34.2% | 13.2%(+21.0)#84 | 10.9%(+23.3)#2,187 |
| 85. | Pleasantville | 34.1% | 13.2%(+20.9)#85 | 10.9%(+23.2)#2,191 |
| 86. | Terryville | 33.9% | 13.2%(+20.7)#86 | 10.9%(+23.0)#2,204 |
| 87. | Oneida Castle | 33.3% | 13.2%(+20.1)#87 | 10.9%(+22.4)#2,261 |
| 88. | Sleepy Hollow | 33.1% | 13.2%(+19.9)#88 | 10.9%(+22.2)#2,354 |
| 89. | Fort Plain | 33.0% | 13.2%(+19.8)#89 | 10.9%(+22.1)#2,359 |
| 90. | Walworth | 32.8% | 13.2%(+19.6)#90 | 10.9%(+21.9)#2,372 |
| 91. | Campbell | 32.6% | 13.2%(+19.4)#91 | 10.9%(+21.7)#2,392 |
| 92. | Blue Point | 32.1% | 13.2%(+18.9)#92 | 10.9%(+21.2)#2,434 |
| 93. | Parish | 32.1% | 13.2%(+18.9)#93 | 10.9%(+21.2)#2,439 |
| 94. | Silver Creek | 31.9% | 13.2%(+18.7)#94 | 10.9%(+21.0)#2,458 |
| 95. | Shinnecock Hills | 31.5% | 13.2%(+18.3)#95 | 10.9%(+20.6)#2,502 |
| 96. | Gilbertsville | 31.2% | 13.2%(+18.0)#96 | 10.9%(+20.3)#2,549 |
| 97. | Hewlett | 30.9% | 13.2%(+17.7)#97 | 10.9%(+20.0)#2,574 |
| 98. | Johnson City | 30.4% | 13.2%(+17.2)#98 | 10.9%(+19.5)#2,624 |
| 99. | Shrub Oak | 30.2% | 13.2%(+17.0)#99 | 10.9%(+19.3)#2,652 |
| 100. | Falconer | 29.9% | 13.2%(+16.7)#100 | 10.9%(+19.0)#2,696 |
Common Questions
What are the Top 10 Cities with the Highest Unemployment Rate Amomg Youth Under the Age of 25 in New York?
Top 10 Cities with the Highest Unemployment Rate Amomg Youth Under the Age of 25 in New York are:
#1
100.0%
#2
100.0%
#3
100.0%
#4
100.0%
#5
100.0%
#6
99.9%
#7
92.1%
#8
90.4%
#9
84.9%
#10
81.7%
What city has the Highest Unemployment Rate Amomg Youth Under the Age of 25 in New York?
Bridgewater has the Highest Unemployment Rate Amomg Youth Under the Age of 25 in New York with 100.0%.
What is the Unemployment Rate Amomg Youth Under the Age of 25 in the State of New York?
Unemployment Rate Amomg Youth Under the Age of 25 in New York is 13.2%.
What is the Unemployment Rate Amomg Youth Under the Age of 25 in the United States?
Unemployment Rate Amomg Youth Under the Age of 25 in the United States is 10.9%.