Cities with the Highest Unemployment Rate Amomg Youth Under the Age of 25 in Wisconsin
RELATED REPORTS & OPTIONS
Highest Unemployment | Youth < 25
Wisconsin
Compare Cities
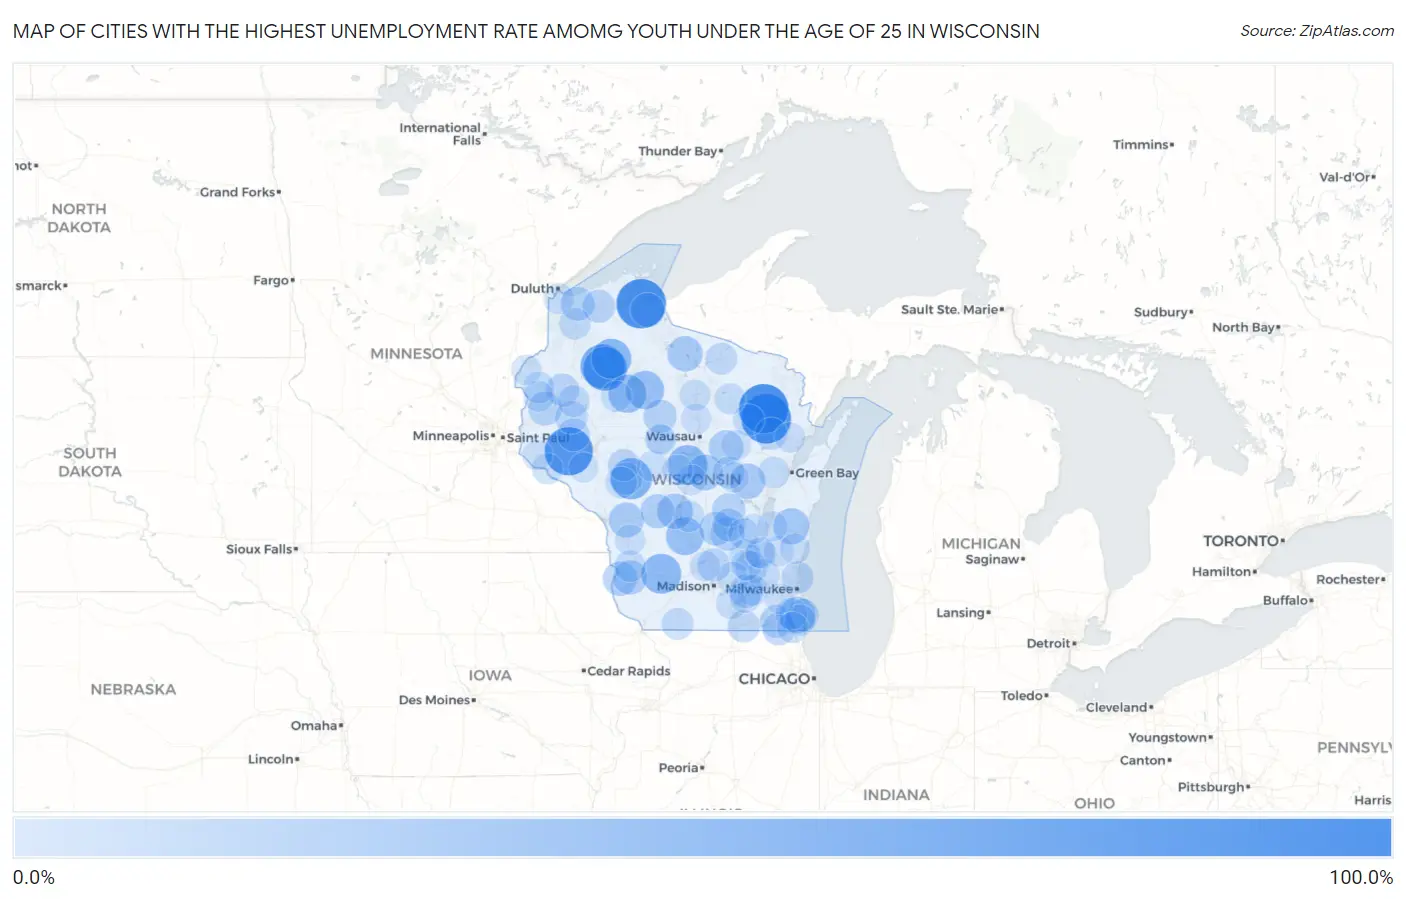
Map of Cities with the Highest Unemployment Rate Amomg Youth Under the Age of 25 in Wisconsin
0.0%
100.0%
Cities with the Highest Unemployment Rate Amomg Youth Under the Age of 25 in Wisconsin
| City | Youth Unemployment | vs State | vs National | |
| 1. | Mountain | 100.0% | 6.8%(+93.2)#1 | 10.9%(+89.1)#17 |
| 2. | New Odanah | 100.0% | 6.8%(+93.2)#2 | 10.9%(+89.1)#129 |
| 3. | Lakewood | 100.0% | 6.8%(+93.2)#3 | 10.9%(+89.1)#158 |
| 4. | Downsville | 94.4% | 6.8%(+87.6)#4 | 10.9%(+83.5)#385 |
| 5. | Reserve | 75.0% | 6.8%(+68.2)#5 | 10.9%(+64.1)#510 |
| 6. | Couderay | 75.0% | 6.8%(+68.2)#6 | 10.9%(+64.1)#516 |
| 7. | Merrillan | 63.8% | 6.8%(+57.0)#7 | 10.9%(+52.9)#692 |
| 8. | New Post | 58.3% | 6.8%(+51.5)#8 | 10.9%(+47.4)#818 |
| 9. | Milladore | 57.1% | 6.8%(+50.3)#9 | 10.9%(+46.2)#852 |
| 10. | Gotham | 57.1% | 6.8%(+50.3)#10 | 10.9%(+46.2)#861 |
| 11. | Kennan | 50.0% | 6.8%(+43.2)#11 | 10.9%(+39.1)#1,140 |
| 12. | Jolmaville | 50.0% | 6.8%(+43.2)#12 | 10.9%(+39.1)#1,145 |
| 13. | Glen Flora | 50.0% | 6.8%(+43.2)#13 | 10.9%(+39.1)#1,148 |
| 14. | Mindoro | 49.9% | 6.8%(+43.1)#14 | 10.9%(+39.0)#1,174 |
| 15. | Lyndon Station | 49.1% | 6.8%(+42.3)#15 | 10.9%(+38.2)#1,205 |
| 16. | Sturtevant | 41.7% | 6.8%(+34.9)#16 | 10.9%(+30.8)#1,580 |
| 17. | Elkhart Lake | 41.1% | 6.8%(+34.3)#17 | 10.9%(+30.2)#1,631 |
| 18. | Park Ridge | 40.0% | 6.8%(+33.2)#18 | 10.9%(+29.1)#1,691 |
| 19. | Northport | 39.1% | 6.8%(+32.3)#19 | 10.9%(+28.2)#1,772 |
| 20. | Necedah | 38.9% | 6.8%(+32.1)#20 | 10.9%(+28.0)#1,790 |
| 21. | Lac Du Flambeau | 38.0% | 6.8%(+31.2)#21 | 10.9%(+27.1)#1,852 |
| 22. | Sand Pillow | 37.5% | 6.8%(+30.7)#22 | 10.9%(+26.6)#1,898 |
| 23. | Rockland | 36.8% | 6.8%(+30.0)#23 | 10.9%(+25.9)#1,950 |
| 24. | Wittenberg | 35.2% | 6.8%(+28.4)#24 | 10.9%(+24.3)#2,089 |
| 25. | Marquette | 33.3% | 6.8%(+26.5)#25 | 10.9%(+22.4)#2,287 |
| 26. | Eastman | 33.3% | 6.8%(+26.5)#26 | 10.9%(+22.4)#2,291 |
| 27. | Birch Hill | 33.3% | 6.8%(+26.5)#27 | 10.9%(+22.4)#2,296 |
| 28. | Wyeville | 33.3% | 6.8%(+26.5)#28 | 10.9%(+22.4)#2,336 |
| 29. | Steuben | 33.2% | 6.8%(+26.4)#29 | 10.9%(+22.3)#2,352 |
| 30. | Montello | 32.1% | 6.8%(+25.3)#30 | 10.9%(+21.2)#2,437 |
| 31. | Poplar | 31.5% | 6.8%(+24.7)#31 | 10.9%(+20.6)#2,508 |
| 32. | Mission | 31.2% | 6.8%(+24.4)#32 | 10.9%(+20.3)#2,548 |
| 33. | Amery | 30.7% | 6.8%(+23.9)#33 | 10.9%(+19.8)#2,592 |
| 34. | Lohrville | 30.0% | 6.8%(+23.2)#34 | 10.9%(+19.1)#2,679 |
| 35. | Whittlesey | 30.0% | 6.8%(+23.2)#35 | 10.9%(+19.1)#2,687 |
| 36. | Jefferson | 29.7% | 6.8%(+22.9)#36 | 10.9%(+18.8)#2,723 |
| 37. | Arlington | 28.4% | 6.8%(+21.6)#37 | 10.9%(+17.5)#2,913 |
| 38. | Bohners Lake | 28.3% | 6.8%(+21.5)#38 | 10.9%(+17.4)#2,923 |
| 39. | Iron River | 28.1% | 6.8%(+21.3)#39 | 10.9%(+17.2)#2,954 |
| 40. | Twin Lakes | 27.9% | 6.8%(+21.1)#40 | 10.9%(+17.0)#2,969 |
| 41. | Princeton | 27.8% | 6.8%(+21.0)#41 | 10.9%(+16.9)#2,993 |
| 42. | Cumberland | 27.7% | 6.8%(+20.9)#42 | 10.9%(+16.8)#3,002 |
| 43. | Tainter Lake | 26.7% | 6.8%(+19.9)#43 | 10.9%(+15.8)#3,158 |
| 44. | Elmwood Park | 26.6% | 6.8%(+19.8)#44 | 10.9%(+15.7)#3,181 |
| 45. | Ridgeland | 26.3% | 6.8%(+19.5)#45 | 10.9%(+15.4)#3,256 |
| 46. | Suring | 25.9% | 6.8%(+19.1)#46 | 10.9%(+15.0)#3,329 |
| 47. | Clinton | 24.9% | 6.8%(+18.1)#47 | 10.9%(+14.0)#3,524 |
| 48. | Clyman | 24.9% | 6.8%(+18.1)#48 | 10.9%(+14.0)#3,541 |
| 49. | Iola | 24.5% | 6.8%(+17.7)#49 | 10.9%(+13.6)#3,613 |
| 50. | Bayside | 24.4% | 6.8%(+17.6)#50 | 10.9%(+13.5)#3,622 |
| 51. | Alma Center | 24.3% | 6.8%(+17.5)#51 | 10.9%(+13.4)#3,654 |
| 52. | Fairchild | 24.2% | 6.8%(+17.4)#52 | 10.9%(+13.3)#3,671 |
| 53. | Eagle River | 23.7% | 6.8%(+16.9)#53 | 10.9%(+12.8)#3,770 |
| 54. | Barron | 23.5% | 6.8%(+16.7)#54 | 10.9%(+12.6)#3,811 |
| 55. | Gratiot | 23.5% | 6.8%(+16.7)#55 | 10.9%(+12.6)#3,824 |
| 56. | Yorkville | 23.2% | 6.8%(+16.4)#56 | 10.9%(+12.3)#3,879 |
| 57. | Solon Springs | 23.0% | 6.8%(+16.2)#57 | 10.9%(+12.1)#3,935 |
| 58. | Beaver Dam | 22.5% | 6.8%(+15.7)#58 | 10.9%(+11.6)#4,036 |
| 59. | Hixton | 22.4% | 6.8%(+15.6)#59 | 10.9%(+11.5)#4,079 |
| 60. | Ashippun | 22.2% | 6.8%(+15.4)#60 | 10.9%(+11.3)#4,139 |
| 61. | Gays Mills | 21.7% | 6.8%(+14.9)#61 | 10.9%(+10.8)#4,262 |
| 62. | White Lake | 21.7% | 6.8%(+14.9)#62 | 10.9%(+10.8)#4,267 |
| 63. | Seymour | 21.6% | 6.8%(+14.8)#63 | 10.9%(+10.7)#4,278 |
| 64. | Adams | 21.4% | 6.8%(+14.6)#64 | 10.9%(+10.5)#4,336 |
| 65. | Luck | 21.4% | 6.8%(+14.6)#65 | 10.9%(+10.5)#4,340 |
| 66. | Marshall | 21.2% | 6.8%(+14.4)#66 | 10.9%(+10.3)#4,385 |
| 67. | Somers | 20.6% | 6.8%(+13.8)#67 | 10.9%(+9.70)#4,540 |
| 68. | Bristol | 20.4% | 6.8%(+13.6)#68 | 10.9%(+9.50)#4,591 |
| 69. | Ladysmith | 20.2% | 6.8%(+13.4)#69 | 10.9%(+9.30)#4,648 |
| 70. | Maiden Rock | 20.0% | 6.8%(+13.2)#70 | 10.9%(+9.10)#4,738 |
| 71. | Fairwater | 19.9% | 6.8%(+13.1)#71 | 10.9%(+9.00)#4,792 |
| 72. | Post Lake | 19.9% | 6.8%(+13.1)#72 | 10.9%(+9.00)#4,795 |
| 73. | Superior | 19.4% | 6.8%(+12.6)#73 | 10.9%(+8.50)#4,916 |
| 74. | Westby | 19.3% | 6.8%(+12.5)#74 | 10.9%(+8.40)#4,938 |
| 75. | Balsam Lake | 19.3% | 6.8%(+12.5)#75 | 10.9%(+8.40)#4,949 |
| 76. | Granton | 19.3% | 6.8%(+12.5)#76 | 10.9%(+8.40)#4,953 |
| 77. | Helenville | 19.2% | 6.8%(+12.4)#77 | 10.9%(+8.30)#4,987 |
| 78. | Lowell | 19.0% | 6.8%(+12.2)#78 | 10.9%(+8.10)#5,055 |
| 79. | Tomahawk | 18.9% | 6.8%(+12.1)#79 | 10.9%(+8.00)#5,072 |
| 80. | Edgerton | 18.8% | 6.8%(+12.0)#80 | 10.9%(+7.90)#5,105 |
| 81. | Mayville | 18.8% | 6.8%(+12.0)#81 | 10.9%(+7.90)#5,107 |
| 82. | Fort Atkinson | 18.4% | 6.8%(+11.6)#82 | 10.9%(+7.50)#5,224 |
| 83. | Kewaskum | 18.3% | 6.8%(+11.5)#83 | 10.9%(+7.40)#5,259 |
| 84. | Merrill | 18.1% | 6.8%(+11.3)#84 | 10.9%(+7.20)#5,304 |
| 85. | Biron | 18.1% | 6.8%(+11.3)#85 | 10.9%(+7.20)#5,330 |
| 86. | Random Lake | 18.0% | 6.8%(+11.2)#86 | 10.9%(+7.10)#5,387 |
| 87. | Kekoskee | 17.9% | 6.8%(+11.1)#87 | 10.9%(+7.00)#5,428 |
| 88. | Arpin | 17.8% | 6.8%(+11.0)#88 | 10.9%(+6.90)#5,470 |
| 89. | Colby | 17.5% | 6.8%(+10.7)#89 | 10.9%(+6.60)#5,615 |
| 90. | Lena | 17.4% | 6.8%(+10.6)#90 | 10.9%(+6.50)#5,660 |
| 91. | Lodi | 17.2% | 6.8%(+10.4)#91 | 10.9%(+6.30)#5,731 |
| 92. | Grantsburg | 17.1% | 6.8%(+10.3)#92 | 10.9%(+6.20)#5,779 |
| 93. | Ellsworth | 16.9% | 6.8%(+10.1)#93 | 10.9%(+6.00)#5,829 |
| 94. | Big Bend | 16.6% | 6.8%(+9.80)#94 | 10.9%(+5.70)#5,944 |
| 95. | St Peter | 16.6% | 6.8%(+9.80)#95 | 10.9%(+5.70)#5,945 |
| 96. | Rosendale | 16.6% | 6.8%(+9.80)#96 | 10.9%(+5.70)#5,952 |
| 97. | Bowler | 16.6% | 6.8%(+9.80)#97 | 10.9%(+5.70)#5,982 |
| 98. | Ogdensburg | 16.6% | 6.8%(+9.80)#98 | 10.9%(+5.70)#5,999 |
| 99. | Mondovi | 16.5% | 6.8%(+9.70)#99 | 10.9%(+5.60)#6,046 |
| 100. | Abbotsford | 16.4% | 6.8%(+9.60)#100 | 10.9%(+5.50)#6,068 |
Common Questions
What are the Top 10 Cities with the Highest Unemployment Rate Amomg Youth Under the Age of 25 in Wisconsin?
Top 10 Cities with the Highest Unemployment Rate Amomg Youth Under the Age of 25 in Wisconsin are:
#1
100.0%
#2
100.0%
#3
100.0%
#4
94.4%
#5
75.0%
#6
75.0%
#7
63.8%
#8
58.3%
#9
57.1%
#10
57.1%
What city has the Highest Unemployment Rate Amomg Youth Under the Age of 25 in Wisconsin?
Mountain has the Highest Unemployment Rate Amomg Youth Under the Age of 25 in Wisconsin with 100.0%.
What is the Unemployment Rate Amomg Youth Under the Age of 25 in the State of Wisconsin?
Unemployment Rate Amomg Youth Under the Age of 25 in Wisconsin is 6.8%.
What is the Unemployment Rate Amomg Youth Under the Age of 25 in the United States?
Unemployment Rate Amomg Youth Under the Age of 25 in the United States is 10.9%.