Cities with the Highest Unemployment Rate Amomg Youth Under the Age of 25 in Arkansas
RELATED REPORTS & OPTIONS
Highest Unemployment | Youth < 25
Arkansas
Compare Cities
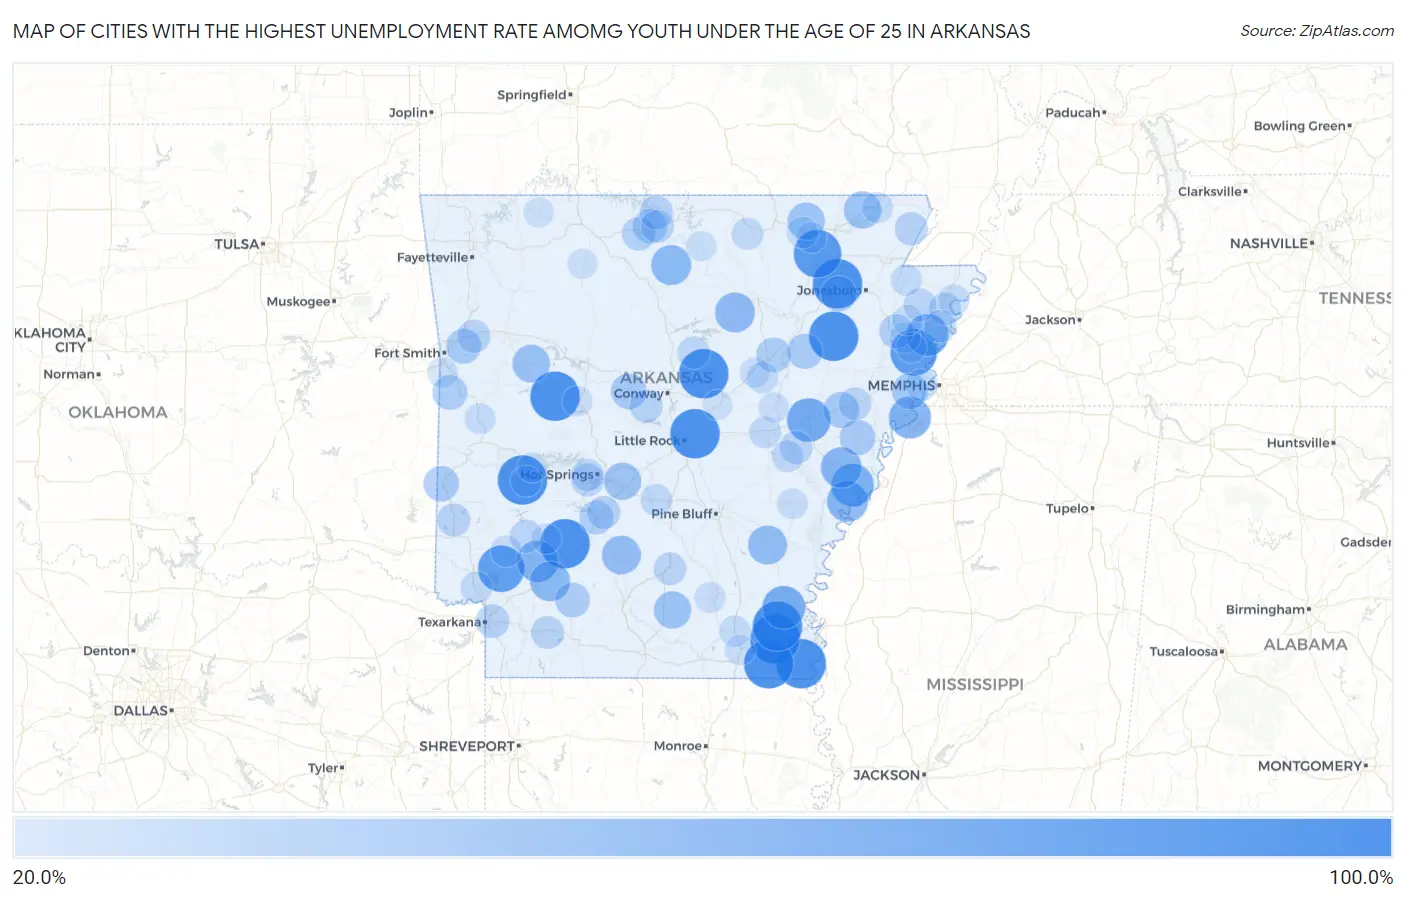
Map of Cities with the Highest Unemployment Rate Amomg Youth Under the Age of 25 in Arkansas
0.0%
100.0%
Cities with the Highest Unemployment Rate Amomg Youth Under the Age of 25 in Arkansas
| City | Youth Unemployment | vs State | vs National | |
| 1. | Eudora | 100.0% | 11.3%(+88.7)#1 | 10.9%(+89.1)#40 |
| 2. | Mcalmont | 100.0% | 11.3%(+88.7)#2 | 10.9%(+89.1)#43 |
| 3. | Lacey | 100.0% | 11.3%(+88.7)#3 | 10.9%(+89.1)#94 |
| 4. | Okolona | 100.0% | 11.3%(+88.7)#4 | 10.9%(+89.1)#143 |
| 5. | Mount Vernon | 100.0% | 11.3%(+88.7)#5 | 10.9%(+89.1)#159 |
| 6. | Montrose | 100.0% | 11.3%(+88.7)#6 | 10.9%(+89.1)#170 |
| 7. | Wilburn | 100.0% | 11.3%(+88.7)#7 | 10.9%(+89.1)#172 |
| 8. | Fisher | 100.0% | 11.3%(+88.7)#8 | 10.9%(+89.1)#199 |
| 9. | Parkdale | 100.0% | 11.3%(+88.7)#9 | 10.9%(+89.1)#249 |
| 10. | Black Springs | 100.0% | 11.3%(+88.7)#10 | 10.9%(+89.1)#277 |
| 11. | Egypt | 100.0% | 11.3%(+88.7)#11 | 10.9%(+89.1)#292 |
| 12. | Corinth | 100.0% | 11.3%(+88.7)#12 | 10.9%(+89.1)#313 |
| 13. | Jerome | 99.9% | 11.3%(+88.6)#13 | 10.9%(+89.0)#364 |
| 14. | Powhatan | 92.2% | 11.3%(+80.9)#14 | 10.9%(+81.3)#397 |
| 15. | Turrell | 88.1% | 11.3%(+76.8)#15 | 10.9%(+77.2)#411 |
| 16. | Tollette | 87.5% | 11.3%(+76.2)#16 | 10.9%(+76.6)#414 |
| 17. | Brinkley | 75.4% | 11.3%(+64.1)#17 | 10.9%(+64.5)#504 |
| 18. | Dermott | 73.2% | 11.3%(+61.9)#18 | 10.9%(+62.3)#540 |
| 19. | Lake View | 71.4% | 11.3%(+60.1)#19 | 10.9%(+60.5)#563 |
| 20. | Joiner | 69.6% | 11.3%(+58.3)#20 | 10.9%(+58.7)#590 |
| 21. | Horseshoe Lake | 69.1% | 11.3%(+57.8)#21 | 10.9%(+58.2)#600 |
| 22. | Blevins | 66.7% | 11.3%(+55.4)#22 | 10.9%(+55.8)#632 |
| 23. | Elaine | 64.7% | 11.3%(+53.4)#23 | 10.9%(+53.8)#675 |
| 24. | Marvell | 63.7% | 11.3%(+52.4)#24 | 10.9%(+52.8)#694 |
| 25. | Big Flat | 61.0% | 11.3%(+49.7)#25 | 10.9%(+50.1)#747 |
| 26. | Emmet | 60.9% | 11.3%(+49.6)#26 | 10.9%(+50.0)#749 |
| 27. | Concord | 60.0% | 11.3%(+48.7)#27 | 10.9%(+49.1)#776 |
| 28. | Gould | 57.1% | 11.3%(+45.8)#28 | 10.9%(+46.2)#850 |
| 29. | Sparkman | 55.5% | 11.3%(+44.2)#29 | 10.9%(+44.6)#901 |
| 30. | Subiaco | 51.5% | 11.3%(+40.2)#30 | 10.9%(+40.6)#1,044 |
| 31. | Ravenden Springs | 50.0% | 11.3%(+38.7)#31 | 10.9%(+39.1)#1,128 |
| 32. | Datto | 50.0% | 11.3%(+38.7)#32 | 10.9%(+39.1)#1,153 |
| 33. | Harrell | 49.9% | 11.3%(+38.6)#33 | 10.9%(+39.0)#1,178 |
| 34. | Magnet Cove | 49.3% | 11.3%(+38.0)#34 | 10.9%(+38.4)#1,201 |
| 35. | Edmondson | 44.4% | 11.3%(+33.1)#35 | 10.9%(+33.5)#1,398 |
| 36. | Palestine | 44.1% | 11.3%(+32.8)#36 | 10.9%(+33.2)#1,414 |
| 37. | Marianna | 43.0% | 11.3%(+31.7)#37 | 10.9%(+32.1)#1,485 |
| 38. | Oppelo | 43.0% | 11.3%(+31.7)#38 | 10.9%(+32.1)#1,490 |
| 39. | Cash | 42.8% | 11.3%(+31.5)#39 | 10.9%(+31.9)#1,516 |
| 40. | Cove | 42.0% | 11.3%(+30.7)#40 | 10.9%(+31.1)#1,565 |
| 41. | Tupelo | 41.6% | 11.3%(+30.3)#41 | 10.9%(+30.7)#1,607 |
| 42. | Kibler | 40.7% | 11.3%(+29.4)#42 | 10.9%(+29.8)#1,657 |
| 43. | Rosston | 40.0% | 11.3%(+28.7)#43 | 10.9%(+29.1)#1,692 |
| 44. | Midland | 40.0% | 11.3%(+28.7)#44 | 10.9%(+29.1)#1,694 |
| 45. | Russell | 40.0% | 11.3%(+28.7)#45 | 10.9%(+29.1)#1,696 |
| 46. | Flippin | 37.8% | 11.3%(+26.5)#46 | 10.9%(+26.9)#1,865 |
| 47. | Marked Tree | 37.5% | 11.3%(+26.2)#47 | 10.9%(+26.6)#1,882 |
| 48. | Caddo Valley | 36.8% | 11.3%(+25.5)#48 | 10.9%(+25.9)#1,949 |
| 49. | Yellville | 35.5% | 11.3%(+24.2)#49 | 10.9%(+24.6)#2,059 |
| 50. | Lakeview | 35.2% | 11.3%(+23.9)#50 | 10.9%(+24.3)#2,090 |
| 51. | Texarkana | 35.0% | 11.3%(+23.7)#51 | 10.9%(+24.1)#2,106 |
| 52. | Rector | 34.4% | 11.3%(+23.1)#52 | 10.9%(+23.5)#2,160 |
| 53. | Dyer | 33.7% | 11.3%(+22.4)#53 | 10.9%(+22.8)#2,226 |
| 54. | Bigelow | 33.3% | 11.3%(+22.0)#54 | 10.9%(+22.4)#2,281 |
| 55. | Gillham | 33.3% | 11.3%(+22.0)#55 | 10.9%(+22.4)#2,309 |
| 56. | Friendship | 33.3% | 11.3%(+22.0)#56 | 10.9%(+22.4)#2,315 |
| 57. | Stamps | 32.9% | 11.3%(+21.6)#57 | 10.9%(+22.0)#2,366 |
| 58. | Clarendon | 32.7% | 11.3%(+21.4)#58 | 10.9%(+21.8)#2,377 |
| 59. | Forrest City | 32.6% | 11.3%(+21.3)#59 | 10.9%(+21.7)#2,380 |
| 60. | Rockwell | 32.6% | 11.3%(+21.3)#60 | 10.9%(+21.7)#2,385 |
| 61. | Cotter | 32.5% | 11.3%(+21.2)#61 | 10.9%(+21.6)#2,400 |
| 62. | Murfreesboro | 31.8% | 11.3%(+20.5)#62 | 10.9%(+20.9)#2,468 |
| 63. | Etowah | 31.8% | 11.3%(+20.5)#63 | 10.9%(+20.9)#2,474 |
| 64. | Fordyce | 31.7% | 11.3%(+20.4)#64 | 10.9%(+20.8)#2,483 |
| 65. | Piney | 31.0% | 11.3%(+19.7)#65 | 10.9%(+20.1)#2,564 |
| 66. | Quitman | 31.0% | 11.3%(+19.7)#66 | 10.9%(+20.1)#2,572 |
| 67. | Osceola | 30.5% | 11.3%(+19.2)#67 | 10.9%(+19.6)#2,616 |
| 68. | Wilson | 30.2% | 11.3%(+18.9)#68 | 10.9%(+19.3)#2,659 |
| 69. | Horseshoe Bend | 28.8% | 11.3%(+17.5)#69 | 10.9%(+17.9)#2,833 |
| 70. | Hazen | 28.5% | 11.3%(+17.2)#70 | 10.9%(+17.6)#2,868 |
| 71. | Prattsville | 28.5% | 11.3%(+17.2)#71 | 10.9%(+17.6)#2,884 |
| 72. | Roe | 28.5% | 11.3%(+17.2)#72 | 10.9%(+17.6)#2,901 |
| 73. | Ashdown | 27.9% | 11.3%(+16.6)#73 | 10.9%(+17.0)#2,971 |
| 74. | West Memphis | 27.5% | 11.3%(+16.2)#74 | 10.9%(+16.6)#3,028 |
| 75. | West Point | 27.2% | 11.3%(+15.9)#75 | 10.9%(+16.3)#3,092 |
| 76. | Nashville | 27.0% | 11.3%(+15.7)#76 | 10.9%(+16.1)#3,115 |
| 77. | Ravenden | 26.8% | 11.3%(+15.5)#77 | 10.9%(+15.9)#3,151 |
| 78. | Fountain Hill | 26.6% | 11.3%(+15.3)#78 | 10.9%(+15.7)#3,195 |
| 79. | Monette | 26.4% | 11.3%(+15.1)#79 | 10.9%(+15.5)#3,222 |
| 80. | Luxora | 25.8% | 11.3%(+14.5)#80 | 10.9%(+14.9)#3,343 |
| 81. | Tyronza | 25.7% | 11.3%(+14.4)#81 | 10.9%(+14.8)#3,366 |
| 82. | Waldron | 25.0% | 11.3%(+13.7)#82 | 10.9%(+14.1)#3,454 |
| 83. | Corning | 25.0% | 11.3%(+13.7)#83 | 10.9%(+14.1)#3,456 |
| 84. | Norman | 24.9% | 11.3%(+13.6)#84 | 10.9%(+14.0)#3,542 |
| 85. | Warren | 24.8% | 11.3%(+13.5)#85 | 10.9%(+13.9)#3,552 |
| 86. | Dewitt | 24.3% | 11.3%(+13.0)#86 | 10.9%(+13.4)#3,644 |
| 87. | Imboden | 24.2% | 11.3%(+12.9)#87 | 10.9%(+13.3)#3,668 |
| 88. | Bonanza | 23.7% | 11.3%(+12.4)#88 | 10.9%(+12.8)#3,776 |
| 89. | Lepanto | 23.2% | 11.3%(+11.9)#89 | 10.9%(+12.3)#3,882 |
| 90. | Ola | 23.0% | 11.3%(+11.7)#90 | 10.9%(+12.1)#3,932 |
| 91. | Hamburg | 22.9% | 11.3%(+11.6)#91 | 10.9%(+12.0)#3,966 |
| 92. | Kensett | 22.6% | 11.3%(+11.3)#92 | 10.9%(+11.7)#4,024 |
| 93. | Calico Rock | 22.5% | 11.3%(+11.2)#93 | 10.9%(+11.6)#4,048 |
| 94. | Des Arc | 22.4% | 11.3%(+11.1)#94 | 10.9%(+11.5)#4,074 |
| 95. | Berryville | 22.2% | 11.3%(+10.9)#95 | 10.9%(+11.3)#4,116 |
| 96. | Jasper | 22.2% | 11.3%(+10.9)#96 | 10.9%(+11.3)#4,148 |
| 97. | Delight | 22.2% | 11.3%(+10.9)#97 | 10.9%(+11.3)#4,163 |
| 98. | Gilmore | 22.2% | 11.3%(+10.9)#98 | 10.9%(+11.3)#4,168 |
| 99. | Austin | 21.7% | 11.3%(+10.4)#99 | 10.9%(+10.8)#4,249 |
| 100. | Mount Ida | 21.7% | 11.3%(+10.4)#100 | 10.9%(+10.8)#4,255 |
Common Questions
What are the Top 10 Cities with the Highest Unemployment Rate Amomg Youth Under the Age of 25 in Arkansas?
Top 10 Cities with the Highest Unemployment Rate Amomg Youth Under the Age of 25 in Arkansas are:
#1
100.0%
#2
100.0%
#3
100.0%
#4
100.0%
#5
100.0%
#6
100.0%
#7
100.0%
#8
100.0%
#9
100.0%
#10
100.0%
What city has the Highest Unemployment Rate Amomg Youth Under the Age of 25 in Arkansas?
Eudora has the Highest Unemployment Rate Amomg Youth Under the Age of 25 in Arkansas with 100.0%.
What is the Unemployment Rate Amomg Youth Under the Age of 25 in the State of Arkansas?
Unemployment Rate Amomg Youth Under the Age of 25 in Arkansas is 11.3%.
What is the Unemployment Rate Amomg Youth Under the Age of 25 in the United States?
Unemployment Rate Amomg Youth Under the Age of 25 in the United States is 10.9%.