Hasley Canyon, CA Map & Demographics
Hasley Canyon Map
Hasley Canyon Overview
$44,817
PER CAPITA INCOME
$134,375
AVG FAMILY INCOME
$132,875
AVG HOUSEHOLD INCOME
37.4%
WAGE / INCOME GAP [ % ]
62.6¢/ $1
WAGE / INCOME GAP [ $ ]
0.42
INEQUALITY / GINI INDEX
1,236
TOTAL POPULATION
741
MALE POPULATION
495
FEMALE POPULATION
149.70
MALES / 100 FEMALES
66.80
FEMALES / 100 MALES
40.7
MEDIAN AGE
3.6
AVG FAMILY SIZE
3.4
AVG HOUSEHOLD SIZE
579
LABOR FORCE [ PEOPLE ]
65.3%
PERCENT IN LABOR FORCE
17.6%
UNEMPLOYMENT RATE
Income in Hasley Canyon
Income Overview in Hasley Canyon
Per Capita Income in Hasley Canyon is $44,817, while median incomes of families and households are $134,375 and $132,875 respectively.
| Characteristic | Number | Measure |
| Per Capita Income | 1,236 | $44,817 |
| Median Family Income | 329 | $134,375 |
| Mean Family Income | 329 | $153,770 |
| Median Household Income | 359 | $132,875 |
| Mean Household Income | 359 | $151,103 |
| Income Deficit | 329 | $0 |
| Wage / Income Gap (%) | 1,236 | 37.39% |
| Wage / Income Gap ($) | 1,236 | 62.61¢ per $1 |
| Gini / Inequality Index | 1,236 | 0.42 |
Earnings by Sex in Hasley Canyon
Average Earnings in Hasley Canyon are $58,500, $71,429 for men and $44,722 for women, a difference of 37.4%.
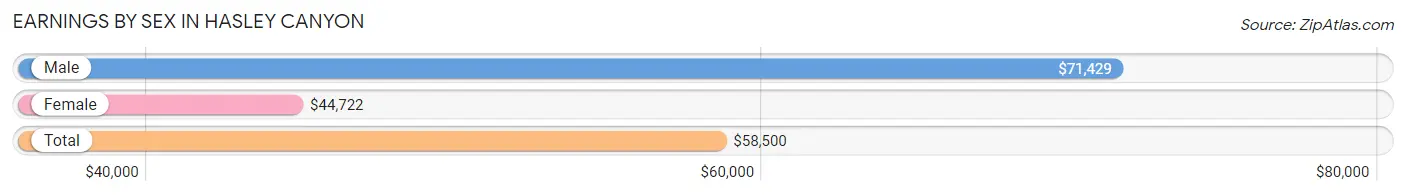
| Sex | Number | Average Earnings |
| Male | 320 (63.0%) | $71,429 |
| Female | 188 (37.0%) | $44,722 |
| Total | 508 (100.0%) | $58,500 |
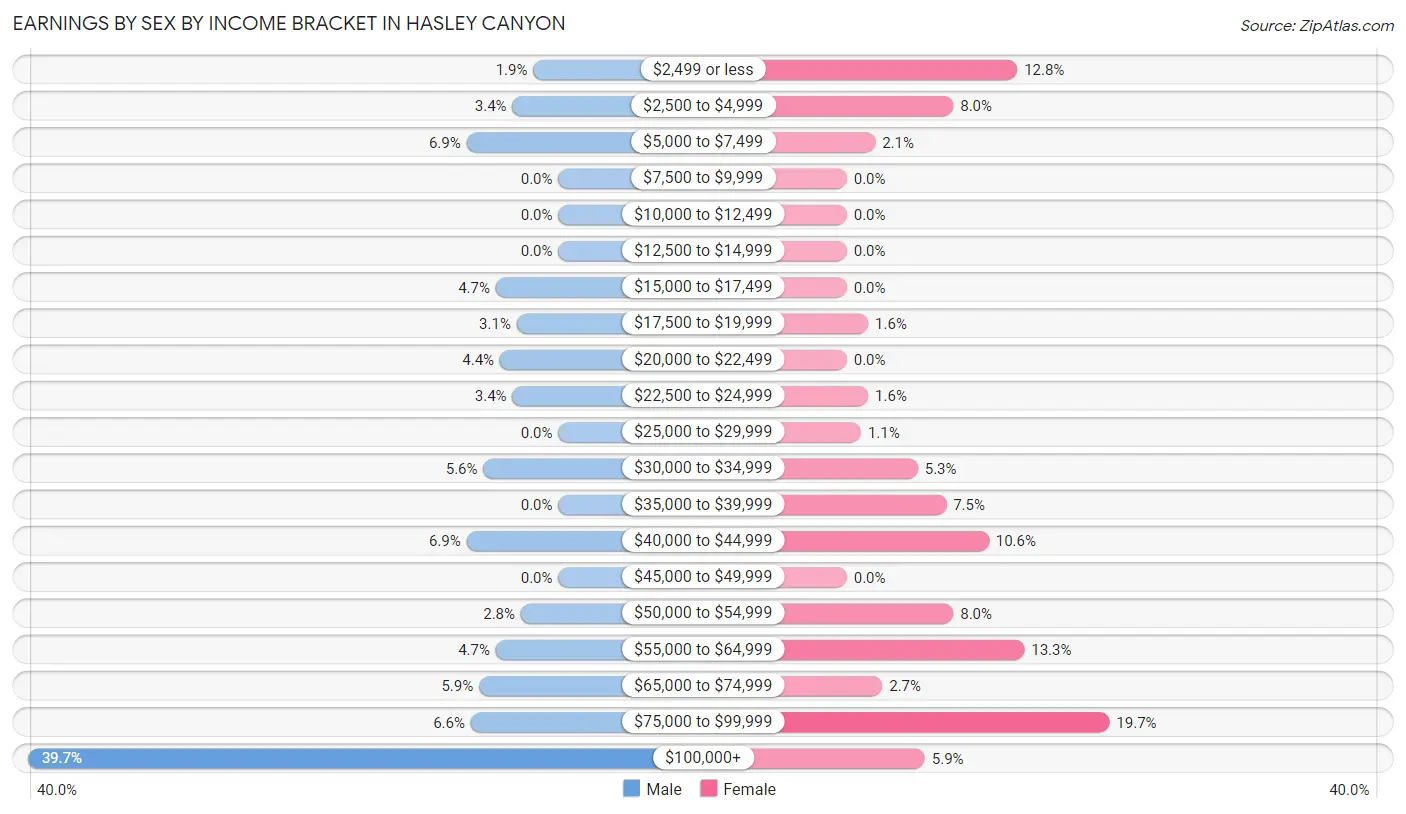
Earnings by Sex by Income Bracket in Hasley Canyon
The most common earnings brackets in Hasley Canyon are $100,000+ for men (127 | 39.7%) and $75,000 to $99,999 for women (37 | 19.7%).
| Income | Male | Female |
| $2,499 or less | 6 (1.9%) | 24 (12.8%) |
| $2,500 to $4,999 | 11 (3.4%) | 15 (8.0%) |
| $5,000 to $7,499 | 22 (6.9%) | 4 (2.1%) |
| $7,500 to $9,999 | 0 (0.0%) | 0 (0.0%) |
| $10,000 to $12,499 | 0 (0.0%) | 0 (0.0%) |
| $12,500 to $14,999 | 0 (0.0%) | 0 (0.0%) |
| $15,000 to $17,499 | 15 (4.7%) | 0 (0.0%) |
| $17,500 to $19,999 | 10 (3.1%) | 3 (1.6%) |
| $20,000 to $22,499 | 14 (4.4%) | 0 (0.0%) |
| $22,500 to $24,999 | 11 (3.4%) | 3 (1.6%) |
| $25,000 to $29,999 | 0 (0.0%) | 2 (1.1%) |
| $30,000 to $34,999 | 18 (5.6%) | 10 (5.3%) |
| $35,000 to $39,999 | 0 (0.0%) | 14 (7.4%) |
| $40,000 to $44,999 | 22 (6.9%) | 20 (10.6%) |
| $45,000 to $49,999 | 0 (0.0%) | 0 (0.0%) |
| $50,000 to $54,999 | 9 (2.8%) | 15 (8.0%) |
| $55,000 to $64,999 | 15 (4.7%) | 25 (13.3%) |
| $65,000 to $74,999 | 19 (5.9%) | 5 (2.7%) |
| $75,000 to $99,999 | 21 (6.6%) | 37 (19.7%) |
| $100,000+ | 127 (39.7%) | 11 (5.9%) |
| Total | 320 (100.0%) | 188 (100.0%) |
Earnings by Sex by Educational Attainment in Hasley Canyon
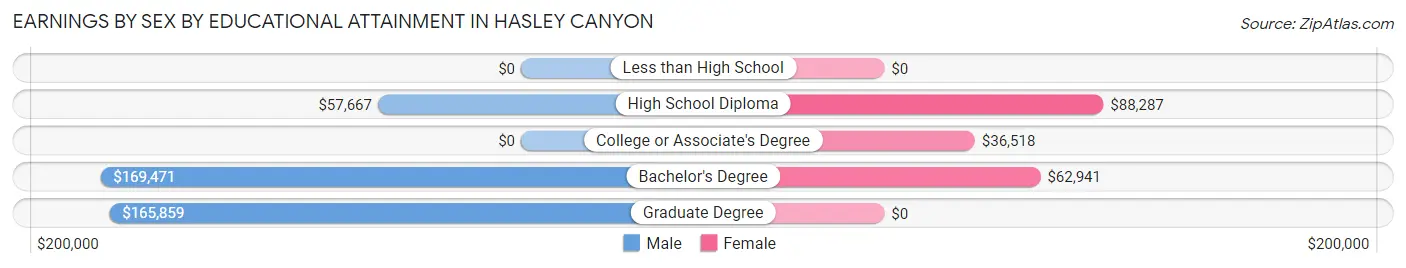
| Educational Attainment | Male Income | Female Income |
| Less than High School | - | - |
| High School Diploma | $57,667 | $88,287 |
| College or Associate's Degree | - | - |
| Bachelor's Degree | $169,471 | $62,941 |
| Graduate Degree | $165,859 | $0 |
| Total | - | - |
Family Income in Hasley Canyon
Family Income Brackets in Hasley Canyon
According to the Hasley Canyon family income data, there are 95 families falling into the $200,000+ income range, which is the most common income bracket and makes up 28.9% of all families.
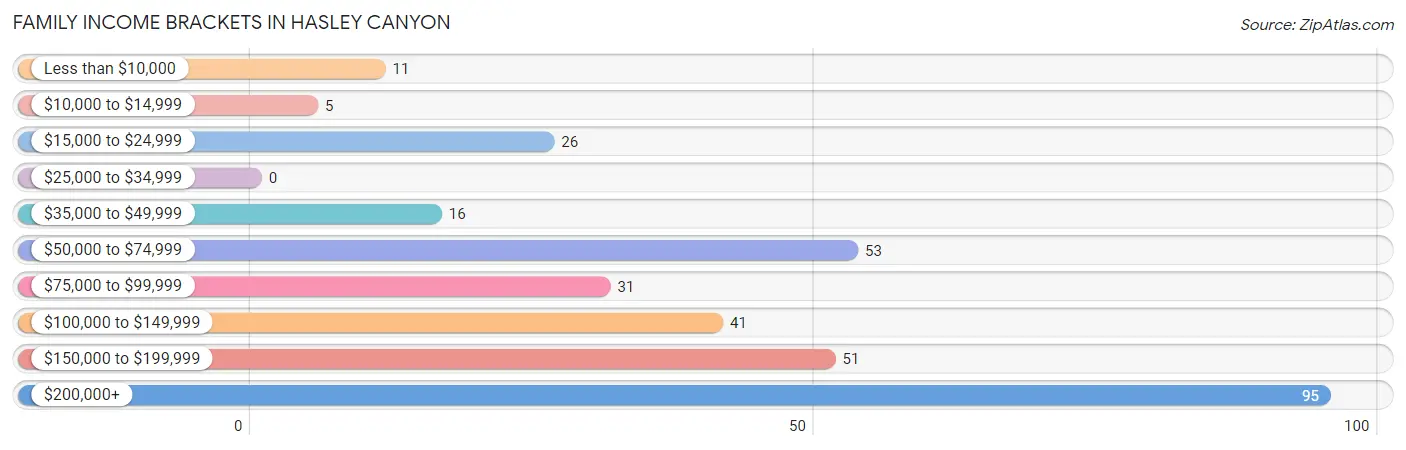
| Income Bracket | # Families | % Families |
| Less than $10,000 | 11 | 3.3% |
| $10,000 to $14,999 | 5 | 1.5% |
| $15,000 to $24,999 | 26 | 7.9% |
| $25,000 to $34,999 | 0 | 0.0% |
| $35,000 to $49,999 | 16 | 4.9% |
| $50,000 to $74,999 | 53 | 16.1% |
| $75,000 to $99,999 | 31 | 9.4% |
| $100,000 to $149,999 | 41 | 12.5% |
| $150,000 to $199,999 | 51 | 15.5% |
| $200,000+ | 95 | 28.9% |
Family Income by Famaliy Size in Hasley Canyon
2-person families (163 | 49.5%) account for the highest median family income in Hasley Canyon with $168,702 per family, while 2-person families (163 | 49.5%) have the highest median income of $84,351 per family member.
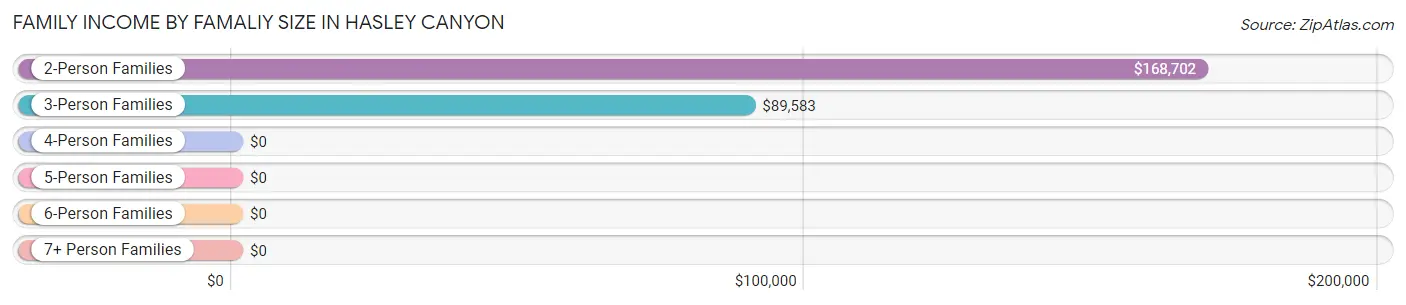
| Income Bracket | # Families | Median Income |
| 2-Person Families | 163 (49.5%) | $168,702 |
| 3-Person Families | 50 (15.2%) | $89,583 |
| 4-Person Families | 20 (6.1%) | $0 |
| 5-Person Families | 20 (6.1%) | $0 |
| 6-Person Families | 64 (19.5%) | $0 |
| 7+ Person Families | 12 (3.6%) | $0 |
| Total | 329 (100.0%) | $134,375 |
Family Income by Number of Earners in Hasley Canyon
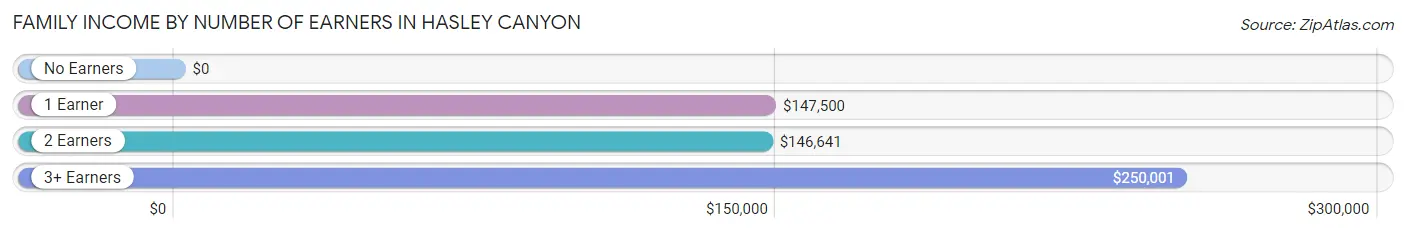
| Number of Earners | # Families | Median Income |
| No Earners | 81 (24.6%) | $0 |
| 1 Earner | 82 (24.9%) | $147,500 |
| 2 Earners | 133 (40.4%) | $146,641 |
| 3+ Earners | 33 (10.0%) | $250,001 |
| Total | 329 (100.0%) | $134,375 |
Household Income in Hasley Canyon
Household Income Brackets in Hasley Canyon
With 98 households falling in the category, the $200,000+ income range is the most frequent in Hasley Canyon, accounting for 27.3% of all households.
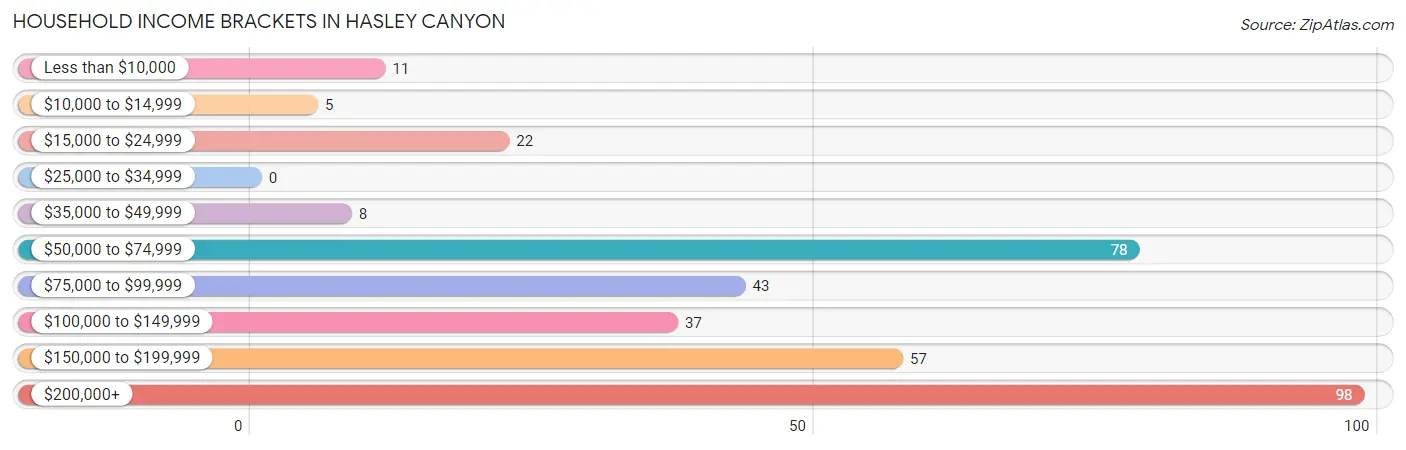
| Income Bracket | # Households | % Households |
| Less than $10,000 | 11 | 3.1% |
| $10,000 to $14,999 | 5 | 1.4% |
| $15,000 to $24,999 | 22 | 6.1% |
| $25,000 to $34,999 | 0 | 0.0% |
| $35,000 to $49,999 | 8 | 2.2% |
| $50,000 to $74,999 | 78 | 21.7% |
| $75,000 to $99,999 | 43 | 12.0% |
| $100,000 to $149,999 | 37 | 10.3% |
| $150,000 to $199,999 | 57 | 15.9% |
| $200,000+ | 98 | 27.3% |
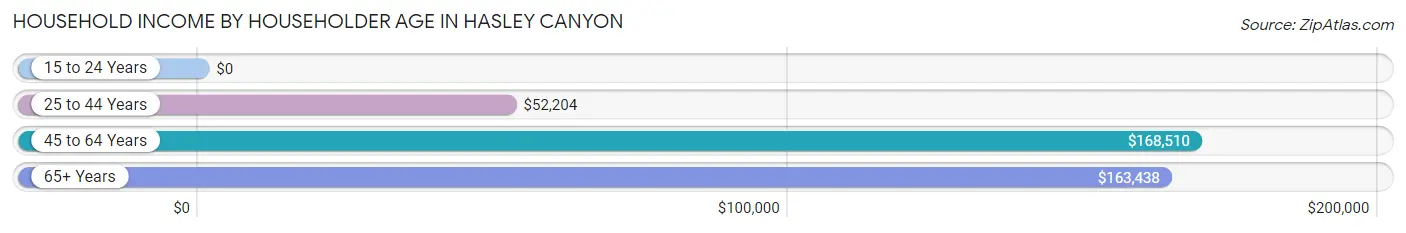
Household Income by Householder Age in Hasley Canyon
The median household income in Hasley Canyon is $132,875, with the highest median household income of $168,510 found in the 45 to 64 years age bracket for the primary householder. A total of 121 households (33.7%) fall into this category.
| Income Bracket | # Households | Median Income |
| 15 to 24 Years | 0 (0.0%) | $0 |
| 25 to 44 Years | 109 (30.4%) | $52,204 |
| 45 to 64 Years | 121 (33.7%) | $168,510 |
| 65+ Years | 129 (35.9%) | $163,438 |
| Total | 359 (100.0%) | $132,875 |
Poverty in Hasley Canyon
Income Below Poverty by Sex and Age in Hasley Canyon
With 7.8% poverty level for males and 11.5% for females among the residents of Hasley Canyon, 5 year old males and 6 to 11 year old females are the most vulnerable to poverty, with 13 males (100.0%) and 25 females (67.6%) in their respective age groups living below the poverty level.
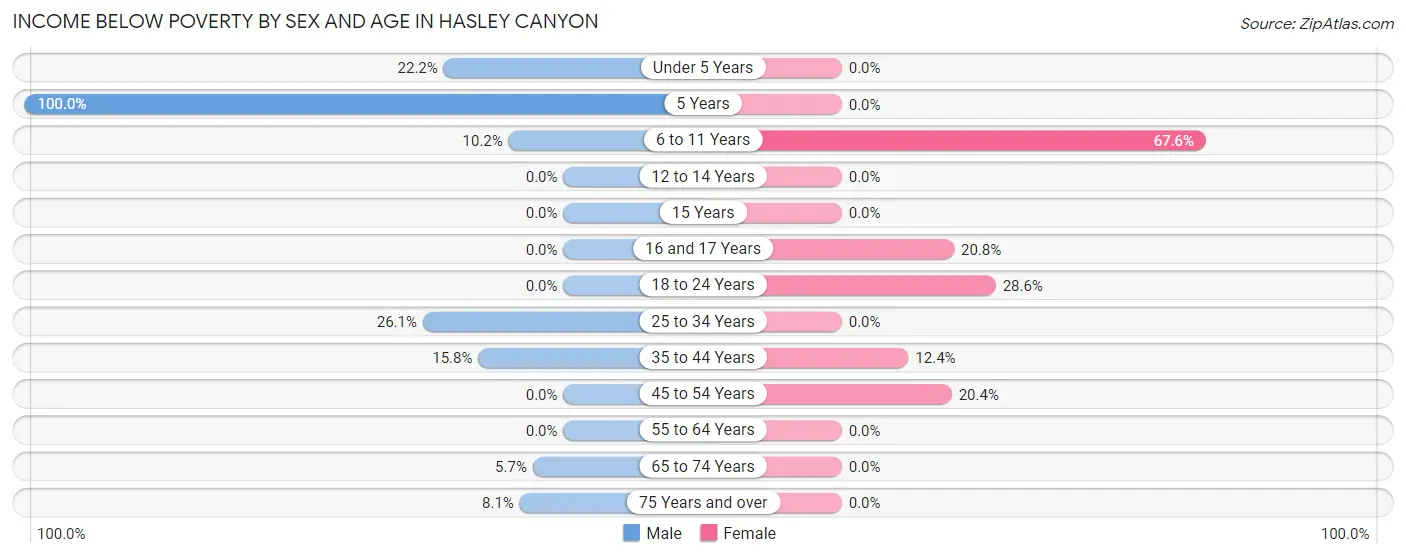
| Age Bracket | Male | Female |
| Under 5 Years | 6 (22.2%) | 0 (0.0%) |
| 5 Years | 13 (100.0%) | 0 (0.0%) |
| 6 to 11 Years | 13 (10.2%) | 25 (67.6%) |
| 12 to 14 Years | 0 (0.0%) | 0 (0.0%) |
| 15 Years | 0 (0.0%) | 0 (0.0%) |
| 16 and 17 Years | 0 (0.0%) | 5 (20.8%) |
| 18 to 24 Years | 0 (0.0%) | 6 (28.6%) |
| 25 to 34 Years | 6 (26.1%) | 0 (0.0%) |
| 35 to 44 Years | 12 (15.8%) | 11 (12.4%) |
| 45 to 54 Years | 0 (0.0%) | 10 (20.4%) |
| 55 to 64 Years | 0 (0.0%) | 0 (0.0%) |
| 65 to 74 Years | 5 (5.7%) | 0 (0.0%) |
| 75 Years and over | 3 (8.1%) | 0 (0.0%) |
| Total | 58 (7.8%) | 57 (11.5%) |
Income Above Poverty by Sex and Age in Hasley Canyon
According to the poverty statistics in Hasley Canyon, males aged 12 to 14 years and females aged 12 to 14 years are the age groups that are most secure financially, with 100.0% of males and 100.0% of females in these age groups living above the poverty line.
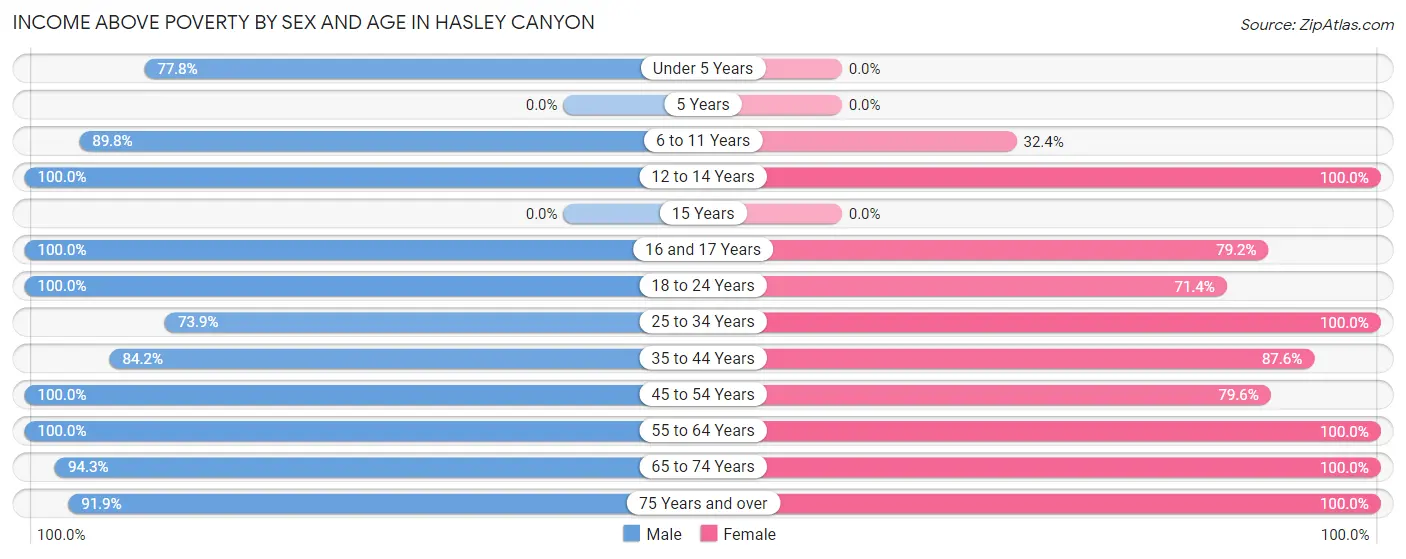
| Age Bracket | Male | Female |
| Under 5 Years | 21 (77.8%) | 0 (0.0%) |
| 5 Years | 0 (0.0%) | 0 (0.0%) |
| 6 to 11 Years | 115 (89.8%) | 12 (32.4%) |
| 12 to 14 Years | 59 (100.0%) | 85 (100.0%) |
| 15 Years | 0 (0.0%) | 0 (0.0%) |
| 16 and 17 Years | 66 (100.0%) | 19 (79.2%) |
| 18 to 24 Years | 53 (100.0%) | 15 (71.4%) |
| 25 to 34 Years | 17 (73.9%) | 28 (100.0%) |
| 35 to 44 Years | 64 (84.2%) | 78 (87.6%) |
| 45 to 54 Years | 102 (100.0%) | 39 (79.6%) |
| 55 to 64 Years | 69 (100.0%) | 55 (100.0%) |
| 65 to 74 Years | 83 (94.3%) | 91 (100.0%) |
| 75 Years and over | 34 (91.9%) | 16 (100.0%) |
| Total | 683 (92.2%) | 438 (88.5%) |
Income Below Poverty Among Married-Couple Families in Hasley Canyon
The poverty statistics for married-couple families in Hasley Canyon show that 9.2% or 22 of the total 240 families live below the poverty line. Families with 1 or 2 children have the highest poverty rate of 35.5%, comprising of 11 families. On the other hand, families with no children have the lowest poverty rate of 0.0%, which includes 0 families.
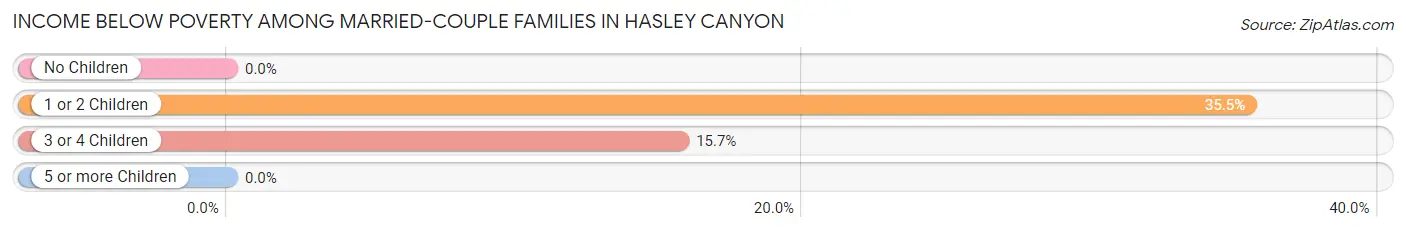
| Children | Above Poverty | Below Poverty |
| No Children | 139 (100.0%) | 0 (0.0%) |
| 1 or 2 Children | 20 (64.5%) | 11 (35.5%) |
| 3 or 4 Children | 59 (84.3%) | 11 (15.7%) |
| 5 or more Children | 0 (0.0%) | 0 (0.0%) |
| Total | 218 (90.8%) | 22 (9.2%) |
Income Below Poverty Among Single-Parent Households in Hasley Canyon
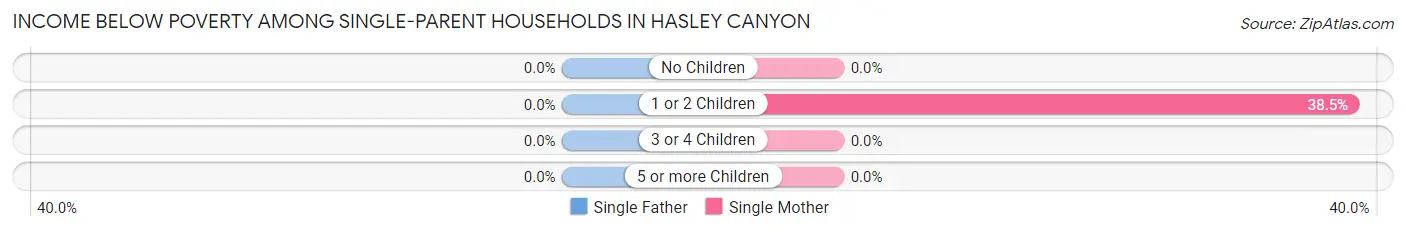
| Children | Single Father | Single Mother |
| No Children | 0 (0.0%) | 0 (0.0%) |
| 1 or 2 Children | 0 (0.0%) | 5 (38.5%) |
| 3 or 4 Children | 0 (0.0%) | 0 (0.0%) |
| 5 or more Children | 0 (0.0%) | 0 (0.0%) |
| Total | 0 (0.0%) | 5 (21.7%) |
Income Below Poverty Among Married-Couple vs Single-Parent Households in Hasley Canyon
The poverty data for Hasley Canyon shows that 22 of the married-couple family households (9.2%) and 5 of the single-parent households (5.6%) are living below the poverty level. Within the married-couple family households, those with 1 or 2 children have the highest poverty rate, with 11 households (35.5%) falling below the poverty line. Among the single-parent households, those with 1 or 2 children have the highest poverty rate, with 5 household (10.0%) living below poverty.
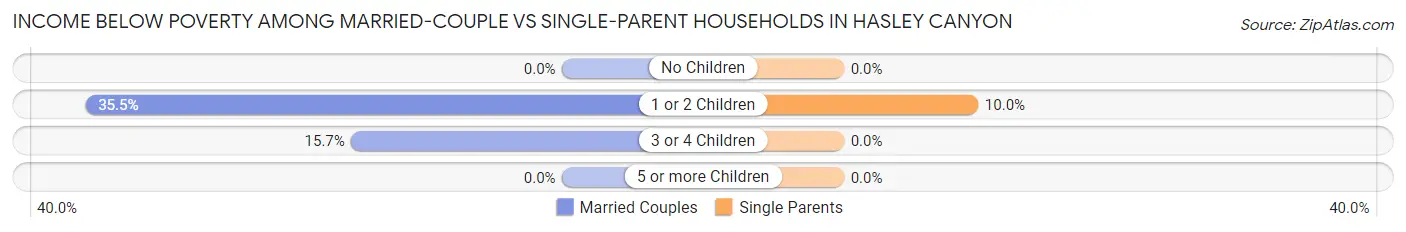
| Children | Married-Couple Families | Single-Parent Households |
| No Children | 0 (0.0%) | 0 (0.0%) |
| 1 or 2 Children | 11 (35.5%) | 5 (10.0%) |
| 3 or 4 Children | 11 (15.7%) | 0 (0.0%) |
| 5 or more Children | 0 (0.0%) | 0 (0.0%) |
| Total | 22 (9.2%) | 5 (5.6%) |
Race in Hasley Canyon
The most populous races in Hasley Canyon are White / Caucasian (880 | 71.2%), Hispanic or Latino (269 | 21.8%), and Some other Race (143 | 11.6%).
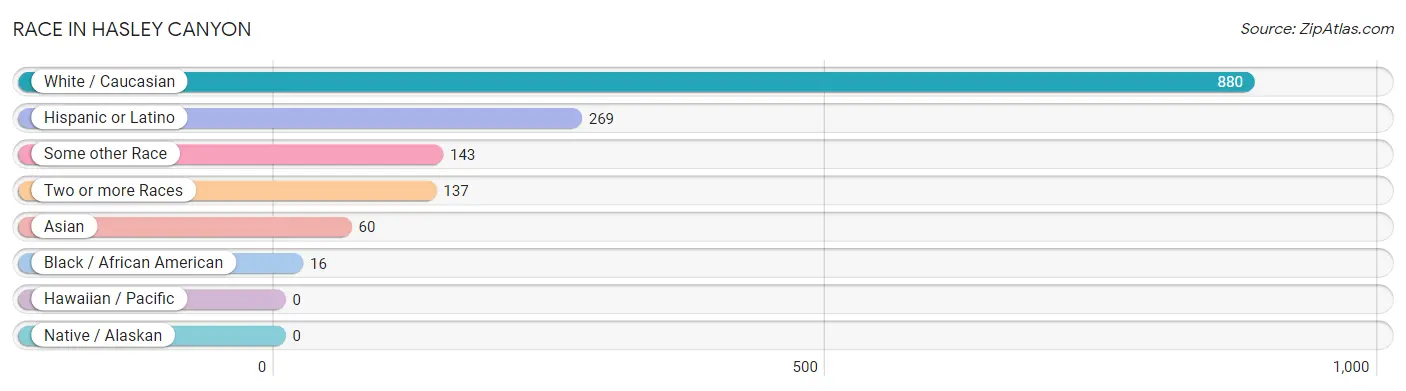
| Race | # Population | % Population |
| Asian | 60 | 4.9% |
| Black / African American | 16 | 1.3% |
| Hawaiian / Pacific | 0 | 0.0% |
| Hispanic or Latino | 269 | 21.8% |
| Native / Alaskan | 0 | 0.0% |
| White / Caucasian | 880 | 71.2% |
| Two or more Races | 137 | 11.1% |
| Some other Race | 143 | 11.6% |
| Total | 1,236 | 100.0% |
Ancestry in Hasley Canyon
The most populous ancestries reported in Hasley Canyon are European (247 | 20.0%), Mexican (223 | 18.0%), English (139 | 11.3%), Irish (118 | 9.6%), and German (105 | 8.5%), together accounting for 67.3% of all Hasley Canyon residents.
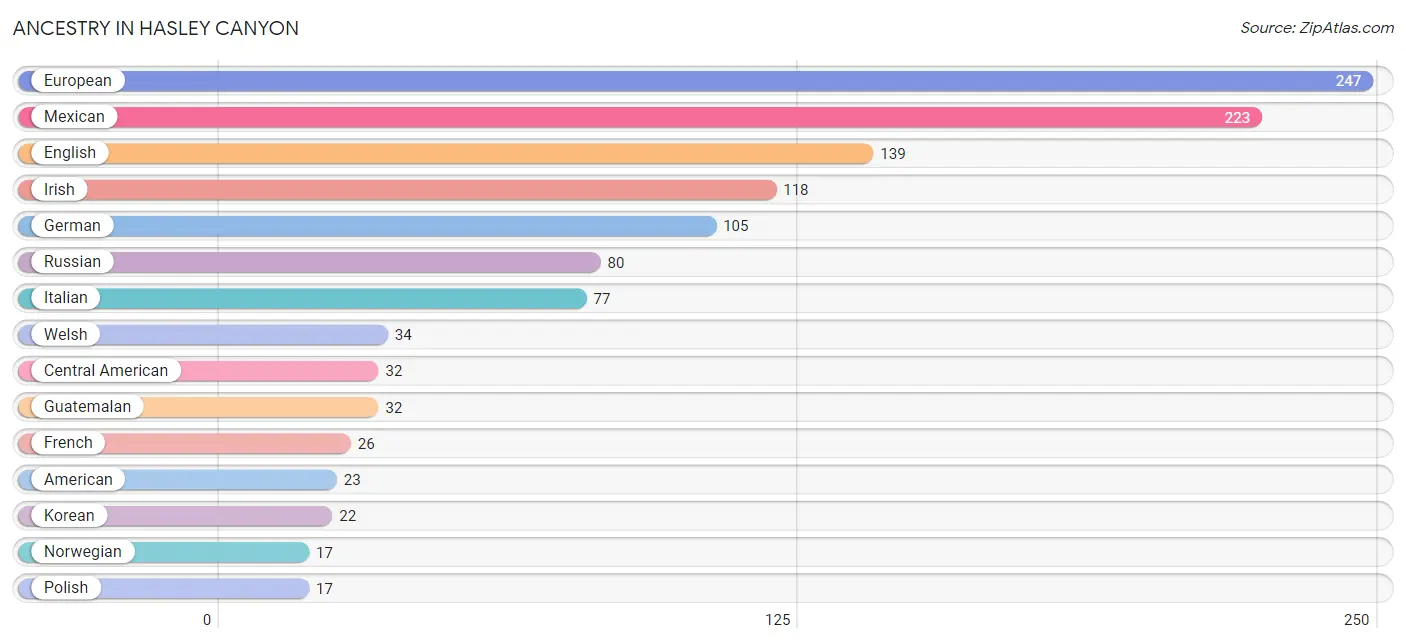
| Ancestry | # Population | % Population |
| American | 23 | 1.9% |
| Arab | 14 | 1.1% |
| Argentinean | 3 | 0.2% |
| Bhutanese | 5 | 0.4% |
| British | 7 | 0.6% |
| Central American | 32 | 2.6% |
| Danish | 3 | 0.2% |
| Dutch | 3 | 0.2% |
| English | 139 | 11.3% |
| European | 247 | 20.0% |
| French | 26 | 2.1% |
| German | 105 | 8.5% |
| Greek | 9 | 0.7% |
| Guatemalan | 32 | 2.6% |
| Hungarian | 7 | 0.6% |
| Iraqi | 6 | 0.5% |
| Irish | 118 | 9.6% |
| Italian | 77 | 6.2% |
| Korean | 22 | 1.8% |
| Lebanese | 8 | 0.6% |
| Mexican | 223 | 18.0% |
| Norwegian | 17 | 1.4% |
| Peruvian | 5 | 0.4% |
| Polish | 17 | 1.4% |
| Russian | 80 | 6.5% |
| Scandinavian | 2 | 0.2% |
| Scottish | 7 | 0.6% |
| South American | 8 | 0.6% |
| Spanish | 6 | 0.5% |
| Swedish | 4 | 0.3% |
| Welsh | 34 | 2.8% | View All 31 Rows |
Immigrants in Hasley Canyon
The most numerous immigrant groups reported in Hasley Canyon came from Latin America (74 | 6.0%), Central America (66 | 5.3%), Mexico (55 | 4.4%), Guatemala (11 | 0.9%), and South America (8 | 0.6%), together accounting for 17.3% of all Hasley Canyon residents.
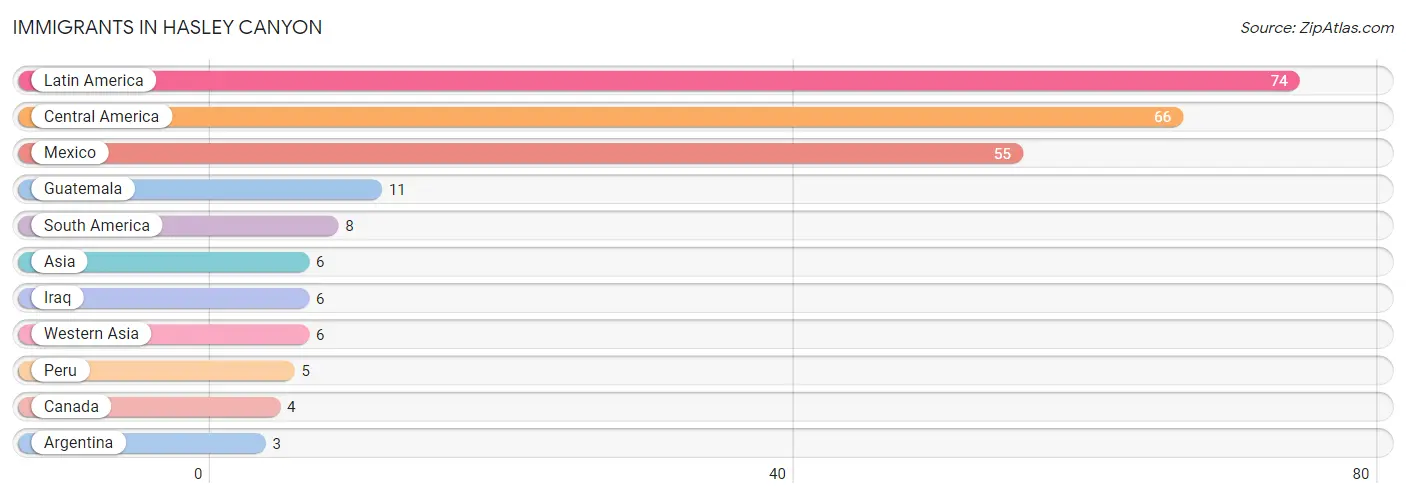
| Immigration Origin | # Population | % Population |
| Argentina | 3 | 0.2% |
| Asia | 6 | 0.5% |
| Canada | 4 | 0.3% |
| Central America | 66 | 5.3% |
| Guatemala | 11 | 0.9% |
| Iraq | 6 | 0.5% |
| Latin America | 74 | 6.0% |
| Mexico | 55 | 4.4% |
| Peru | 5 | 0.4% |
| South America | 8 | 0.6% |
| Western Asia | 6 | 0.5% | View All 11 Rows |
Sex and Age in Hasley Canyon
Sex and Age in Hasley Canyon
The most populous age groups in Hasley Canyon are 5 to 9 Years (141 | 19.0%) for men and 10 to 14 Years (112 | 22.6%) for women.
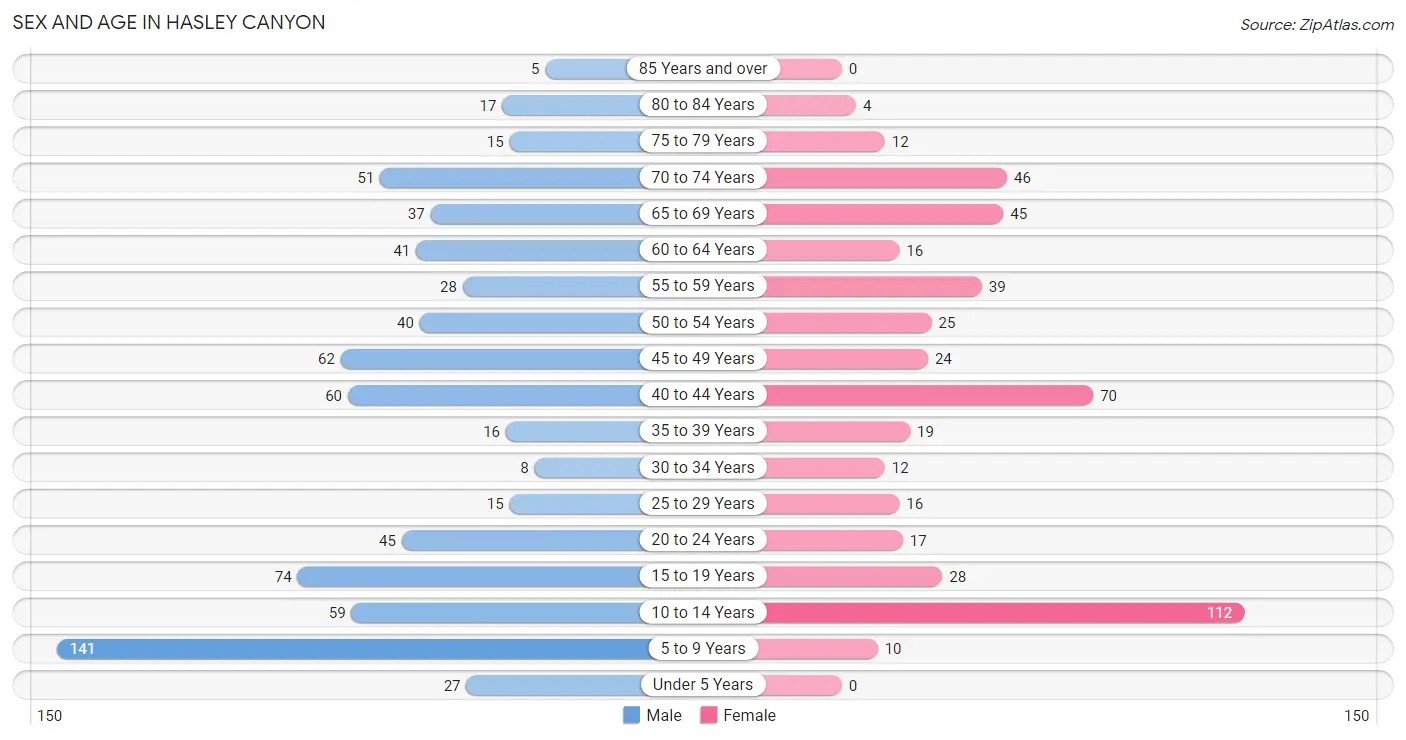
| Age Bracket | Male | Female |
| Under 5 Years | 27 (3.6%) | 0 (0.0%) |
| 5 to 9 Years | 141 (19.0%) | 10 (2.0%) |
| 10 to 14 Years | 59 (8.0%) | 112 (22.6%) |
| 15 to 19 Years | 74 (10.0%) | 28 (5.7%) |
| 20 to 24 Years | 45 (6.1%) | 17 (3.4%) |
| 25 to 29 Years | 15 (2.0%) | 16 (3.2%) |
| 30 to 34 Years | 8 (1.1%) | 12 (2.4%) |
| 35 to 39 Years | 16 (2.2%) | 19 (3.8%) |
| 40 to 44 Years | 60 (8.1%) | 70 (14.1%) |
| 45 to 49 Years | 62 (8.4%) | 24 (4.9%) |
| 50 to 54 Years | 40 (5.4%) | 25 (5.1%) |
| 55 to 59 Years | 28 (3.8%) | 39 (7.9%) |
| 60 to 64 Years | 41 (5.5%) | 16 (3.2%) |
| 65 to 69 Years | 37 (5.0%) | 45 (9.1%) |
| 70 to 74 Years | 51 (6.9%) | 46 (9.3%) |
| 75 to 79 Years | 15 (2.0%) | 12 (2.4%) |
| 80 to 84 Years | 17 (2.3%) | 4 (0.8%) |
| 85 Years and over | 5 (0.7%) | 0 (0.0%) |
| Total | 741 (100.0%) | 495 (100.0%) |
Families and Households in Hasley Canyon
Median Family Size in Hasley Canyon
The median family size in Hasley Canyon is 3.56 persons per family, with single female/mother families (23 | 7.0%) accounting for the largest median family size of 4.43 persons per family. On the other hand, single male/father families (66 | 20.1%) represent the smallest median family size with 2.55 persons per family.
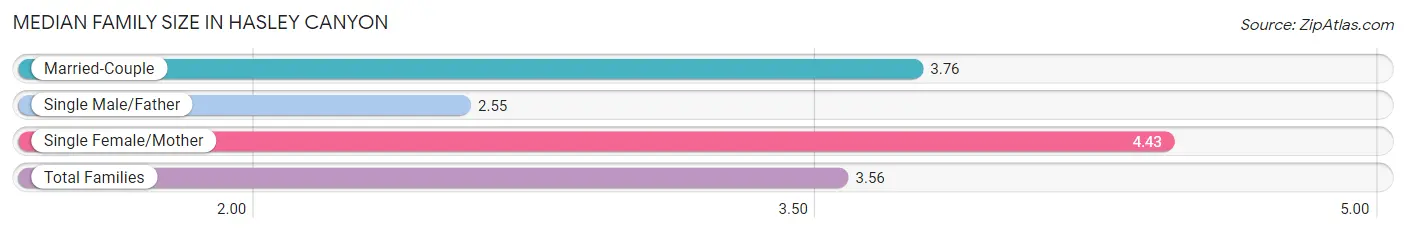
| Family Type | # Families | Family Size |
| Married-Couple | 240 (73.0%) | 3.76 |
| Single Male/Father | 66 (20.1%) | 2.55 |
| Single Female/Mother | 23 (7.0%) | 4.43 |
| Total Families | 329 (100.0%) | 3.56 |
Median Household Size in Hasley Canyon
The median household size in Hasley Canyon is 3.44 persons per household, with single female/mother households (23 | 6.4%) accounting for the largest median household size of 4.57 persons per household. non-family households (30 | 8.4%) represent the smallest median household size with 1.10 persons per household.
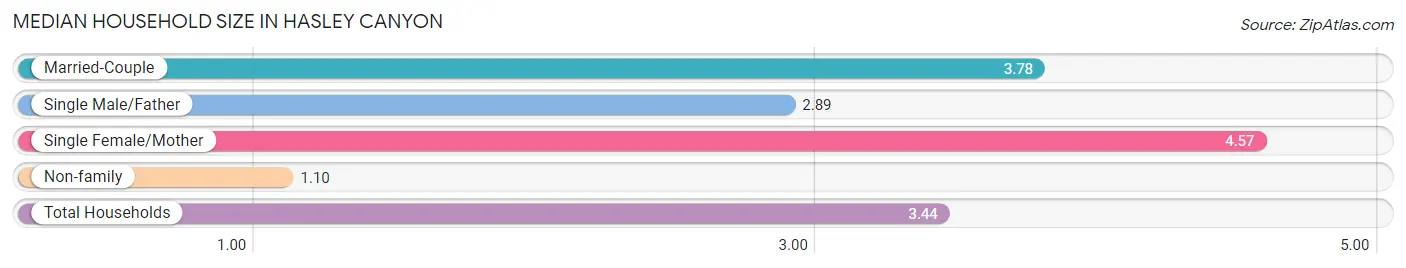
| Household Type | # Households | Household Size |
| Married-Couple | 240 (66.8%) | 3.78 |
| Single Male/Father | 66 (18.4%) | 2.89 |
| Single Female/Mother | 23 (6.4%) | 4.57 |
| Non-family | 30 (8.4%) | 1.10 |
| Total Households | 359 (100.0%) | 3.44 |
Household Size by Marriage Status in Hasley Canyon
Out of a total of 359 households in Hasley Canyon, 329 (91.6%) are family households, while 30 (8.4%) are nonfamily households. The most numerous type of family households are 2-person households, comprising 148, and the most common type of nonfamily households are 1-person households, comprising 27.
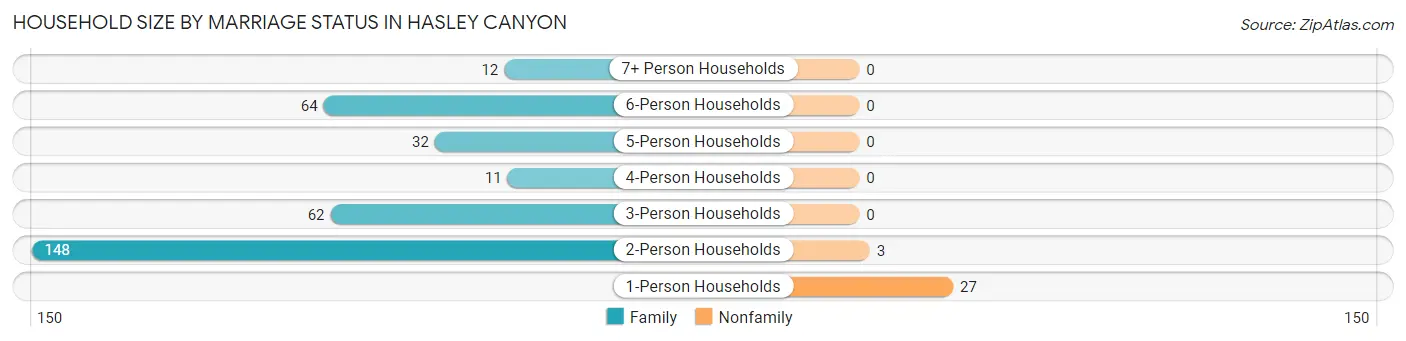
| Household Size | Family Households | Nonfamily Households |
| 1-Person Households | - | 27 (7.5%) |
| 2-Person Households | 148 (41.2%) | 3 (0.8%) |
| 3-Person Households | 62 (17.3%) | 0 (0.0%) |
| 4-Person Households | 11 (3.1%) | 0 (0.0%) |
| 5-Person Households | 32 (8.9%) | 0 (0.0%) |
| 6-Person Households | 64 (17.8%) | 0 (0.0%) |
| 7+ Person Households | 12 (3.3%) | 0 (0.0%) |
| Total | 329 (91.6%) | 30 (8.4%) |
Female Fertility in Hasley Canyon
Fertility by Age in Hasley Canyon
| Age Bracket | Women with Births | Births / 1,000 Women |
| 15 to 19 years | 0 (0.0%) | 0.0 |
| 20 to 34 years | 0 (0.0%) | 0.0 |
| 35 to 50 years | 0 (0.0%) | 0.0 |
| Total | 0 (0.0%) | 0.0 |
Fertility by Age by Marriage Status in Hasley Canyon
| Age Bracket | Married | Unmarried |
| 15 to 19 years | 0 (0.0%) | 0 (0.0%) |
| 20 to 34 years | 0 (0.0%) | 0 (0.0%) |
| 35 to 50 years | 0 (0.0%) | 0 (0.0%) |
| Total | 0 (0.0%) | 0 (0.0%) |
Fertility by Education in Hasley Canyon
| Educational Attainment | Women with Births | Births / 1,000 Women |
| Less than High School | 0 (0.0%) | 0.0 |
| High School Diploma | 0 (0.0%) | 0.0 |
| College or Associate's Degree | 0 (0.0%) | 0.0 |
| Bachelor's Degree | 0 (0.0%) | 0.0 |
| Graduate Degree | 0 (0.0%) | 0.0 |
| Total | 0 (0.0%) | 0.0 |
Fertility by Education by Marriage Status in Hasley Canyon
| Educational Attainment | Married | Unmarried |
| Less than High School | 0 (0.0%) | 0 (0.0%) |
| High School Diploma | 0 (0.0%) | 0 (0.0%) |
| College or Associate's Degree | 0 (0.0%) | 0 (0.0%) |
| Bachelor's Degree | 0 (0.0%) | 0 (0.0%) |
| Graduate Degree | 0 (0.0%) | 0 (0.0%) |
| Total | 0 (0.0%) | 0 (0.0%) |
Employment Characteristics in Hasley Canyon
Employment by Class of Employer in Hasley Canyon
Among the 477 employed individuals in Hasley Canyon, private company employees (335 | 70.2%), local government employees (40 | 8.4%), and self-employed (incorporated) (28 | 5.9%) make up the most common classes of employment.
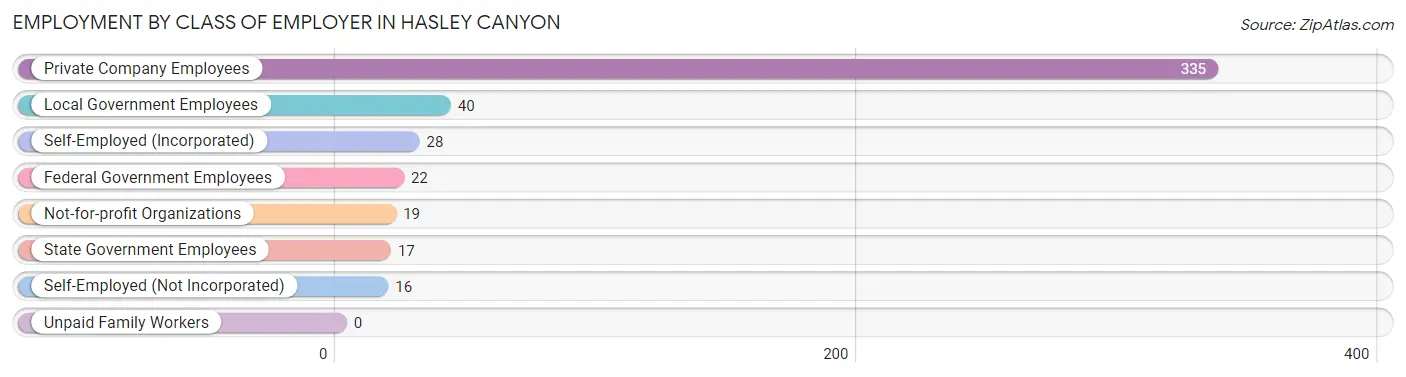
| Employer Class | # Employees | % Employees |
| Private Company Employees | 335 | 70.2% |
| Self-Employed (Incorporated) | 28 | 5.9% |
| Self-Employed (Not Incorporated) | 16 | 3.4% |
| Not-for-profit Organizations | 19 | 4.0% |
| Local Government Employees | 40 | 8.4% |
| State Government Employees | 17 | 3.6% |
| Federal Government Employees | 22 | 4.6% |
| Unpaid Family Workers | 0 | 0.0% |
| Total | 477 | 100.0% |
Employment Status by Age in Hasley Canyon
According to the labor force statistics for Hasley Canyon, out of the total population over 16 years of age (887), 65.3% or 579 individuals are in the labor force, with 17.6% or 102 of them unemployed. The age group with the highest labor force participation rate is 20 to 24 years, with 100.0% or 62 individuals in the labor force. Within the labor force, the 16 to 19 years age range has the highest percentage of unemployed individuals, with 64.1% or 41 of them being unemployed.
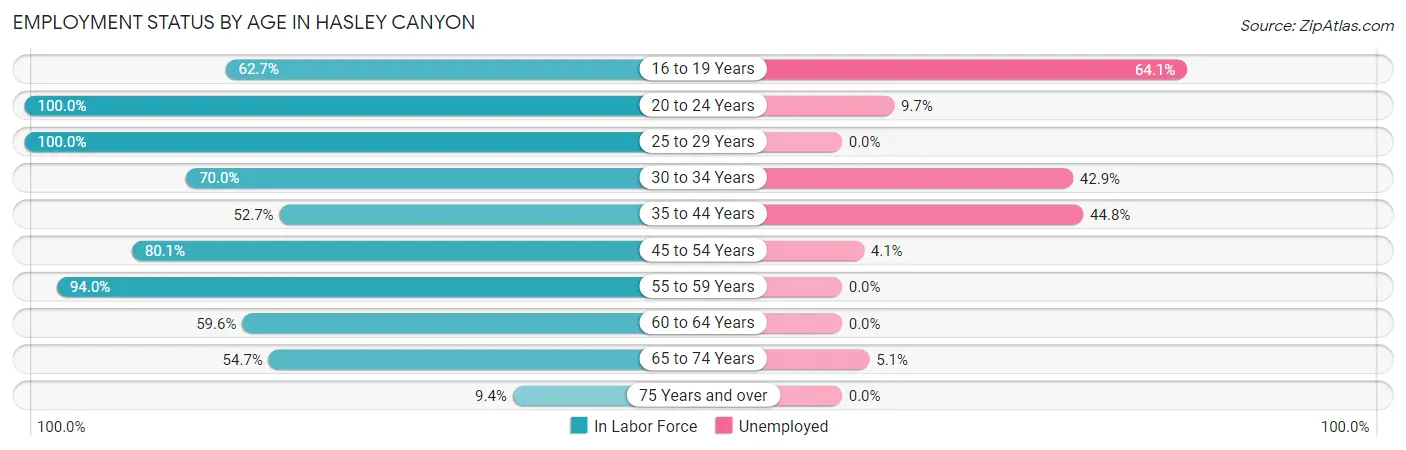
| Age Bracket | In Labor Force | Unemployed |
| 16 to 19 Years | 64 (62.7%) | 41 (64.1%) |
| 20 to 24 Years | 62 (100.0%) | 6 (9.7%) |
| 25 to 29 Years | 31 (100.0%) | 0 (0.0%) |
| 30 to 34 Years | 14 (70.0%) | 6 (42.9%) |
| 35 to 44 Years | 87 (52.7%) | 39 (44.8%) |
| 45 to 54 Years | 121 (80.1%) | 5 (4.1%) |
| 55 to 59 Years | 63 (94.0%) | 0 (0.0%) |
| 60 to 64 Years | 34 (59.6%) | 0 (0.0%) |
| 65 to 74 Years | 98 (54.7%) | 5 (5.1%) |
| 75 Years and over | 5 (9.4%) | 0 (0.0%) |
| Total | 579 (65.3%) | 102 (17.6%) |
Employment Status by Educational Attainment in Hasley Canyon
According to labor force statistics for Hasley Canyon, 71.3% of individuals (350) out of the total population between 25 and 64 years of age (491) are in the labor force, with 14.3% or 50 of them being unemployed. The group with the highest labor force participation rate are those with the educational attainment of college / associate degree, with 80.8% or 84 individuals in the labor force. Within the labor force, individuals with bachelor's degree or higher education have the highest percentage of unemployment, with 22.0% or 39 of them being unemployed.
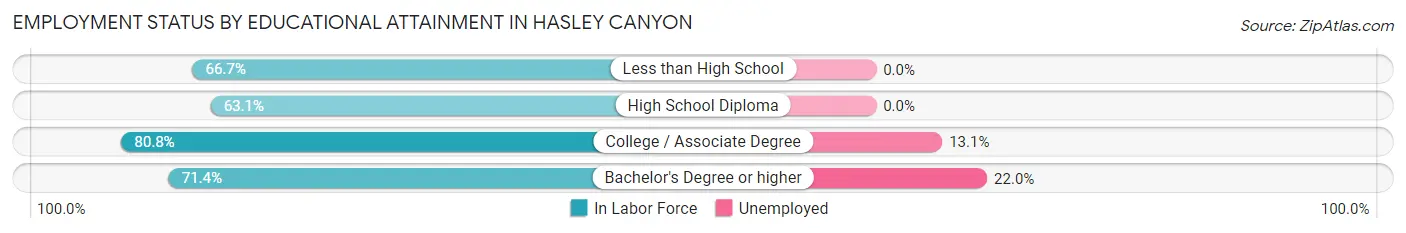
| Educational Attainment | In Labor Force | Unemployed |
| Less than High School | 24 (66.7%) | 0 (0.0%) |
| High School Diploma | 65 (63.1%) | 0 (0.0%) |
| College / Associate Degree | 84 (80.8%) | 14 (13.1%) |
| Bachelor's Degree or higher | 177 (71.4%) | 55 (22.0%) |
| Total | 350 (71.3%) | 70 (14.3%) |
Employment Occupations by Sex in Hasley Canyon
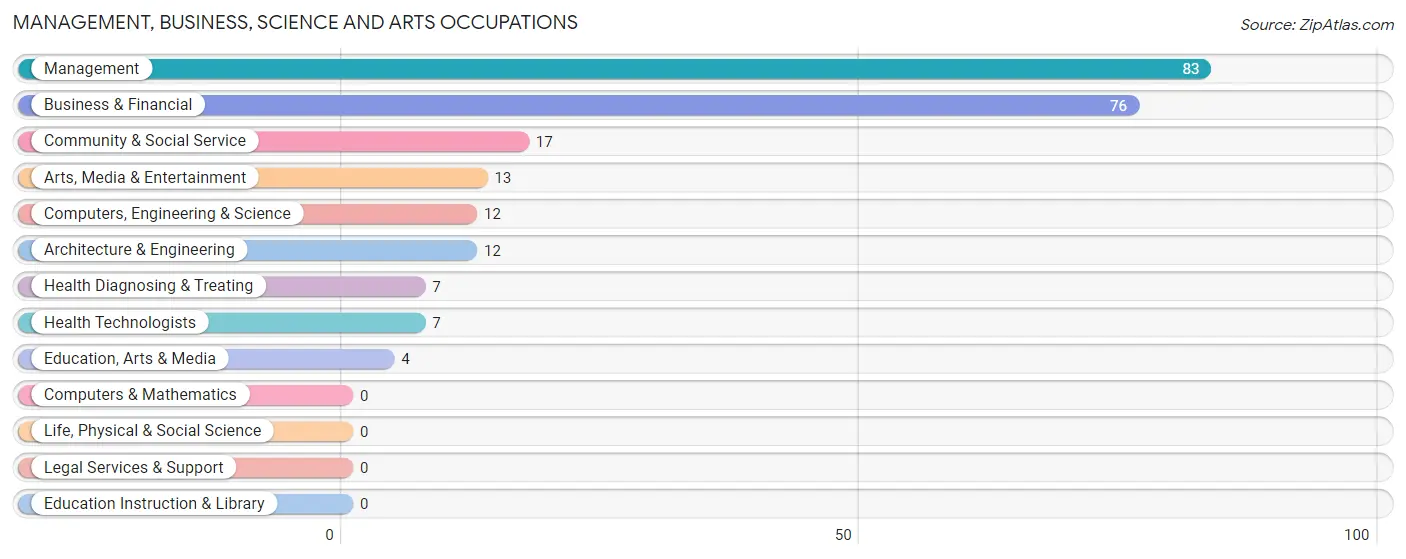
Management, Business, Science and Arts Occupations
The most common Management, Business, Science and Arts occupations in Hasley Canyon are Management (83 | 17.4%), Business & Financial (76 | 15.9%), Community & Social Service (17 | 3.6%), Arts, Media & Entertainment (13 | 2.7%), and Computers, Engineering & Science (12 | 2.5%).
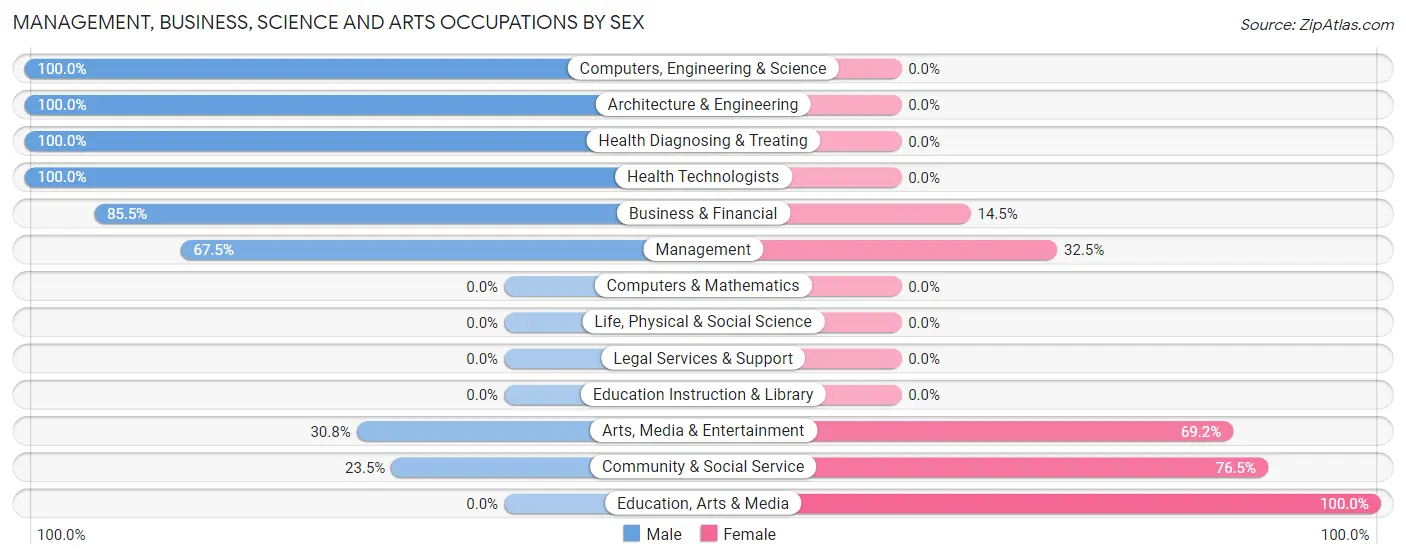
Management, Business, Science and Arts Occupations by Sex
Within the Management, Business, Science and Arts occupations in Hasley Canyon, the most male-oriented occupations are Computers, Engineering & Science (100.0%), Architecture & Engineering (100.0%), and Health Diagnosing & Treating (100.0%), while the most female-oriented occupations are Education, Arts & Media (100.0%), Community & Social Service (76.5%), and Arts, Media & Entertainment (69.2%).
| Occupation | Male | Female |
| Management | 56 (67.5%) | 27 (32.5%) |
| Business & Financial | 65 (85.5%) | 11 (14.5%) |
| Computers, Engineering & Science | 12 (100.0%) | 0 (0.0%) |
| Computers & Mathematics | 0 (0.0%) | 0 (0.0%) |
| Architecture & Engineering | 12 (100.0%) | 0 (0.0%) |
| Life, Physical & Social Science | 0 (0.0%) | 0 (0.0%) |
| Community & Social Service | 4 (23.5%) | 13 (76.5%) |
| Education, Arts & Media | 0 (0.0%) | 4 (100.0%) |
| Legal Services & Support | 0 (0.0%) | 0 (0.0%) |
| Education Instruction & Library | 0 (0.0%) | 0 (0.0%) |
| Arts, Media & Entertainment | 4 (30.8%) | 9 (69.2%) |
| Health Diagnosing & Treating | 7 (100.0%) | 0 (0.0%) |
| Health Technologists | 7 (100.0%) | 0 (0.0%) |
| Total (Category) | 144 (73.9%) | 51 (26.2%) |
| Total (Overall) | 303 (63.5%) | 174 (36.5%) |
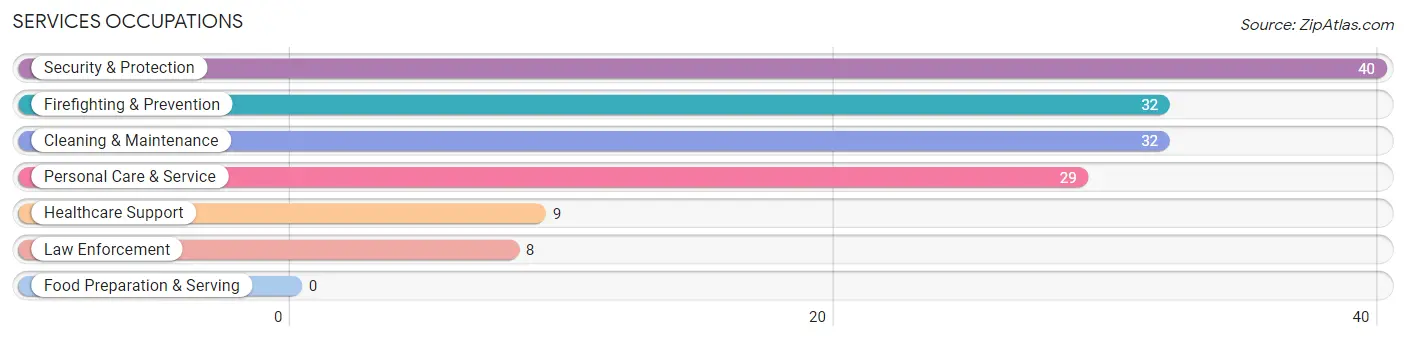
Services Occupations
The most common Services occupations in Hasley Canyon are Security & Protection (40 | 8.4%), Firefighting & Prevention (32 | 6.7%), Cleaning & Maintenance (32 | 6.7%), Personal Care & Service (29 | 6.1%), and Healthcare Support (9 | 1.9%).
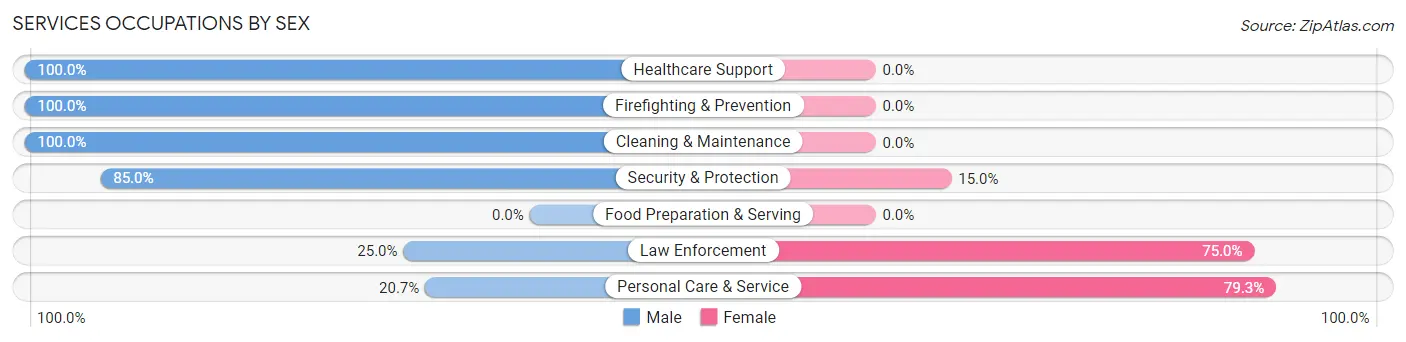
Services Occupations by Sex
Within the Services occupations in Hasley Canyon, the most male-oriented occupations are Healthcare Support (100.0%), Firefighting & Prevention (100.0%), and Cleaning & Maintenance (100.0%), while the most female-oriented occupations are Personal Care & Service (79.3%), Law Enforcement (75.0%), and Security & Protection (15.0%).
| Occupation | Male | Female |
| Healthcare Support | 9 (100.0%) | 0 (0.0%) |
| Security & Protection | 34 (85.0%) | 6 (15.0%) |
| Firefighting & Prevention | 32 (100.0%) | 0 (0.0%) |
| Law Enforcement | 2 (25.0%) | 6 (75.0%) |
| Food Preparation & Serving | 0 (0.0%) | 0 (0.0%) |
| Cleaning & Maintenance | 32 (100.0%) | 0 (0.0%) |
| Personal Care & Service | 6 (20.7%) | 23 (79.3%) |
| Total (Category) | 81 (73.6%) | 29 (26.4%) |
| Total (Overall) | 303 (63.5%) | 174 (36.5%) |
Sales and Office Occupations
The most common Sales and Office occupations in Hasley Canyon are Sales & Related (70 | 14.7%), and Office & Administration (51 | 10.7%).
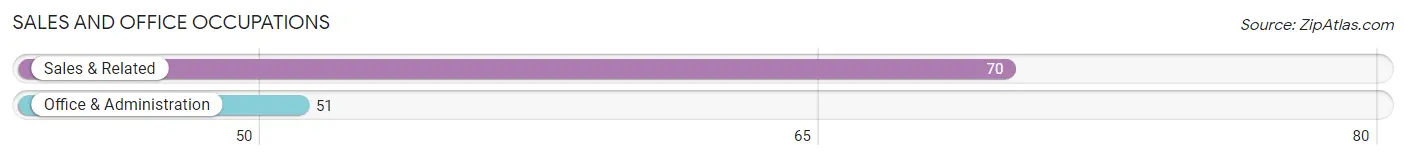
Sales and Office Occupations by Sex
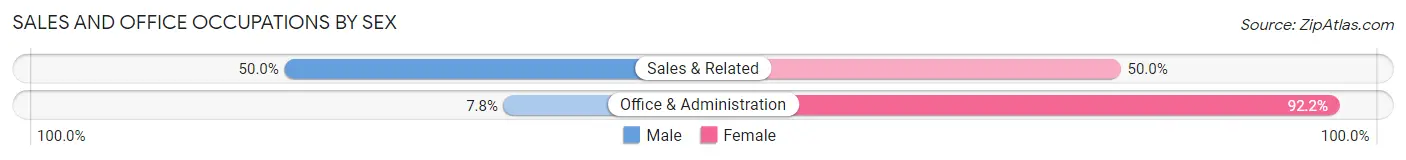
| Occupation | Male | Female |
| Sales & Related | 35 (50.0%) | 35 (50.0%) |
| Office & Administration | 4 (7.8%) | 47 (92.2%) |
| Total (Category) | 39 (32.2%) | 82 (67.8%) |
| Total (Overall) | 303 (63.5%) | 174 (36.5%) |
Natural Resources, Construction and Maintenance Occupations
The most common Natural Resources, Construction and Maintenance occupations in Hasley Canyon are Installation, Maintenance & Repair (14 | 2.9%), and Construction & Extraction (11 | 2.3%).
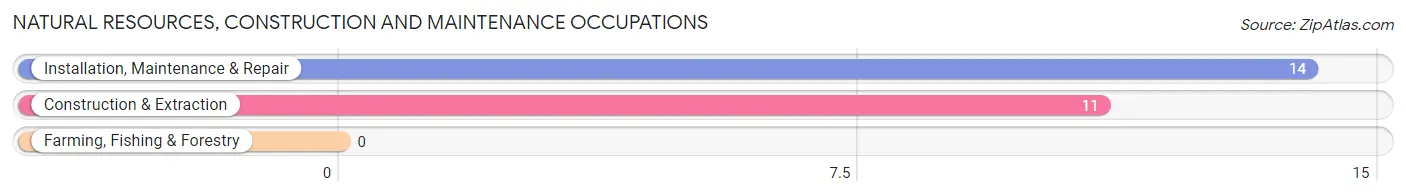
Natural Resources, Construction and Maintenance Occupations by Sex
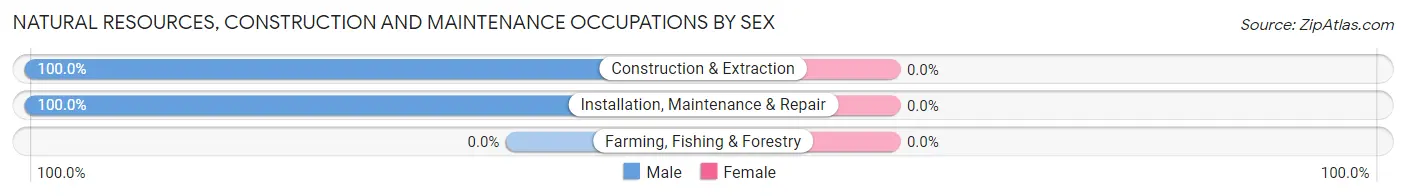
| Occupation | Male | Female |
| Farming, Fishing & Forestry | 0 (0.0%) | 0 (0.0%) |
| Construction & Extraction | 11 (100.0%) | 0 (0.0%) |
| Installation, Maintenance & Repair | 14 (100.0%) | 0 (0.0%) |
| Total (Category) | 25 (100.0%) | 0 (0.0%) |
| Total (Overall) | 303 (63.5%) | 174 (36.5%) |
Production, Transportation and Moving Occupations
The most common Production, Transportation and Moving occupations in Hasley Canyon are , and Material Moving (26 | 5.4%).
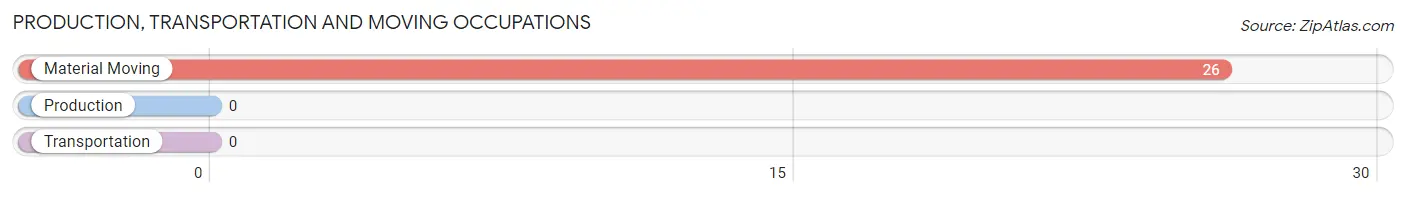
Production, Transportation and Moving Occupations by Sex
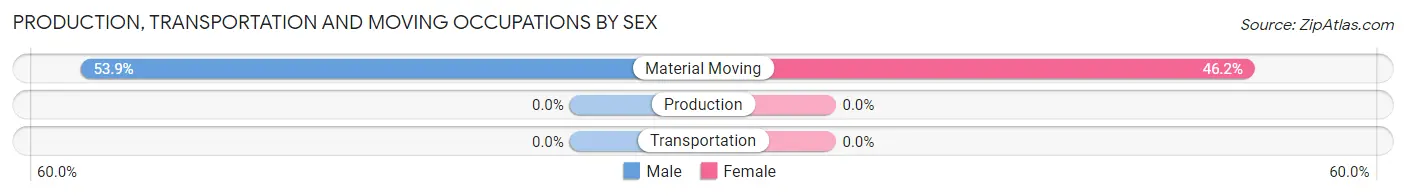
| Occupation | Male | Female |
| Production | 0 (0.0%) | 0 (0.0%) |
| Transportation | 0 (0.0%) | 0 (0.0%) |
| Material Moving | 14 (53.8%) | 12 (46.2%) |
| Total (Category) | 14 (53.8%) | 12 (46.2%) |
| Total (Overall) | 303 (63.5%) | 174 (36.5%) |
Employment Industries by Sex in Hasley Canyon
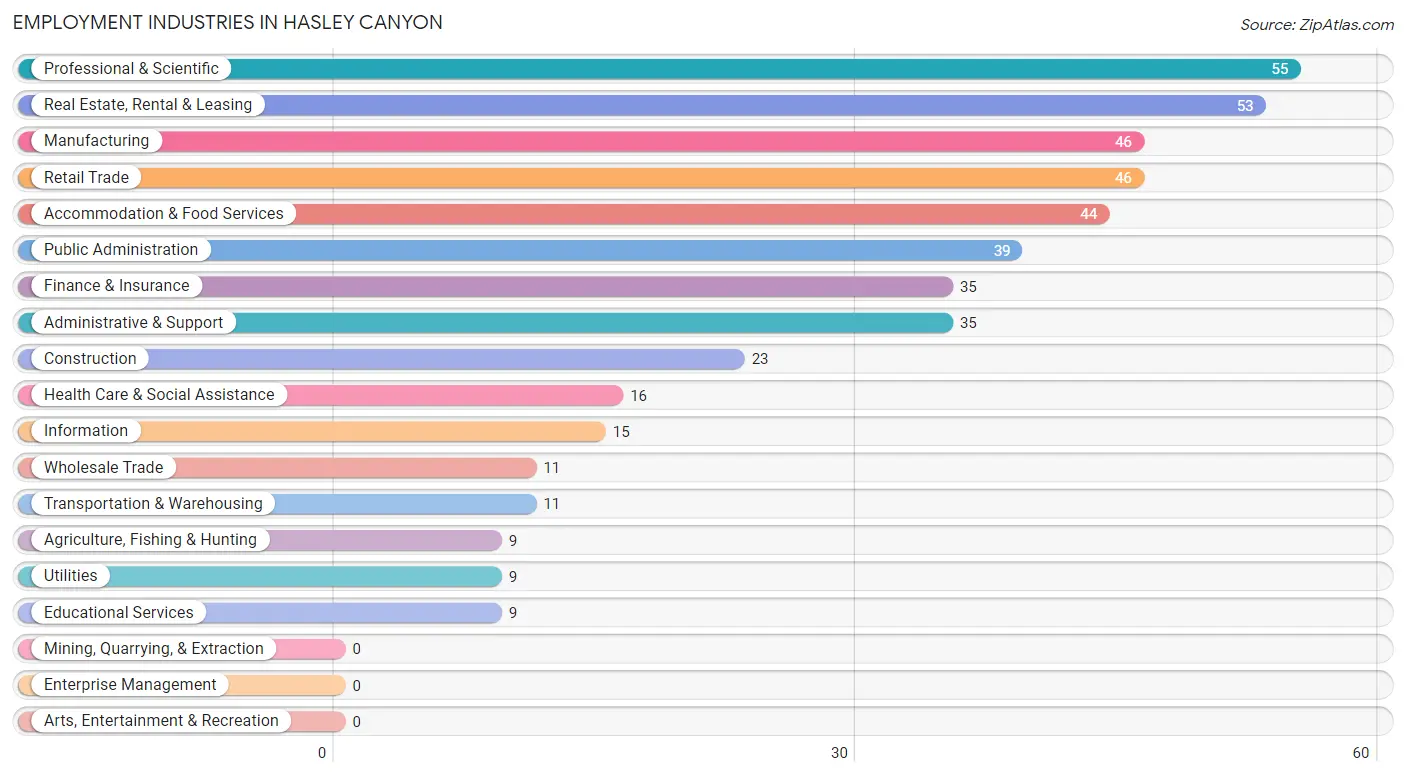
Employment Industries in Hasley Canyon
The major employment industries in Hasley Canyon include Professional & Scientific (55 | 11.5%), Real Estate, Rental & Leasing (53 | 11.1%), Manufacturing (46 | 9.6%), Retail Trade (46 | 9.6%), and Accommodation & Food Services (44 | 9.2%).
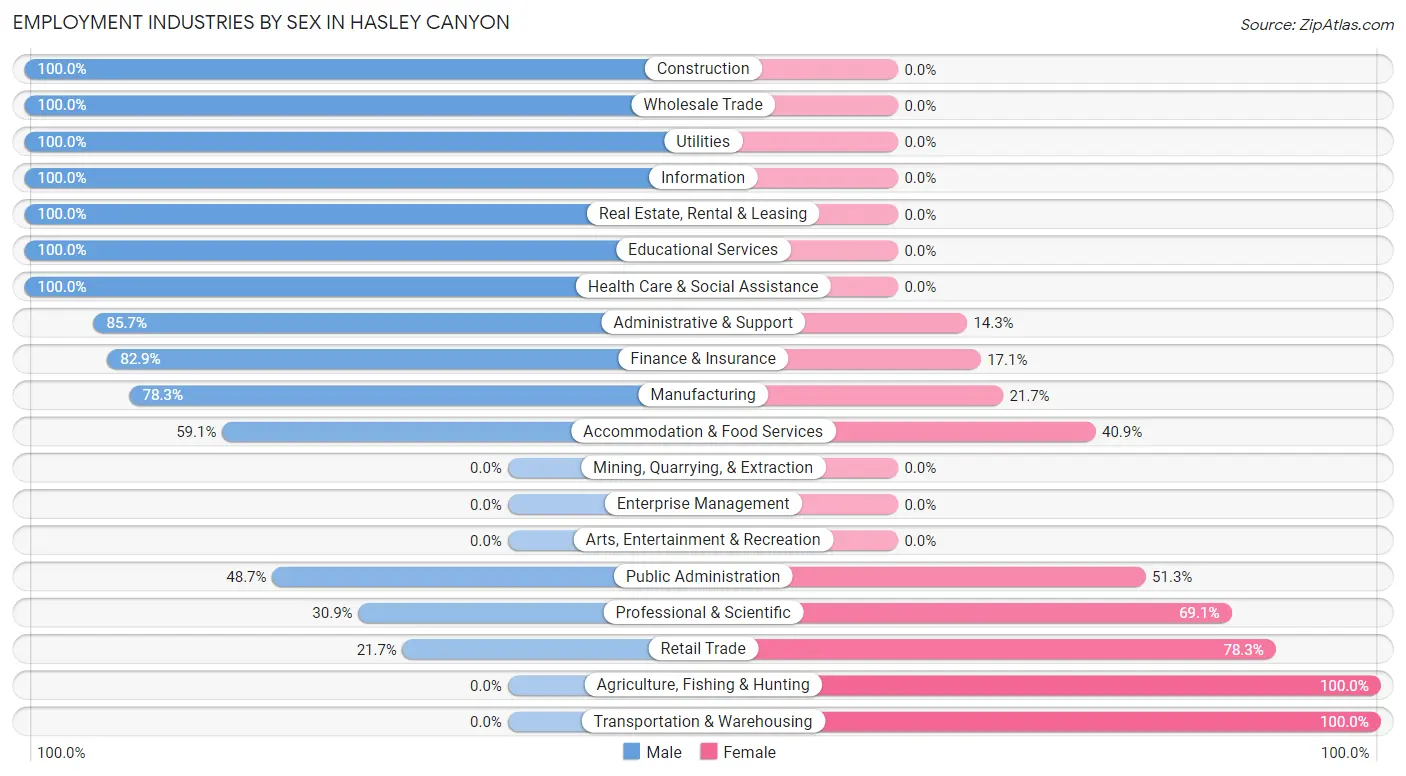
Employment Industries by Sex in Hasley Canyon
The Hasley Canyon industries that see more men than women are Construction (100.0%), Wholesale Trade (100.0%), and Utilities (100.0%), whereas the industries that tend to have a higher number of women are Agriculture, Fishing & Hunting (100.0%), Transportation & Warehousing (100.0%), and Retail Trade (78.3%).
| Industry | Male | Female |
| Agriculture, Fishing & Hunting | 0 (0.0%) | 9 (100.0%) |
| Mining, Quarrying, & Extraction | 0 (0.0%) | 0 (0.0%) |
| Construction | 23 (100.0%) | 0 (0.0%) |
| Manufacturing | 36 (78.3%) | 10 (21.7%) |
| Wholesale Trade | 11 (100.0%) | 0 (0.0%) |
| Retail Trade | 10 (21.7%) | 36 (78.3%) |
| Transportation & Warehousing | 0 (0.0%) | 11 (100.0%) |
| Utilities | 9 (100.0%) | 0 (0.0%) |
| Information | 15 (100.0%) | 0 (0.0%) |
| Finance & Insurance | 29 (82.9%) | 6 (17.1%) |
| Real Estate, Rental & Leasing | 53 (100.0%) | 0 (0.0%) |
| Professional & Scientific | 17 (30.9%) | 38 (69.1%) |
| Enterprise Management | 0 (0.0%) | 0 (0.0%) |
| Administrative & Support | 30 (85.7%) | 5 (14.3%) |
| Educational Services | 9 (100.0%) | 0 (0.0%) |
| Health Care & Social Assistance | 16 (100.0%) | 0 (0.0%) |
| Arts, Entertainment & Recreation | 0 (0.0%) | 0 (0.0%) |
| Accommodation & Food Services | 26 (59.1%) | 18 (40.9%) |
| Public Administration | 19 (48.7%) | 20 (51.3%) |
| Total | 303 (63.5%) | 174 (36.5%) |
Education in Hasley Canyon
School Enrollment in Hasley Canyon
The most common levels of schooling among the 436 students in Hasley Canyon are middle school (147 | 33.7%), elementary school (138 | 31.7%), and high school (90 | 20.6%).
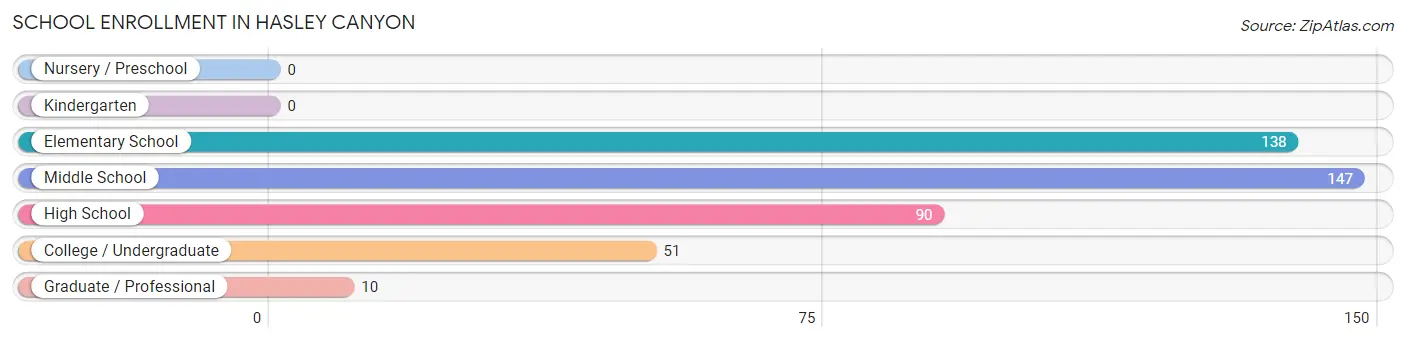
| School Level | # Students | % Students |
| Nursery / Preschool | 0 | 0.0% |
| Kindergarten | 0 | 0.0% |
| Elementary School | 138 | 31.7% |
| Middle School | 147 | 33.7% |
| High School | 90 | 20.6% |
| College / Undergraduate | 51 | 11.7% |
| Graduate / Professional | 10 | 2.3% |
| Total | 436 | 100.0% |
School Enrollment by Age by Funding Source in Hasley Canyon
Out of a total of 436 students who are enrolled in schools in Hasley Canyon, 197 (45.2%) attend a private institution, while the remaining 239 (54.8%) are enrolled in public schools. The age group of 10 to 14 year olds has the highest likelihood of being enrolled in private schools, with 94 (55.0% in the age bracket) enrolled. Conversely, the age group of 18 to 19 year olds has the lowest likelihood of being enrolled in a private school, with 8 (100.0% in the age bracket) attending a public institution.
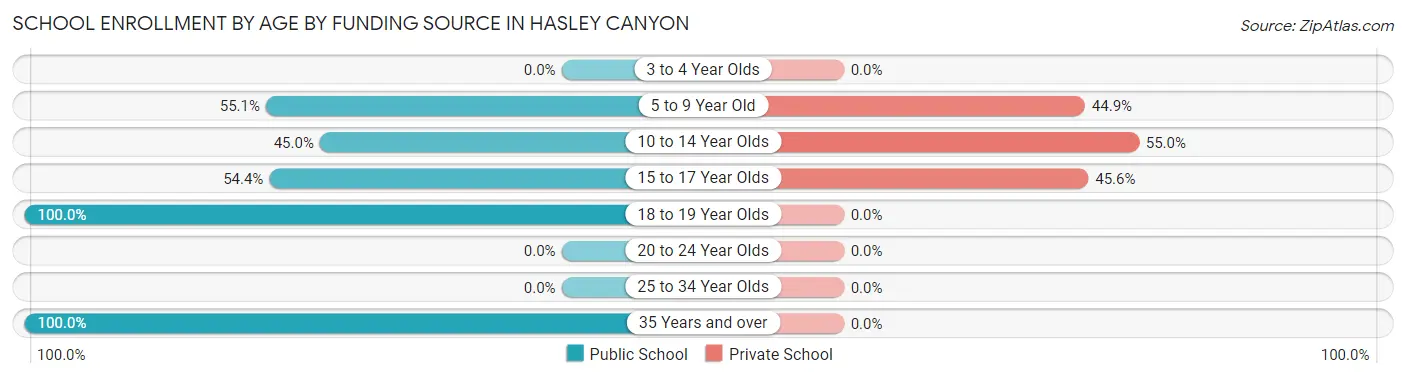
| Age Bracket | Public School | Private School |
| 3 to 4 Year Olds | 0 (0.0%) | 0 (0.0%) |
| 5 to 9 Year Old | 76 (55.1%) | 62 (44.9%) |
| 10 to 14 Year Olds | 77 (45.0%) | 94 (55.0%) |
| 15 to 17 Year Olds | 49 (54.4%) | 41 (45.6%) |
| 18 to 19 Year Olds | 8 (100.0%) | 0 (0.0%) |
| 20 to 24 Year Olds | 0 (0.0%) | 0 (0.0%) |
| 25 to 34 Year Olds | 0 (0.0%) | 0 (0.0%) |
| 35 Years and over | 29 (100.0%) | 0 (0.0%) |
| Total | 239 (54.8%) | 197 (45.2%) |
Educational Attainment by Field of Study in Hasley Canyon
Business (91 | 27.4%), arts & humanities (86 | 25.9%), engineering (43 | 13.0%), communications (23 | 6.9%), and science & technology (22 | 6.6%) are the most common fields of study among 332 individuals in Hasley Canyon who have obtained a bachelor's degree or higher.
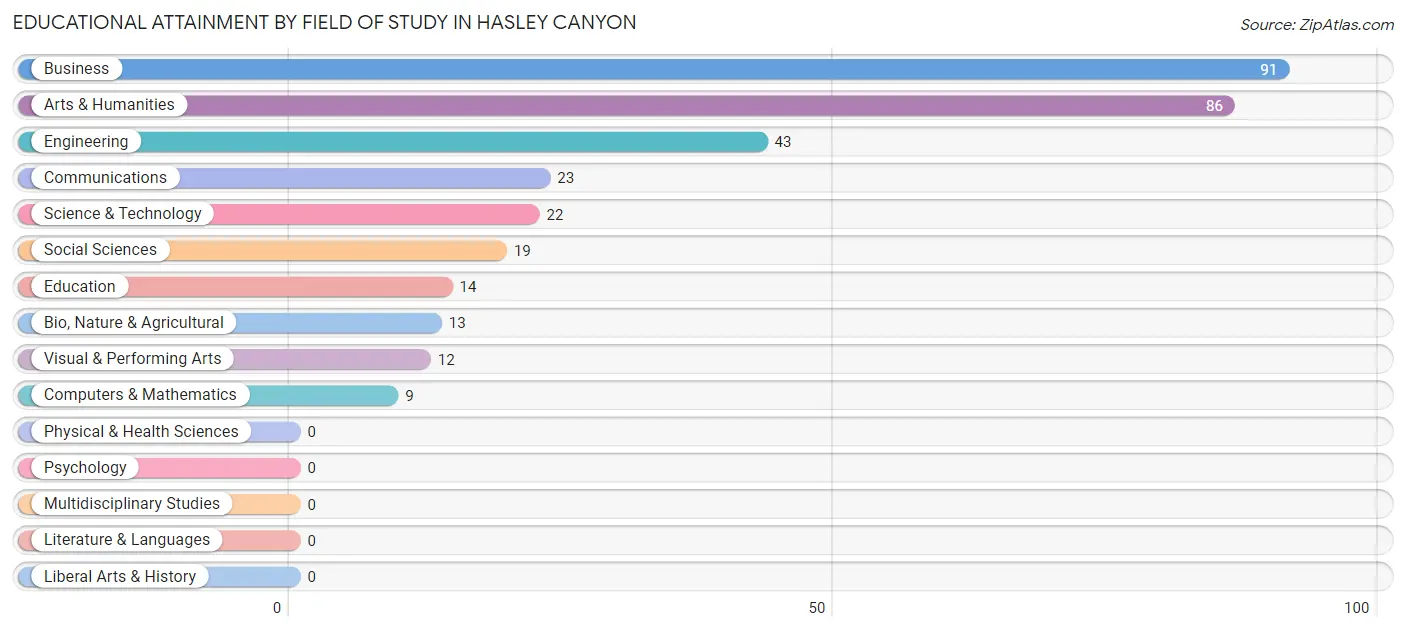
| Field of Study | # Graduates | % Graduates |
| Computers & Mathematics | 9 | 2.7% |
| Bio, Nature & Agricultural | 13 | 3.9% |
| Physical & Health Sciences | 0 | 0.0% |
| Psychology | 0 | 0.0% |
| Social Sciences | 19 | 5.7% |
| Engineering | 43 | 13.0% |
| Multidisciplinary Studies | 0 | 0.0% |
| Science & Technology | 22 | 6.6% |
| Business | 91 | 27.4% |
| Education | 14 | 4.2% |
| Literature & Languages | 0 | 0.0% |
| Liberal Arts & History | 0 | 0.0% |
| Visual & Performing Arts | 12 | 3.6% |
| Communications | 23 | 6.9% |
| Arts & Humanities | 86 | 25.9% |
| Total | 332 | 100.0% |
Transportation & Commute in Hasley Canyon
Vehicle Availability by Sex in Hasley Canyon
The most prevalent vehicle ownership categories in Hasley Canyon are males with 2 vehicles (128, accounting for 42.2%) and females with 2 vehicles (86, making up 73.6%).
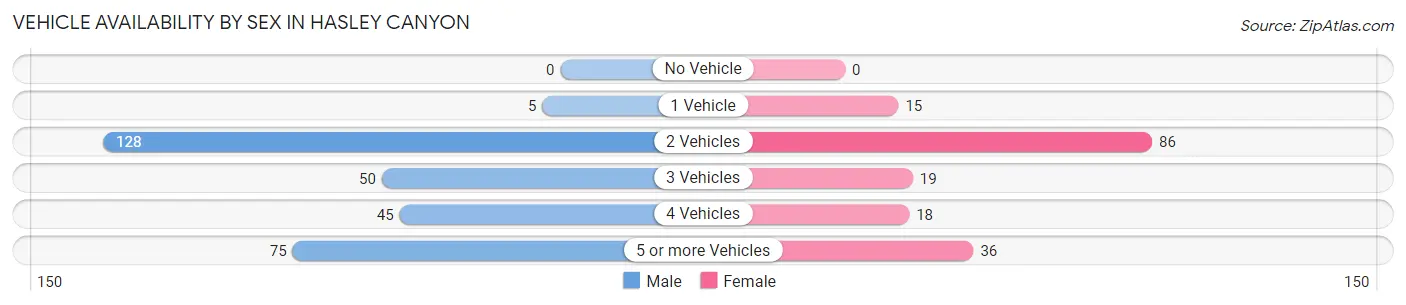
| Vehicles Available | Male | Female |
| No Vehicle | 0 (0.0%) | 0 (0.0%) |
| 1 Vehicle | 5 (1.7%) | 15 (8.6%) |
| 2 Vehicles | 128 (42.2%) | 86 (49.4%) |
| 3 Vehicles | 50 (16.5%) | 19 (10.9%) |
| 4 Vehicles | 45 (14.8%) | 18 (10.3%) |
| 5 or more Vehicles | 75 (24.7%) | 36 (20.7%) |
| Total | 303 (100.0%) | 174 (100.0%) |
Commute Time in Hasley Canyon
The most frequently occuring commute durations in Hasley Canyon are 45 to 59 minutes (116 commuters, 26.8%), 15 to 19 minutes (69 commuters, 15.9%), and 60 to 89 minutes (67 commuters, 15.5%).
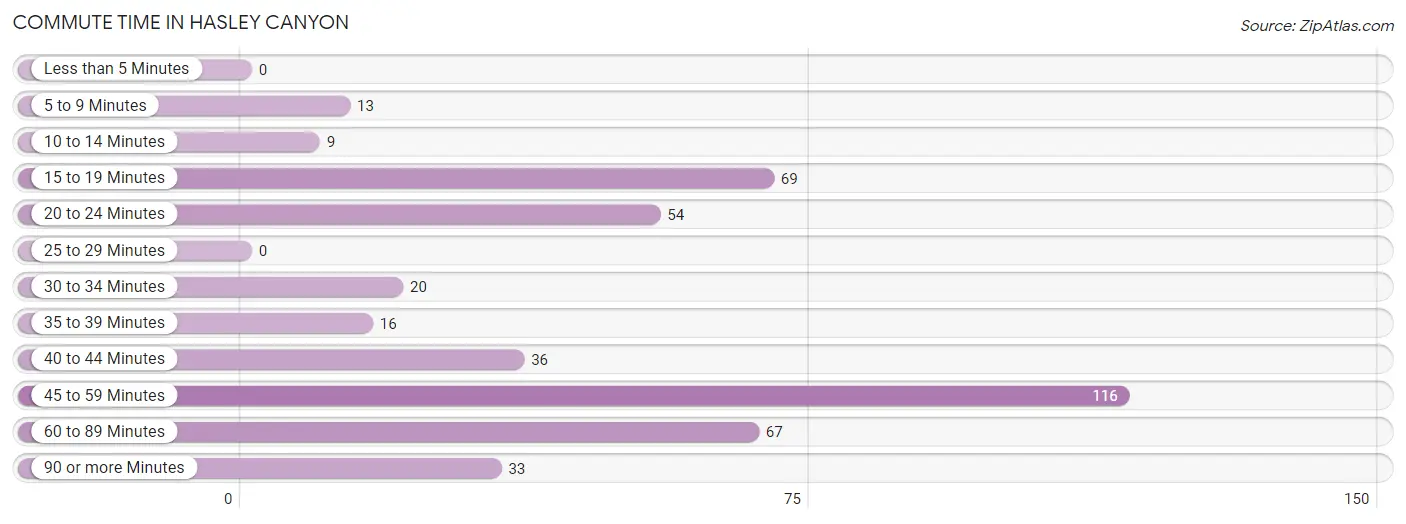
| Commute Time | # Commuters | % Commuters |
| Less than 5 Minutes | 0 | 0.0% |
| 5 to 9 Minutes | 13 | 3.0% |
| 10 to 14 Minutes | 9 | 2.1% |
| 15 to 19 Minutes | 69 | 15.9% |
| 20 to 24 Minutes | 54 | 12.5% |
| 25 to 29 Minutes | 0 | 0.0% |
| 30 to 34 Minutes | 20 | 4.6% |
| 35 to 39 Minutes | 16 | 3.7% |
| 40 to 44 Minutes | 36 | 8.3% |
| 45 to 59 Minutes | 116 | 26.8% |
| 60 to 89 Minutes | 67 | 15.5% |
| 90 or more Minutes | 33 | 7.6% |
Commute Time by Sex in Hasley Canyon
The most common commute times in Hasley Canyon are 60 to 89 minutes (67 commuters, 23.3%) for males and 45 to 59 minutes (56 commuters, 38.6%) for females.
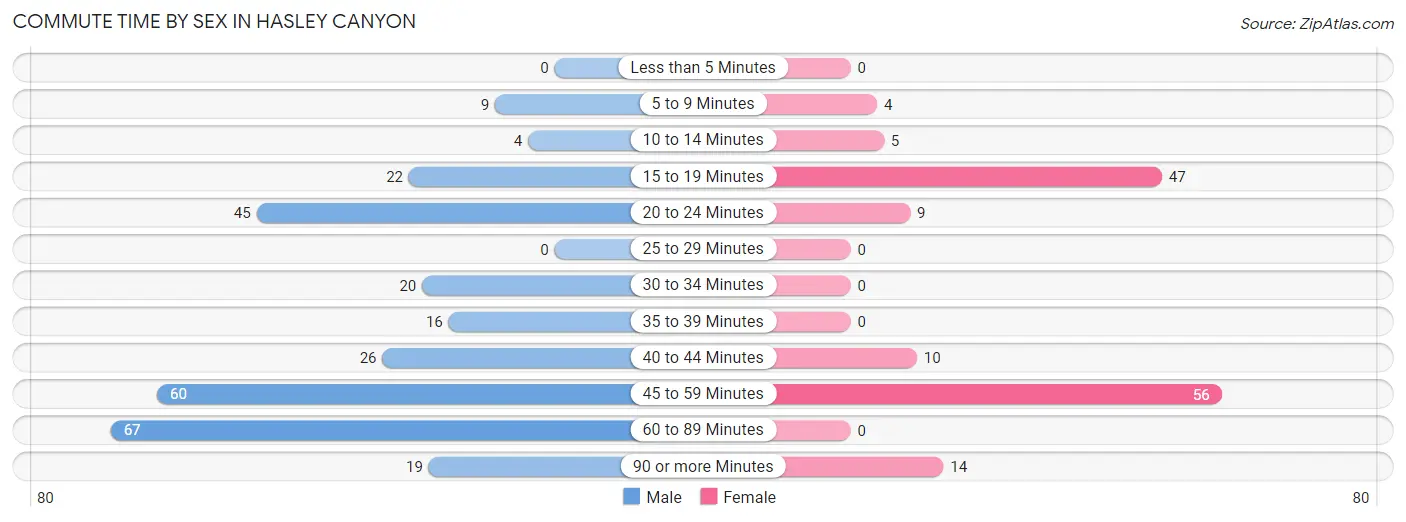
| Commute Time | Male | Female |
| Less than 5 Minutes | 0 (0.0%) | 0 (0.0%) |
| 5 to 9 Minutes | 9 (3.1%) | 4 (2.8%) |
| 10 to 14 Minutes | 4 (1.4%) | 5 (3.5%) |
| 15 to 19 Minutes | 22 (7.6%) | 47 (32.4%) |
| 20 to 24 Minutes | 45 (15.6%) | 9 (6.2%) |
| 25 to 29 Minutes | 0 (0.0%) | 0 (0.0%) |
| 30 to 34 Minutes | 20 (6.9%) | 0 (0.0%) |
| 35 to 39 Minutes | 16 (5.6%) | 0 (0.0%) |
| 40 to 44 Minutes | 26 (9.0%) | 10 (6.9%) |
| 45 to 59 Minutes | 60 (20.8%) | 56 (38.6%) |
| 60 to 89 Minutes | 67 (23.3%) | 0 (0.0%) |
| 90 or more Minutes | 19 (6.6%) | 14 (9.7%) |
Time of Departure to Work by Sex in Hasley Canyon
The most frequent times of departure to work in Hasley Canyon are 6:00 AM to 6:29 AM (66, 22.9%) for males and 7:00 AM to 7:29 AM (40, 27.6%) for females.
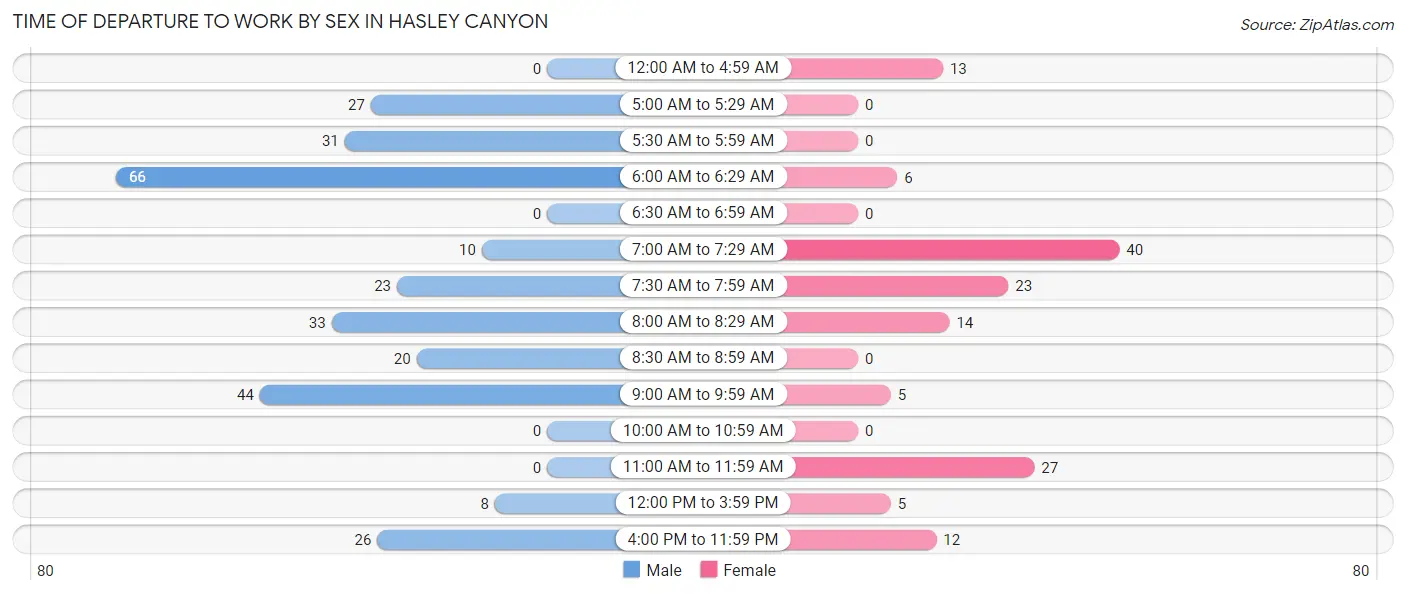
| Time of Departure | Male | Female |
| 12:00 AM to 4:59 AM | 0 (0.0%) | 13 (9.0%) |
| 5:00 AM to 5:29 AM | 27 (9.4%) | 0 (0.0%) |
| 5:30 AM to 5:59 AM | 31 (10.8%) | 0 (0.0%) |
| 6:00 AM to 6:29 AM | 66 (22.9%) | 6 (4.1%) |
| 6:30 AM to 6:59 AM | 0 (0.0%) | 0 (0.0%) |
| 7:00 AM to 7:29 AM | 10 (3.5%) | 40 (27.6%) |
| 7:30 AM to 7:59 AM | 23 (8.0%) | 23 (15.9%) |
| 8:00 AM to 8:29 AM | 33 (11.5%) | 14 (9.7%) |
| 8:30 AM to 8:59 AM | 20 (6.9%) | 0 (0.0%) |
| 9:00 AM to 9:59 AM | 44 (15.3%) | 5 (3.5%) |
| 10:00 AM to 10:59 AM | 0 (0.0%) | 0 (0.0%) |
| 11:00 AM to 11:59 AM | 0 (0.0%) | 27 (18.6%) |
| 12:00 PM to 3:59 PM | 8 (2.8%) | 5 (3.5%) |
| 4:00 PM to 11:59 PM | 26 (9.0%) | 12 (8.3%) |
| Total | 288 (100.0%) | 145 (100.0%) |
Housing Occupancy in Hasley Canyon
Occupancy by Ownership in Hasley Canyon
Of the total 359 dwellings in Hasley Canyon, owner-occupied units account for 334 (93.0%), while renter-occupied units make up 25 (7.0%).
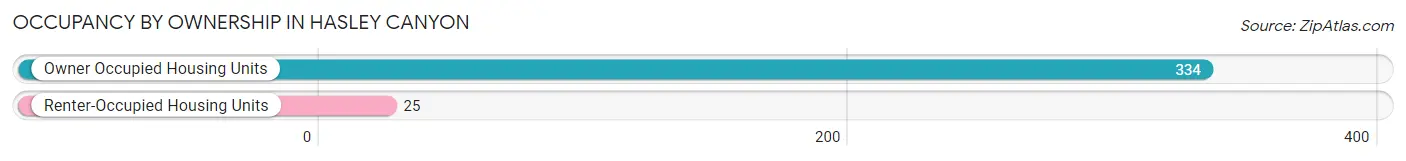
| Occupancy | # Housing Units | % Housing Units |
| Owner Occupied Housing Units | 334 | 93.0% |
| Renter-Occupied Housing Units | 25 | 7.0% |
| Total Occupied Housing Units | 359 | 100.0% |
Occupancy by Household Size in Hasley Canyon
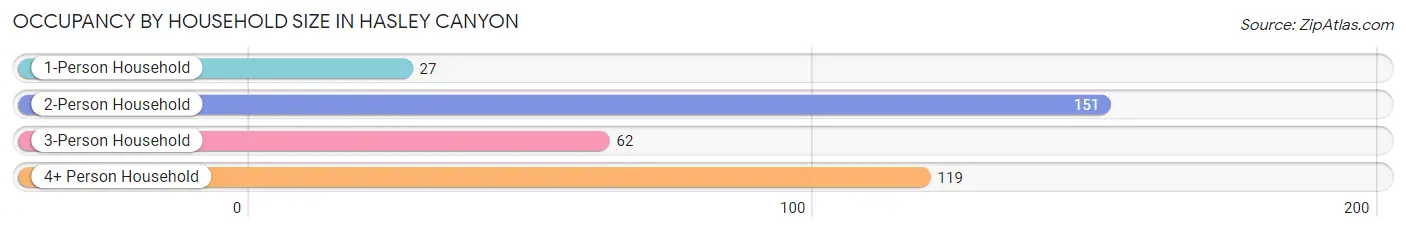
| Household Size | # Housing Units | % Housing Units |
| 1-Person Household | 27 | 7.5% |
| 2-Person Household | 151 | 42.1% |
| 3-Person Household | 62 | 17.3% |
| 4+ Person Household | 119 | 33.2% |
| Total Housing Units | 359 | 100.0% |
Occupancy by Ownership by Household Size in Hasley Canyon
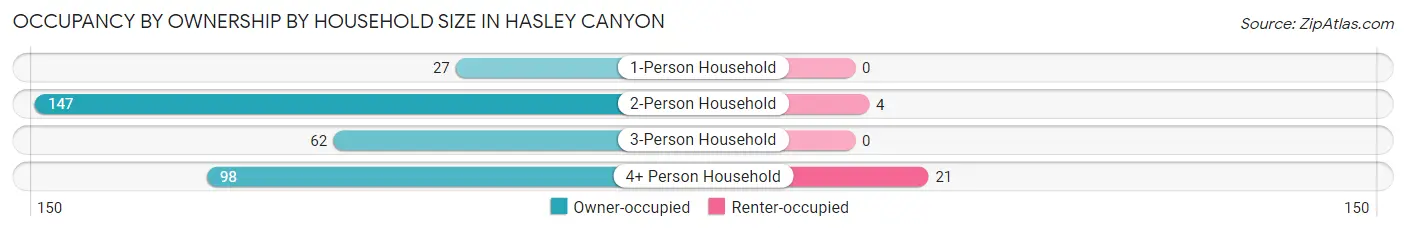
| Household Size | Owner-occupied | Renter-occupied |
| 1-Person Household | 27 (100.0%) | 0 (0.0%) |
| 2-Person Household | 147 (97.4%) | 4 (2.6%) |
| 3-Person Household | 62 (100.0%) | 0 (0.0%) |
| 4+ Person Household | 98 (82.4%) | 21 (17.6%) |
| Total Housing Units | 334 (93.0%) | 25 (7.0%) |
Occupancy by Educational Attainment in Hasley Canyon
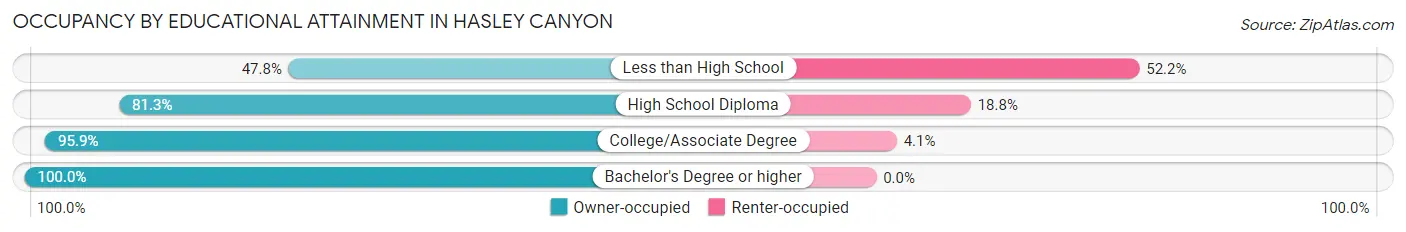
| Household Size | Owner-occupied | Renter-occupied |
| Less than High School | 11 (47.8%) | 12 (52.2%) |
| High School Diploma | 39 (81.2%) | 9 (18.8%) |
| College/Associate Degree | 94 (95.9%) | 4 (4.1%) |
| Bachelor's Degree or higher | 190 (100.0%) | 0 (0.0%) |
Occupancy by Age of Householder in Hasley Canyon
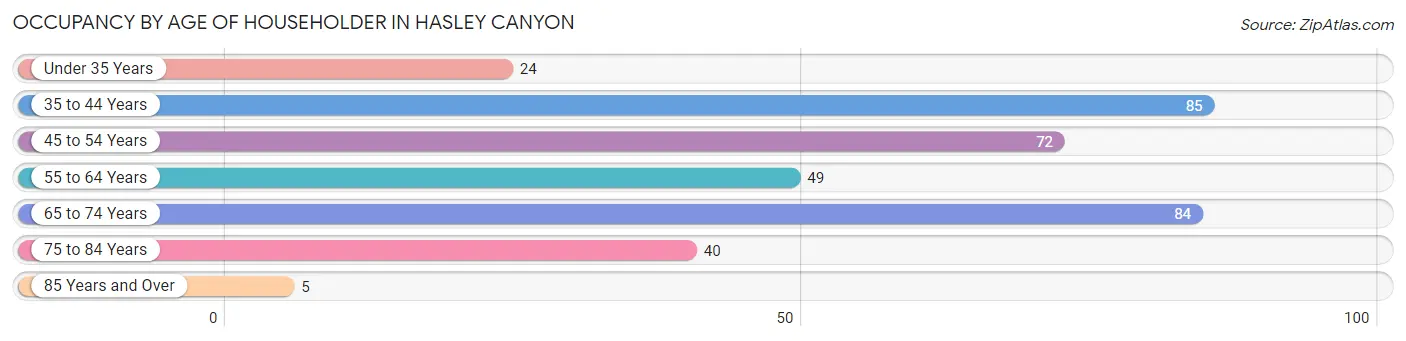
| Age Bracket | # Households | % Households |
| Under 35 Years | 24 | 6.7% |
| 35 to 44 Years | 85 | 23.7% |
| 45 to 54 Years | 72 | 20.1% |
| 55 to 64 Years | 49 | 13.7% |
| 65 to 74 Years | 84 | 23.4% |
| 75 to 84 Years | 40 | 11.1% |
| 85 Years and Over | 5 | 1.4% |
| Total | 359 | 100.0% |
Housing Finances in Hasley Canyon
Median Income by Occupancy in Hasley Canyon
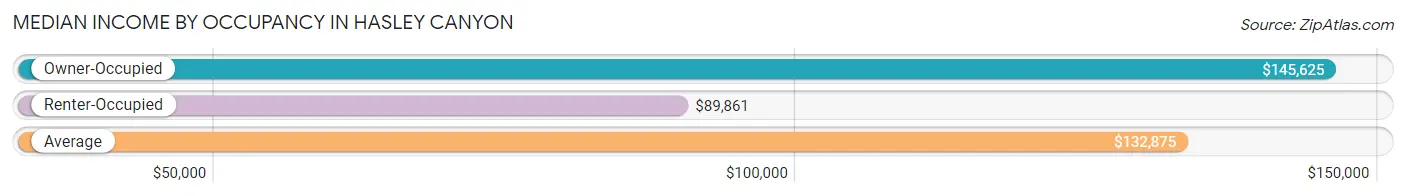
| Occupancy Type | # Households | Median Income |
| Owner-Occupied | 334 (93.0%) | $145,625 |
| Renter-Occupied | 25 (7.0%) | $89,861 |
| Average | 359 (100.0%) | $132,875 |
Occupancy by Householder Income Bracket in Hasley Canyon
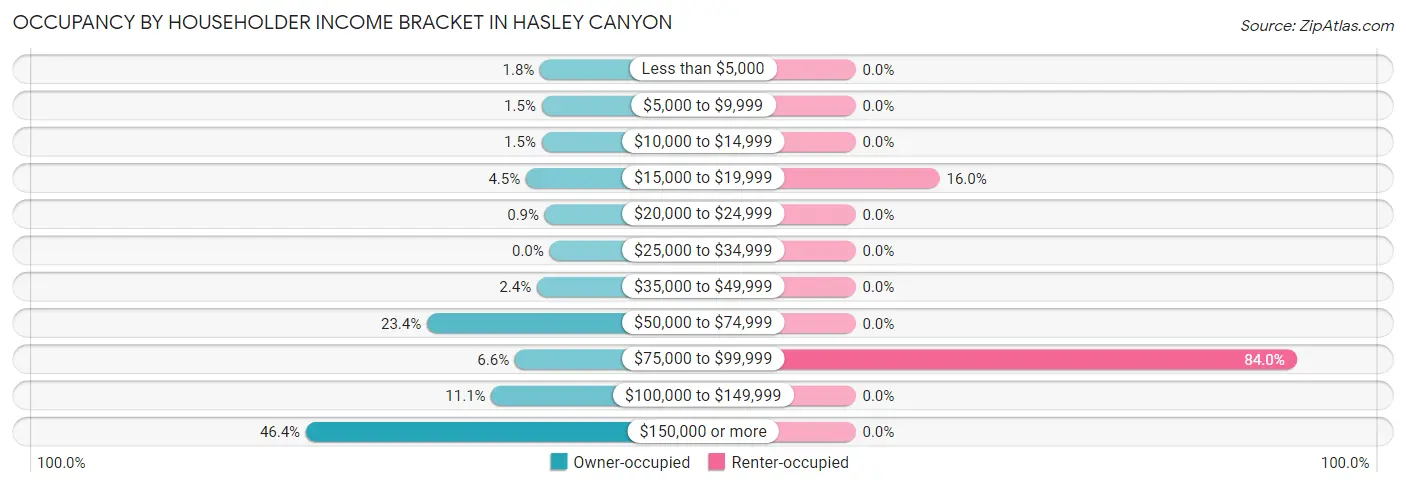
| Income Bracket | Owner-occupied | Renter-occupied |
| Less than $5,000 | 6 (1.8%) | 0 (0.0%) |
| $5,000 to $9,999 | 5 (1.5%) | 0 (0.0%) |
| $10,000 to $14,999 | 5 (1.5%) | 0 (0.0%) |
| $15,000 to $19,999 | 15 (4.5%) | 4 (16.0%) |
| $20,000 to $24,999 | 3 (0.9%) | 0 (0.0%) |
| $25,000 to $34,999 | 0 (0.0%) | 0 (0.0%) |
| $35,000 to $49,999 | 8 (2.4%) | 0 (0.0%) |
| $50,000 to $74,999 | 78 (23.4%) | 0 (0.0%) |
| $75,000 to $99,999 | 22 (6.6%) | 21 (84.0%) |
| $100,000 to $149,999 | 37 (11.1%) | 0 (0.0%) |
| $150,000 or more | 155 (46.4%) | 0 (0.0%) |
| Total | 334 (100.0%) | 25 (100.0%) |
Monthly Housing Cost Tiers in Hasley Canyon
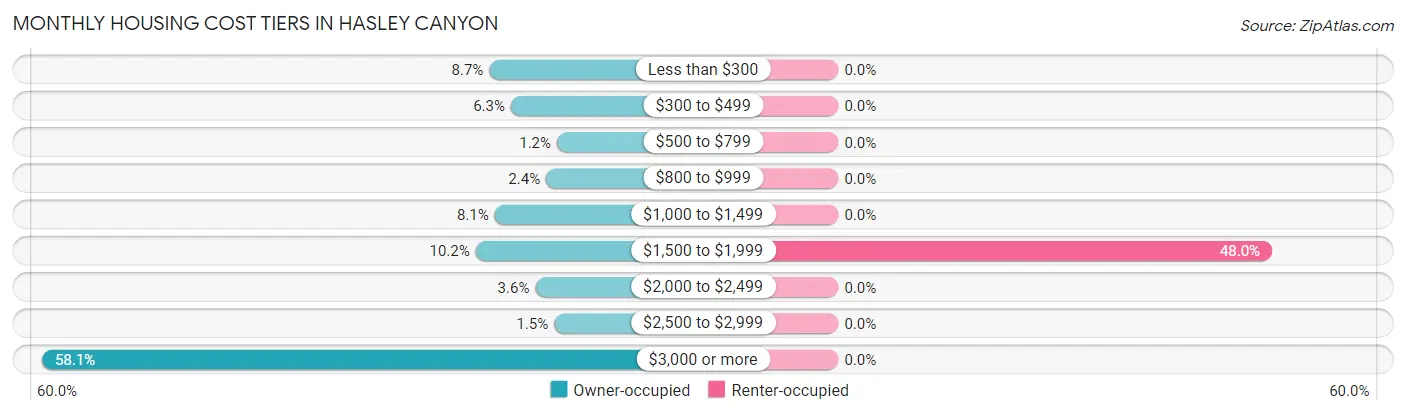
| Monthly Cost | Owner-occupied | Renter-occupied |
| Less than $300 | 29 (8.7%) | 0 (0.0%) |
| $300 to $499 | 21 (6.3%) | 0 (0.0%) |
| $500 to $799 | 4 (1.2%) | 0 (0.0%) |
| $800 to $999 | 8 (2.4%) | 0 (0.0%) |
| $1,000 to $1,499 | 27 (8.1%) | 0 (0.0%) |
| $1,500 to $1,999 | 34 (10.2%) | 12 (48.0%) |
| $2,000 to $2,499 | 12 (3.6%) | 0 (0.0%) |
| $2,500 to $2,999 | 5 (1.5%) | 0 (0.0%) |
| $3,000 or more | 194 (58.1%) | 0 (0.0%) |
| Total | 334 (100.0%) | 25 (100.0%) |
Physical Housing Characteristics in Hasley Canyon
Housing Structures in Hasley Canyon
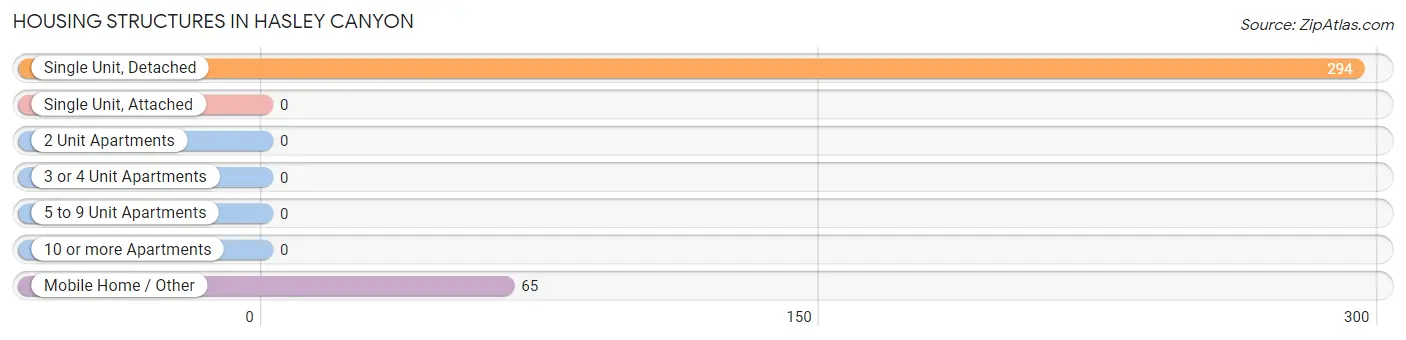
| Structure Type | # Housing Units | % Housing Units |
| Single Unit, Detached | 294 | 81.9% |
| Single Unit, Attached | 0 | 0.0% |
| 2 Unit Apartments | 0 | 0.0% |
| 3 or 4 Unit Apartments | 0 | 0.0% |
| 5 to 9 Unit Apartments | 0 | 0.0% |
| 10 or more Apartments | 0 | 0.0% |
| Mobile Home / Other | 65 | 18.1% |
| Total | 359 | 100.0% |
Housing Structures by Occupancy in Hasley Canyon
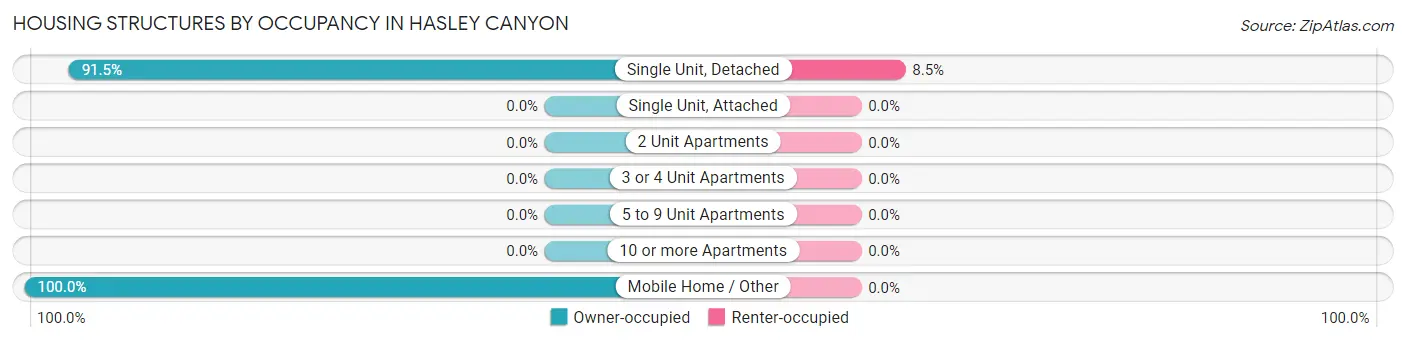
| Structure Type | Owner-occupied | Renter-occupied |
| Single Unit, Detached | 269 (91.5%) | 25 (8.5%) |
| Single Unit, Attached | 0 (0.0%) | 0 (0.0%) |
| 2 Unit Apartments | 0 (0.0%) | 0 (0.0%) |
| 3 or 4 Unit Apartments | 0 (0.0%) | 0 (0.0%) |
| 5 to 9 Unit Apartments | 0 (0.0%) | 0 (0.0%) |
| 10 or more Apartments | 0 (0.0%) | 0 (0.0%) |
| Mobile Home / Other | 65 (100.0%) | 0 (0.0%) |
| Total | 334 (93.0%) | 25 (7.0%) |
Housing Structures by Number of Rooms in Hasley Canyon
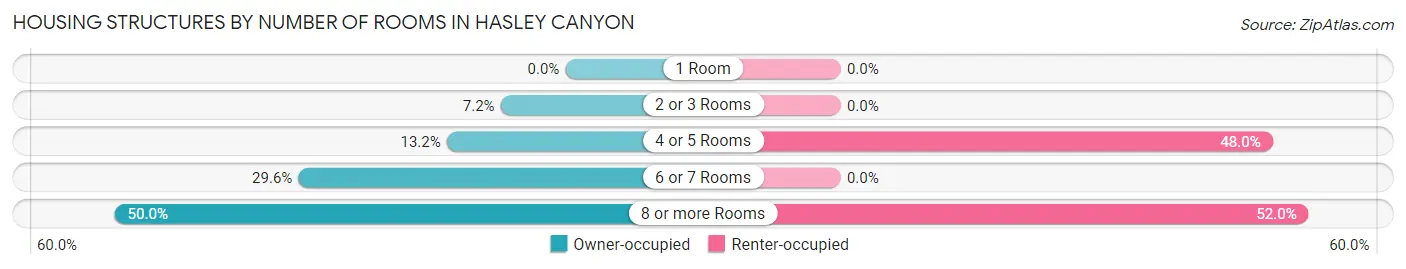
| Number of Rooms | Owner-occupied | Renter-occupied |
| 1 Room | 0 (0.0%) | 0 (0.0%) |
| 2 or 3 Rooms | 24 (7.2%) | 0 (0.0%) |
| 4 or 5 Rooms | 44 (13.2%) | 12 (48.0%) |
| 6 or 7 Rooms | 99 (29.6%) | 0 (0.0%) |
| 8 or more Rooms | 167 (50.0%) | 13 (52.0%) |
| Total | 334 (100.0%) | 25 (100.0%) |
Housing Structure by Heating Type in Hasley Canyon
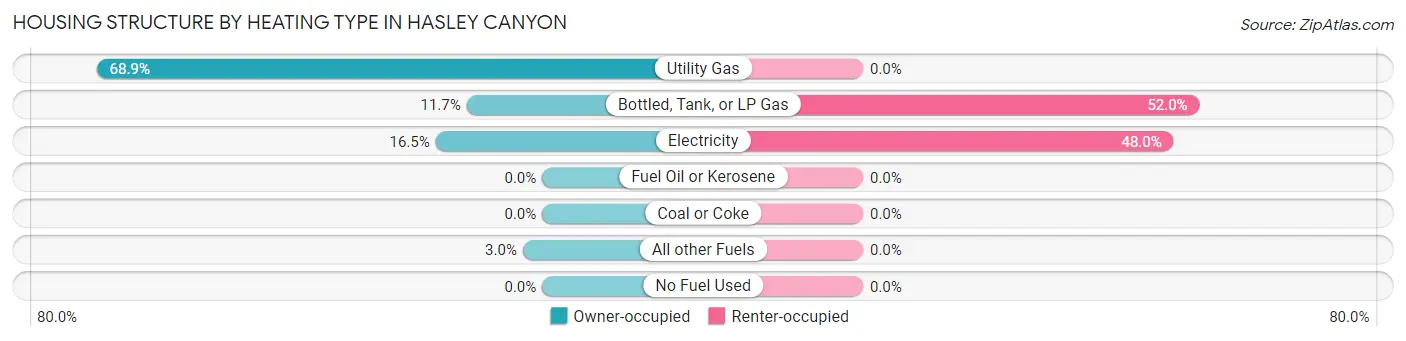
| Heating Type | Owner-occupied | Renter-occupied |
| Utility Gas | 230 (68.9%) | 0 (0.0%) |
| Bottled, Tank, or LP Gas | 39 (11.7%) | 13 (52.0%) |
| Electricity | 55 (16.5%) | 12 (48.0%) |
| Fuel Oil or Kerosene | 0 (0.0%) | 0 (0.0%) |
| Coal or Coke | 0 (0.0%) | 0 (0.0%) |
| All other Fuels | 10 (3.0%) | 0 (0.0%) |
| No Fuel Used | 0 (0.0%) | 0 (0.0%) |
| Total | 334 (100.0%) | 25 (100.0%) |
Household Vehicle Usage in Hasley Canyon
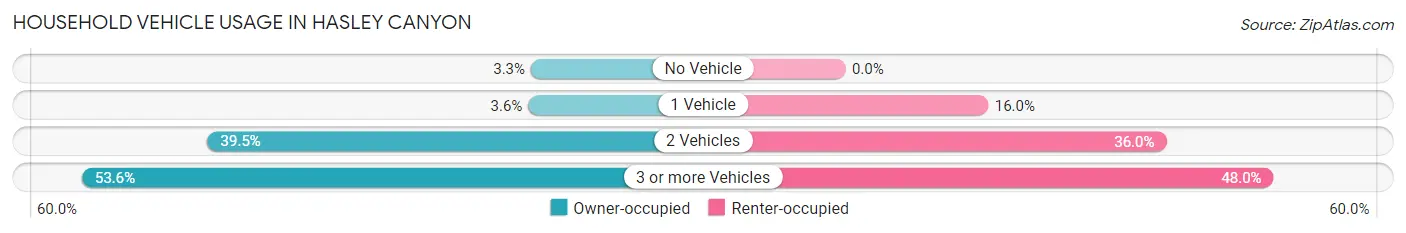
| Vehicles per Household | Owner-occupied | Renter-occupied |
| No Vehicle | 11 (3.3%) | 0 (0.0%) |
| 1 Vehicle | 12 (3.6%) | 4 (16.0%) |
| 2 Vehicles | 132 (39.5%) | 9 (36.0%) |
| 3 or more Vehicles | 179 (53.6%) | 12 (48.0%) |
| Total | 334 (100.0%) | 25 (100.0%) |
Real Estate & Mortgages in Hasley Canyon
Real Estate and Mortgage Overview in Hasley Canyon
| Characteristic | Without Mortgage | With Mortgage |
| Housing Units | 133 | 201 |
| Median Property Value | - | - |
| Median Household Income | - | - |
| Monthly Housing Costs | $1,163 | $166 |
| Real Estate Taxes | - | - |
Property Value by Mortgage Status in Hasley Canyon
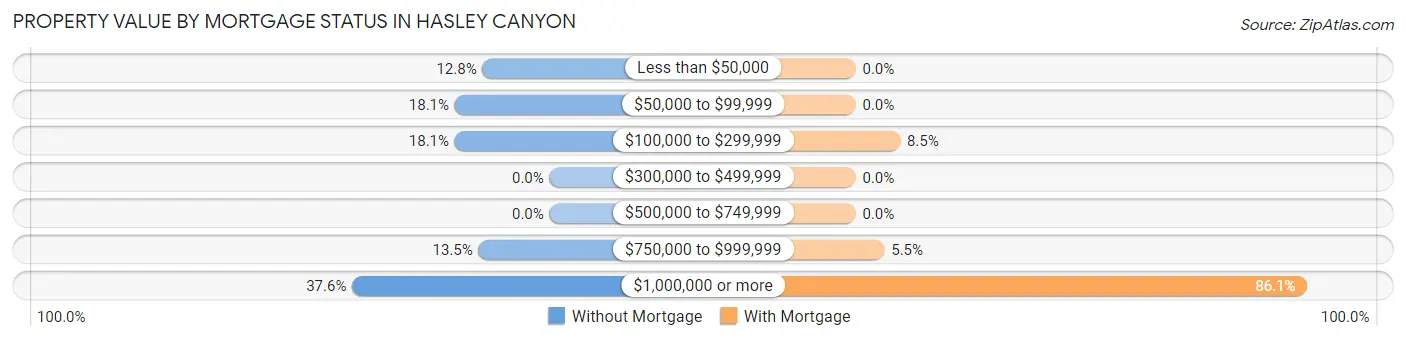
| Property Value | Without Mortgage | With Mortgage |
| Less than $50,000 | 17 (12.8%) | 0 (0.0%) |
| $50,000 to $99,999 | 24 (18.0%) | 0 (0.0%) |
| $100,000 to $299,999 | 24 (18.0%) | 17 (8.5%) |
| $300,000 to $499,999 | 0 (0.0%) | 0 (0.0%) |
| $500,000 to $749,999 | 0 (0.0%) | 0 (0.0%) |
| $750,000 to $999,999 | 18 (13.5%) | 11 (5.5%) |
| $1,000,000 or more | 50 (37.6%) | 173 (86.1%) |
| Total | 133 (100.0%) | 201 (100.0%) |
Household Income by Mortgage Status in Hasley Canyon
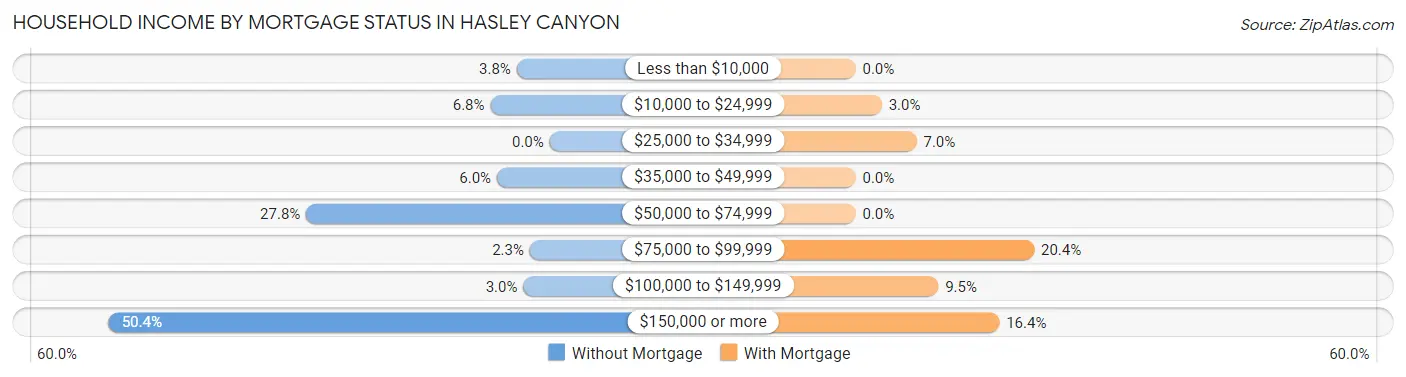
| Household Income | Without Mortgage | With Mortgage |
| Less than $10,000 | 5 (3.8%) | 0 (0.0%) |
| $10,000 to $24,999 | 9 (6.8%) | 6 (3.0%) |
| $25,000 to $34,999 | 0 (0.0%) | 14 (7.0%) |
| $35,000 to $49,999 | 8 (6.0%) | 0 (0.0%) |
| $50,000 to $74,999 | 37 (27.8%) | 0 (0.0%) |
| $75,000 to $99,999 | 3 (2.3%) | 41 (20.4%) |
| $100,000 to $149,999 | 4 (3.0%) | 19 (9.5%) |
| $150,000 or more | 67 (50.4%) | 33 (16.4%) |
| Total | 133 (100.0%) | 201 (100.0%) |
Property Value to Household Income Ratio in Hasley Canyon
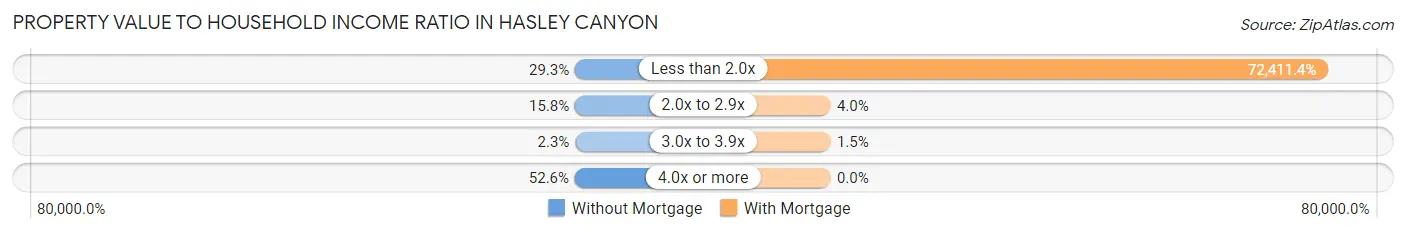
| Value-to-Income Ratio | Without Mortgage | With Mortgage |
| Less than 2.0x | 39 (29.3%) | 145,547 (72,411.4%) |
| 2.0x to 2.9x | 21 (15.8%) | 8 (4.0%) |
| 3.0x to 3.9x | 3 (2.3%) | 3 (1.5%) |
| 4.0x or more | 70 (52.6%) | 0 (0.0%) |
| Total | 133 (100.0%) | 201 (100.0%) |
Real Estate Taxes by Mortgage Status in Hasley Canyon
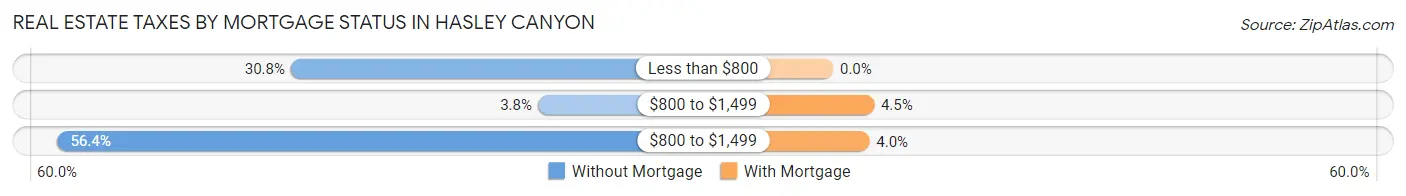
| Property Taxes | Without Mortgage | With Mortgage |
| Less than $800 | 41 (30.8%) | 0 (0.0%) |
| $800 to $1,499 | 5 (3.8%) | 9 (4.5%) |
| $800 to $1,499 | 75 (56.4%) | 8 (4.0%) |
| Total | 133 (100.0%) | 201 (100.0%) |
Health & Disability in Hasley Canyon
Health Insurance Coverage by Age in Hasley Canyon
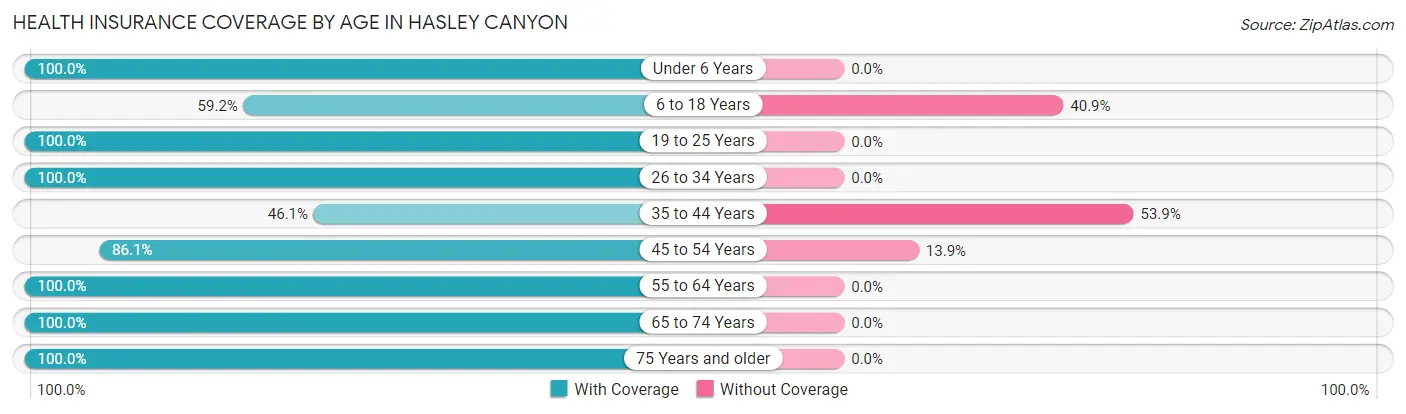
| Age Bracket | With Coverage | Without Coverage |
| Under 6 Years | 40 (100.0%) | 0 (0.0%) |
| 6 to 18 Years | 236 (59.2%) | 163 (40.8%) |
| 19 to 25 Years | 78 (100.0%) | 0 (0.0%) |
| 26 to 34 Years | 47 (100.0%) | 0 (0.0%) |
| 35 to 44 Years | 76 (46.1%) | 89 (53.9%) |
| 45 to 54 Years | 130 (86.1%) | 21 (13.9%) |
| 55 to 64 Years | 124 (100.0%) | 0 (0.0%) |
| 65 to 74 Years | 179 (100.0%) | 0 (0.0%) |
| 75 Years and older | 53 (100.0%) | 0 (0.0%) |
| Total | 963 (77.9%) | 273 (22.1%) |
Health Insurance Coverage by Citizenship Status in Hasley Canyon
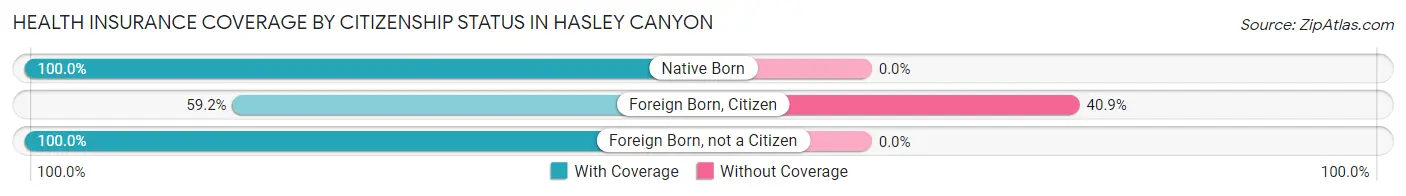
| Citizenship Status | With Coverage | Without Coverage |
| Native Born | 40 (100.0%) | 0 (0.0%) |
| Foreign Born, Citizen | 236 (59.2%) | 163 (40.8%) |
| Foreign Born, not a Citizen | 78 (100.0%) | 0 (0.0%) |
Health Insurance Coverage by Household Income in Hasley Canyon

| Household Income | With Coverage | Without Coverage |
| Under $25,000 | 129 (100.0%) | 0 (0.0%) |
| $25,000 to $49,999 | 16 (100.0%) | 0 (0.0%) |
| $50,000 to $74,999 | 138 (35.2%) | 254 (64.8%) |
| $75,000 to $99,999 | 190 (90.9%) | 19 (9.1%) |
| $100,000 and over | 490 (100.0%) | 0 (0.0%) |
Public vs Private Health Insurance Coverage by Age in Hasley Canyon
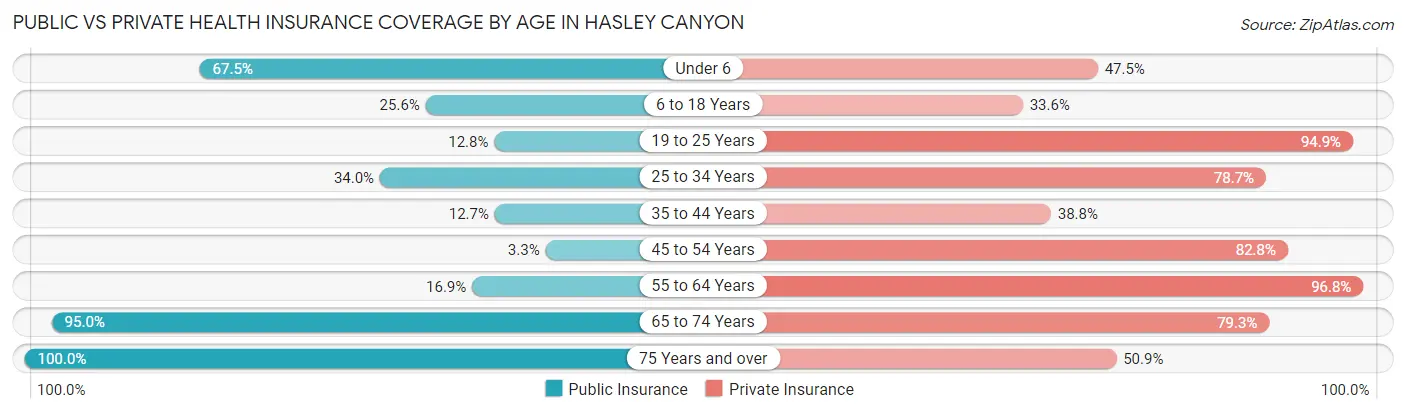
| Age Bracket | Public Insurance | Private Insurance |
| Under 6 | 27 (67.5%) | 19 (47.5%) |
| 6 to 18 Years | 102 (25.6%) | 134 (33.6%) |
| 19 to 25 Years | 10 (12.8%) | 74 (94.9%) |
| 25 to 34 Years | 16 (34.0%) | 37 (78.7%) |
| 35 to 44 Years | 21 (12.7%) | 64 (38.8%) |
| 45 to 54 Years | 5 (3.3%) | 125 (82.8%) |
| 55 to 64 Years | 21 (16.9%) | 120 (96.8%) |
| 65 to 74 Years | 170 (95.0%) | 142 (79.3%) |
| 75 Years and over | 53 (100.0%) | 27 (50.9%) |
| Total | 425 (34.4%) | 742 (60.0%) |
Disability Status by Sex by Age in Hasley Canyon
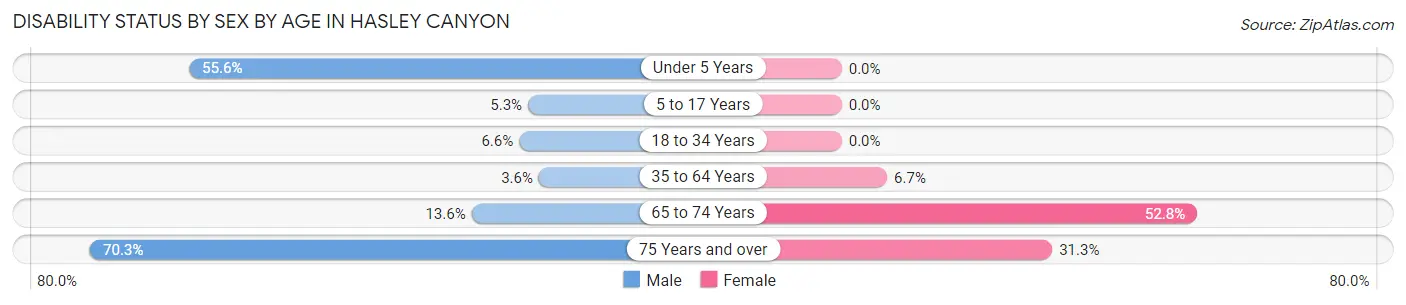
| Age Bracket | Male | Female |
| Under 5 Years | 15 (55.6%) | 0 (0.0%) |
| 5 to 17 Years | 14 (5.3%) | 0 (0.0%) |
| 18 to 34 Years | 5 (6.6%) | 0 (0.0%) |
| 35 to 64 Years | 9 (3.6%) | 13 (6.7%) |
| 65 to 74 Years | 12 (13.6%) | 48 (52.7%) |
| 75 Years and over | 26 (70.3%) | 5 (31.2%) |
Disability Class by Sex by Age in Hasley Canyon
Disability Class: Hearing Difficulty
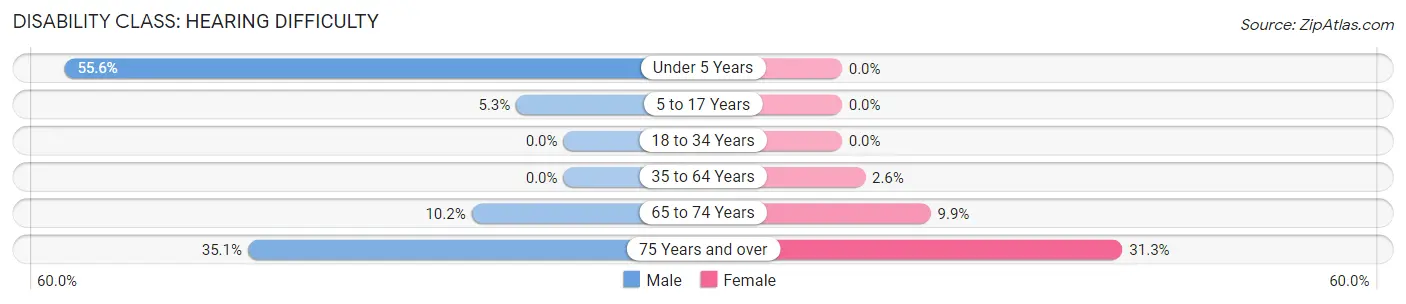
| Age Bracket | Male | Female |
| Under 5 Years | 15 (55.6%) | 0 (0.0%) |
| 5 to 17 Years | 14 (5.3%) | 0 (0.0%) |
| 18 to 34 Years | 0 (0.0%) | 0 (0.0%) |
| 35 to 64 Years | 0 (0.0%) | 5 (2.6%) |
| 65 to 74 Years | 9 (10.2%) | 9 (9.9%) |
| 75 Years and over | 13 (35.1%) | 5 (31.2%) |
Disability Class: Vision Difficulty
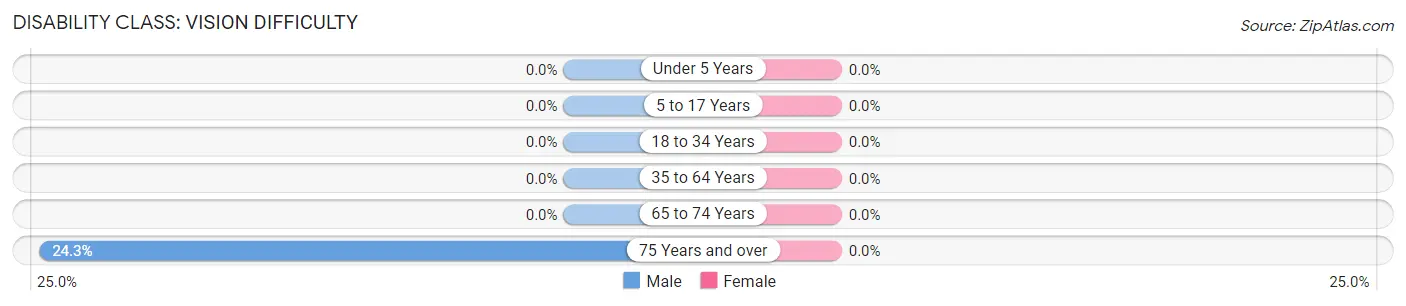
| Age Bracket | Male | Female |
| Under 5 Years | 0 (0.0%) | 0 (0.0%) |
| 5 to 17 Years | 0 (0.0%) | 0 (0.0%) |
| 18 to 34 Years | 0 (0.0%) | 0 (0.0%) |
| 35 to 64 Years | 0 (0.0%) | 0 (0.0%) |
| 65 to 74 Years | 0 (0.0%) | 0 (0.0%) |
| 75 Years and over | 9 (24.3%) | 0 (0.0%) |
Disability Class: Cognitive Difficulty
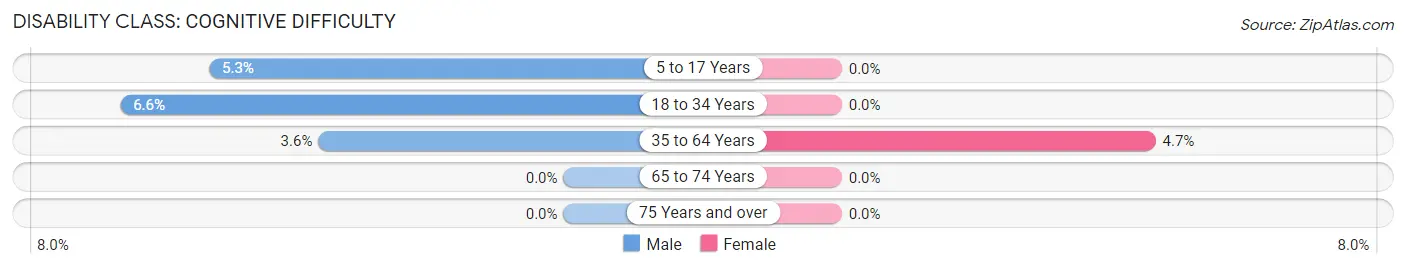
| Age Bracket | Male | Female |
| 5 to 17 Years | 14 (5.3%) | 0 (0.0%) |
| 18 to 34 Years | 5 (6.6%) | 0 (0.0%) |
| 35 to 64 Years | 9 (3.6%) | 9 (4.7%) |
| 65 to 74 Years | 0 (0.0%) | 0 (0.0%) |
| 75 Years and over | 0 (0.0%) | 0 (0.0%) |
Disability Class: Ambulatory Difficulty
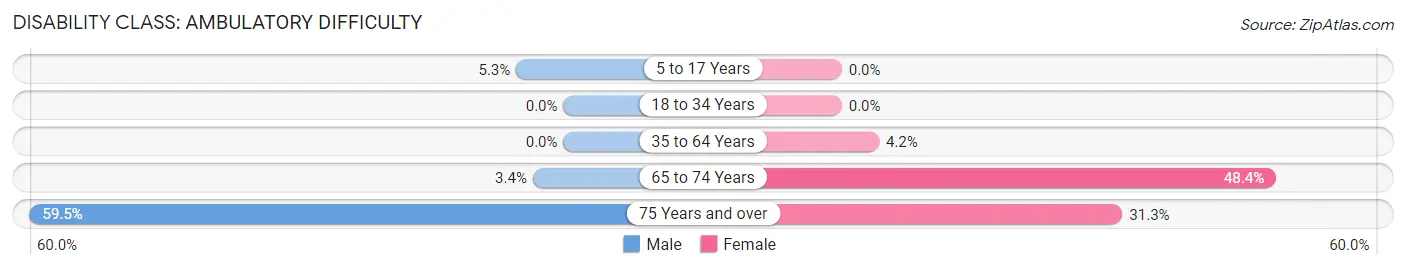
| Age Bracket | Male | Female |
| 5 to 17 Years | 14 (5.3%) | 0 (0.0%) |
| 18 to 34 Years | 0 (0.0%) | 0 (0.0%) |
| 35 to 64 Years | 0 (0.0%) | 8 (4.2%) |
| 65 to 74 Years | 3 (3.4%) | 44 (48.3%) |
| 75 Years and over | 22 (59.5%) | 5 (31.2%) |
Disability Class: Self-Care Difficulty
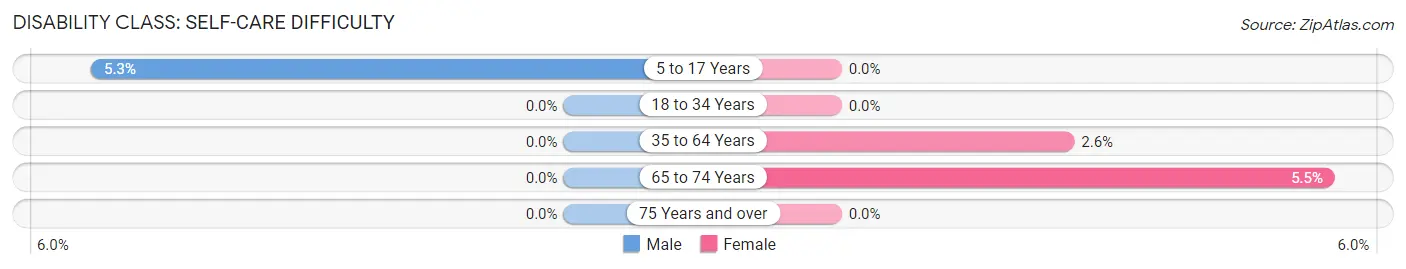
| Age Bracket | Male | Female |
| 5 to 17 Years | 14 (5.3%) | 0 (0.0%) |
| 18 to 34 Years | 0 (0.0%) | 0 (0.0%) |
| 35 to 64 Years | 0 (0.0%) | 5 (2.6%) |
| 65 to 74 Years | 0 (0.0%) | 5 (5.5%) |
| 75 Years and over | 0 (0.0%) | 0 (0.0%) |
Technology Access in Hasley Canyon
Computing Device Access in Hasley Canyon
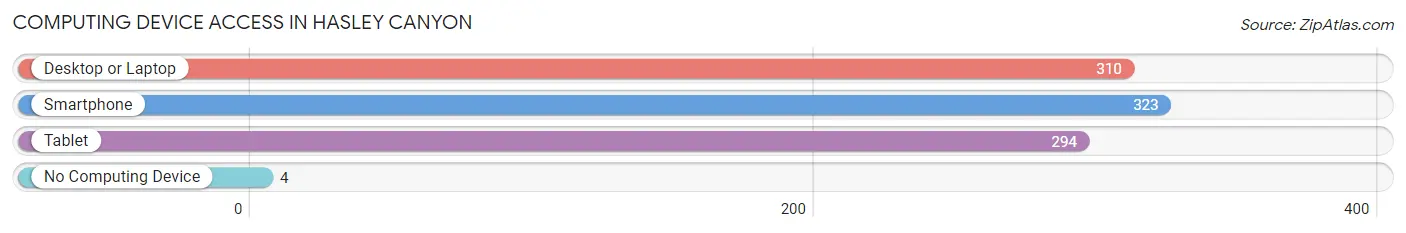
| Device Type | # Households | % Households |
| Desktop or Laptop | 310 | 86.4% |
| Smartphone | 323 | 90.0% |
| Tablet | 294 | 81.9% |
| No Computing Device | 4 | 1.1% |
| Total | 359 | 100.0% |
Internet Access in Hasley Canyon
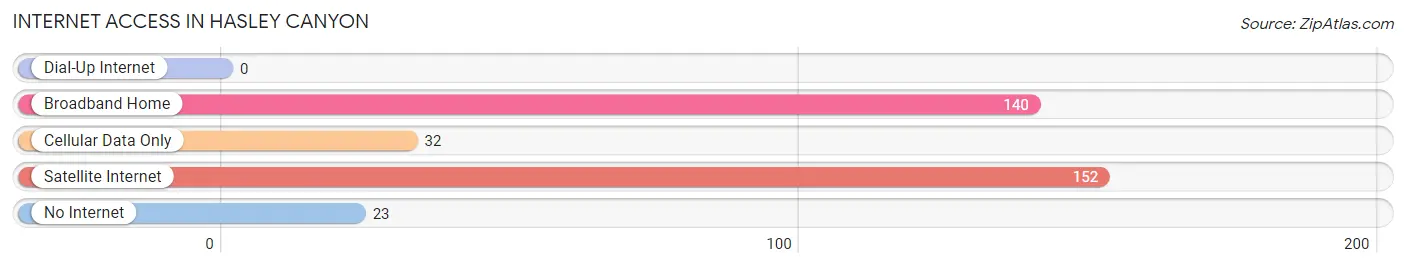
| Internet Type | # Households | % Households |
| Dial-Up Internet | 0 | 0.0% |
| Broadband Home | 140 | 39.0% |
| Cellular Data Only | 32 | 8.9% |
| Satellite Internet | 152 | 42.3% |
| No Internet | 23 | 6.4% |
| Total | 359 | 100.0% |
Hasley Canyon Summary
Hasley Canyon is a small unincorporated community located in the Santa Clarita Valley of Los Angeles County, California. It is situated in the foothills of the Santa Susana Mountains, approximately 30 miles northwest of downtown Los Angeles. The community is bordered by the cities of Santa Clarita and Valencia to the south, and the city of Castaic to the north.
History
The area now known as Hasley Canyon was originally inhabited by the Tataviam people, a Native American tribe that lived in the Santa Clarita Valley for thousands of years. The Tataviam were eventually displaced by Spanish settlers in the late 18th century. The area was then part of the Rancho San Francisco land grant, which was granted to Francisco Lopez in 1839.
In the late 19th century, the area was settled by homesteaders, who established small farms and ranches. The area was known as Hasley Canyon after the Hasley family, who were among the first settlers in the area. The Hasley family operated a small store in the canyon, which served as a gathering place for the local community.
Geography
Hasley Canyon is located in the Santa Clarita Valley of Los Angeles County, California. It is situated in the foothills of the Santa Susana Mountains, approximately 30 miles northwest of downtown Los Angeles. The community is bordered by the cities of Santa Clarita and Valencia to the south, and the city of Castaic to the north.
The area is characterized by rolling hills and canyons, with elevations ranging from 1,000 to 2,000 feet. The climate is semi-arid, with hot summers and mild winters. The area receives an average of 15 inches of rain per year.
Economy
The economy of Hasley Canyon is largely based on agriculture. The area is home to several small farms and ranches, which produce a variety of crops, including citrus fruits, avocados, and olives. The area is also home to several wineries, which produce a variety of wines.
In addition to agriculture, the area is home to several small businesses, including restaurants, retail stores, and auto repair shops. The area is also home to several light industrial businesses, including a plastics factory and a metal fabrication shop.
Demographics
As of the 2010 census, the population of Hasley Canyon was 1,845. The racial makeup of the area was 79.3% White, 8.2% Hispanic or Latino, 6.2% Asian, and 4.3% African American. The median household income was $68,750, and the median home value was $521,000.
Conclusion
Hasley Canyon is a small unincorporated community located in the Santa Clarita Valley of Los Angeles County, California. It is situated in the foothills of the Santa Susana Mountains, approximately 30 miles northwest of downtown Los Angeles. The area was originally inhabited by the Tataviam people, and was later settled by homesteaders in the late 19th century. The economy of Hasley Canyon is largely based on agriculture, with several small farms and ranches producing a variety of crops. The area is also home to several small businesses, including restaurants, retail stores, and auto repair shops. As of the 2010 census, the population of Hasley Canyon was 1,845. The racial makeup of the area was 79.3% White, 8.2% Hispanic or Latino, 6.2% Asian, and 4.3% African American.
Common Questions
What is Per Capita Income in Hasley Canyon?
Per Capita income in Hasley Canyon is $44,817.
What is the Median Family Income in Hasley Canyon?
Median Family Income in Hasley Canyon is $134,375.
What is the Median Household income in Hasley Canyon?
Median Household Income in Hasley Canyon is $132,875.
What is Income or Wage Gap in Hasley Canyon?
Income or Wage Gap in Hasley Canyon is 37.4%.
Women in Hasley Canyon earn 62.6 cents for every dollar earned by a man.
What is Inequality or Gini Index in Hasley Canyon?
Inequality or Gini Index in Hasley Canyon is 0.42.
What is the Total Population of Hasley Canyon?
Total Population of Hasley Canyon is 1,236.
What is the Total Male Population of Hasley Canyon?
Total Male Population of Hasley Canyon is 741.
What is the Total Female Population of Hasley Canyon?
Total Female Population of Hasley Canyon is 495.
What is the Ratio of Males per 100 Females in Hasley Canyon?
There are 149.70 Males per 100 Females in Hasley Canyon.
What is the Ratio of Females per 100 Males in Hasley Canyon?
There are 66.80 Females per 100 Males in Hasley Canyon.
What is the Median Population Age in Hasley Canyon?
Median Population Age in Hasley Canyon is 40.7 Years.
What is the Average Family Size in Hasley Canyon
Average Family Size in Hasley Canyon is 3.6 People.
What is the Average Household Size in Hasley Canyon
Average Household Size in Hasley Canyon is 3.4 People.
How Large is the Labor Force in Hasley Canyon?
There are 579 People in the Labor Forcein in Hasley Canyon.
What is the Percentage of People in the Labor Force in Hasley Canyon?
65.3% of People are in the Labor Force in Hasley Canyon.
What is the Unemployment Rate in Hasley Canyon?
Unemployment Rate in Hasley Canyon is 17.6%.