Mecca, CA Map & Demographics
Mecca Map
Mecca Overview
$19,496
PER CAPITA INCOME
$54,821
AVG FAMILY INCOME
$38,411
AVG HOUSEHOLD INCOME
39.9%
WAGE / INCOME GAP [ % ]
60.1¢/ $1
WAGE / INCOME GAP [ $ ]
0.44
INEQUALITY / GINI INDEX
6,313
TOTAL POPULATION
3,401
MALE POPULATION
2,912
FEMALE POPULATION
116.79
MALES / 100 FEMALES
85.62
FEMALES / 100 MALES
38.8
MEDIAN AGE
3.8
AVG FAMILY SIZE
2.8
AVG HOUSEHOLD SIZE
3,689
LABOR FORCE [ PEOPLE ]
68.5%
PERCENT IN LABOR FORCE
10.5%
UNEMPLOYMENT RATE
Mecca Zip Codes
Mecca Area Codes
Income in Mecca
Income Overview in Mecca
Per Capita Income in Mecca is $19,496, while median incomes of families and households are $54,821 and $38,411 respectively.
| Characteristic | Number | Measure |
| Per Capita Income | 6,313 | $19,496 |
| Median Family Income | 1,380 | $54,821 |
| Mean Family Income | 1,380 | $66,267 |
| Median Household Income | 2,240 | $38,411 |
| Mean Household Income | 2,240 | $50,305 |
| Income Deficit | 1,380 | $0 |
| Wage / Income Gap (%) | 6,313 | 39.89% |
| Wage / Income Gap ($) | 6,313 | 60.11¢ per $1 |
| Gini / Inequality Index | 6,313 | 0.44 |
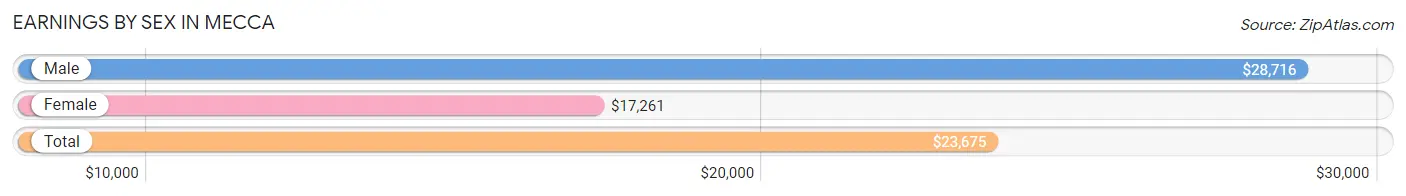
Earnings by Sex in Mecca
Average Earnings in Mecca are $23,675, $28,716 for men and $17,261 for women, a difference of 39.9%.
| Sex | Number | Average Earnings |
| Male | 2,296 (62.7%) | $28,716 |
| Female | 1,368 (37.3%) | $17,261 |
| Total | 3,664 (100.0%) | $23,675 |
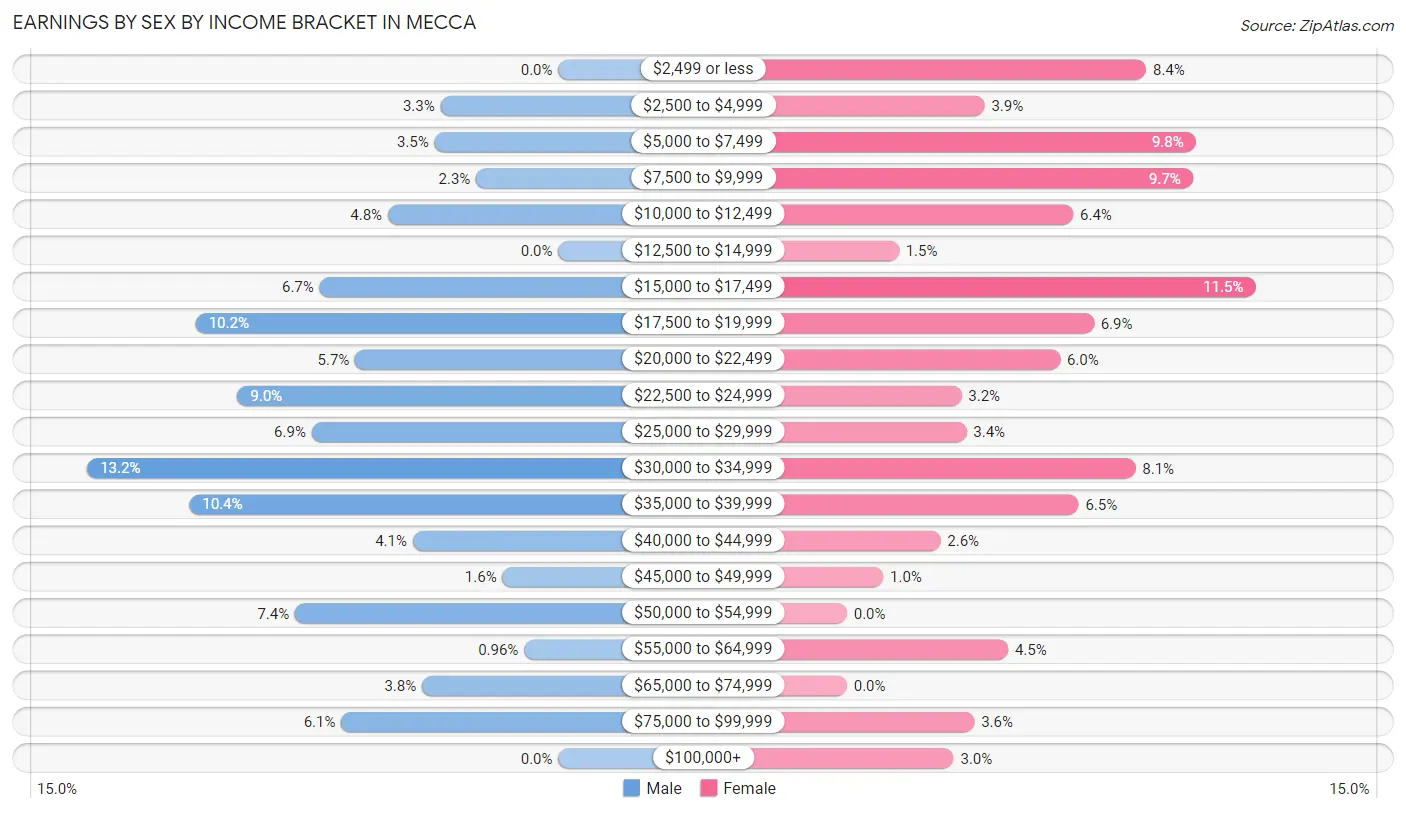
Earnings by Sex by Income Bracket in Mecca
The most common earnings brackets in Mecca are $30,000 to $34,999 for men (304 | 13.2%) and $15,000 to $17,499 for women (157 | 11.5%).
| Income | Male | Female |
| $2,499 or less | 0 (0.0%) | 115 (8.4%) |
| $2,500 to $4,999 | 76 (3.3%) | 53 (3.9%) |
| $5,000 to $7,499 | 80 (3.5%) | 134 (9.8%) |
| $7,500 to $9,999 | 53 (2.3%) | 133 (9.7%) |
| $10,000 to $12,499 | 110 (4.8%) | 87 (6.4%) |
| $12,500 to $14,999 | 0 (0.0%) | 20 (1.5%) |
| $15,000 to $17,499 | 154 (6.7%) | 157 (11.5%) |
| $17,500 to $19,999 | 234 (10.2%) | 95 (6.9%) |
| $20,000 to $22,499 | 131 (5.7%) | 82 (6.0%) |
| $22,500 to $24,999 | 207 (9.0%) | 44 (3.2%) |
| $25,000 to $29,999 | 159 (6.9%) | 46 (3.4%) |
| $30,000 to $34,999 | 304 (13.2%) | 111 (8.1%) |
| $35,000 to $39,999 | 238 (10.4%) | 89 (6.5%) |
| $40,000 to $44,999 | 94 (4.1%) | 36 (2.6%) |
| $45,000 to $49,999 | 36 (1.6%) | 14 (1.0%) |
| $50,000 to $54,999 | 170 (7.4%) | 0 (0.0%) |
| $55,000 to $64,999 | 22 (1.0%) | 62 (4.5%) |
| $65,000 to $74,999 | 88 (3.8%) | 0 (0.0%) |
| $75,000 to $99,999 | 140 (6.1%) | 49 (3.6%) |
| $100,000+ | 0 (0.0%) | 41 (3.0%) |
| Total | 2,296 (100.0%) | 1,368 (100.0%) |
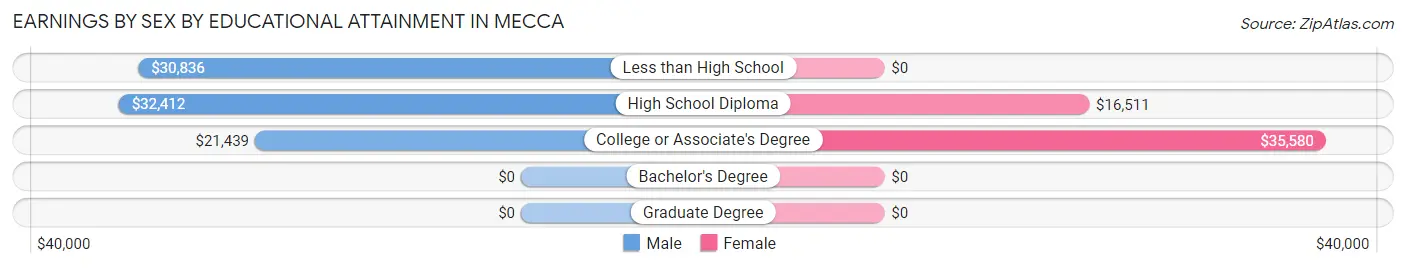
Earnings by Sex by Educational Attainment in Mecca
Average earnings in Mecca are $30,385 for men and $17,400 for women, a difference of 42.7%. Men with an educational attainment of high school diploma enjoy the highest average annual earnings of $32,412, while those with college or associate's degree education earn the least with $21,439. Women with an educational attainment of college or associate's degree earn the most with the average annual earnings of $35,580, while those with high school diploma education have the smallest earnings of $16,511.
| Educational Attainment | Male Income | Female Income |
| Less than High School | $30,836 | $0 |
| High School Diploma | $32,412 | $16,511 |
| College or Associate's Degree | $21,439 | $35,580 |
| Bachelor's Degree | - | - |
| Graduate Degree | - | - |
| Total | $30,385 | $17,400 |
Family Income in Mecca
Family Income Brackets in Mecca
According to the Mecca family income data, there are 317 families falling into the $35,000 to $49,999 income range, which is the most common income bracket and makes up 23.0% of all families.
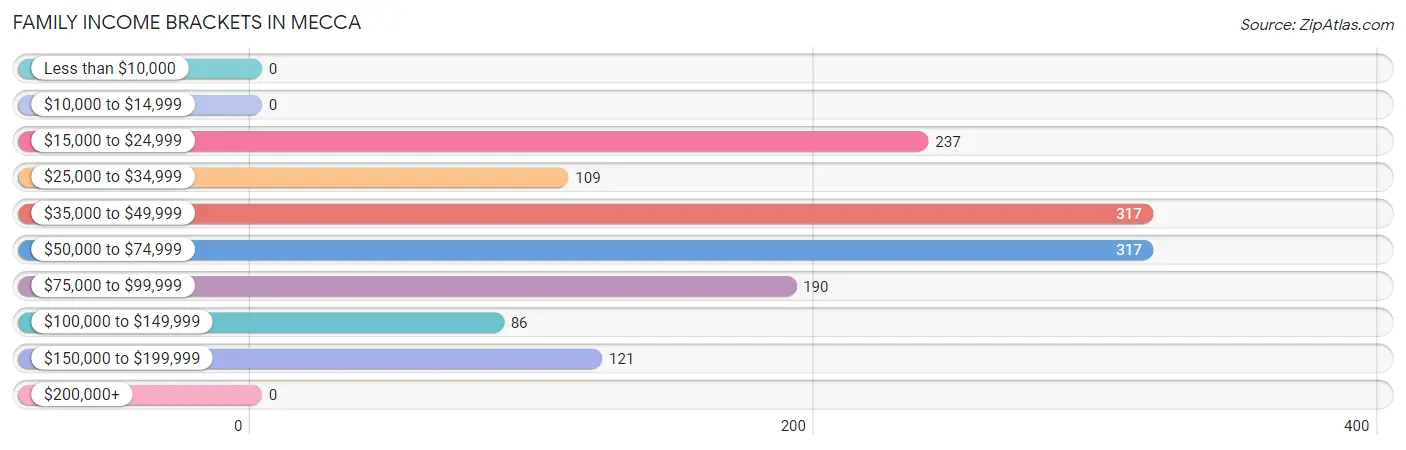
| Income Bracket | # Families | % Families |
| Less than $10,000 | 0 | 0.0% |
| $10,000 to $14,999 | 0 | 0.0% |
| $15,000 to $24,999 | 237 | 17.2% |
| $25,000 to $34,999 | 109 | 7.9% |
| $35,000 to $49,999 | 317 | 23.0% |
| $50,000 to $74,999 | 317 | 23.0% |
| $75,000 to $99,999 | 190 | 13.8% |
| $100,000 to $149,999 | 86 | 6.2% |
| $150,000 to $199,999 | 121 | 8.8% |
| $200,000+ | 0 | 0.0% |
Family Income by Famaliy Size in Mecca
4-person families (274 | 19.9%) account for the highest median family income in Mecca with $75,385 per family, while 2-person families (601 | 43.5%) have the highest median income of $19,807 per family member.
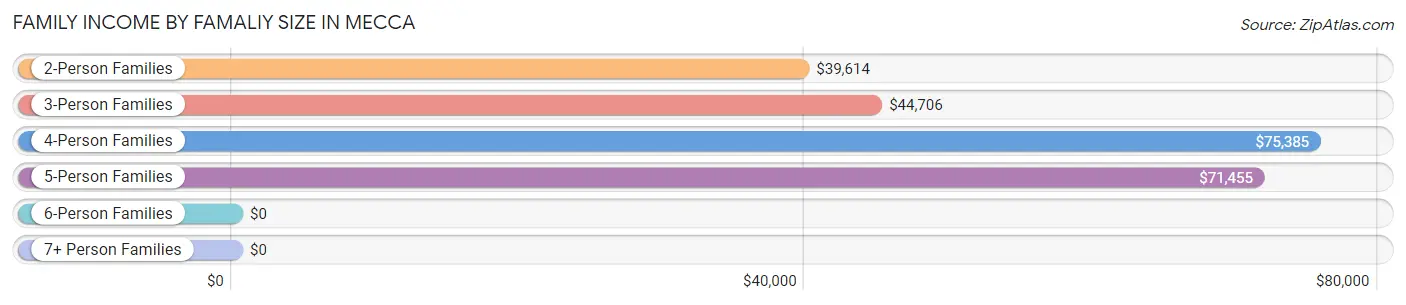
| Income Bracket | # Families | Median Income |
| 2-Person Families | 601 (43.5%) | $39,614 |
| 3-Person Families | 156 (11.3%) | $44,706 |
| 4-Person Families | 274 (19.9%) | $75,385 |
| 5-Person Families | 253 (18.3%) | $71,455 |
| 6-Person Families | 15 (1.1%) | $0 |
| 7+ Person Families | 81 (5.9%) | $0 |
| Total | 1,380 (100.0%) | $54,821 |
Family Income by Number of Earners in Mecca
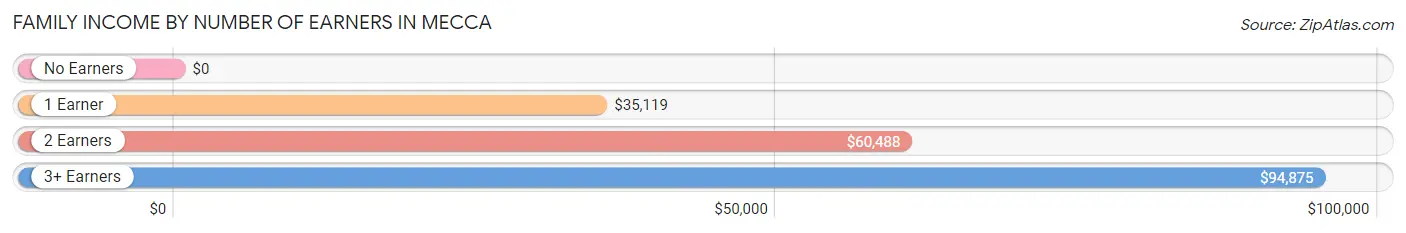
| Number of Earners | # Families | Median Income |
| No Earners | 34 (2.5%) | $0 |
| 1 Earner | 366 (26.5%) | $35,119 |
| 2 Earners | 686 (49.7%) | $60,488 |
| 3+ Earners | 294 (21.3%) | $94,875 |
| Total | 1,380 (100.0%) | $54,821 |
Household Income in Mecca
Household Income Brackets in Mecca
With 562 households falling in the category, the $15,000 to $24,999 income range is the most frequent in Mecca, accounting for 25.1% of all households.
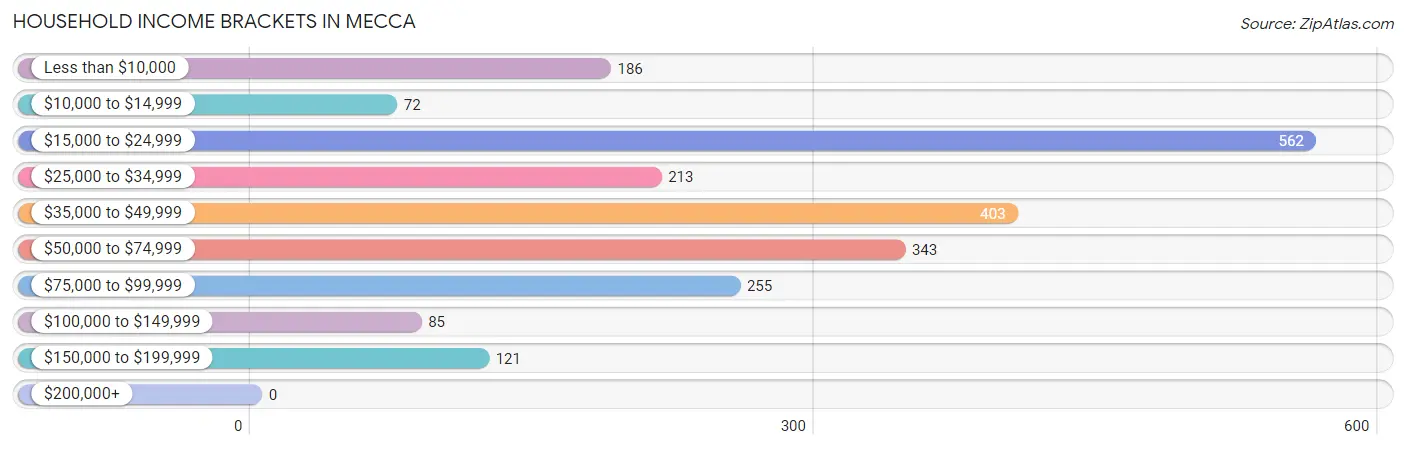
| Income Bracket | # Households | % Households |
| Less than $10,000 | 186 | 8.3% |
| $10,000 to $14,999 | 72 | 3.2% |
| $15,000 to $24,999 | 562 | 25.1% |
| $25,000 to $34,999 | 213 | 9.5% |
| $35,000 to $49,999 | 403 | 18.0% |
| $50,000 to $74,999 | 343 | 15.3% |
| $75,000 to $99,999 | 255 | 11.4% |
| $100,000 to $149,999 | 85 | 3.8% |
| $150,000 to $199,999 | 121 | 5.4% |
| $200,000+ | 0 | 0.0% |
Household Income by Householder Age in Mecca
The median household income in Mecca is $38,411, with the highest median household income of $54,375 found in the 25 to 44 years age bracket for the primary householder. A total of 559 households (25.0%) fall into this category. Meanwhile, the 15 to 24 years age bracket for the primary householder has the lowest median household income of $0, with 30 households (1.3%) in this group.
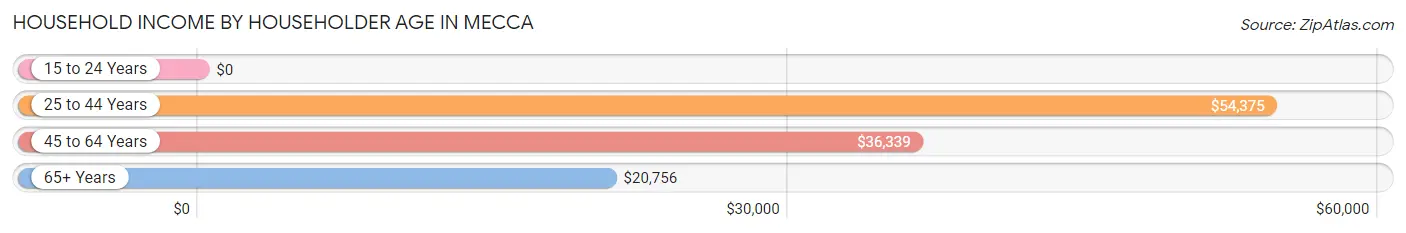
| Income Bracket | # Households | Median Income |
| 15 to 24 Years | 30 (1.3%) | $0 |
| 25 to 44 Years | 559 (25.0%) | $54,375 |
| 45 to 64 Years | 1,261 (56.3%) | $36,339 |
| 65+ Years | 390 (17.4%) | $20,756 |
| Total | 2,240 (100.0%) | $38,411 |
Poverty in Mecca
Income Below Poverty by Sex and Age in Mecca
With 8.8% poverty level for males and 22.8% for females among the residents of Mecca, 16 and 17 year old males and under 5 year old females are the most vulnerable to poverty, with 13 males (21.3%) and 82 females (100.0%) in their respective age groups living below the poverty level.
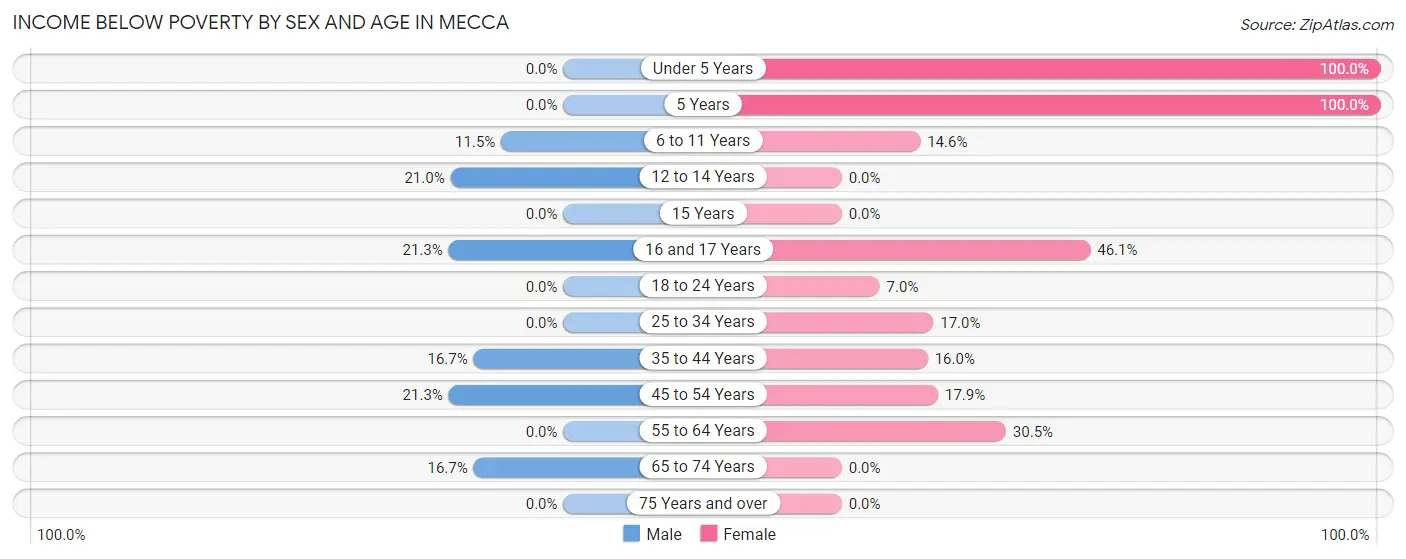
| Age Bracket | Male | Female |
| Under 5 Years | 0 (0.0%) | 82 (100.0%) |
| 5 Years | 0 (0.0%) | 38 (100.0%) |
| 6 to 11 Years | 21 (11.5%) | 45 (14.6%) |
| 12 to 14 Years | 22 (20.9%) | 0 (0.0%) |
| 15 Years | 0 (0.0%) | 0 (0.0%) |
| 16 and 17 Years | 13 (21.3%) | 119 (46.1%) |
| 18 to 24 Years | 0 (0.0%) | 18 (7.0%) |
| 25 to 34 Years | 0 (0.0%) | 64 (17.0%) |
| 35 to 44 Years | 95 (16.7%) | 41 (16.0%) |
| 45 to 54 Years | 79 (21.3%) | 80 (17.9%) |
| 55 to 64 Years | 0 (0.0%) | 177 (30.5%) |
| 65 to 74 Years | 62 (16.7%) | 0 (0.0%) |
| 75 Years and over | 0 (0.0%) | 0 (0.0%) |
| Total | 292 (8.8%) | 664 (22.8%) |
Income Above Poverty by Sex and Age in Mecca
According to the poverty statistics in Mecca, males aged under 5 years and females aged 12 to 14 years are the age groups that are most secure financially, with 100.0% of males and 100.0% of females in these age groups living above the poverty line.
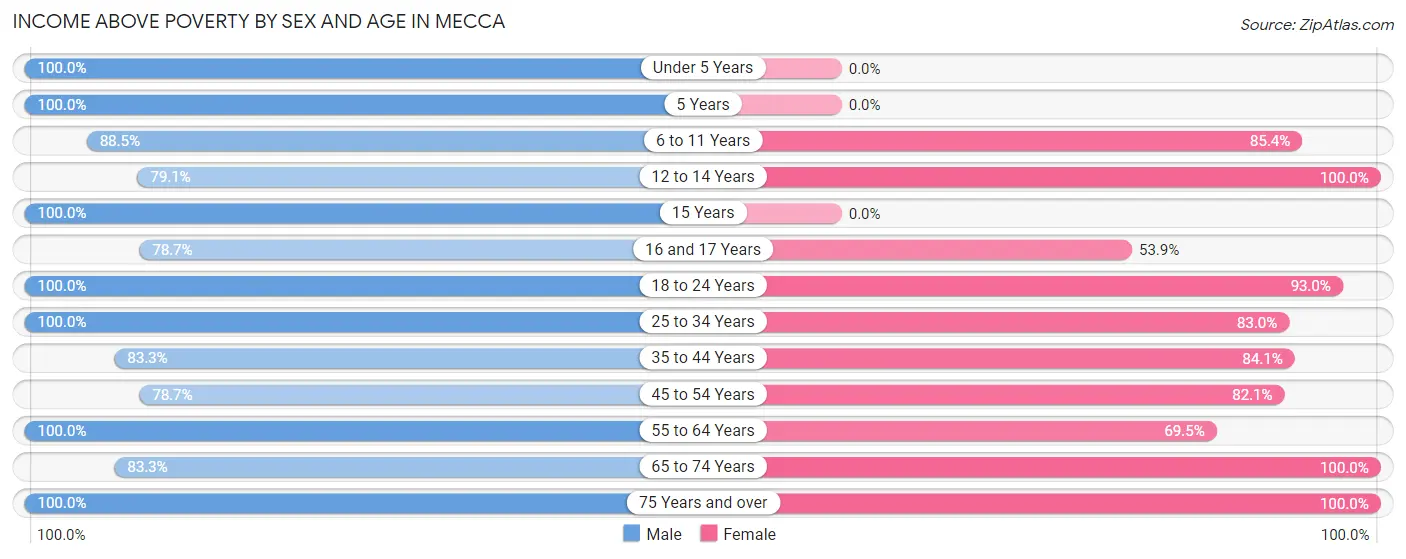
| Age Bracket | Male | Female |
| Under 5 Years | 75 (100.0%) | 0 (0.0%) |
| 5 Years | 12 (100.0%) | 0 (0.0%) |
| 6 to 11 Years | 161 (88.5%) | 264 (85.4%) |
| 12 to 14 Years | 83 (79.0%) | 36 (100.0%) |
| 15 Years | 12 (100.0%) | 0 (0.0%) |
| 16 and 17 Years | 48 (78.7%) | 139 (53.9%) |
| 18 to 24 Years | 343 (100.0%) | 238 (93.0%) |
| 25 to 34 Years | 703 (100.0%) | 313 (83.0%) |
| 35 to 44 Years | 475 (83.3%) | 216 (84.1%) |
| 45 to 54 Years | 292 (78.7%) | 368 (82.1%) |
| 55 to 64 Years | 458 (100.0%) | 404 (69.5%) |
| 65 to 74 Years | 310 (83.3%) | 204 (100.0%) |
| 75 Years and over | 60 (100.0%) | 66 (100.0%) |
| Total | 3,032 (91.2%) | 2,248 (77.2%) |
Income Below Poverty Among Married-Couple Families in Mecca
The poverty statistics for married-couple families in Mecca show that 10.4% or 98 of the total 942 families live below the poverty line. Families with 1 or 2 children have the highest poverty rate of 23.7%, comprising of 61 families. On the other hand, families with 3 or 4 children have the lowest poverty rate of 0.0%, which includes 0 families.
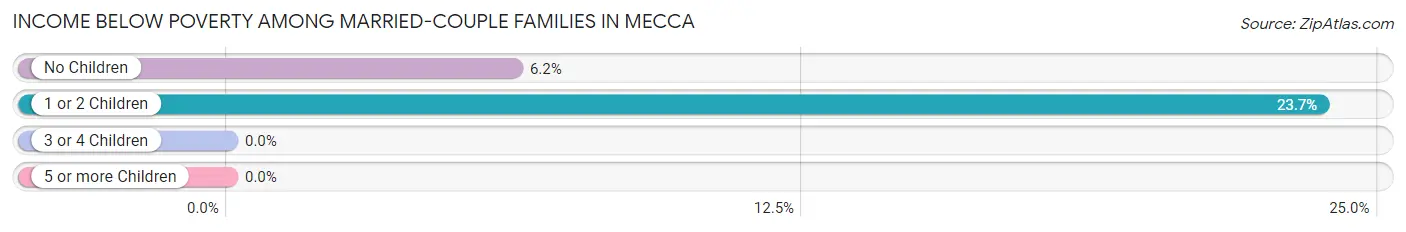
| Children | Above Poverty | Below Poverty |
| No Children | 560 (93.8%) | 37 (6.2%) |
| 1 or 2 Children | 196 (76.3%) | 61 (23.7%) |
| 3 or 4 Children | 88 (100.0%) | 0 (0.0%) |
| 5 or more Children | 0 (0.0%) | 0 (0.0%) |
| Total | 844 (89.6%) | 98 (10.4%) |
Income Below Poverty Among Single-Parent Households in Mecca
According to the poverty data in Mecca, 7.9% or 13 single-father households and 12.4% or 34 single-mother households are living below the poverty line. Among single-father households, those with no children have the highest poverty rate, with 13 households (10.3%) experiencing poverty. Likewise, among single-mother households, those with 3 or 4 children have the highest poverty rate, with 34 households (100.0%) falling below the poverty line.
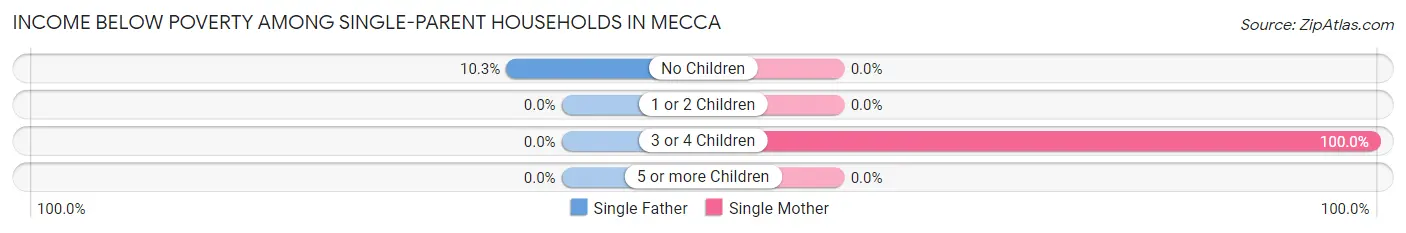
| Children | Single Father | Single Mother |
| No Children | 13 (10.3%) | 0 (0.0%) |
| 1 or 2 Children | 0 (0.0%) | 0 (0.0%) |
| 3 or 4 Children | 0 (0.0%) | 34 (100.0%) |
| 5 or more Children | 0 (0.0%) | 0 (0.0%) |
| Total | 13 (7.9%) | 34 (12.4%) |
Income Below Poverty Among Married-Couple vs Single-Parent Households in Mecca
The poverty data for Mecca shows that 98 of the married-couple family households (10.4%) and 47 of the single-parent households (10.7%) are living below the poverty level. Within the married-couple family households, those with 1 or 2 children have the highest poverty rate, with 61 households (23.7%) falling below the poverty line. Among the single-parent households, those with 3 or 4 children have the highest poverty rate, with 34 household (60.7%) living below poverty.
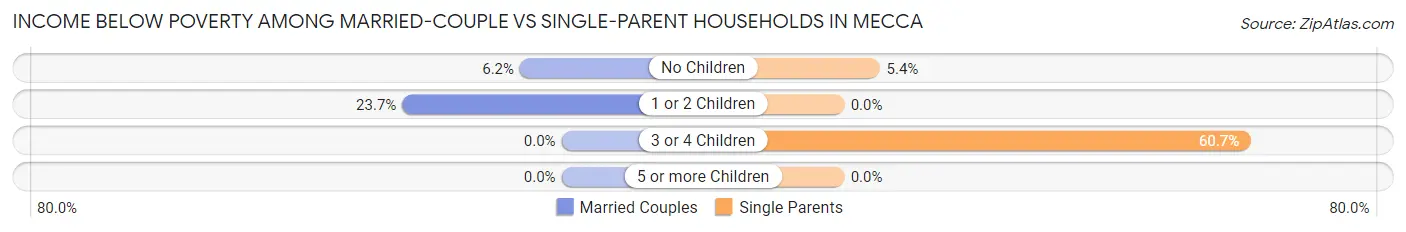
| Children | Married-Couple Families | Single-Parent Households |
| No Children | 37 (6.2%) | 13 (5.3%) |
| 1 or 2 Children | 61 (23.7%) | 0 (0.0%) |
| 3 or 4 Children | 0 (0.0%) | 34 (60.7%) |
| 5 or more Children | 0 (0.0%) | 0 (0.0%) |
| Total | 98 (10.4%) | 47 (10.7%) |
Race in Mecca
The most populous races in Mecca are Hispanic or Latino (6,187 | 98.0%), Some other Race (3,569 | 56.5%), and Two or more Races (2,404 | 38.1%).
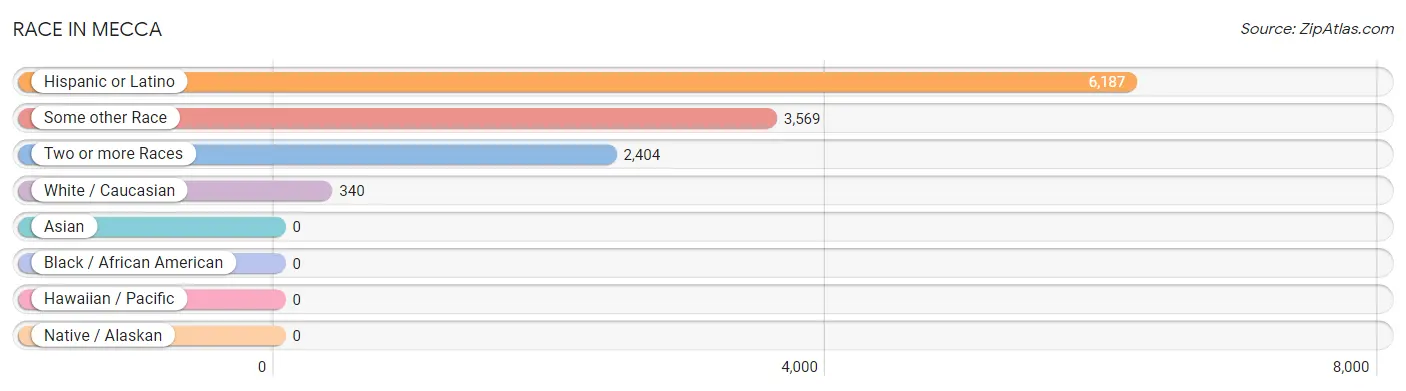
| Race | # Population | % Population |
| Asian | 0 | 0.0% |
| Black / African American | 0 | 0.0% |
| Hawaiian / Pacific | 0 | 0.0% |
| Hispanic or Latino | 6,187 | 98.0% |
| Native / Alaskan | 0 | 0.0% |
| White / Caucasian | 340 | 5.4% |
| Two or more Races | 2,404 | 38.1% |
| Some other Race | 3,569 | 56.5% |
| Total | 6,313 | 100.0% |
Ancestry in Mecca
The most populous ancestries reported in Mecca are Mexican (5,760 | 91.2%), Central American (269 | 4.3%), Salvadoran (145 | 2.3%), Guatemalan (124 | 2.0%), and American (103 | 1.6%), together accounting for 101.4% of all Mecca residents.
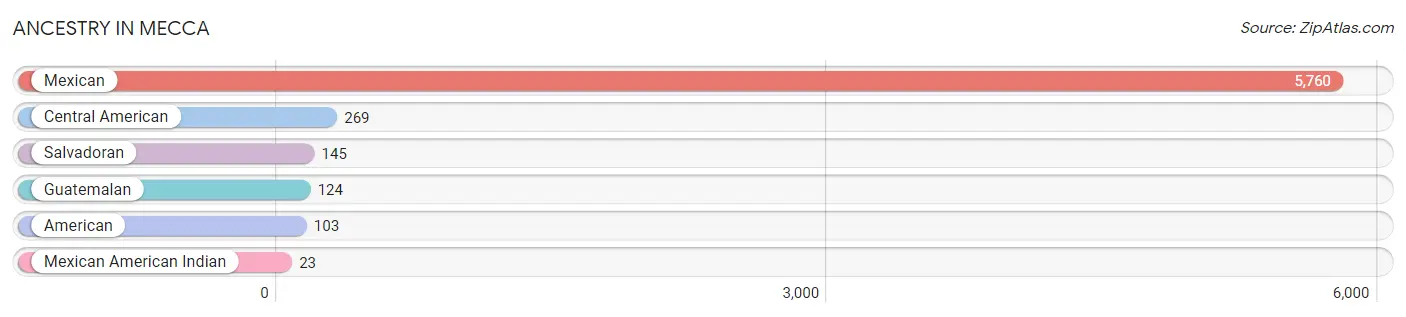
| Ancestry | # Population | % Population |
| American | 103 | 1.6% |
| Central American | 269 | 4.3% |
| Guatemalan | 124 | 2.0% |
| Mexican | 5,760 | 91.2% |
| Mexican American Indian | 23 | 0.4% |
| Salvadoran | 145 | 2.3% | View All 6 Rows |
Immigrants in Mecca
The most numerous immigrant groups reported in Mecca came from Latin America (3,714 | 58.8%), Central America (3,699 | 58.6%), Mexico (3,483 | 55.2%), El Salvador (168 | 2.7%), and Guatemala (48 | 0.8%), together accounting for 176.0% of all Mecca residents.
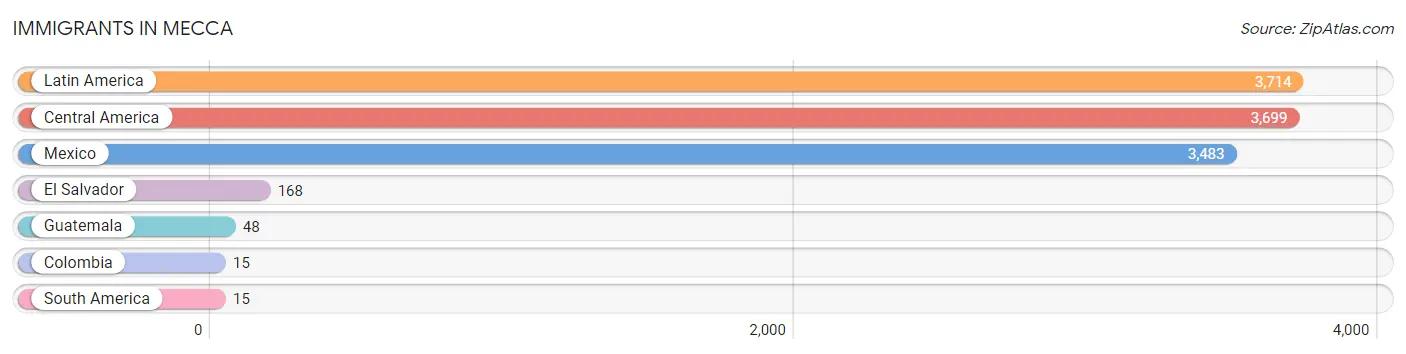
| Immigration Origin | # Population | % Population |
| Central America | 3,699 | 58.6% |
| Colombia | 15 | 0.2% |
| El Salvador | 168 | 2.7% |
| Guatemala | 48 | 0.8% |
| Latin America | 3,714 | 58.8% |
| Mexico | 3,483 | 55.2% |
| South America | 15 | 0.2% | View All 7 Rows |
Sex and Age in Mecca
Sex and Age in Mecca
The most populous age groups in Mecca are 30 to 34 Years (379 | 11.1%) for men and 55 to 59 Years (359 | 12.3%) for women.
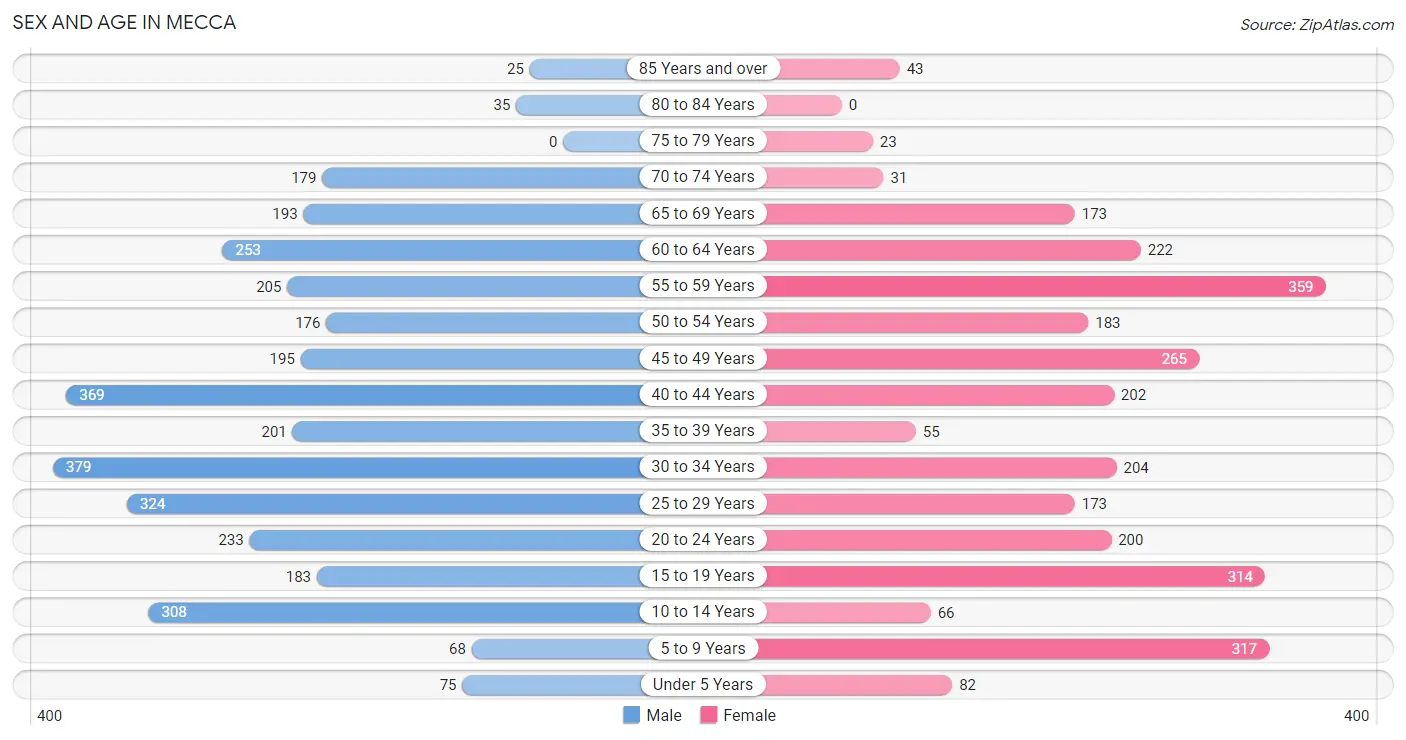
| Age Bracket | Male | Female |
| Under 5 Years | 75 (2.2%) | 82 (2.8%) |
| 5 to 9 Years | 68 (2.0%) | 317 (10.9%) |
| 10 to 14 Years | 308 (9.1%) | 66 (2.3%) |
| 15 to 19 Years | 183 (5.4%) | 314 (10.8%) |
| 20 to 24 Years | 233 (6.9%) | 200 (6.9%) |
| 25 to 29 Years | 324 (9.5%) | 173 (5.9%) |
| 30 to 34 Years | 379 (11.1%) | 204 (7.0%) |
| 35 to 39 Years | 201 (5.9%) | 55 (1.9%) |
| 40 to 44 Years | 369 (10.8%) | 202 (6.9%) |
| 45 to 49 Years | 195 (5.7%) | 265 (9.1%) |
| 50 to 54 Years | 176 (5.2%) | 183 (6.3%) |
| 55 to 59 Years | 205 (6.0%) | 359 (12.3%) |
| 60 to 64 Years | 253 (7.4%) | 222 (7.6%) |
| 65 to 69 Years | 193 (5.7%) | 173 (5.9%) |
| 70 to 74 Years | 179 (5.3%) | 31 (1.1%) |
| 75 to 79 Years | 0 (0.0%) | 23 (0.8%) |
| 80 to 84 Years | 35 (1.0%) | 0 (0.0%) |
| 85 Years and over | 25 (0.7%) | 43 (1.5%) |
| Total | 3,401 (100.0%) | 2,912 (100.0%) |
Families and Households in Mecca
Median Family Size in Mecca
The median family size in Mecca is 3.76 persons per family, with single female/mother families (273 | 19.8%) accounting for the largest median family size of 4.35 persons per family. On the other hand, single male/father families (165 | 12.0%) represent the smallest median family size with 3.12 persons per family.
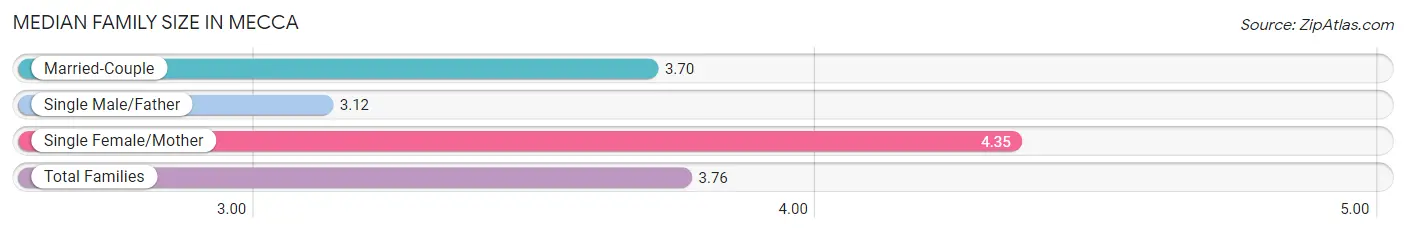
| Family Type | # Families | Family Size |
| Married-Couple | 942 (68.3%) | 3.70 |
| Single Male/Father | 165 (12.0%) | 3.12 |
| Single Female/Mother | 273 (19.8%) | 4.35 |
| Total Families | 1,380 (100.0%) | 3.76 |
Median Household Size in Mecca
The median household size in Mecca is 2.82 persons per household, with single female/mother households (273 | 12.2%) accounting for the largest median household size of 4.35 persons per household. non-family households (860 | 38.4%) represent the smallest median household size with 1.31 persons per household.
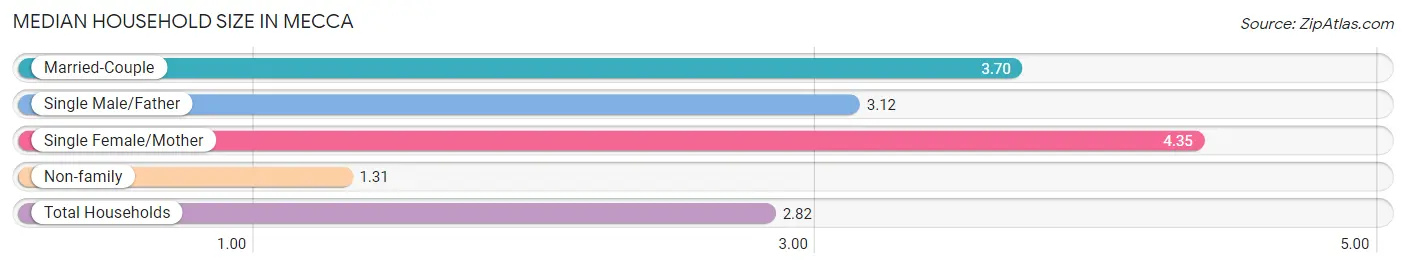
| Household Type | # Households | Household Size |
| Married-Couple | 942 (42.0%) | 3.70 |
| Single Male/Father | 165 (7.4%) | 3.12 |
| Single Female/Mother | 273 (12.2%) | 4.35 |
| Non-family | 860 (38.4%) | 1.31 |
| Total Households | 2,240 (100.0%) | 2.82 |
Household Size by Marriage Status in Mecca
Out of a total of 2,240 households in Mecca, 1,380 (61.6%) are family households, while 860 (38.4%) are nonfamily households. The most numerous type of family households are 2-person households, comprising 601, and the most common type of nonfamily households are 1-person households, comprising 749.
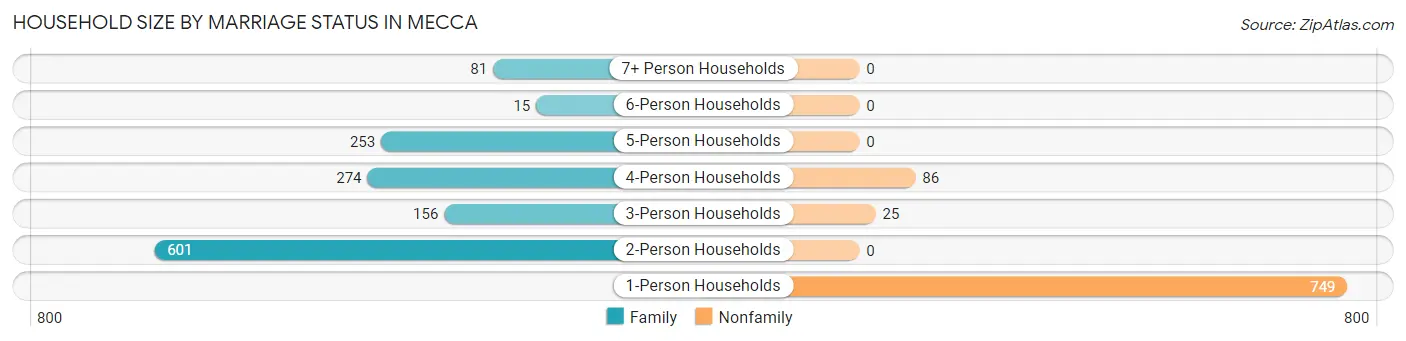
| Household Size | Family Households | Nonfamily Households |
| 1-Person Households | - | 749 (33.4%) |
| 2-Person Households | 601 (26.8%) | 0 (0.0%) |
| 3-Person Households | 156 (7.0%) | 25 (1.1%) |
| 4-Person Households | 274 (12.2%) | 86 (3.8%) |
| 5-Person Households | 253 (11.3%) | 0 (0.0%) |
| 6-Person Households | 15 (0.7%) | 0 (0.0%) |
| 7+ Person Households | 81 (3.6%) | 0 (0.0%) |
| Total | 1,380 (61.6%) | 860 (38.4%) |
Female Fertility in Mecca
Fertility by Age in Mecca
Average fertility rate in Mecca is 12.0 births per 1,000 women. Women in the age bracket of 20 to 34 years have the highest fertility rate with 29.0 births per 1,000 women. Women in the age bracket of 20 to 34 years acount for 100.0% of all women with births.
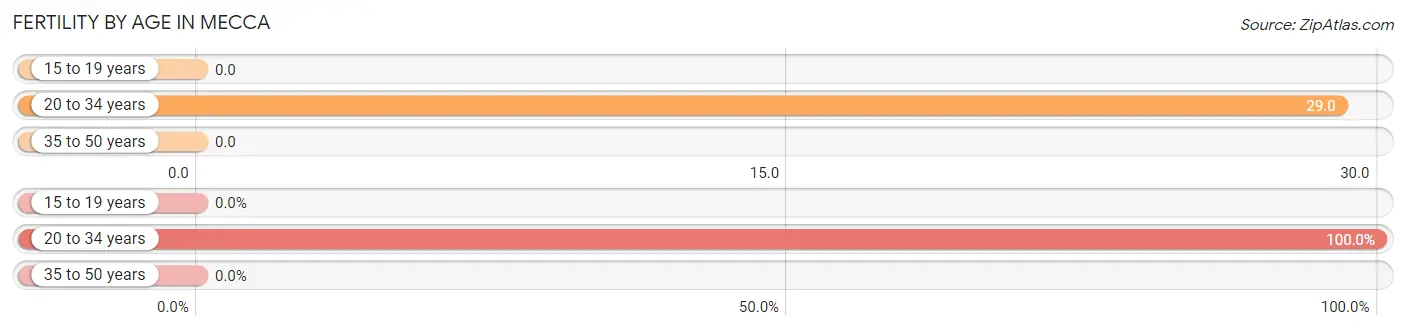
| Age Bracket | Women with Births | Births / 1,000 Women |
| 15 to 19 years | 0 (0.0%) | 0.0 |
| 20 to 34 years | 17 (100.0%) | 29.0 |
| 35 to 50 years | 0 (0.0%) | 0.0 |
| Total | 17 (100.0%) | 12.0 |
Fertility by Age by Marriage Status in Mecca
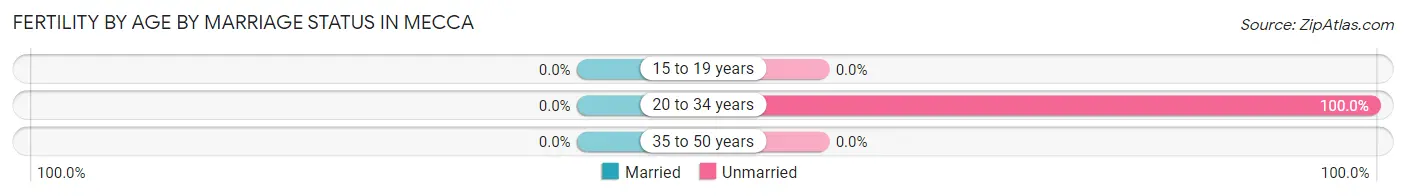
| Age Bracket | Married | Unmarried |
| 15 to 19 years | 0 (0.0%) | 0 (0.0%) |
| 20 to 34 years | 0 (0.0%) | 17 (100.0%) |
| 35 to 50 years | 0 (0.0%) | 0 (0.0%) |
| Total | 0 (0.0%) | 17 (100.0%) |
Fertility by Education in Mecca
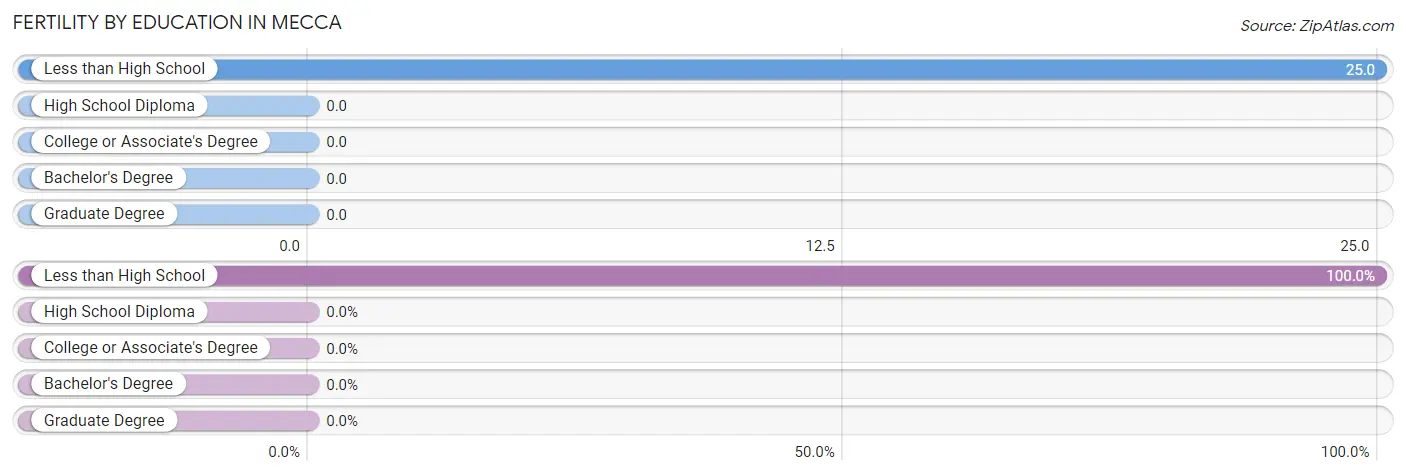
| Educational Attainment | Women with Births | Births / 1,000 Women |
| Less than High School | 17 (100.0%) | 25.0 |
| High School Diploma | 0 (0.0%) | 0.0 |
| College or Associate's Degree | 0 (0.0%) | 0.0 |
| Bachelor's Degree | 0 (0.0%) | 0.0 |
| Graduate Degree | 0 (0.0%) | 0.0 |
| Total | 17 (100.0%) | 12.0 |
Fertility by Education by Marriage Status in Mecca
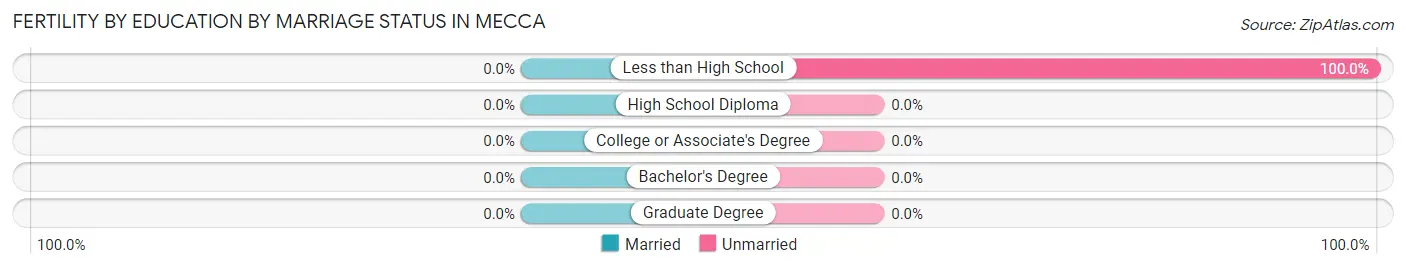
| Educational Attainment | Married | Unmarried |
| Less than High School | 0 (0.0%) | 17 (100.0%) |
| High School Diploma | 0 (0.0%) | 0 (0.0%) |
| College or Associate's Degree | 0 (0.0%) | 0 (0.0%) |
| Bachelor's Degree | 0 (0.0%) | 0 (0.0%) |
| Graduate Degree | 0 (0.0%) | 0 (0.0%) |
| Total | 0 (0.0%) | 17 (100.0%) |
Employment Characteristics in Mecca
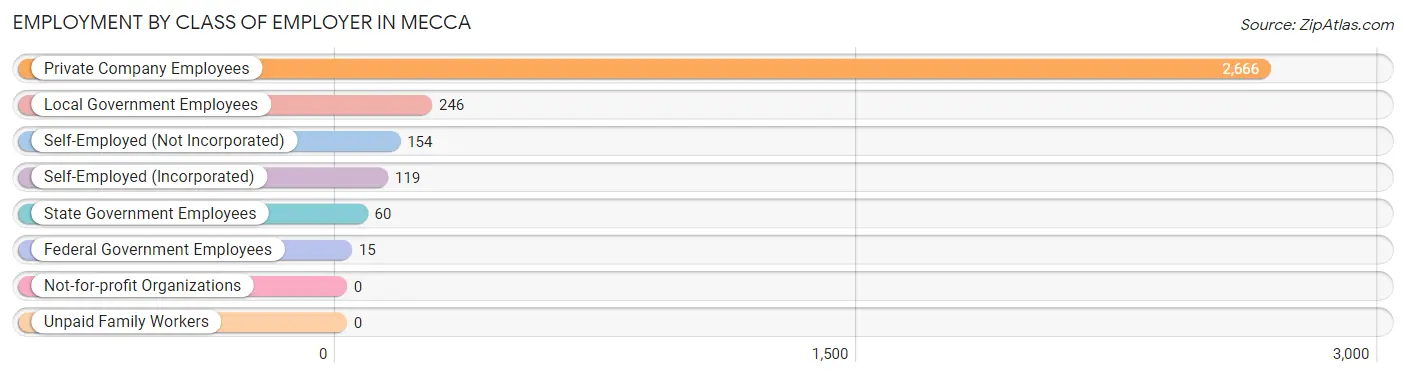
Employment by Class of Employer in Mecca
Among the 3,260 employed individuals in Mecca, private company employees (2,666 | 81.8%), local government employees (246 | 7.5%), and self-employed (not incorporated) (154 | 4.7%) make up the most common classes of employment.
| Employer Class | # Employees | % Employees |
| Private Company Employees | 2,666 | 81.8% |
| Self-Employed (Incorporated) | 119 | 3.6% |
| Self-Employed (Not Incorporated) | 154 | 4.7% |
| Not-for-profit Organizations | 0 | 0.0% |
| Local Government Employees | 246 | 7.5% |
| State Government Employees | 60 | 1.8% |
| Federal Government Employees | 15 | 0.5% |
| Unpaid Family Workers | 0 | 0.0% |
| Total | 3,260 | 100.0% |
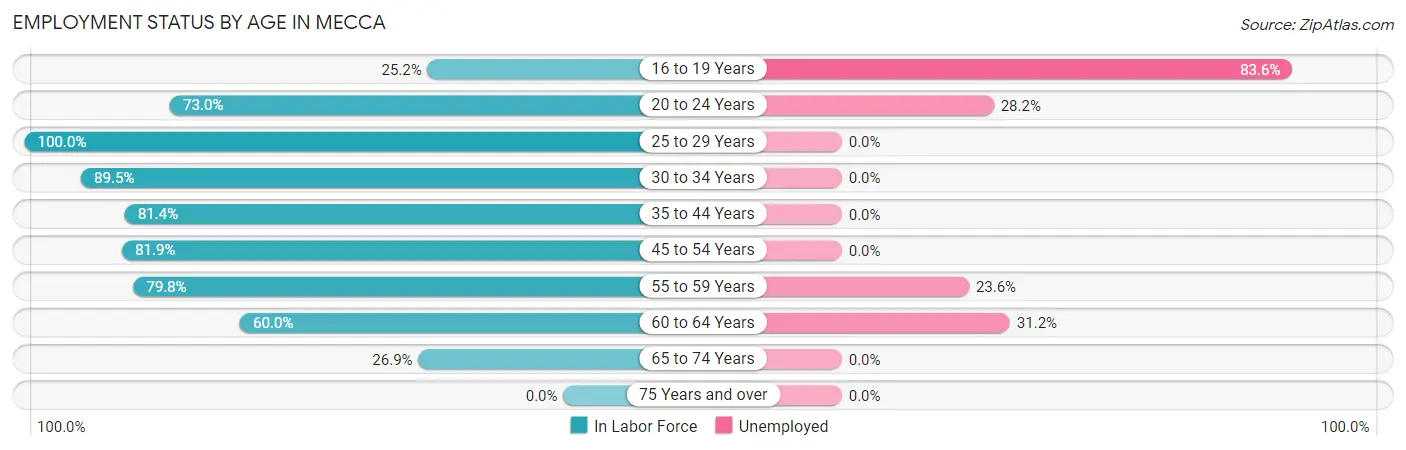
Employment Status by Age in Mecca
According to the labor force statistics for Mecca, out of the total population over 16 years of age (5,385), 68.5% or 3,689 individuals are in the labor force, with 10.5% or 387 of them unemployed. The age group with the highest labor force participation rate is 25 to 29 years, with 100.0% or 497 individuals in the labor force. Within the labor force, the 16 to 19 years age range has the highest percentage of unemployed individuals, with 83.6% or 102 of them being unemployed.
| Age Bracket | In Labor Force | Unemployed |
| 16 to 19 Years | 122 (25.2%) | 102 (83.6%) |
| 20 to 24 Years | 316 (73.0%) | 89 (28.2%) |
| 25 to 29 Years | 497 (100.0%) | 0 (0.0%) |
| 30 to 34 Years | 522 (89.5%) | 0 (0.0%) |
| 35 to 44 Years | 673 (81.4%) | 0 (0.0%) |
| 45 to 54 Years | 671 (81.9%) | 0 (0.0%) |
| 55 to 59 Years | 450 (79.8%) | 106 (23.6%) |
| 60 to 64 Years | 285 (60.0%) | 89 (31.2%) |
| 65 to 74 Years | 155 (26.9%) | 0 (0.0%) |
| 75 Years and over | 0 (0.0%) | 0 (0.0%) |
| Total | 3,689 (68.5%) | 387 (10.5%) |
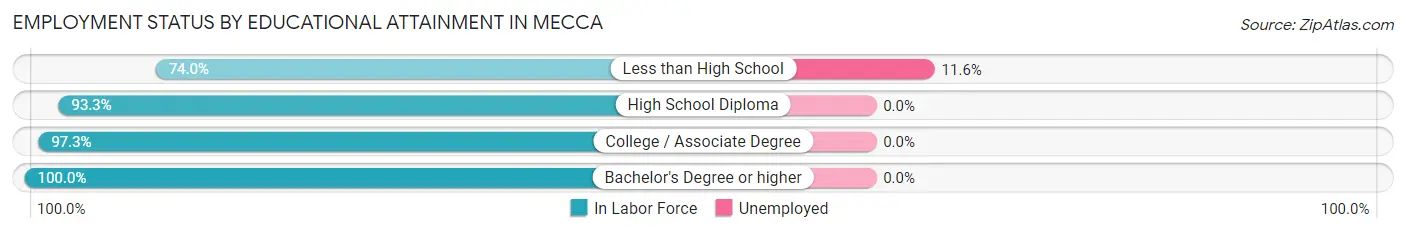
Employment Status by Educational Attainment in Mecca
According to labor force statistics for Mecca, 82.3% of individuals (3,099) out of the total population between 25 and 64 years of age (3,765) are in the labor force, with 6.3% or 195 of them being unemployed. The group with the highest labor force participation rate are those with the educational attainment of bachelor's degree or higher, with 100.0% or 60 individuals in the labor force. Within the labor force, individuals with less than high school education have the highest percentage of unemployment, with 11.6% or 195 of them being unemployed.
| Educational Attainment | In Labor Force | Unemployed |
| Less than High School | 1,684 (74.0%) | 264 (11.6%) |
| High School Diploma | 854 (93.3%) | 0 (0.0%) |
| College / Associate Degree | 500 (97.3%) | 0 (0.0%) |
| Bachelor's Degree or higher | 60 (100.0%) | 0 (0.0%) |
| Total | 3,099 (82.3%) | 237 (6.3%) |
Employment Occupations by Sex in Mecca
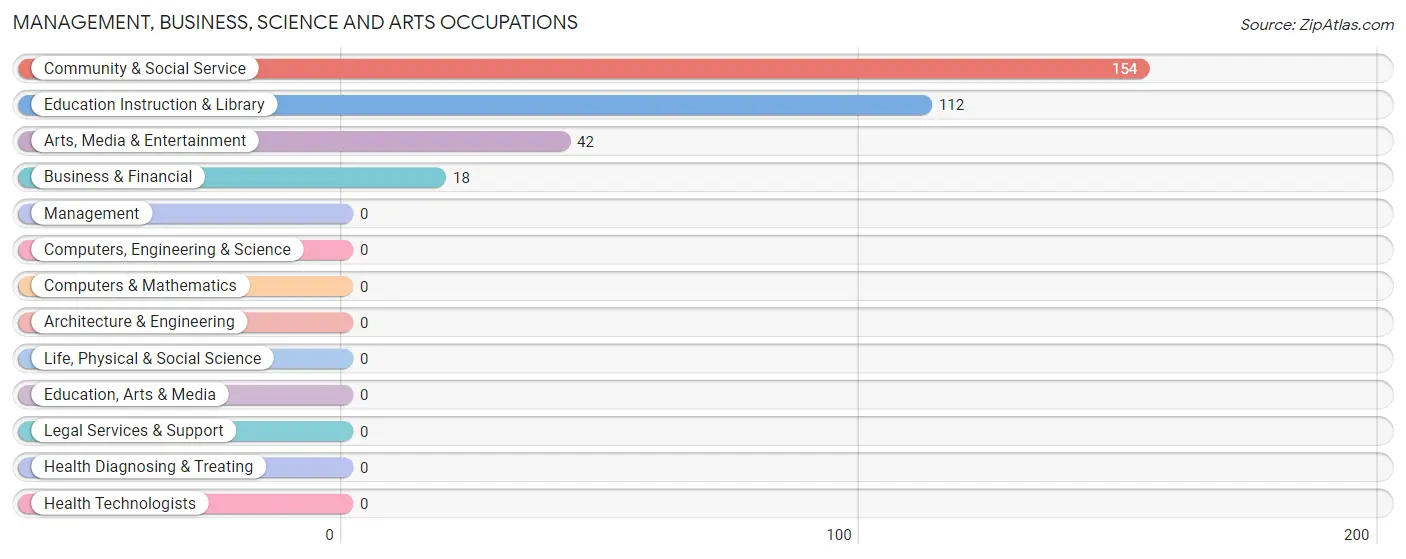
Management, Business, Science and Arts Occupations
The most common Management, Business, Science and Arts occupations in Mecca are Community & Social Service (154 | 4.7%), Education Instruction & Library (112 | 3.4%), Arts, Media & Entertainment (42 | 1.3%), and Business & Financial (18 | 0.5%).
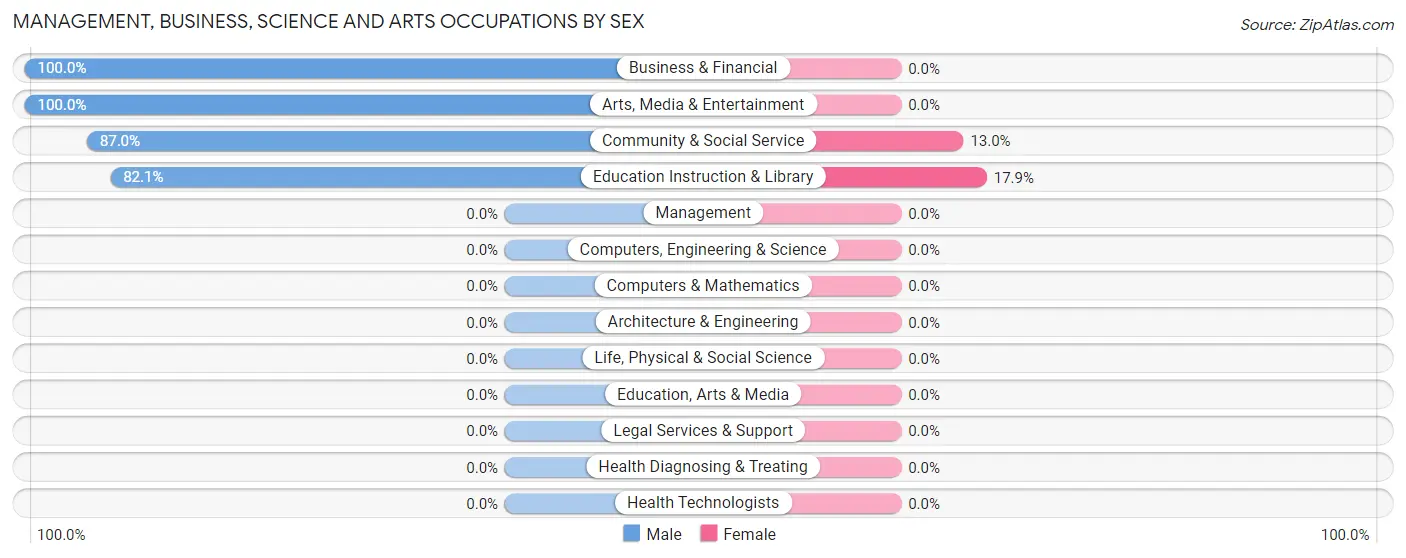
Management, Business, Science and Arts Occupations by Sex
Within the Management, Business, Science and Arts occupations in Mecca, the most male-oriented occupations are Business & Financial (100.0%), Arts, Media & Entertainment (100.0%), and Community & Social Service (87.0%), while the most female-oriented occupations are Education Instruction & Library (17.9%), and Community & Social Service (13.0%).
| Occupation | Male | Female |
| Management | 0 (0.0%) | 0 (0.0%) |
| Business & Financial | 18 (100.0%) | 0 (0.0%) |
| Computers, Engineering & Science | 0 (0.0%) | 0 (0.0%) |
| Computers & Mathematics | 0 (0.0%) | 0 (0.0%) |
| Architecture & Engineering | 0 (0.0%) | 0 (0.0%) |
| Life, Physical & Social Science | 0 (0.0%) | 0 (0.0%) |
| Community & Social Service | 134 (87.0%) | 20 (13.0%) |
| Education, Arts & Media | 0 (0.0%) | 0 (0.0%) |
| Legal Services & Support | 0 (0.0%) | 0 (0.0%) |
| Education Instruction & Library | 92 (82.1%) | 20 (17.9%) |
| Arts, Media & Entertainment | 42 (100.0%) | 0 (0.0%) |
| Health Diagnosing & Treating | 0 (0.0%) | 0 (0.0%) |
| Health Technologists | 0 (0.0%) | 0 (0.0%) |
| Total (Category) | 152 (88.4%) | 20 (11.6%) |
| Total (Overall) | 2,129 (64.4%) | 1,176 (35.6%) |
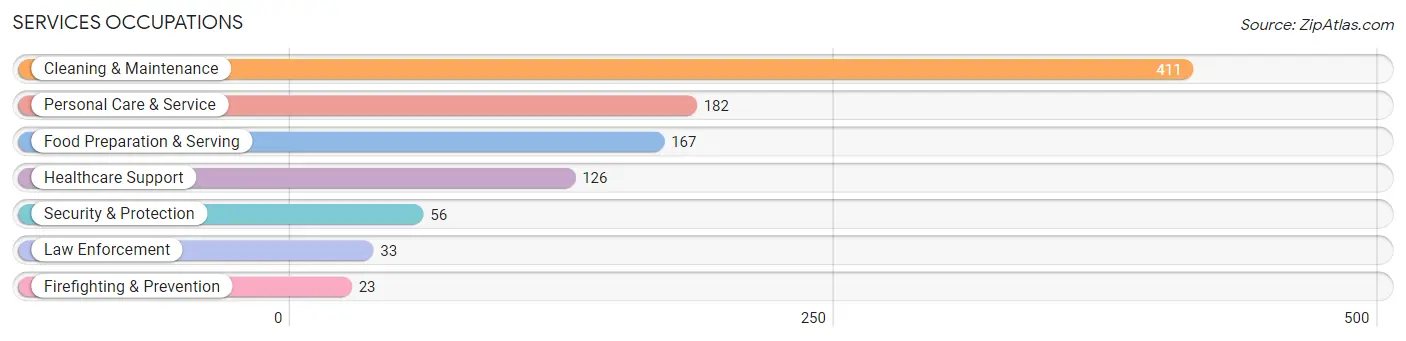
Services Occupations
The most common Services occupations in Mecca are Cleaning & Maintenance (411 | 12.4%), Personal Care & Service (182 | 5.5%), Food Preparation & Serving (167 | 5.1%), Healthcare Support (126 | 3.8%), and Security & Protection (56 | 1.7%).
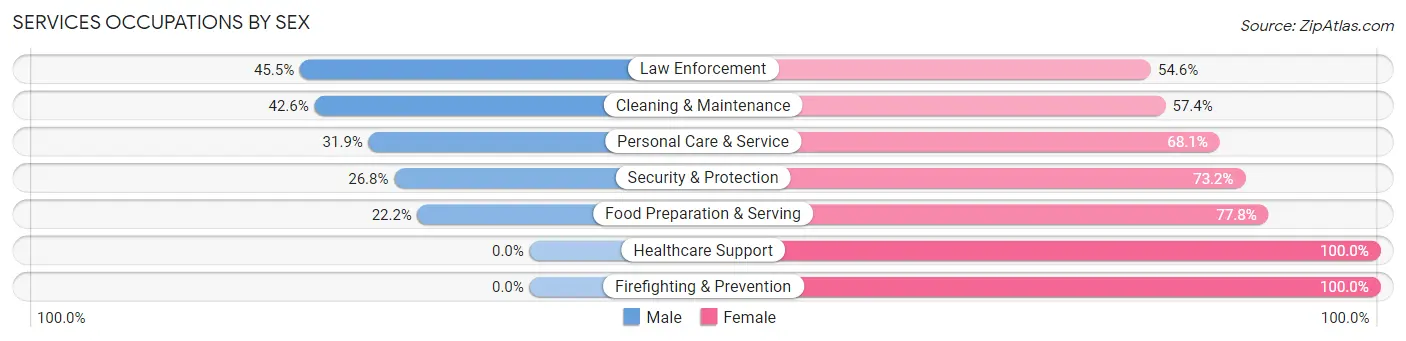
Services Occupations by Sex
Within the Services occupations in Mecca, the most male-oriented occupations are Law Enforcement (45.5%), Cleaning & Maintenance (42.6%), and Personal Care & Service (31.9%), while the most female-oriented occupations are Healthcare Support (100.0%), Firefighting & Prevention (100.0%), and Food Preparation & Serving (77.8%).
| Occupation | Male | Female |
| Healthcare Support | 0 (0.0%) | 126 (100.0%) |
| Security & Protection | 15 (26.8%) | 41 (73.2%) |
| Firefighting & Prevention | 0 (0.0%) | 23 (100.0%) |
| Law Enforcement | 15 (45.5%) | 18 (54.5%) |
| Food Preparation & Serving | 37 (22.2%) | 130 (77.8%) |
| Cleaning & Maintenance | 175 (42.6%) | 236 (57.4%) |
| Personal Care & Service | 58 (31.9%) | 124 (68.1%) |
| Total (Category) | 285 (30.2%) | 657 (69.8%) |
| Total (Overall) | 2,129 (64.4%) | 1,176 (35.6%) |
Sales and Office Occupations
The most common Sales and Office occupations in Mecca are Sales & Related (246 | 7.4%), and Office & Administration (81 | 2.5%).
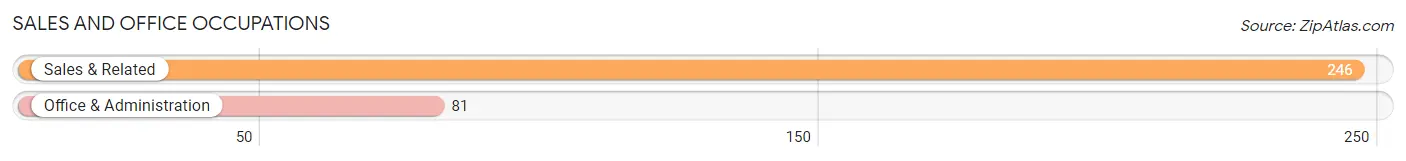
Sales and Office Occupations by Sex
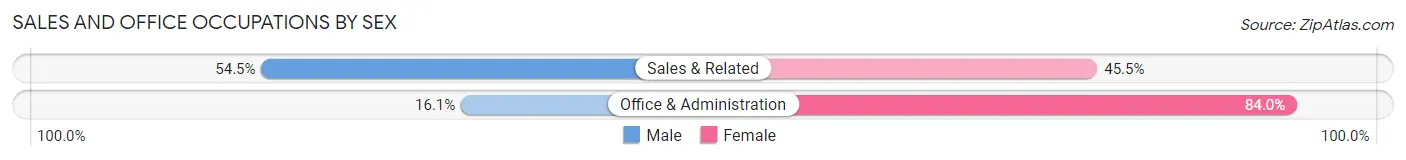
| Occupation | Male | Female |
| Sales & Related | 134 (54.5%) | 112 (45.5%) |
| Office & Administration | 13 (16.1%) | 68 (84.0%) |
| Total (Category) | 147 (45.0%) | 180 (55.0%) |
| Total (Overall) | 2,129 (64.4%) | 1,176 (35.6%) |
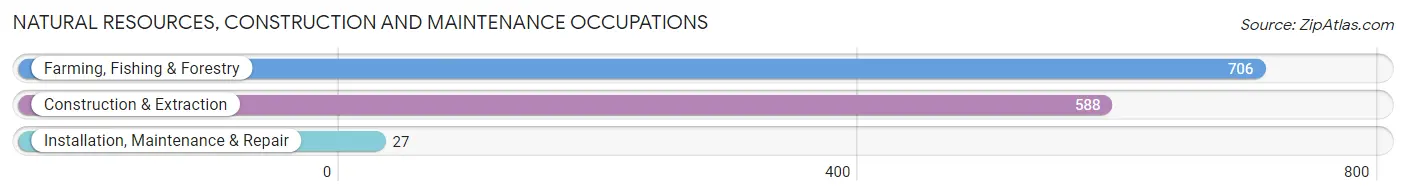
Natural Resources, Construction and Maintenance Occupations
The most common Natural Resources, Construction and Maintenance occupations in Mecca are Farming, Fishing & Forestry (706 | 21.4%), Construction & Extraction (588 | 17.8%), and Installation, Maintenance & Repair (27 | 0.8%).
Natural Resources, Construction and Maintenance Occupations by Sex
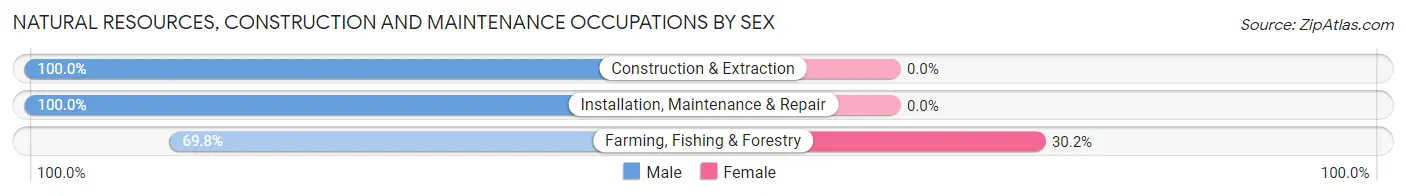
| Occupation | Male | Female |
| Farming, Fishing & Forestry | 493 (69.8%) | 213 (30.2%) |
| Construction & Extraction | 588 (100.0%) | 0 (0.0%) |
| Installation, Maintenance & Repair | 27 (100.0%) | 0 (0.0%) |
| Total (Category) | 1,108 (83.9%) | 213 (16.1%) |
| Total (Overall) | 2,129 (64.4%) | 1,176 (35.6%) |
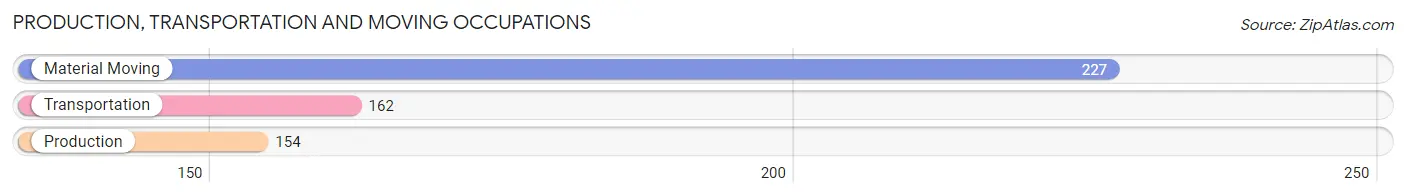
Production, Transportation and Moving Occupations
The most common Production, Transportation and Moving occupations in Mecca are Material Moving (227 | 6.9%), Transportation (162 | 4.9%), and Production (154 | 4.7%).
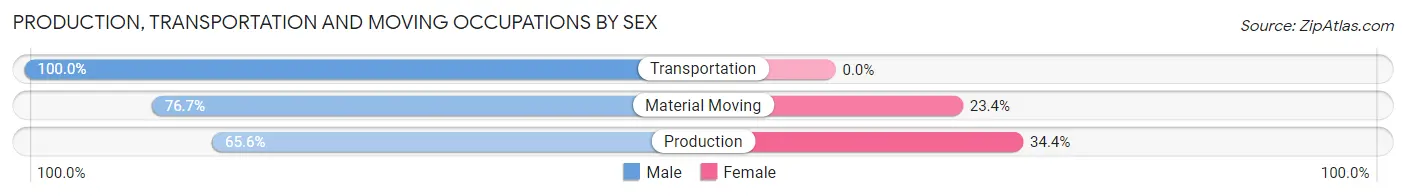
Production, Transportation and Moving Occupations by Sex
| Occupation | Male | Female |
| Production | 101 (65.6%) | 53 (34.4%) |
| Transportation | 162 (100.0%) | 0 (0.0%) |
| Material Moving | 174 (76.6%) | 53 (23.4%) |
| Total (Category) | 437 (80.5%) | 106 (19.5%) |
| Total (Overall) | 2,129 (64.4%) | 1,176 (35.6%) |
Employment Industries by Sex in Mecca
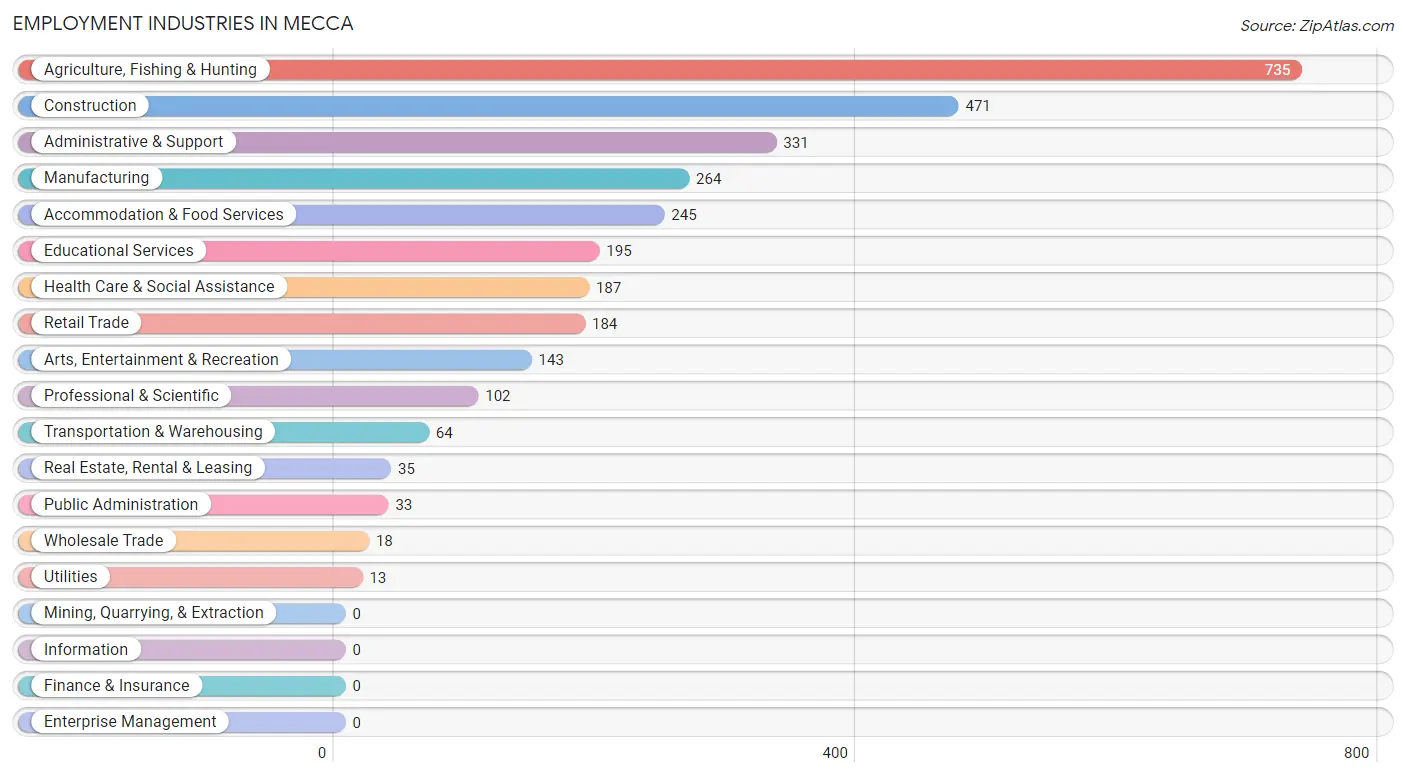
Employment Industries in Mecca
The major employment industries in Mecca include Agriculture, Fishing & Hunting (735 | 22.2%), Construction (471 | 14.2%), Administrative & Support (331 | 10.0%), Manufacturing (264 | 8.0%), and Accommodation & Food Services (245 | 7.4%).
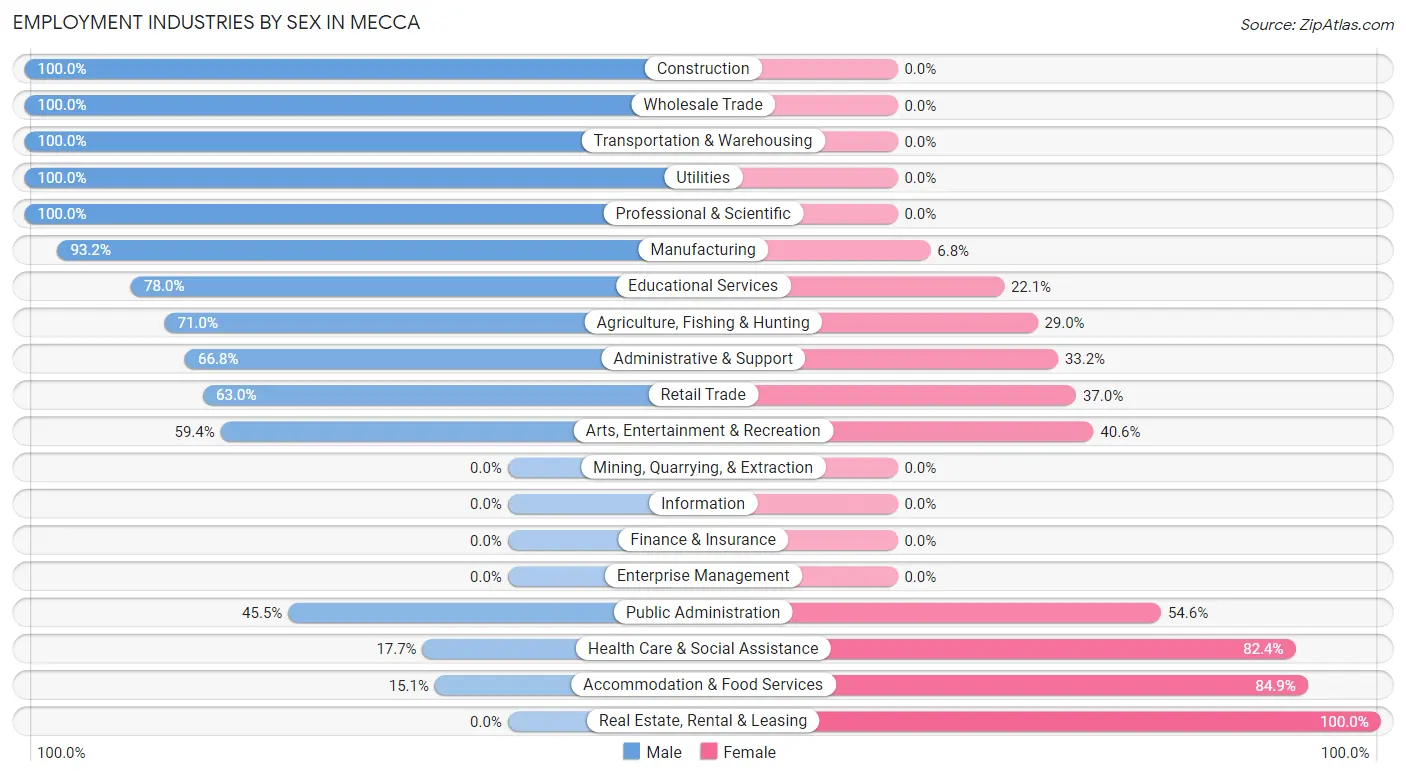
Employment Industries by Sex in Mecca
The Mecca industries that see more men than women are Construction (100.0%), Wholesale Trade (100.0%), and Transportation & Warehousing (100.0%), whereas the industries that tend to have a higher number of women are Real Estate, Rental & Leasing (100.0%), Accommodation & Food Services (84.9%), and Health Care & Social Assistance (82.4%).
| Industry | Male | Female |
| Agriculture, Fishing & Hunting | 522 (71.0%) | 213 (29.0%) |
| Mining, Quarrying, & Extraction | 0 (0.0%) | 0 (0.0%) |
| Construction | 471 (100.0%) | 0 (0.0%) |
| Manufacturing | 246 (93.2%) | 18 (6.8%) |
| Wholesale Trade | 18 (100.0%) | 0 (0.0%) |
| Retail Trade | 116 (63.0%) | 68 (37.0%) |
| Transportation & Warehousing | 64 (100.0%) | 0 (0.0%) |
| Utilities | 13 (100.0%) | 0 (0.0%) |
| Information | 0 (0.0%) | 0 (0.0%) |
| Finance & Insurance | 0 (0.0%) | 0 (0.0%) |
| Real Estate, Rental & Leasing | 0 (0.0%) | 35 (100.0%) |
| Professional & Scientific | 102 (100.0%) | 0 (0.0%) |
| Enterprise Management | 0 (0.0%) | 0 (0.0%) |
| Administrative & Support | 221 (66.8%) | 110 (33.2%) |
| Educational Services | 152 (77.9%) | 43 (22.1%) |
| Health Care & Social Assistance | 33 (17.6%) | 154 (82.4%) |
| Arts, Entertainment & Recreation | 85 (59.4%) | 58 (40.6%) |
| Accommodation & Food Services | 37 (15.1%) | 208 (84.9%) |
| Public Administration | 15 (45.5%) | 18 (54.5%) |
| Total | 2,129 (64.4%) | 1,176 (35.6%) |
Education in Mecca
School Enrollment in Mecca
The most common levels of schooling among the 1,331 students in Mecca are elementary school (349 | 26.2%), high school (345 | 25.9%), and middle school (343 | 25.8%).
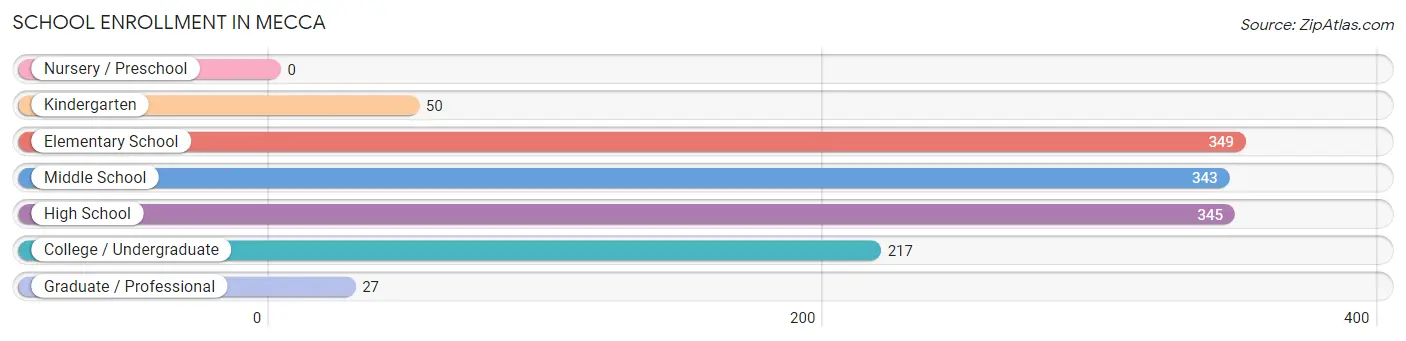
| School Level | # Students | % Students |
| Nursery / Preschool | 0 | 0.0% |
| Kindergarten | 50 | 3.8% |
| Elementary School | 349 | 26.2% |
| Middle School | 343 | 25.8% |
| High School | 345 | 25.9% |
| College / Undergraduate | 217 | 16.3% |
| Graduate / Professional | 27 | 2.0% |
| Total | 1,331 | 100.0% |
School Enrollment by Age by Funding Source in Mecca
Out of a total of 1,331 students who are enrolled in schools in Mecca, 17 (1.3%) attend a private institution, while the remaining 1,314 (98.7%) are enrolled in public schools. The age group of 20 to 24 year olds has the highest likelihood of being enrolled in private schools, with 17 (11.1% in the age bracket) enrolled. Conversely, the age group of 5 to 9 year old has the lowest likelihood of being enrolled in a private school, with 385 (100.0% in the age bracket) attending a public institution.
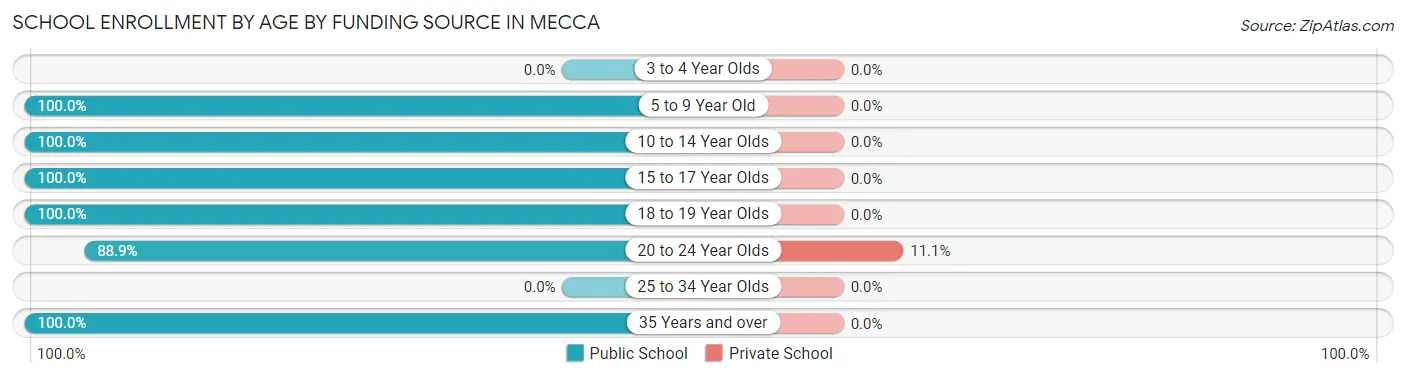
| Age Bracket | Public School | Private School |
| 3 to 4 Year Olds | 0 (0.0%) | 0 (0.0%) |
| 5 to 9 Year Old | 385 (100.0%) | 0 (0.0%) |
| 10 to 14 Year Olds | 374 (100.0%) | 0 (0.0%) |
| 15 to 17 Year Olds | 250 (100.0%) | 0 (0.0%) |
| 18 to 19 Year Olds | 70 (100.0%) | 0 (0.0%) |
| 20 to 24 Year Olds | 136 (88.9%) | 17 (11.1%) |
| 25 to 34 Year Olds | 0 (0.0%) | 0 (0.0%) |
| 35 Years and over | 99 (100.0%) | 0 (0.0%) |
| Total | 1,314 (98.7%) | 17 (1.3%) |
Educational Attainment by Field of Study in Mecca
Literature & languages (42 | 49.4%), education (25 | 29.4%), and engineering (18 | 21.2%) are the most common fields of study among 85 individuals in Mecca who have obtained a bachelor's degree or higher.
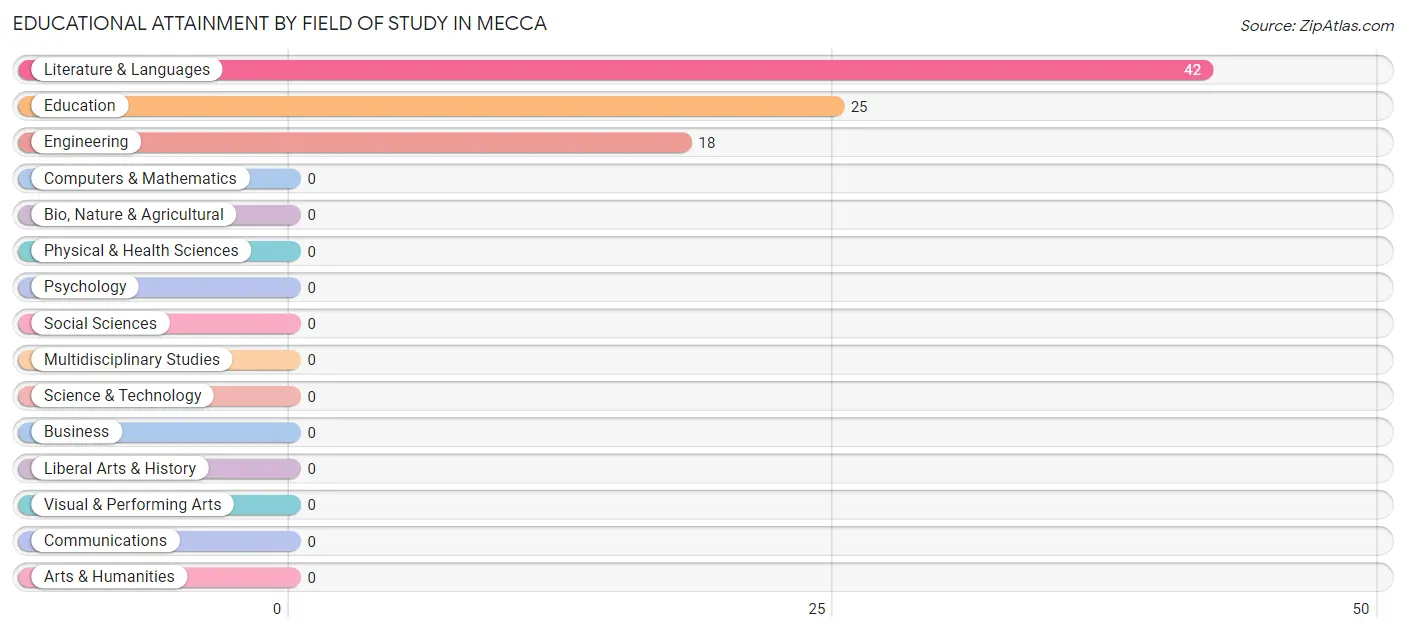
| Field of Study | # Graduates | % Graduates |
| Computers & Mathematics | 0 | 0.0% |
| Bio, Nature & Agricultural | 0 | 0.0% |
| Physical & Health Sciences | 0 | 0.0% |
| Psychology | 0 | 0.0% |
| Social Sciences | 0 | 0.0% |
| Engineering | 18 | 21.2% |
| Multidisciplinary Studies | 0 | 0.0% |
| Science & Technology | 0 | 0.0% |
| Business | 0 | 0.0% |
| Education | 25 | 29.4% |
| Literature & Languages | 42 | 49.4% |
| Liberal Arts & History | 0 | 0.0% |
| Visual & Performing Arts | 0 | 0.0% |
| Communications | 0 | 0.0% |
| Arts & Humanities | 0 | 0.0% |
| Total | 85 | 100.0% |
Transportation & Commute in Mecca
Vehicle Availability by Sex in Mecca
The most prevalent vehicle ownership categories in Mecca are males with 2 vehicles (840, accounting for 39.5%) and females with 2 vehicles (417, making up 74.3%).
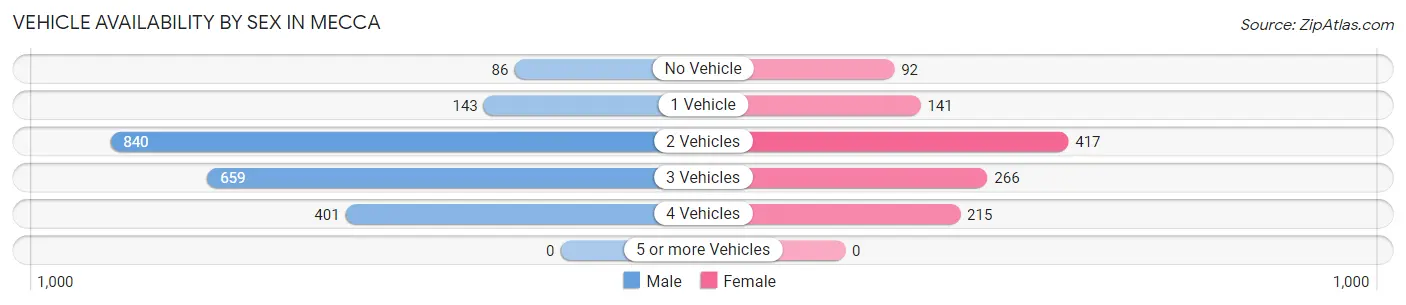
| Vehicles Available | Male | Female |
| No Vehicle | 86 (4.0%) | 92 (8.1%) |
| 1 Vehicle | 143 (6.7%) | 141 (12.5%) |
| 2 Vehicles | 840 (39.5%) | 417 (36.9%) |
| 3 Vehicles | 659 (30.9%) | 266 (23.5%) |
| 4 Vehicles | 401 (18.8%) | 215 (19.0%) |
| 5 or more Vehicles | 0 (0.0%) | 0 (0.0%) |
| Total | 2,129 (100.0%) | 1,131 (100.0%) |
Commute Time in Mecca
The most frequently occuring commute durations in Mecca are 30 to 34 minutes (780 commuters, 24.6%), 20 to 24 minutes (617 commuters, 19.5%), and 15 to 19 minutes (400 commuters, 12.6%).
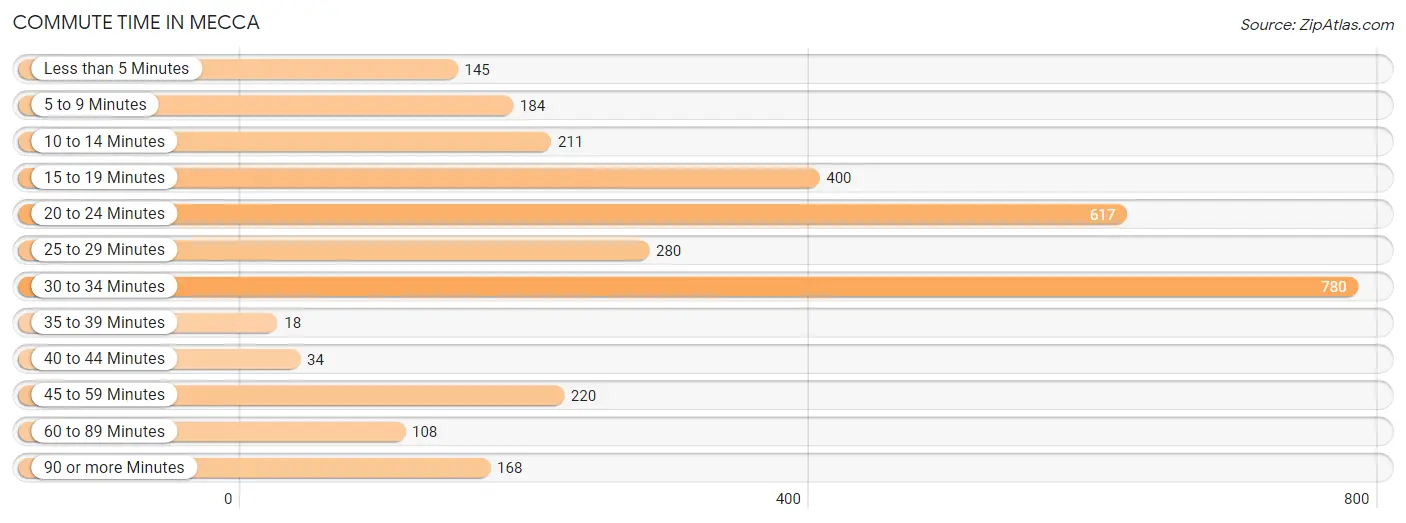
| Commute Time | # Commuters | % Commuters |
| Less than 5 Minutes | 145 | 4.6% |
| 5 to 9 Minutes | 184 | 5.8% |
| 10 to 14 Minutes | 211 | 6.7% |
| 15 to 19 Minutes | 400 | 12.6% |
| 20 to 24 Minutes | 617 | 19.5% |
| 25 to 29 Minutes | 280 | 8.8% |
| 30 to 34 Minutes | 780 | 24.6% |
| 35 to 39 Minutes | 18 | 0.6% |
| 40 to 44 Minutes | 34 | 1.1% |
| 45 to 59 Minutes | 220 | 7.0% |
| 60 to 89 Minutes | 108 | 3.4% |
| 90 or more Minutes | 168 | 5.3% |
Commute Time by Sex in Mecca
The most common commute times in Mecca are 30 to 34 minutes (633 commuters, 30.2%) for males and 20 to 24 minutes (333 commuters, 31.1%) for females.
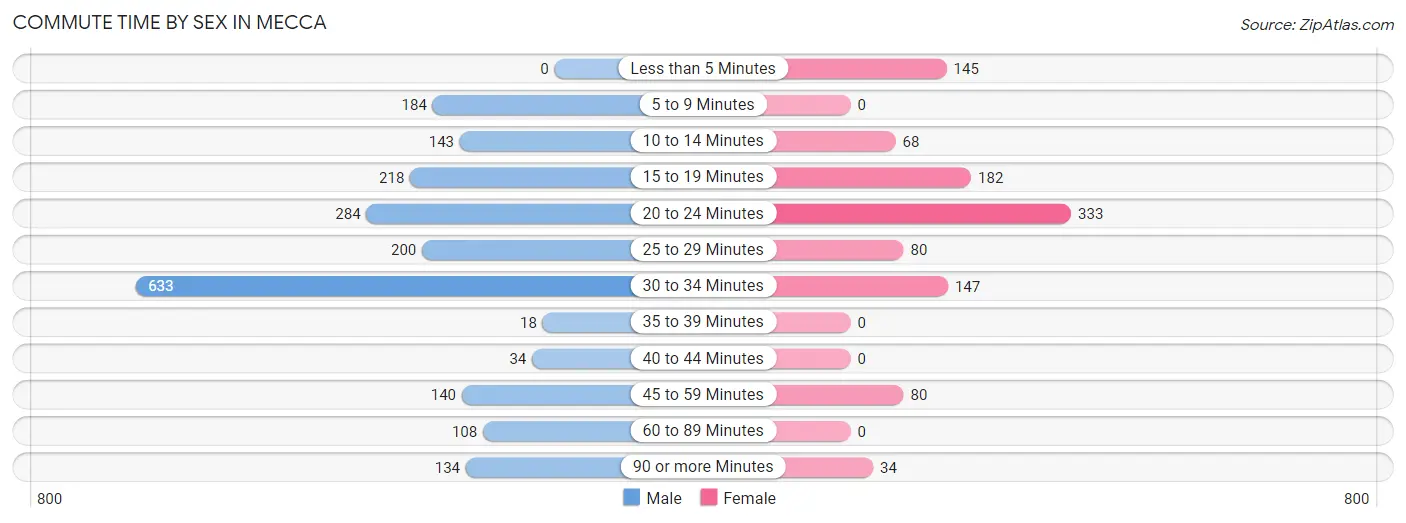
| Commute Time | Male | Female |
| Less than 5 Minutes | 0 (0.0%) | 145 (13.6%) |
| 5 to 9 Minutes | 184 (8.8%) | 0 (0.0%) |
| 10 to 14 Minutes | 143 (6.8%) | 68 (6.4%) |
| 15 to 19 Minutes | 218 (10.4%) | 182 (17.0%) |
| 20 to 24 Minutes | 284 (13.6%) | 333 (31.1%) |
| 25 to 29 Minutes | 200 (9.5%) | 80 (7.5%) |
| 30 to 34 Minutes | 633 (30.2%) | 147 (13.8%) |
| 35 to 39 Minutes | 18 (0.9%) | 0 (0.0%) |
| 40 to 44 Minutes | 34 (1.6%) | 0 (0.0%) |
| 45 to 59 Minutes | 140 (6.7%) | 80 (7.5%) |
| 60 to 89 Minutes | 108 (5.1%) | 0 (0.0%) |
| 90 or more Minutes | 134 (6.4%) | 34 (3.2%) |
Time of Departure to Work by Sex in Mecca
The most frequent times of departure to work in Mecca are 6:00 AM to 6:29 AM (697, 33.3%) for males and 5:00 AM to 5:29 AM (189, 17.7%) for females.
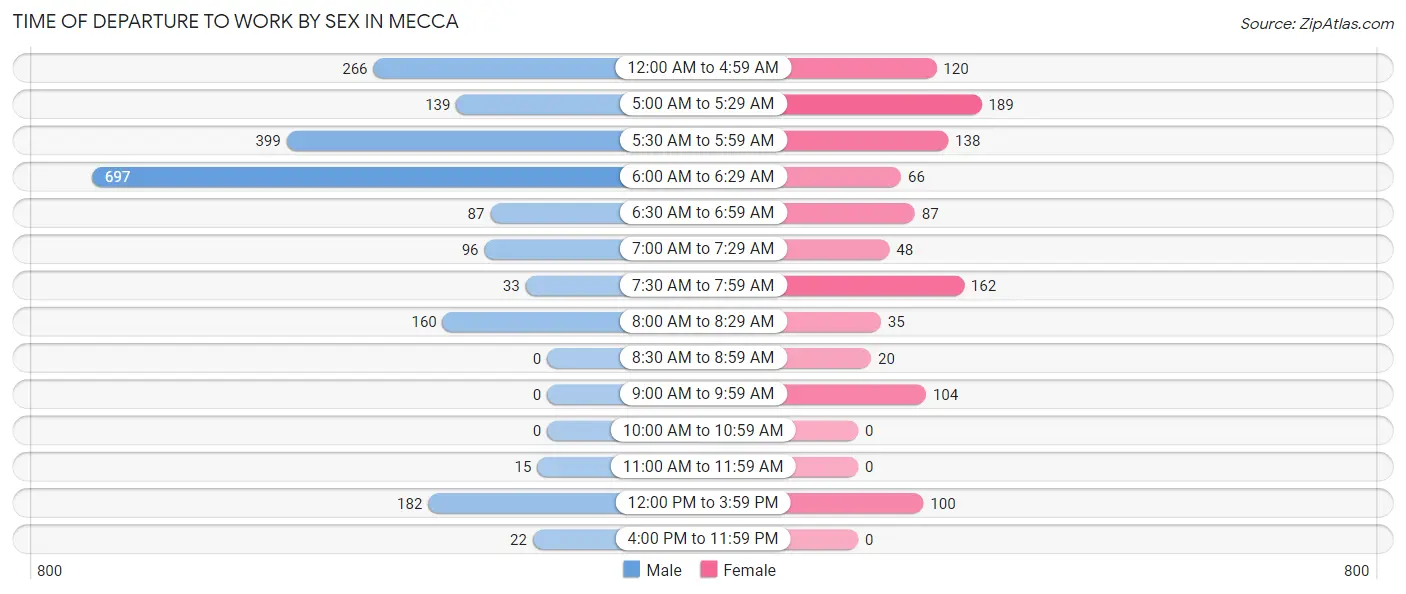
| Time of Departure | Male | Female |
| 12:00 AM to 4:59 AM | 266 (12.7%) | 120 (11.2%) |
| 5:00 AM to 5:29 AM | 139 (6.6%) | 189 (17.7%) |
| 5:30 AM to 5:59 AM | 399 (19.0%) | 138 (12.9%) |
| 6:00 AM to 6:29 AM | 697 (33.3%) | 66 (6.2%) |
| 6:30 AM to 6:59 AM | 87 (4.2%) | 87 (8.1%) |
| 7:00 AM to 7:29 AM | 96 (4.6%) | 48 (4.5%) |
| 7:30 AM to 7:59 AM | 33 (1.6%) | 162 (15.1%) |
| 8:00 AM to 8:29 AM | 160 (7.6%) | 35 (3.3%) |
| 8:30 AM to 8:59 AM | 0 (0.0%) | 20 (1.9%) |
| 9:00 AM to 9:59 AM | 0 (0.0%) | 104 (9.7%) |
| 10:00 AM to 10:59 AM | 0 (0.0%) | 0 (0.0%) |
| 11:00 AM to 11:59 AM | 15 (0.7%) | 0 (0.0%) |
| 12:00 PM to 3:59 PM | 182 (8.7%) | 100 (9.3%) |
| 4:00 PM to 11:59 PM | 22 (1.1%) | 0 (0.0%) |
| Total | 2,096 (100.0%) | 1,069 (100.0%) |
Housing Occupancy in Mecca
Occupancy by Ownership in Mecca
Of the total 2,240 dwellings in Mecca, owner-occupied units account for 1,383 (61.7%), while renter-occupied units make up 857 (38.3%).
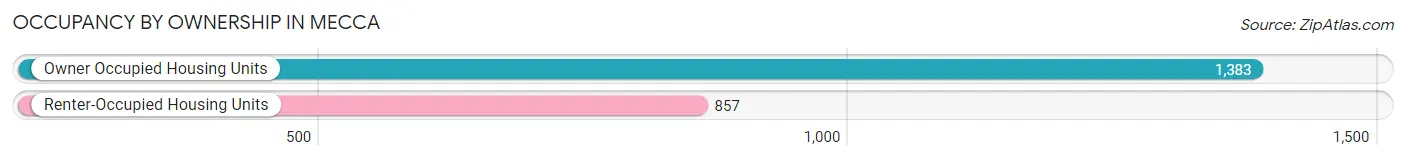
| Occupancy | # Housing Units | % Housing Units |
| Owner Occupied Housing Units | 1,383 | 61.7% |
| Renter-Occupied Housing Units | 857 | 38.3% |
| Total Occupied Housing Units | 2,240 | 100.0% |
Occupancy by Household Size in Mecca
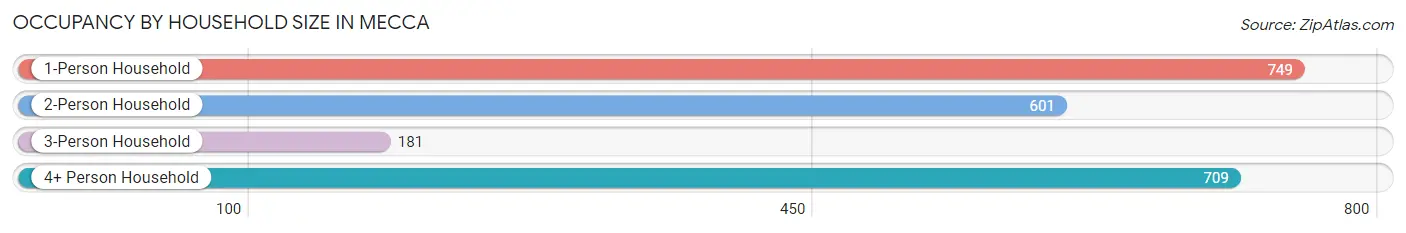
| Household Size | # Housing Units | % Housing Units |
| 1-Person Household | 749 | 33.4% |
| 2-Person Household | 601 | 26.8% |
| 3-Person Household | 181 | 8.1% |
| 4+ Person Household | 709 | 31.7% |
| Total Housing Units | 2,240 | 100.0% |
Occupancy by Ownership by Household Size in Mecca
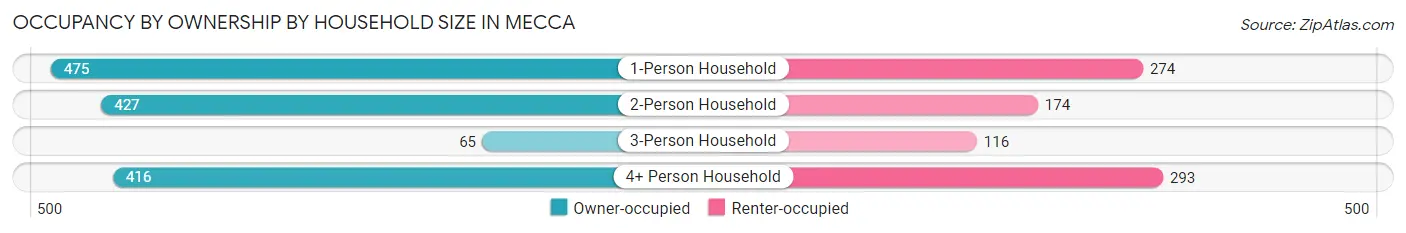
| Household Size | Owner-occupied | Renter-occupied |
| 1-Person Household | 475 (63.4%) | 274 (36.6%) |
| 2-Person Household | 427 (71.1%) | 174 (28.9%) |
| 3-Person Household | 65 (35.9%) | 116 (64.1%) |
| 4+ Person Household | 416 (58.7%) | 293 (41.3%) |
| Total Housing Units | 1,383 (61.7%) | 857 (38.3%) |
Occupancy by Educational Attainment in Mecca
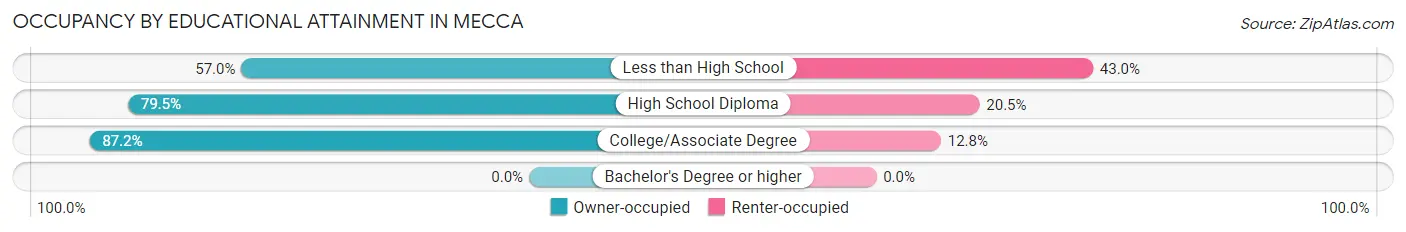
| Household Size | Owner-occupied | Renter-occupied |
| Less than High School | 1,041 (57.0%) | 784 (43.0%) |
| High School Diploma | 206 (79.5%) | 53 (20.5%) |
| College/Associate Degree | 136 (87.2%) | 20 (12.8%) |
| Bachelor's Degree or higher | 0 (0.0%) | 0 (0.0%) |
Occupancy by Age of Householder in Mecca
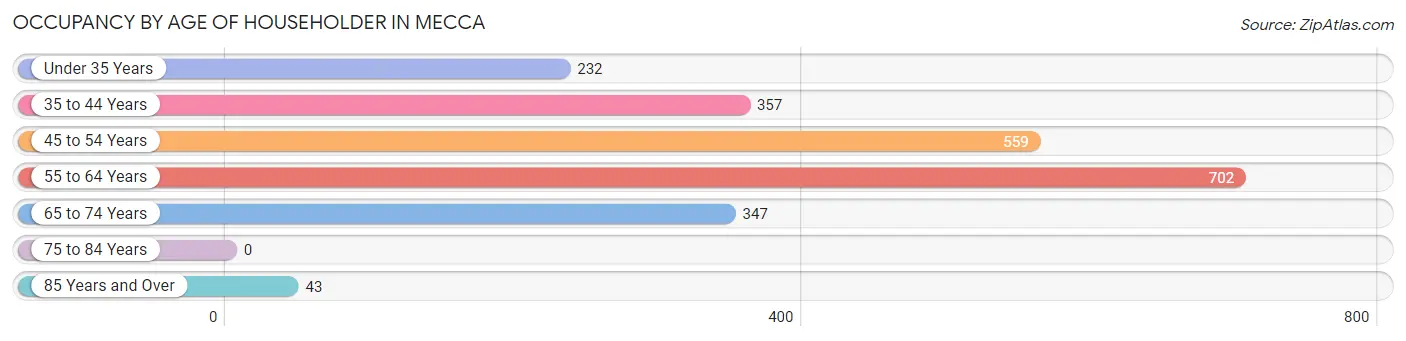
| Age Bracket | # Households | % Households |
| Under 35 Years | 232 | 10.4% |
| 35 to 44 Years | 357 | 15.9% |
| 45 to 54 Years | 559 | 25.0% |
| 55 to 64 Years | 702 | 31.3% |
| 65 to 74 Years | 347 | 15.5% |
| 75 to 84 Years | 0 | 0.0% |
| 85 Years and Over | 43 | 1.9% |
| Total | 2,240 | 100.0% |
Housing Finances in Mecca
Median Income by Occupancy in Mecca
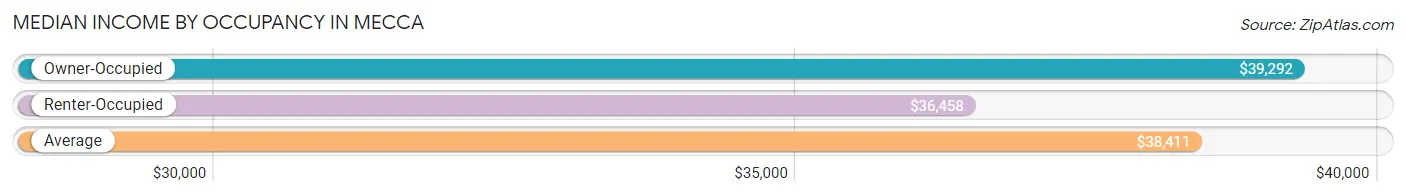
| Occupancy Type | # Households | Median Income |
| Owner-Occupied | 1,383 (61.7%) | $39,292 |
| Renter-Occupied | 857 (38.3%) | $36,458 |
| Average | 2,240 (100.0%) | $38,411 |
Occupancy by Householder Income Bracket in Mecca
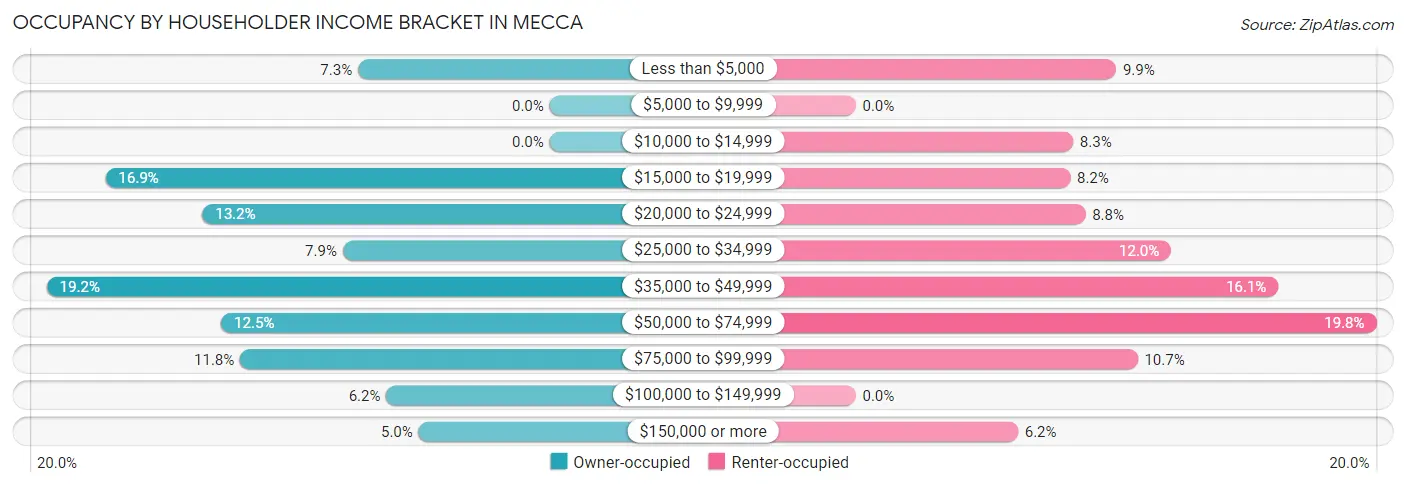
| Income Bracket | Owner-occupied | Renter-occupied |
| Less than $5,000 | 101 (7.3%) | 85 (9.9%) |
| $5,000 to $9,999 | 0 (0.0%) | 0 (0.0%) |
| $10,000 to $14,999 | 0 (0.0%) | 71 (8.3%) |
| $15,000 to $19,999 | 234 (16.9%) | 70 (8.2%) |
| $20,000 to $24,999 | 183 (13.2%) | 75 (8.7%) |
| $25,000 to $34,999 | 109 (7.9%) | 103 (12.0%) |
| $35,000 to $49,999 | 265 (19.2%) | 138 (16.1%) |
| $50,000 to $74,999 | 173 (12.5%) | 170 (19.8%) |
| $75,000 to $99,999 | 163 (11.8%) | 92 (10.7%) |
| $100,000 to $149,999 | 86 (6.2%) | 0 (0.0%) |
| $150,000 or more | 69 (5.0%) | 53 (6.2%) |
| Total | 1,383 (100.0%) | 857 (100.0%) |
Monthly Housing Cost Tiers in Mecca
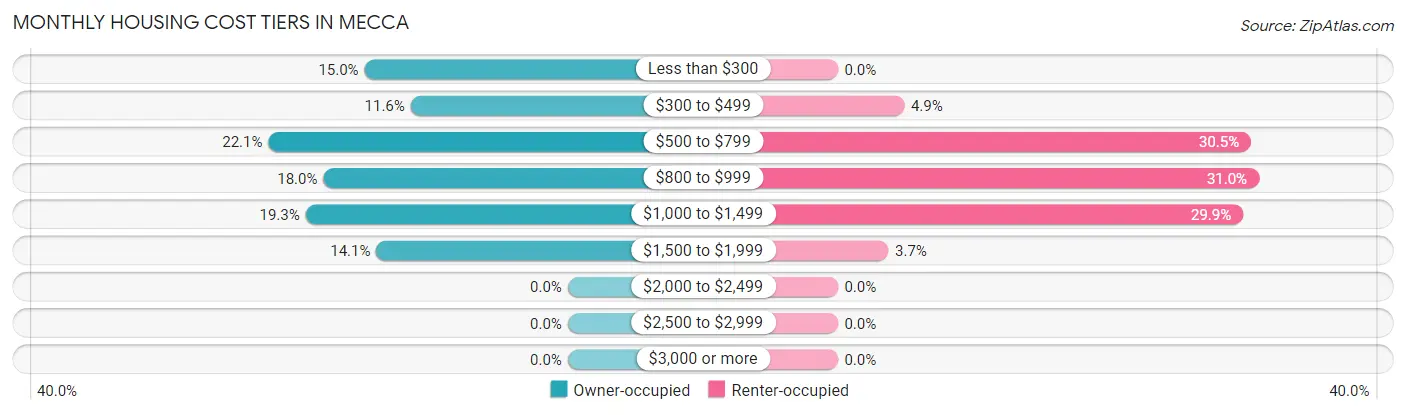
| Monthly Cost | Owner-occupied | Renter-occupied |
| Less than $300 | 207 (15.0%) | 0 (0.0%) |
| $300 to $499 | 160 (11.6%) | 42 (4.9%) |
| $500 to $799 | 305 (22.1%) | 261 (30.5%) |
| $800 to $999 | 249 (18.0%) | 266 (31.0%) |
| $1,000 to $1,499 | 267 (19.3%) | 256 (29.9%) |
| $1,500 to $1,999 | 195 (14.1%) | 32 (3.7%) |
| $2,000 to $2,499 | 0 (0.0%) | 0 (0.0%) |
| $2,500 to $2,999 | 0 (0.0%) | 0 (0.0%) |
| $3,000 or more | 0 (0.0%) | 0 (0.0%) |
| Total | 1,383 (100.0%) | 857 (100.0%) |
Physical Housing Characteristics in Mecca
Housing Structures in Mecca
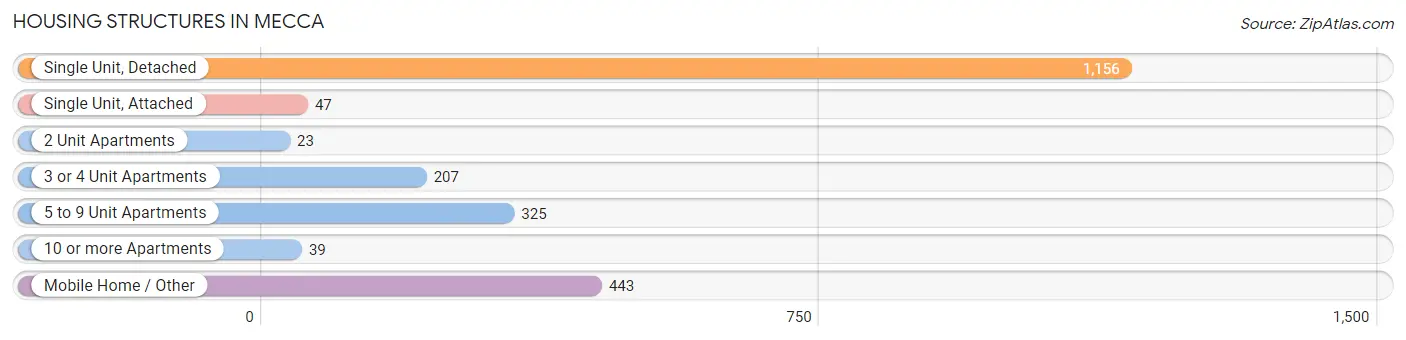
| Structure Type | # Housing Units | % Housing Units |
| Single Unit, Detached | 1,156 | 51.6% |
| Single Unit, Attached | 47 | 2.1% |
| 2 Unit Apartments | 23 | 1.0% |
| 3 or 4 Unit Apartments | 207 | 9.2% |
| 5 to 9 Unit Apartments | 325 | 14.5% |
| 10 or more Apartments | 39 | 1.7% |
| Mobile Home / Other | 443 | 19.8% |
| Total | 2,240 | 100.0% |
Housing Structures by Occupancy in Mecca
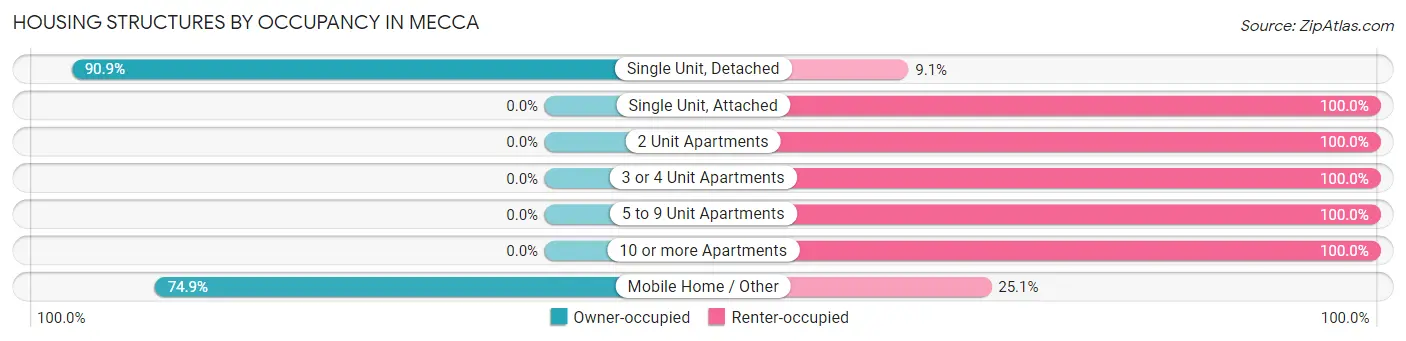
| Structure Type | Owner-occupied | Renter-occupied |
| Single Unit, Detached | 1,051 (90.9%) | 105 (9.1%) |
| Single Unit, Attached | 0 (0.0%) | 47 (100.0%) |
| 2 Unit Apartments | 0 (0.0%) | 23 (100.0%) |
| 3 or 4 Unit Apartments | 0 (0.0%) | 207 (100.0%) |
| 5 to 9 Unit Apartments | 0 (0.0%) | 325 (100.0%) |
| 10 or more Apartments | 0 (0.0%) | 39 (100.0%) |
| Mobile Home / Other | 332 (74.9%) | 111 (25.1%) |
| Total | 1,383 (61.7%) | 857 (38.3%) |
Housing Structures by Number of Rooms in Mecca
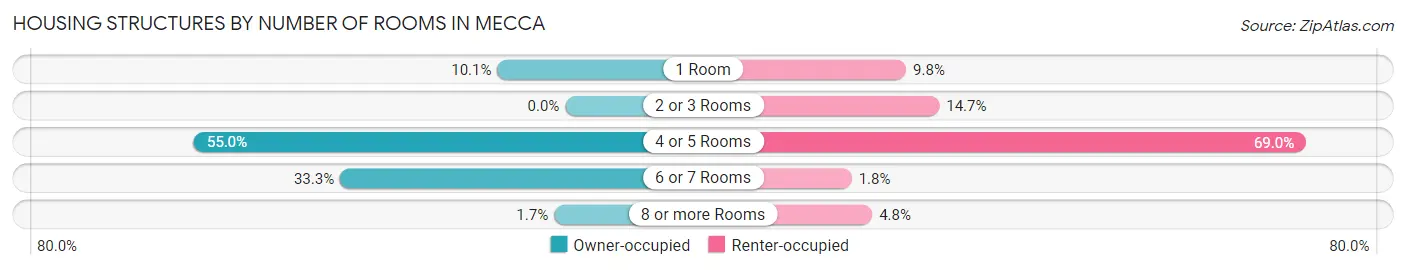
| Number of Rooms | Owner-occupied | Renter-occupied |
| 1 Room | 139 (10.1%) | 84 (9.8%) |
| 2 or 3 Rooms | 0 (0.0%) | 126 (14.7%) |
| 4 or 5 Rooms | 760 (54.9%) | 591 (69.0%) |
| 6 or 7 Rooms | 461 (33.3%) | 15 (1.8%) |
| 8 or more Rooms | 23 (1.7%) | 41 (4.8%) |
| Total | 1,383 (100.0%) | 857 (100.0%) |
Housing Structure by Heating Type in Mecca
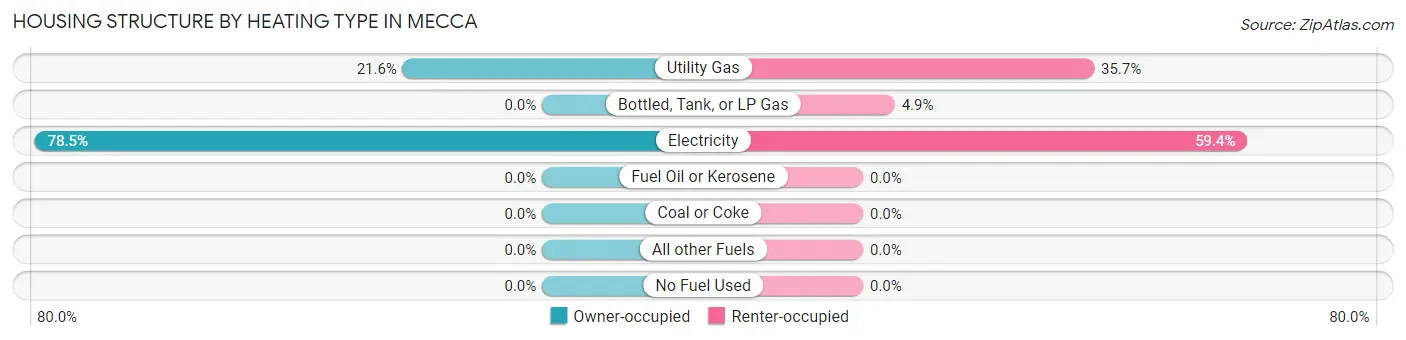
| Heating Type | Owner-occupied | Renter-occupied |
| Utility Gas | 298 (21.5%) | 306 (35.7%) |
| Bottled, Tank, or LP Gas | 0 (0.0%) | 42 (4.9%) |
| Electricity | 1,085 (78.4%) | 509 (59.4%) |
| Fuel Oil or Kerosene | 0 (0.0%) | 0 (0.0%) |
| Coal or Coke | 0 (0.0%) | 0 (0.0%) |
| All other Fuels | 0 (0.0%) | 0 (0.0%) |
| No Fuel Used | 0 (0.0%) | 0 (0.0%) |
| Total | 1,383 (100.0%) | 857 (100.0%) |
Household Vehicle Usage in Mecca
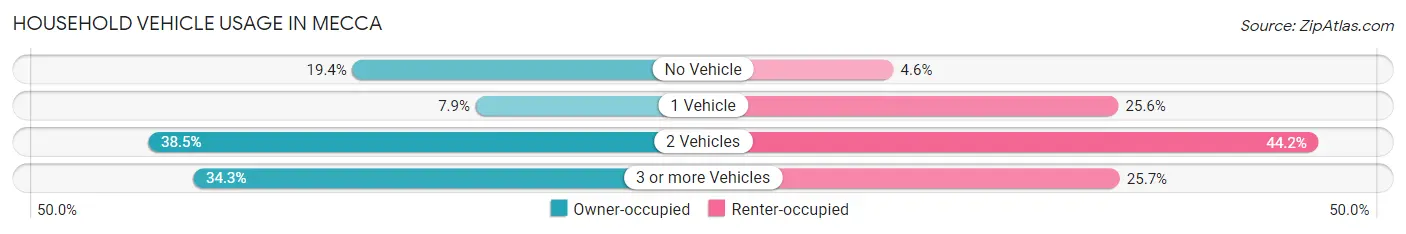
| Vehicles per Household | Owner-occupied | Renter-occupied |
| No Vehicle | 268 (19.4%) | 39 (4.5%) |
| 1 Vehicle | 109 (7.9%) | 219 (25.6%) |
| 2 Vehicles | 532 (38.5%) | 379 (44.2%) |
| 3 or more Vehicles | 474 (34.3%) | 220 (25.7%) |
| Total | 1,383 (100.0%) | 857 (100.0%) |
Real Estate & Mortgages in Mecca
Real Estate and Mortgage Overview in Mecca
| Characteristic | Without Mortgage | With Mortgage |
| Housing Units | 857 | 526 |
| Median Property Value | $165,700 | $227,100 |
| Median Household Income | $23,869 | $53 |
| Monthly Housing Costs | $709 | $0 |
| Real Estate Taxes | $2,558 | $37 |
Property Value by Mortgage Status in Mecca
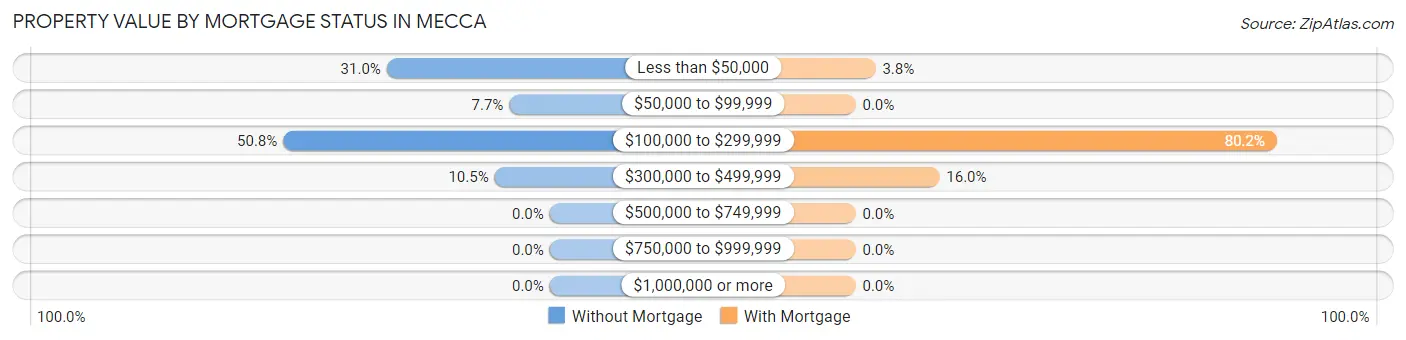
| Property Value | Without Mortgage | With Mortgage |
| Less than $50,000 | 266 (31.0%) | 20 (3.8%) |
| $50,000 to $99,999 | 66 (7.7%) | 0 (0.0%) |
| $100,000 to $299,999 | 435 (50.8%) | 422 (80.2%) |
| $300,000 to $499,999 | 90 (10.5%) | 84 (16.0%) |
| $500,000 to $749,999 | 0 (0.0%) | 0 (0.0%) |
| $750,000 to $999,999 | 0 (0.0%) | 0 (0.0%) |
| $1,000,000 or more | 0 (0.0%) | 0 (0.0%) |
| Total | 857 (100.0%) | 526 (100.0%) |
Household Income by Mortgage Status in Mecca
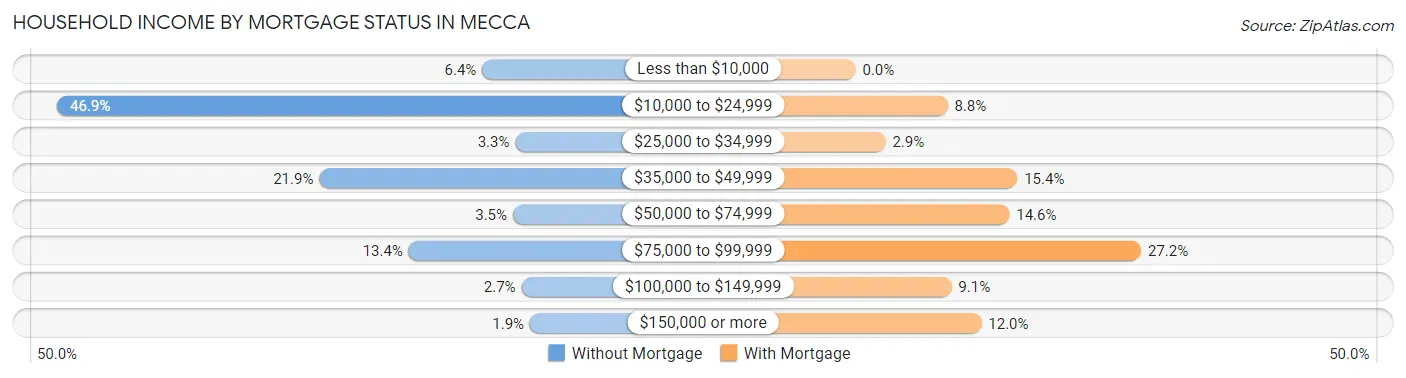
| Household Income | Without Mortgage | With Mortgage |
| Less than $10,000 | 55 (6.4%) | 0 (0.0%) |
| $10,000 to $24,999 | 402 (46.9%) | 46 (8.7%) |
| $25,000 to $34,999 | 28 (3.3%) | 15 (2.9%) |
| $35,000 to $49,999 | 188 (21.9%) | 81 (15.4%) |
| $50,000 to $74,999 | 30 (3.5%) | 77 (14.6%) |
| $75,000 to $99,999 | 115 (13.4%) | 143 (27.2%) |
| $100,000 to $149,999 | 23 (2.7%) | 48 (9.1%) |
| $150,000 or more | 16 (1.9%) | 63 (12.0%) |
| Total | 857 (100.0%) | 526 (100.0%) |
Property Value to Household Income Ratio in Mecca
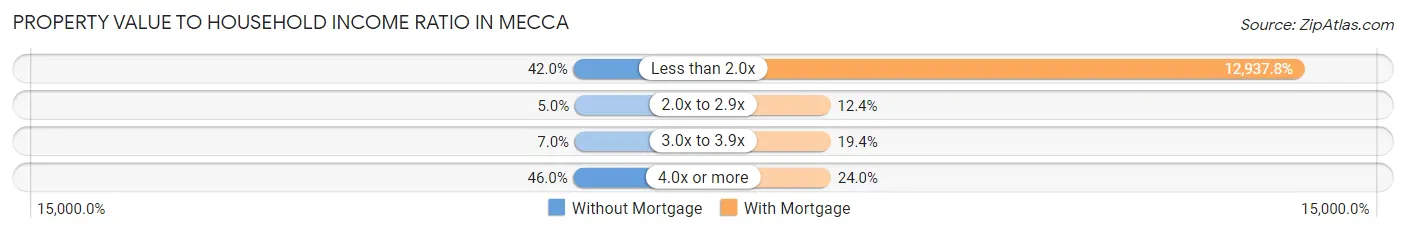
| Value-to-Income Ratio | Without Mortgage | With Mortgage |
| Less than 2.0x | 360 (42.0%) | 68,053 (12,937.8%) |
| 2.0x to 2.9x | 43 (5.0%) | 65 (12.4%) |
| 3.0x to 3.9x | 60 (7.0%) | 102 (19.4%) |
| 4.0x or more | 394 (46.0%) | 126 (23.9%) |
| Total | 857 (100.0%) | 526 (100.0%) |
Real Estate Taxes by Mortgage Status in Mecca
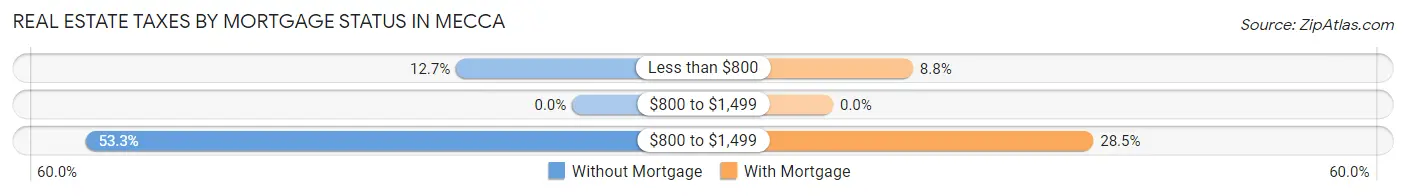
| Property Taxes | Without Mortgage | With Mortgage |
| Less than $800 | 109 (12.7%) | 46 (8.7%) |
| $800 to $1,499 | 0 (0.0%) | 0 (0.0%) |
| $800 to $1,499 | 457 (53.3%) | 150 (28.5%) |
| Total | 857 (100.0%) | 526 (100.0%) |
Health & Disability in Mecca
Health Insurance Coverage by Age in Mecca
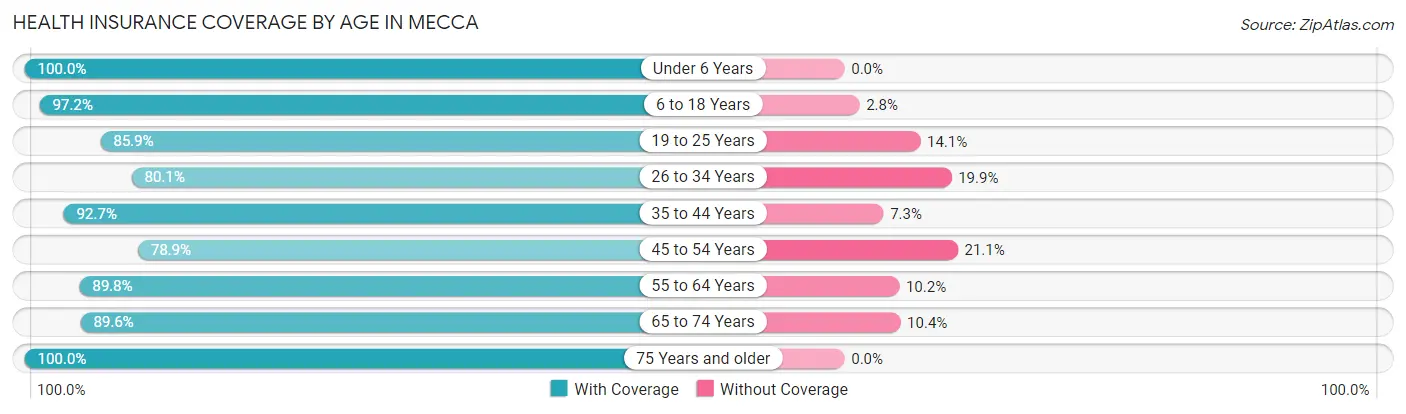
| Age Bracket | With Coverage | Without Coverage |
| Under 6 Years | 207 (100.0%) | 0 (0.0%) |
| 6 to 18 Years | 1,085 (97.2%) | 31 (2.8%) |
| 19 to 25 Years | 511 (85.9%) | 84 (14.1%) |
| 26 to 34 Years | 807 (80.1%) | 201 (19.9%) |
| 35 to 44 Years | 767 (92.7%) | 60 (7.3%) |
| 45 to 54 Years | 646 (78.9%) | 173 (21.1%) |
| 55 to 64 Years | 933 (89.8%) | 106 (10.2%) |
| 65 to 74 Years | 516 (89.6%) | 60 (10.4%) |
| 75 Years and older | 126 (100.0%) | 0 (0.0%) |
| Total | 5,598 (88.7%) | 715 (11.3%) |
Health Insurance Coverage by Citizenship Status in Mecca
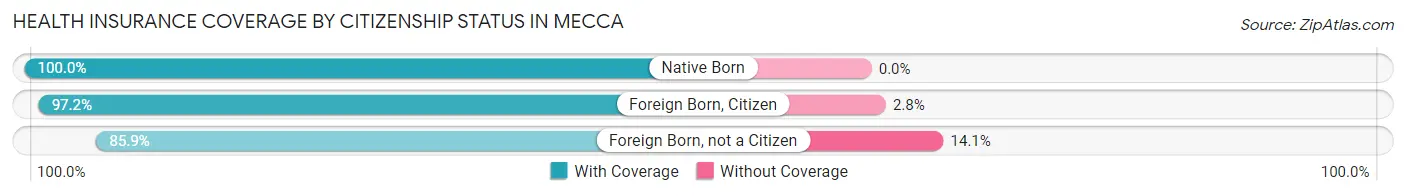
| Citizenship Status | With Coverage | Without Coverage |
| Native Born | 207 (100.0%) | 0 (0.0%) |
| Foreign Born, Citizen | 1,085 (97.2%) | 31 (2.8%) |
| Foreign Born, not a Citizen | 511 (85.9%) | 84 (14.1%) |
Health Insurance Coverage by Household Income in Mecca
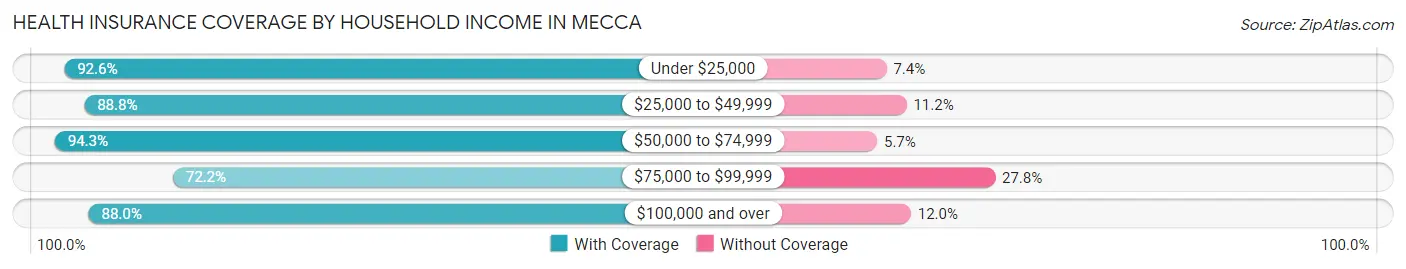
| Household Income | With Coverage | Without Coverage |
| Under $25,000 | 1,258 (92.6%) | 101 (7.4%) |
| $25,000 to $49,999 | 1,359 (88.8%) | 171 (11.2%) |
| $50,000 to $74,999 | 1,448 (94.3%) | 87 (5.7%) |
| $75,000 to $99,999 | 593 (72.2%) | 228 (27.8%) |
| $100,000 and over | 940 (88.0%) | 128 (12.0%) |
Public vs Private Health Insurance Coverage by Age in Mecca
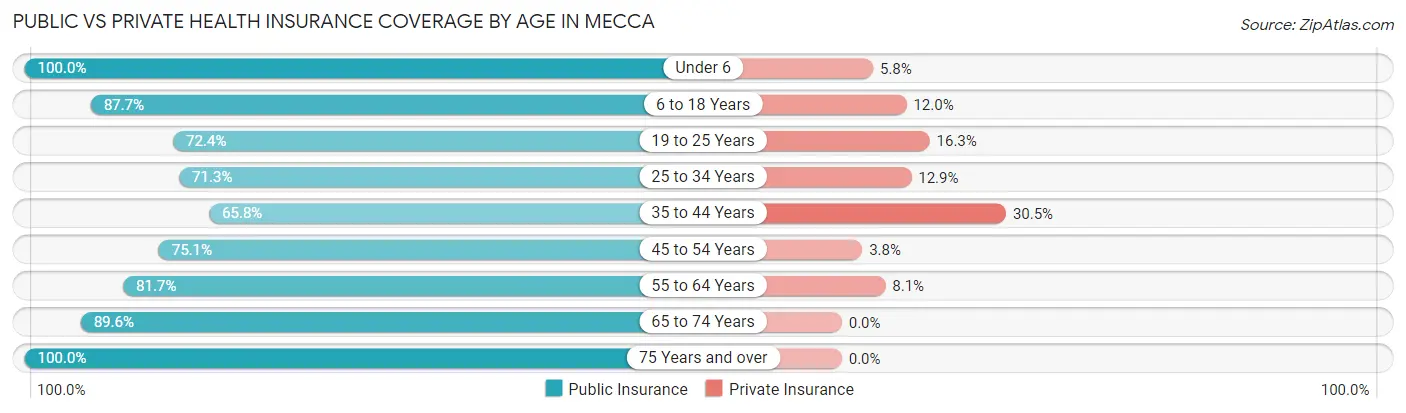
| Age Bracket | Public Insurance | Private Insurance |
| Under 6 | 207 (100.0%) | 12 (5.8%) |
| 6 to 18 Years | 979 (87.7%) | 134 (12.0%) |
| 19 to 25 Years | 431 (72.4%) | 97 (16.3%) |
| 25 to 34 Years | 719 (71.3%) | 130 (12.9%) |
| 35 to 44 Years | 544 (65.8%) | 252 (30.5%) |
| 45 to 54 Years | 615 (75.1%) | 31 (3.8%) |
| 55 to 64 Years | 849 (81.7%) | 84 (8.1%) |
| 65 to 74 Years | 516 (89.6%) | 0 (0.0%) |
| 75 Years and over | 126 (100.0%) | 0 (0.0%) |
| Total | 4,986 (79.0%) | 740 (11.7%) |
Disability Status by Sex by Age in Mecca
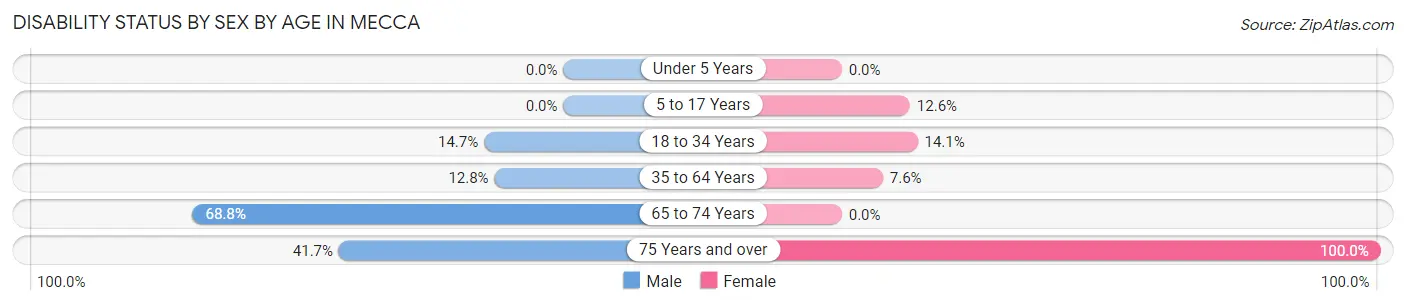
| Age Bracket | Male | Female |
| Under 5 Years | 0 (0.0%) | 0 (0.0%) |
| 5 to 17 Years | 0 (0.0%) | 81 (12.6%) |
| 18 to 34 Years | 154 (14.7%) | 89 (14.1%) |
| 35 to 64 Years | 179 (12.8%) | 98 (7.6%) |
| 65 to 74 Years | 256 (68.8%) | 0 (0.0%) |
| 75 Years and over | 25 (41.7%) | 66 (100.0%) |
Disability Class by Sex by Age in Mecca
Disability Class: Hearing Difficulty
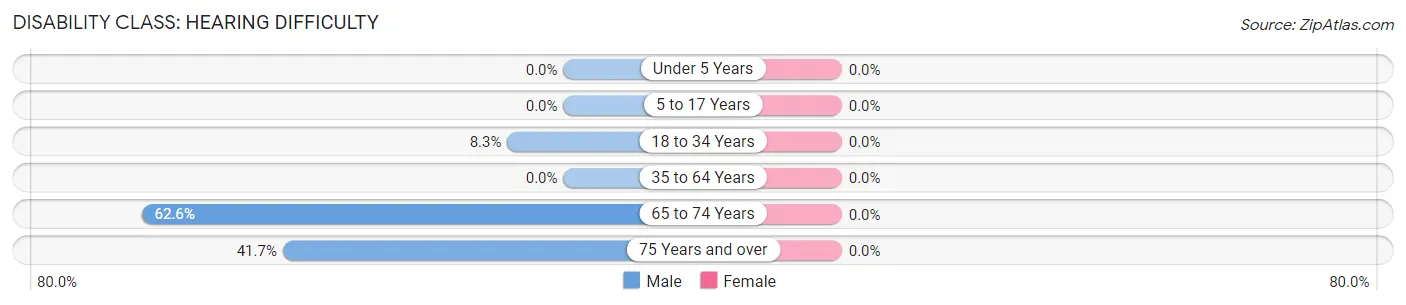
| Age Bracket | Male | Female |
| Under 5 Years | 0 (0.0%) | 0 (0.0%) |
| 5 to 17 Years | 0 (0.0%) | 0 (0.0%) |
| 18 to 34 Years | 87 (8.3%) | 0 (0.0%) |
| 35 to 64 Years | 0 (0.0%) | 0 (0.0%) |
| 65 to 74 Years | 233 (62.6%) | 0 (0.0%) |
| 75 Years and over | 25 (41.7%) | 0 (0.0%) |
Disability Class: Vision Difficulty
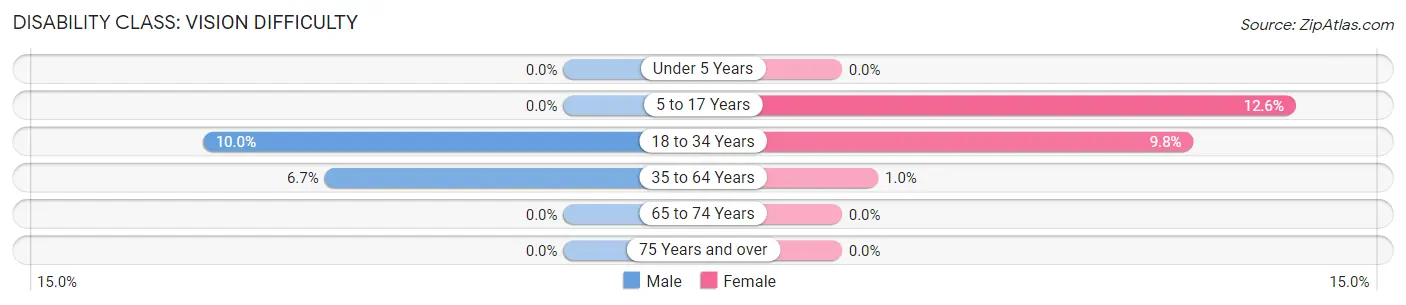
| Age Bracket | Male | Female |
| Under 5 Years | 0 (0.0%) | 0 (0.0%) |
| 5 to 17 Years | 0 (0.0%) | 81 (12.6%) |
| 18 to 34 Years | 105 (10.0%) | 62 (9.8%) |
| 35 to 64 Years | 93 (6.7%) | 13 (1.0%) |
| 65 to 74 Years | 0 (0.0%) | 0 (0.0%) |
| 75 Years and over | 0 (0.0%) | 0 (0.0%) |
Disability Class: Cognitive Difficulty
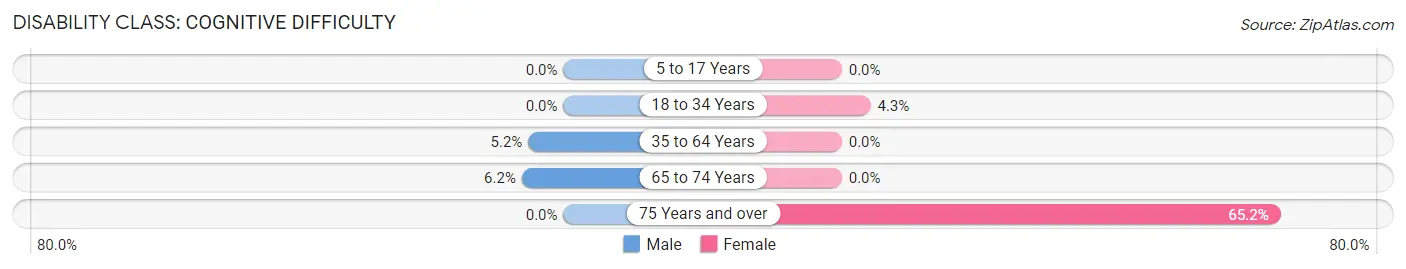
| Age Bracket | Male | Female |
| 5 to 17 Years | 0 (0.0%) | 0 (0.0%) |
| 18 to 34 Years | 0 (0.0%) | 27 (4.3%) |
| 35 to 64 Years | 73 (5.2%) | 0 (0.0%) |
| 65 to 74 Years | 23 (6.2%) | 0 (0.0%) |
| 75 Years and over | 0 (0.0%) | 43 (65.1%) |
Disability Class: Ambulatory Difficulty
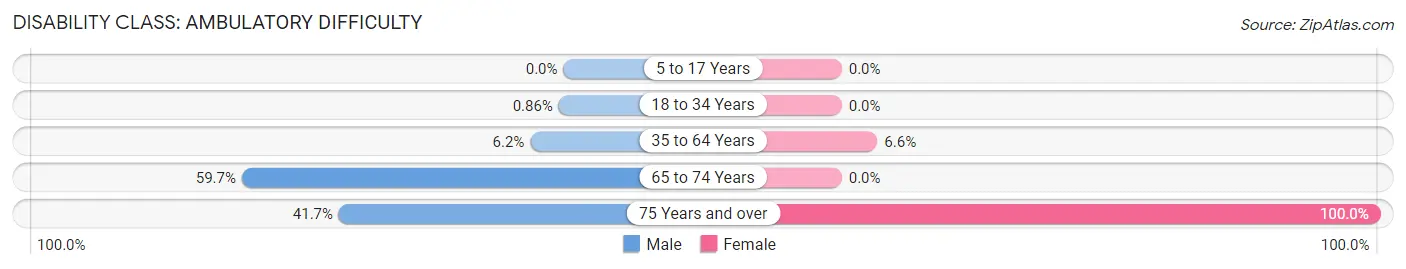
| Age Bracket | Male | Female |
| 5 to 17 Years | 0 (0.0%) | 0 (0.0%) |
| 18 to 34 Years | 9 (0.9%) | 0 (0.0%) |
| 35 to 64 Years | 86 (6.1%) | 85 (6.6%) |
| 65 to 74 Years | 222 (59.7%) | 0 (0.0%) |
| 75 Years and over | 25 (41.7%) | 66 (100.0%) |
Disability Class: Self-Care Difficulty
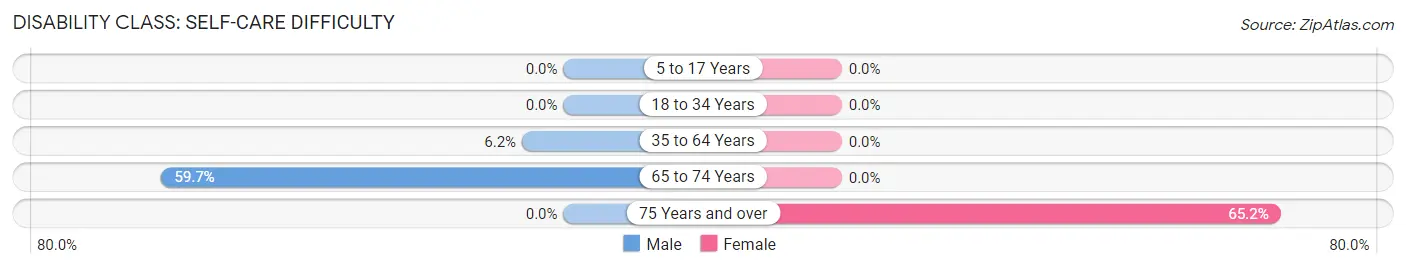
| Age Bracket | Male | Female |
| 5 to 17 Years | 0 (0.0%) | 0 (0.0%) |
| 18 to 34 Years | 0 (0.0%) | 0 (0.0%) |
| 35 to 64 Years | 86 (6.1%) | 0 (0.0%) |
| 65 to 74 Years | 222 (59.7%) | 0 (0.0%) |
| 75 Years and over | 0 (0.0%) | 43 (65.1%) |
Technology Access in Mecca
Computing Device Access in Mecca
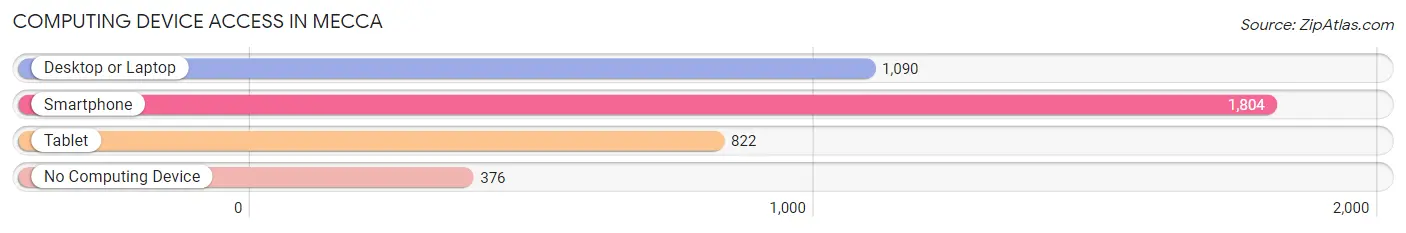
| Device Type | # Households | % Households |
| Desktop or Laptop | 1,090 | 48.7% |
| Smartphone | 1,804 | 80.5% |
| Tablet | 822 | 36.7% |
| No Computing Device | 376 | 16.8% |
| Total | 2,240 | 100.0% |
Internet Access in Mecca
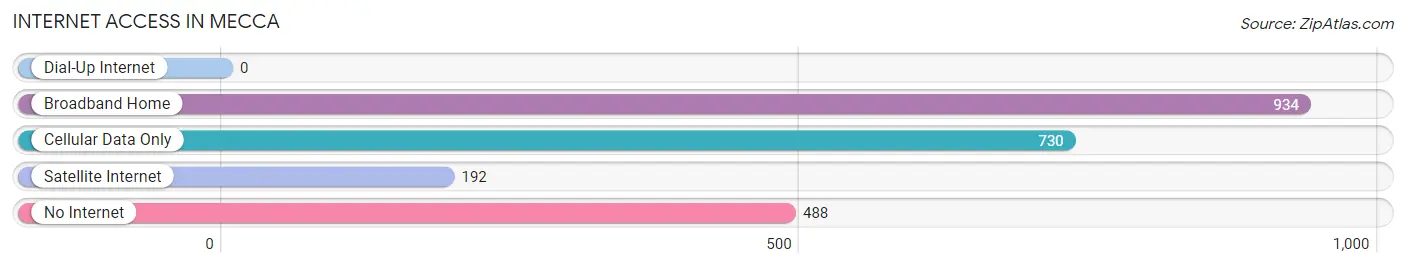
| Internet Type | # Households | % Households |
| Dial-Up Internet | 0 | 0.0% |
| Broadband Home | 934 | 41.7% |
| Cellular Data Only | 730 | 32.6% |
| Satellite Internet | 192 | 8.6% |
| No Internet | 488 | 21.8% |
| Total | 2,240 | 100.0% |
Mecca Summary
Mecca is a small unincorporated community located in Riverside County, California. It is situated in the Coachella Valley, approximately 25 miles southeast of Palm Springs and about 130 miles east of Los Angeles. The population of Mecca was estimated to be around 4,000 in 2020.
History
Mecca was founded in the late 19th century by the Southern Pacific Railroad. The town was named after the biblical city of Mecca, which is located in Saudi Arabia. The town was originally a stop on the railroad line, and it was used as a place for railroad workers to rest and refuel.
In the early 20th century, Mecca became a popular destination for tourists and vacationers. The town was known for its hot springs, which were believed to have healing properties. The hot springs were also used to irrigate the surrounding farmland.
In the 1950s, Mecca began to experience a population boom as people moved to the area to take advantage of the agricultural opportunities. The town was also home to a large number of migrant workers, who were drawn to the area by the promise of work in the fields.
Geography
Mecca is located in the Coachella Valley, which is a desert region in southeastern California. The town is situated at the base of the San Jacinto Mountains, which are part of the Peninsular Ranges. The town is surrounded by agricultural land, which is used to grow a variety of crops, including dates, citrus fruits, and vegetables.
The climate in Mecca is hot and dry, with temperatures reaching over 100 degrees Fahrenheit in the summer months. The town receives very little rainfall, with an average of only 4 inches per year.
Economy
Mecca’s economy is largely based on agriculture. The town is home to a number of farms and ranches, which produce a variety of crops, including dates, citrus fruits, and vegetables. The town is also home to a number of food processing plants, which process the crops grown in the area.
In addition to agriculture, Mecca is home to a number of small businesses, including restaurants, shops, and other services. The town is also home to a number of tourist attractions, including the Salton Sea, which is a large saltwater lake located nearby.
Demographics
Mecca is a predominantly Hispanic community, with over 90% of the population identifying as Hispanic or Latino. The town is also home to a large number of migrant workers, who come to the area to work in the fields. The median household income in Mecca is $30,000, which is significantly lower than the national average.
Mecca is served by the Coachella Valley Unified School District, which operates a number of elementary, middle, and high schools in the area. The town is also home to a number of churches, which serve the religious needs of the community.
Common Questions
What is Per Capita Income in Mecca?
Per Capita income in Mecca is $19,496.
What is the Median Family Income in Mecca?
Median Family Income in Mecca is $54,821.
What is the Median Household income in Mecca?
Median Household Income in Mecca is $38,411.
What is Income or Wage Gap in Mecca?
Income or Wage Gap in Mecca is 39.9%.
Women in Mecca earn 60.1 cents for every dollar earned by a man.
What is Inequality or Gini Index in Mecca?
Inequality or Gini Index in Mecca is 0.44.
What is the Total Population of Mecca?
Total Population of Mecca is 6,313.
What is the Total Male Population of Mecca?
Total Male Population of Mecca is 3,401.
What is the Total Female Population of Mecca?
Total Female Population of Mecca is 2,912.
What is the Ratio of Males per 100 Females in Mecca?
There are 116.79 Males per 100 Females in Mecca.
What is the Ratio of Females per 100 Males in Mecca?
There are 85.62 Females per 100 Males in Mecca.
What is the Median Population Age in Mecca?
Median Population Age in Mecca is 38.8 Years.
What is the Average Family Size in Mecca
Average Family Size in Mecca is 3.8 People.
What is the Average Household Size in Mecca
Average Household Size in Mecca is 2.8 People.
How Large is the Labor Force in Mecca?
There are 3,689 People in the Labor Forcein in Mecca.
What is the Percentage of People in the Labor Force in Mecca?
68.5% of People are in the Labor Force in Mecca.
What is the Unemployment Rate in Mecca?
Unemployment Rate in Mecca is 10.5%.