Yountville, CA Map & Demographics
Yountville Map
Yountville Overview
$61,414
PER CAPITA INCOME
$103,036
AVG FAMILY INCOME
$75,134
AVG HOUSEHOLD INCOME
1.9%
WAGE / INCOME GAP [ % ]
98.1¢/ $1
WAGE / INCOME GAP [ $ ]
0.54
INEQUALITY / GINI INDEX
3,397
TOTAL POPULATION
1,575
MALE POPULATION
1,822
FEMALE POPULATION
86.44
MALES / 100 FEMALES
115.68
FEMALES / 100 MALES
64.5
MEDIAN AGE
2.7
AVG FAMILY SIZE
1.8
AVG HOUSEHOLD SIZE
1,436
LABOR FORCE [ PEOPLE ]
44.2%
PERCENT IN LABOR FORCE
7.2%
UNEMPLOYMENT RATE
Yountville Zip Codes
Yountville Area Codes
Income in Yountville
Income Overview in Yountville
Per Capita Income in Yountville is $61,414, while median incomes of families and households are $103,036 and $75,134 respectively.
| Characteristic | Number | Measure |
| Per Capita Income | 3,397 | $61,414 |
| Median Family Income | 589 | $103,036 |
| Mean Family Income | 589 | $157,571 |
| Median Household Income | 1,516 | $75,134 |
| Mean Household Income | 1,516 | $119,002 |
| Income Deficit | 589 | $0 |
| Wage / Income Gap (%) | 3,397 | 1.87% |
| Wage / Income Gap ($) | 3,397 | 98.13¢ per $1 |
| Gini / Inequality Index | 3,397 | 0.54 |
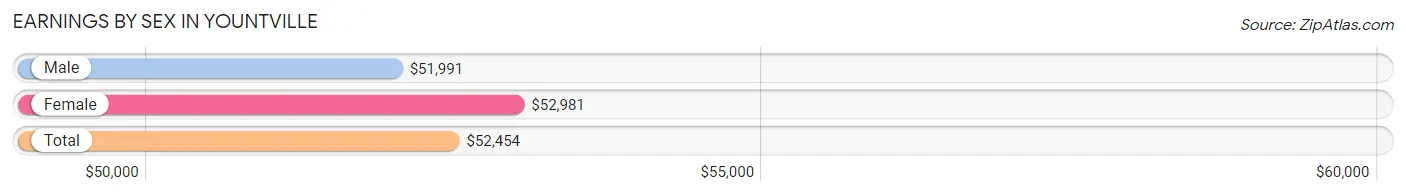
Earnings by Sex in Yountville
Average Earnings in Yountville are $52,454, $51,991 for men and $52,981 for women, a difference of 1.9%.
| Sex | Number | Average Earnings |
| Male | 783 (55.3%) | $51,991 |
| Female | 634 (44.7%) | $52,981 |
| Total | 1,417 (100.0%) | $52,454 |
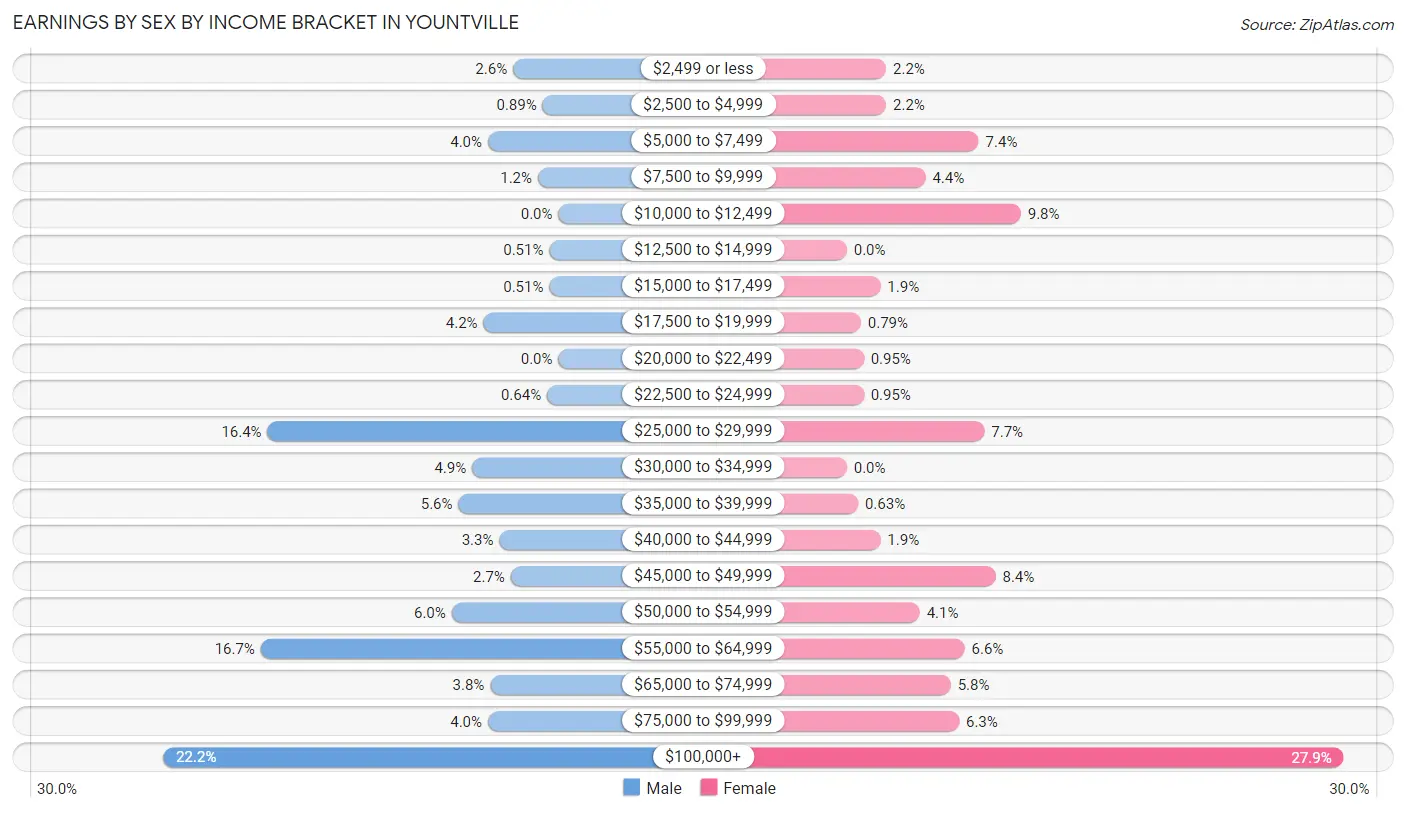
Earnings by Sex by Income Bracket in Yountville
The most common earnings brackets in Yountville are $100,000+ for men (174 | 22.2%) and $100,000+ for women (177 | 27.9%).
| Income | Male | Female |
| $2,499 or less | 20 (2.5%) | 14 (2.2%) |
| $2,500 to $4,999 | 7 (0.9%) | 14 (2.2%) |
| $5,000 to $7,499 | 31 (4.0%) | 47 (7.4%) |
| $7,500 to $9,999 | 9 (1.1%) | 28 (4.4%) |
| $10,000 to $12,499 | 0 (0.0%) | 62 (9.8%) |
| $12,500 to $14,999 | 4 (0.5%) | 0 (0.0%) |
| $15,000 to $17,499 | 4 (0.5%) | 12 (1.9%) |
| $17,500 to $19,999 | 33 (4.2%) | 5 (0.8%) |
| $20,000 to $22,499 | 0 (0.0%) | 6 (0.9%) |
| $22,500 to $24,999 | 5 (0.6%) | 6 (0.9%) |
| $25,000 to $29,999 | 128 (16.4%) | 49 (7.7%) |
| $30,000 to $34,999 | 38 (4.9%) | 0 (0.0%) |
| $35,000 to $39,999 | 44 (5.6%) | 4 (0.6%) |
| $40,000 to $44,999 | 26 (3.3%) | 12 (1.9%) |
| $45,000 to $49,999 | 21 (2.7%) | 53 (8.4%) |
| $50,000 to $54,999 | 47 (6.0%) | 26 (4.1%) |
| $55,000 to $64,999 | 131 (16.7%) | 42 (6.6%) |
| $65,000 to $74,999 | 30 (3.8%) | 37 (5.8%) |
| $75,000 to $99,999 | 31 (4.0%) | 40 (6.3%) |
| $100,000+ | 174 (22.2%) | 177 (27.9%) |
| Total | 783 (100.0%) | 634 (100.0%) |
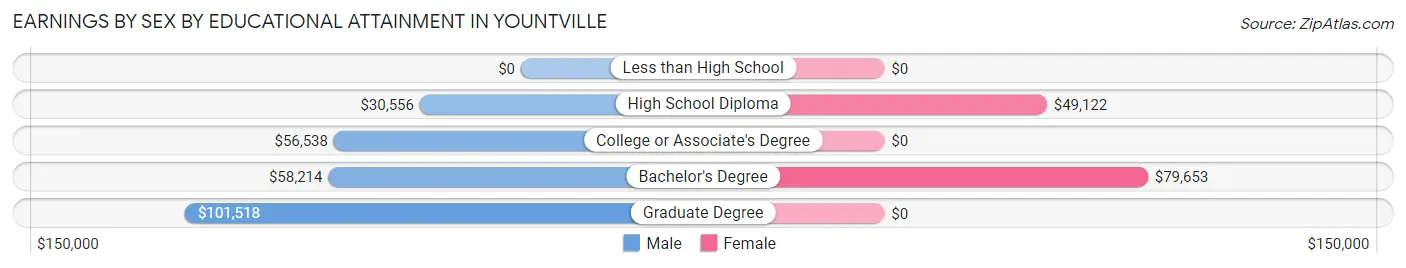
Earnings by Sex by Educational Attainment in Yountville
Average earnings in Yountville are $53,625 for men and $53,654 for women, a difference of 0.1%. Men with an educational attainment of graduate degree enjoy the highest average annual earnings of $101,518, while those with high school diploma education earn the least with $30,556. Women with an educational attainment of bachelor's degree earn the most with the average annual earnings of $79,653, while those with high school diploma education have the smallest earnings of $49,122.
| Educational Attainment | Male Income | Female Income |
| Less than High School | - | - |
| High School Diploma | $30,556 | $49,122 |
| College or Associate's Degree | $56,538 | $0 |
| Bachelor's Degree | $58,214 | $79,653 |
| Graduate Degree | $101,518 | $0 |
| Total | $53,625 | $53,654 |
Family Income in Yountville
Family Income Brackets in Yountville
According to the Yountville family income data, there are 162 families falling into the $200,000+ income range, which is the most common income bracket and makes up 27.5% of all families.
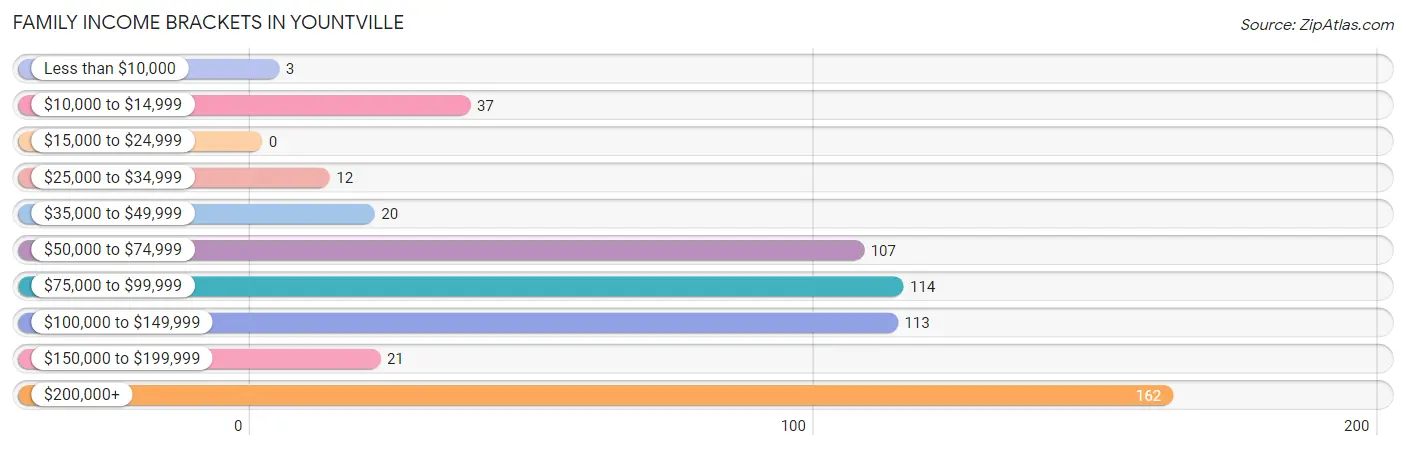
| Income Bracket | # Families | % Families |
| Less than $10,000 | 3 | 0.5% |
| $10,000 to $14,999 | 37 | 6.3% |
| $15,000 to $24,999 | 0 | 0.0% |
| $25,000 to $34,999 | 12 | 2.0% |
| $35,000 to $49,999 | 20 | 3.4% |
| $50,000 to $74,999 | 107 | 18.2% |
| $75,000 to $99,999 | 114 | 19.4% |
| $100,000 to $149,999 | 113 | 19.2% |
| $150,000 to $199,999 | 21 | 3.6% |
| $200,000+ | 162 | 27.5% |
Family Income by Famaliy Size in Yountville
2-person families (415 | 70.5%) account for the highest median family income in Yountville with $115,511 per family, while 2-person families (415 | 70.5%) have the highest median income of $57,756 per family member.
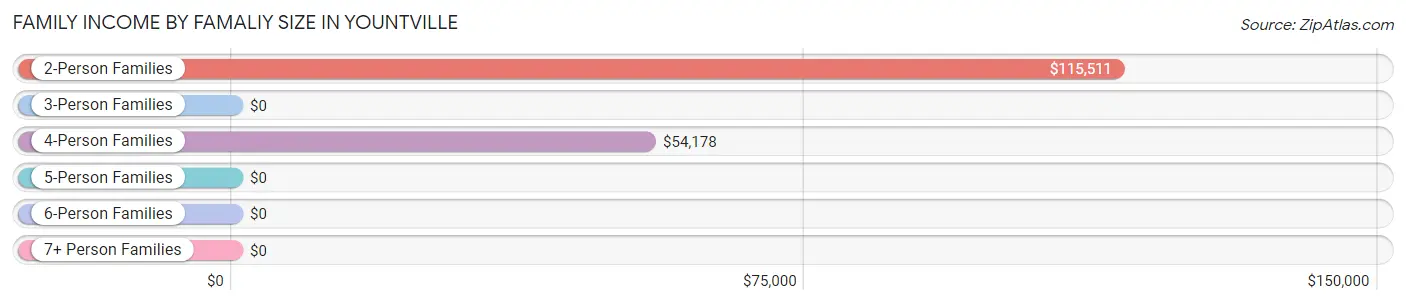
| Income Bracket | # Families | Median Income |
| 2-Person Families | 415 (70.5%) | $115,511 |
| 3-Person Families | 107 (18.2%) | $0 |
| 4-Person Families | 51 (8.7%) | $54,178 |
| 5-Person Families | 16 (2.7%) | $0 |
| 6-Person Families | 0 (0.0%) | $0 |
| 7+ Person Families | 0 (0.0%) | $0 |
| Total | 589 (100.0%) | $103,036 |
Family Income by Number of Earners in Yountville
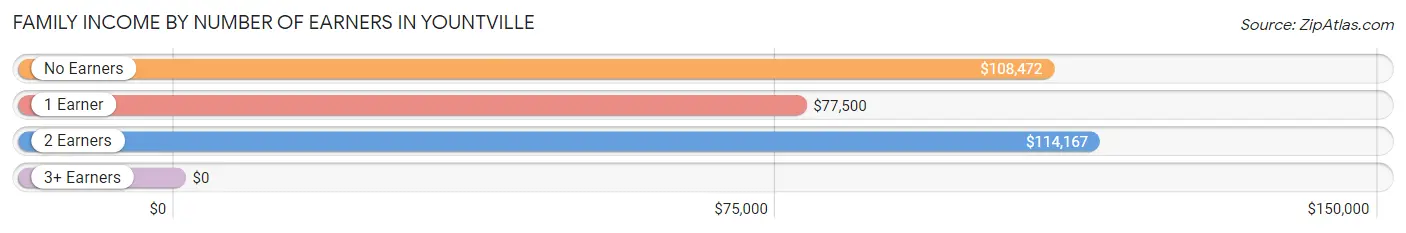
| Number of Earners | # Families | Median Income |
| No Earners | 129 (21.9%) | $108,472 |
| 1 Earner | 240 (40.7%) | $77,500 |
| 2 Earners | 196 (33.3%) | $114,167 |
| 3+ Earners | 24 (4.1%) | $0 |
| Total | 589 (100.0%) | $103,036 |
Household Income in Yountville
Household Income Brackets in Yountville
With 241 households falling in the category, the $100,000 to $149,999 income range is the most frequent in Yountville, accounting for 15.9% of all households. In contrast, only 59 households (3.9%) fall into the $15,000 to $24,999 income bracket, making it the least populous group.
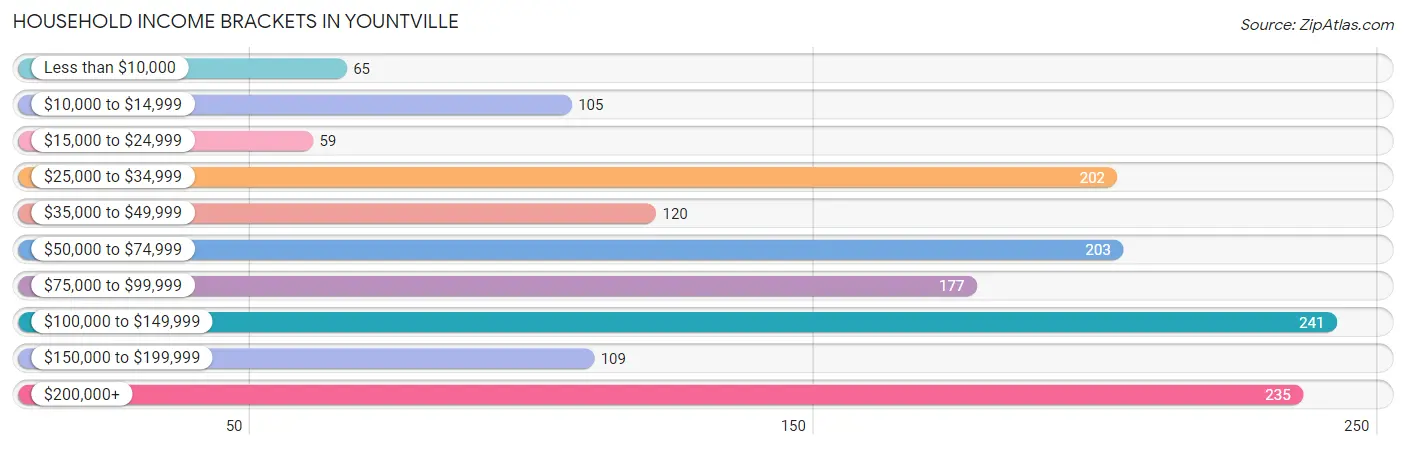
| Income Bracket | # Households | % Households |
| Less than $10,000 | 65 | 4.3% |
| $10,000 to $14,999 | 105 | 6.9% |
| $15,000 to $24,999 | 59 | 3.9% |
| $25,000 to $34,999 | 202 | 13.3% |
| $35,000 to $49,999 | 120 | 7.9% |
| $50,000 to $74,999 | 203 | 13.4% |
| $75,000 to $99,999 | 177 | 11.7% |
| $100,000 to $149,999 | 241 | 15.9% |
| $150,000 to $199,999 | 109 | 7.2% |
| $200,000+ | 235 | 15.5% |
Household Income by Householder Age in Yountville
The median household income in Yountville is $75,134, with the highest median household income of $95,489 found in the 45 to 64 years age bracket for the primary householder. A total of 511 households (33.7%) fall into this category.
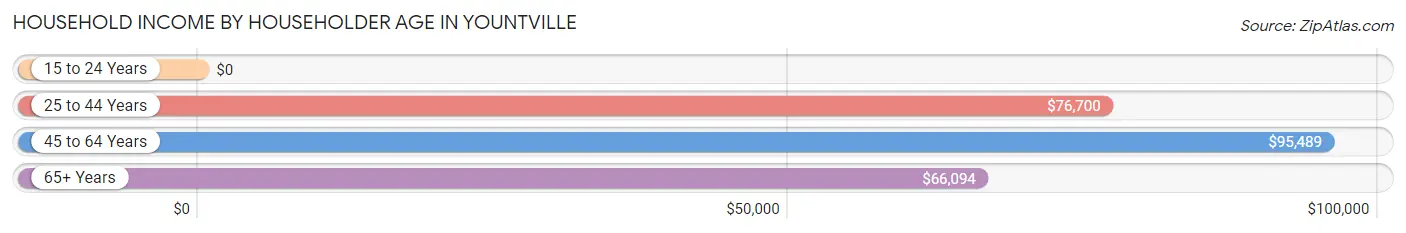
| Income Bracket | # Households | Median Income |
| 15 to 24 Years | 0 (0.0%) | $0 |
| 25 to 44 Years | 198 (13.1%) | $76,700 |
| 45 to 64 Years | 511 (33.7%) | $95,489 |
| 65+ Years | 807 (53.2%) | $66,094 |
| Total | 1,516 (100.0%) | $75,134 |
Poverty in Yountville
Income Below Poverty by Sex and Age in Yountville
With 12.2% poverty level for males and 9.2% for females among the residents of Yountville, 45 to 54 year old males and 55 to 64 year old females are the most vulnerable to poverty, with 69 males (48.9%) and 56 females (16.2%) in their respective age groups living below the poverty level.
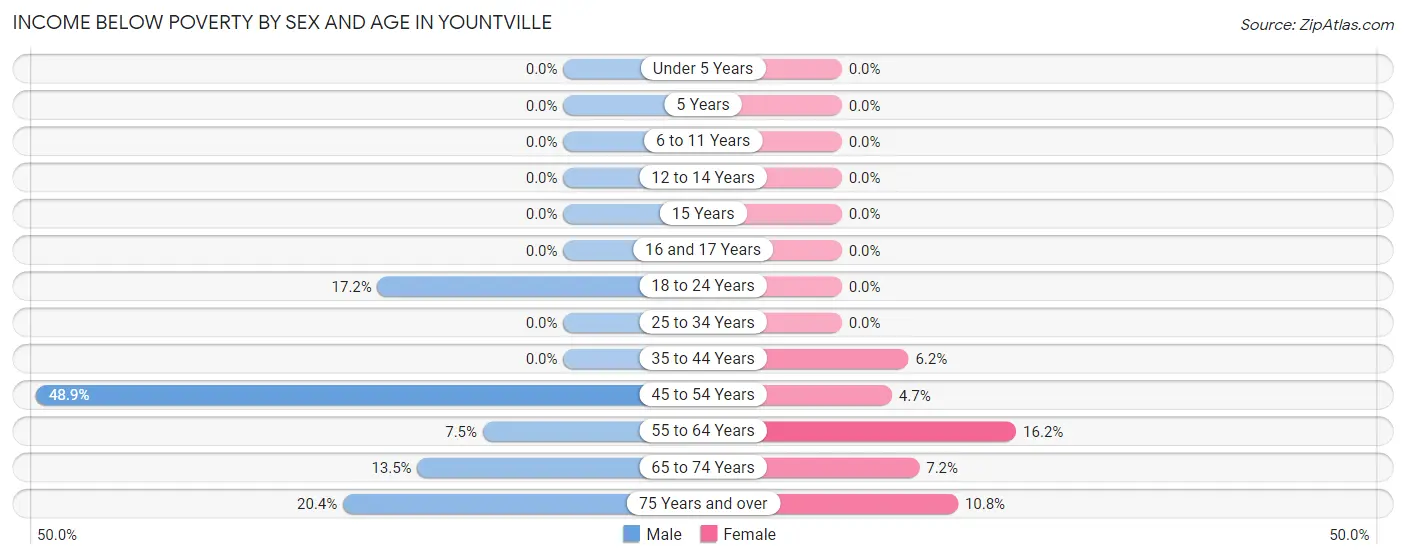
| Age Bracket | Male | Female |
| Under 5 Years | 0 (0.0%) | 0 (0.0%) |
| 5 Years | 0 (0.0%) | 0 (0.0%) |
| 6 to 11 Years | 0 (0.0%) | 0 (0.0%) |
| 12 to 14 Years | 0 (0.0%) | 0 (0.0%) |
| 15 Years | 0 (0.0%) | 0 (0.0%) |
| 16 and 17 Years | 0 (0.0%) | 0 (0.0%) |
| 18 to 24 Years | 5 (17.2%) | 0 (0.0%) |
| 25 to 34 Years | 0 (0.0%) | 0 (0.0%) |
| 35 to 44 Years | 0 (0.0%) | 7 (6.2%) |
| 45 to 54 Years | 69 (48.9%) | 6 (4.6%) |
| 55 to 64 Years | 18 (7.5%) | 56 (16.2%) |
| 65 to 74 Years | 39 (13.5%) | 23 (7.2%) |
| 75 Years and over | 37 (20.4%) | 47 (10.8%) |
| Total | 168 (12.2%) | 139 (9.2%) |
Income Above Poverty by Sex and Age in Yountville
According to the poverty statistics in Yountville, males aged under 5 years and females aged 6 to 11 years are the age groups that are most secure financially, with 100.0% of males and 100.0% of females in these age groups living above the poverty line.
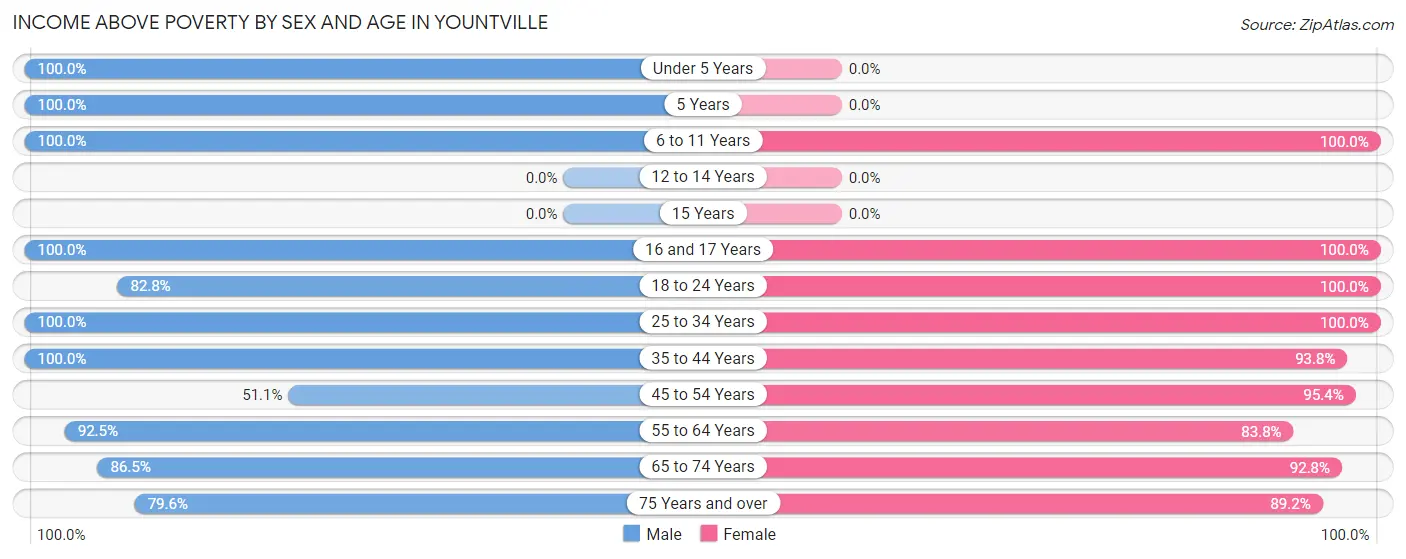
| Age Bracket | Male | Female |
| Under 5 Years | 34 (100.0%) | 0 (0.0%) |
| 5 Years | 9 (100.0%) | 0 (0.0%) |
| 6 to 11 Years | 73 (100.0%) | 32 (100.0%) |
| 12 to 14 Years | 0 (0.0%) | 0 (0.0%) |
| 15 Years | 0 (0.0%) | 0 (0.0%) |
| 16 and 17 Years | 19 (100.0%) | 14 (100.0%) |
| 18 to 24 Years | 24 (82.8%) | 16 (100.0%) |
| 25 to 34 Years | 230 (100.0%) | 105 (100.0%) |
| 35 to 44 Years | 129 (100.0%) | 106 (93.8%) |
| 45 to 54 Years | 72 (51.1%) | 123 (95.4%) |
| 55 to 64 Years | 223 (92.5%) | 290 (83.8%) |
| 65 to 74 Years | 249 (86.5%) | 297 (92.8%) |
| 75 Years and over | 144 (79.6%) | 389 (89.2%) |
| Total | 1,206 (87.8%) | 1,372 (90.8%) |
Income Below Poverty Among Married-Couple Families in Yountville
The poverty statistics for married-couple families in Yountville show that 6.6% or 33 of the total 502 families live below the poverty line. Families with no children have the highest poverty rate of 8.9%, comprising of 33 families. On the other hand, families with 1 or 2 children have the lowest poverty rate of 0.0%, which includes 0 families.
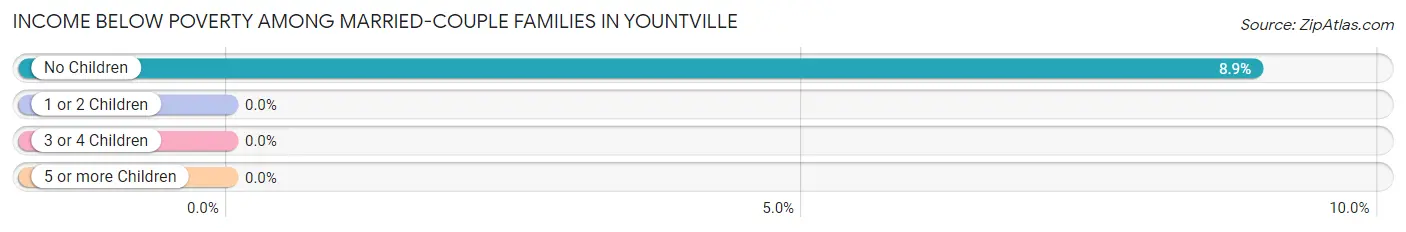
| Children | Above Poverty | Below Poverty |
| No Children | 337 (91.1%) | 33 (8.9%) |
| 1 or 2 Children | 132 (100.0%) | 0 (0.0%) |
| 3 or 4 Children | 0 (0.0%) | 0 (0.0%) |
| 5 or more Children | 0 (0.0%) | 0 (0.0%) |
| Total | 469 (93.4%) | 33 (6.6%) |
Income Below Poverty Among Single-Parent Households in Yountville
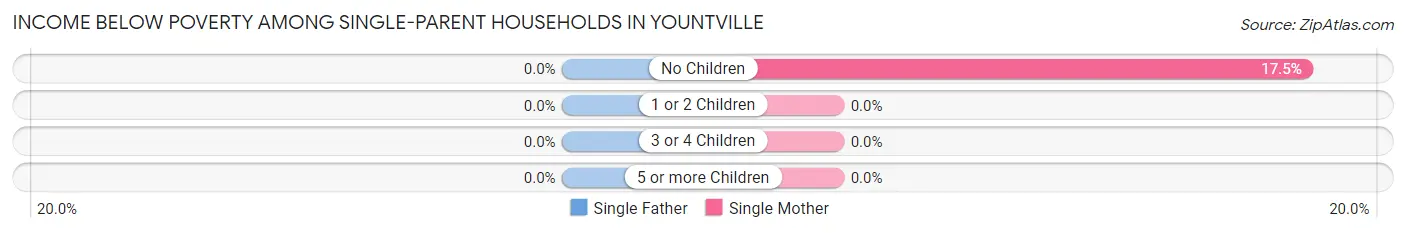
| Children | Single Father | Single Mother |
| No Children | 0 (0.0%) | 7 (17.5%) |
| 1 or 2 Children | 0 (0.0%) | 0 (0.0%) |
| 3 or 4 Children | 0 (0.0%) | 0 (0.0%) |
| 5 or more Children | 0 (0.0%) | 0 (0.0%) |
| Total | 0 (0.0%) | 7 (10.3%) |
Income Below Poverty Among Married-Couple vs Single-Parent Households in Yountville
The poverty data for Yountville shows that 33 of the married-couple family households (6.6%) and 7 of the single-parent households (8.1%) are living below the poverty level. Within the married-couple family households, those with no children have the highest poverty rate, with 33 households (8.9%) falling below the poverty line. Among the single-parent households, those with no children have the highest poverty rate, with 7 household (11.9%) living below poverty.
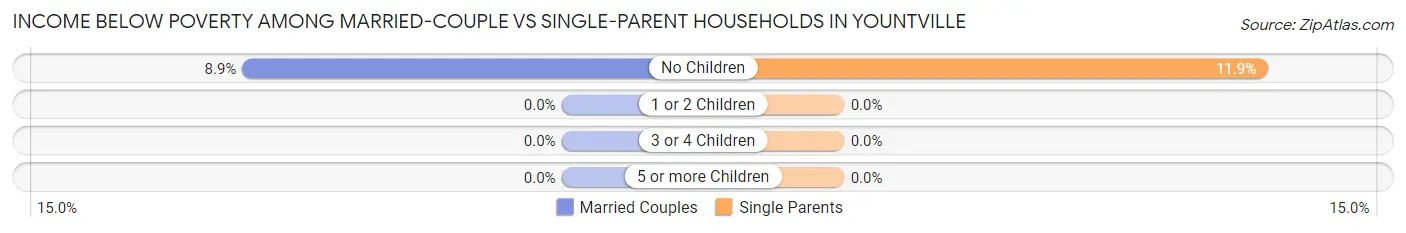
| Children | Married-Couple Families | Single-Parent Households |
| No Children | 33 (8.9%) | 7 (11.9%) |
| 1 or 2 Children | 0 (0.0%) | 0 (0.0%) |
| 3 or 4 Children | 0 (0.0%) | 0 (0.0%) |
| 5 or more Children | 0 (0.0%) | 0 (0.0%) |
| Total | 33 (6.6%) | 7 (8.1%) |
Race in Yountville
The most populous races in Yountville are White / Caucasian (2,729 | 80.3%), Hispanic or Latino (684 | 20.1%), and Two or more Races (208 | 6.1%).
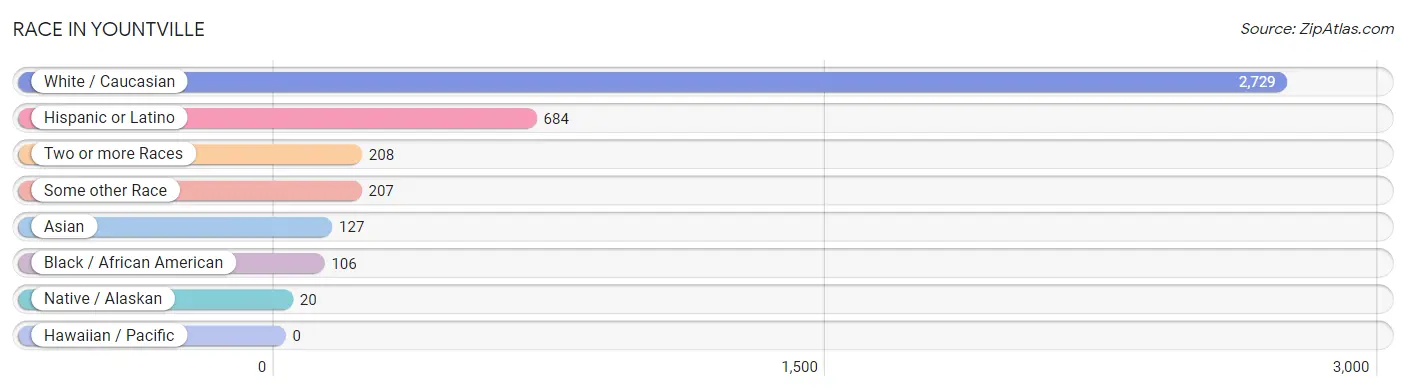
| Race | # Population | % Population |
| Asian | 127 | 3.7% |
| Black / African American | 106 | 3.1% |
| Hawaiian / Pacific | 0 | 0.0% |
| Hispanic or Latino | 684 | 20.1% |
| Native / Alaskan | 20 | 0.6% |
| White / Caucasian | 2,729 | 80.3% |
| Two or more Races | 208 | 6.1% |
| Some other Race | 207 | 6.1% |
| Total | 3,397 | 100.0% |
Ancestry in Yountville
The most populous ancestries reported in Yountville are Mexican (511 | 15.0%), English (507 | 14.9%), German (428 | 12.6%), Italian (346 | 10.2%), and Irish (331 | 9.7%), together accounting for 62.5% of all Yountville residents.
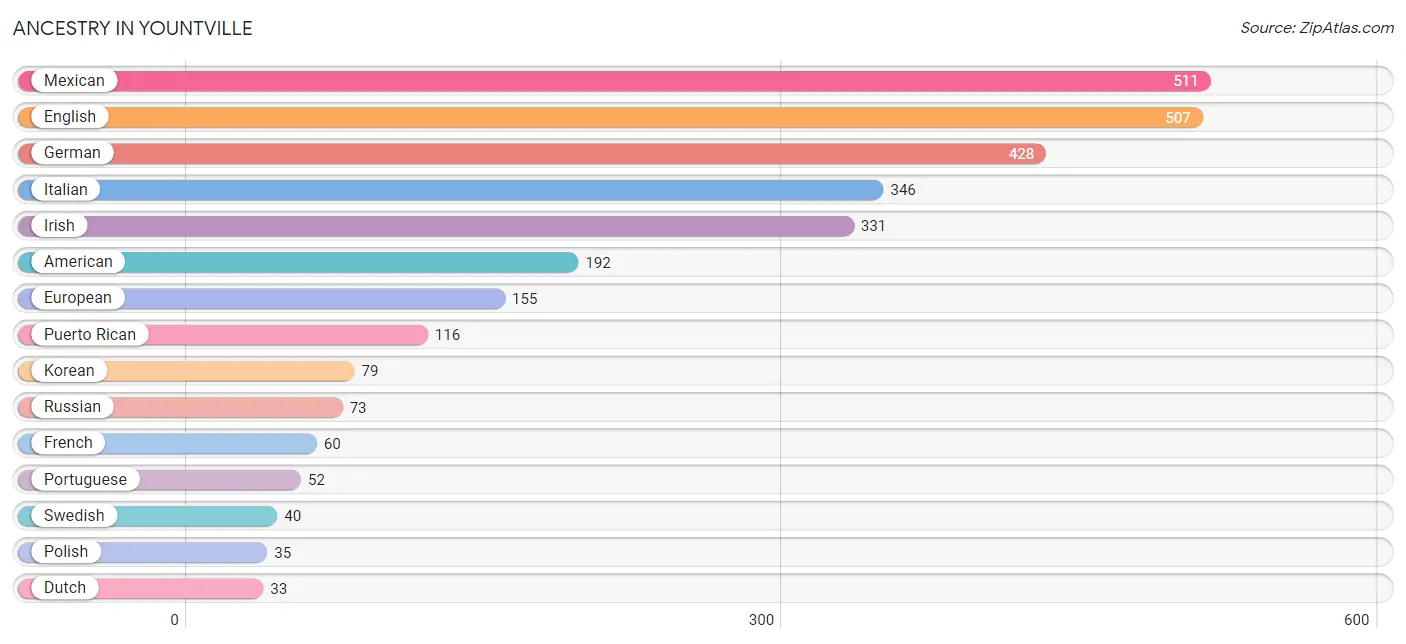
| Ancestry | # Population | % Population |
| African | 6 | 0.2% |
| American | 192 | 5.7% |
| Arab | 10 | 0.3% |
| Belgian | 6 | 0.2% |
| Bhutanese | 18 | 0.5% |
| Blackfeet | 5 | 0.2% |
| British | 20 | 0.6% |
| Burmese | 12 | 0.4% |
| Celtic | 8 | 0.2% |
| Central American | 9 | 0.3% |
| Cherokee | 9 | 0.3% |
| Chilean | 12 | 0.4% |
| Croatian | 18 | 0.5% |
| Danish | 22 | 0.6% |
| Dutch | 33 | 1.0% |
| Eastern European | 17 | 0.5% |
| English | 507 | 14.9% |
| European | 155 | 4.6% |
| Finnish | 13 | 0.4% |
| French | 60 | 1.8% |
| German | 428 | 12.6% |
| Greek | 9 | 0.3% |
| Guatemalan | 5 | 0.2% |
| Guyanese | 15 | 0.4% |
| Honduran | 4 | 0.1% |
| Hungarian | 4 | 0.1% |
| Indian (Asian) | 19 | 0.6% |
| Iranian | 12 | 0.4% |
| Irish | 331 | 9.7% |
| Italian | 346 | 10.2% |
| Jamaican | 23 | 0.7% |
| Korean | 79 | 2.3% |
| Lebanese | 10 | 0.3% |
| Mexican | 511 | 15.0% |
| Navajo | 6 | 0.2% |
| Norwegian | 29 | 0.9% |
| Polish | 35 | 1.0% |
| Portuguese | 52 | 1.5% |
| Puerto Rican | 116 | 3.4% |
| Russian | 73 | 2.1% |
| Scandinavian | 5 | 0.2% |
| Scotch-Irish | 14 | 0.4% |
| Scottish | 26 | 0.8% |
| Serbian | 14 | 0.4% |
| Slovene | 8 | 0.2% |
| South American | 17 | 0.5% |
| Spaniard | 8 | 0.2% |
| Spanish | 16 | 0.5% |
| Sri Lankan | 7 | 0.2% |
| Subsaharan African | 6 | 0.2% |
| Swedish | 40 | 1.2% |
| Swiss | 33 | 1.0% |
| Thai | 13 | 0.4% |
| Ukrainian | 15 | 0.4% |
| Venezuelan | 5 | 0.2% |
| West Indian | 14 | 0.4% | View All 56 Rows |
Immigrants in Yountville
The most numerous immigrant groups reported in Yountville came from Latin America (227 | 6.7%), Central America (200 | 5.9%), Mexico (200 | 5.9%), Asia (118 | 3.5%), and Europe (97 | 2.9%), together accounting for 24.8% of all Yountville residents.
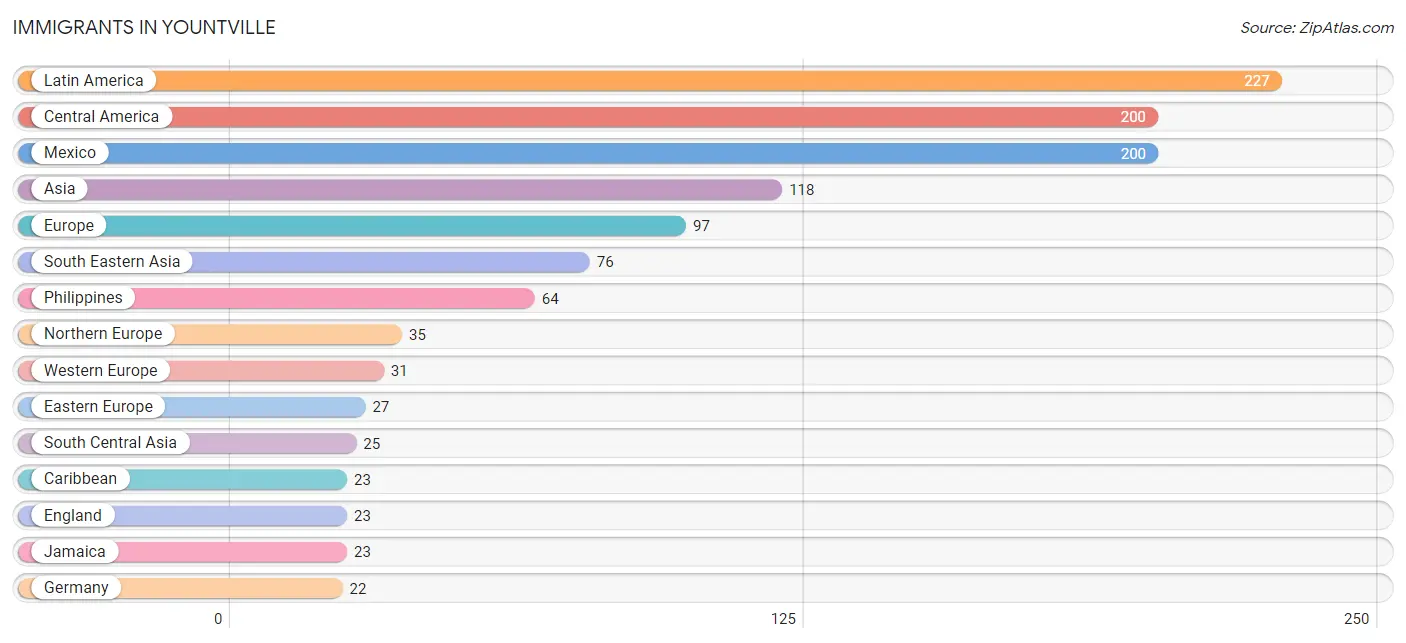
| Immigration Origin | # Population | % Population |
| Africa | 6 | 0.2% |
| Argentina | 4 | 0.1% |
| Asia | 118 | 3.5% |
| Australia | 12 | 0.4% |
| Bulgaria | 6 | 0.2% |
| Canada | 13 | 0.4% |
| Caribbean | 23 | 0.7% |
| Central America | 200 | 5.9% |
| China | 8 | 0.2% |
| Eastern Asia | 17 | 0.5% |
| Eastern Europe | 27 | 0.8% |
| England | 23 | 0.7% |
| Europe | 97 | 2.9% |
| France | 9 | 0.3% |
| Germany | 22 | 0.6% |
| India | 13 | 0.4% |
| Iran | 12 | 0.4% |
| Italy | 4 | 0.1% |
| Jamaica | 23 | 0.7% |
| Korea | 9 | 0.3% |
| Latin America | 227 | 6.7% |
| Mexico | 200 | 5.9% |
| Northern Europe | 35 | 1.0% |
| Oceania | 12 | 0.4% |
| Philippines | 64 | 1.9% |
| Poland | 14 | 0.4% |
| South Africa | 6 | 0.2% |
| South America | 4 | 0.1% |
| South Central Asia | 25 | 0.7% |
| South Eastern Asia | 76 | 2.2% |
| Southern Europe | 4 | 0.1% |
| Vietnam | 7 | 0.2% |
| Western Europe | 31 | 0.9% | View All 33 Rows |
Sex and Age in Yountville
Sex and Age in Yountville
The most populous age groups in Yountville are 65 to 69 Years (218 | 13.8%) for men and 85 Years and over (402 | 22.1%) for women.
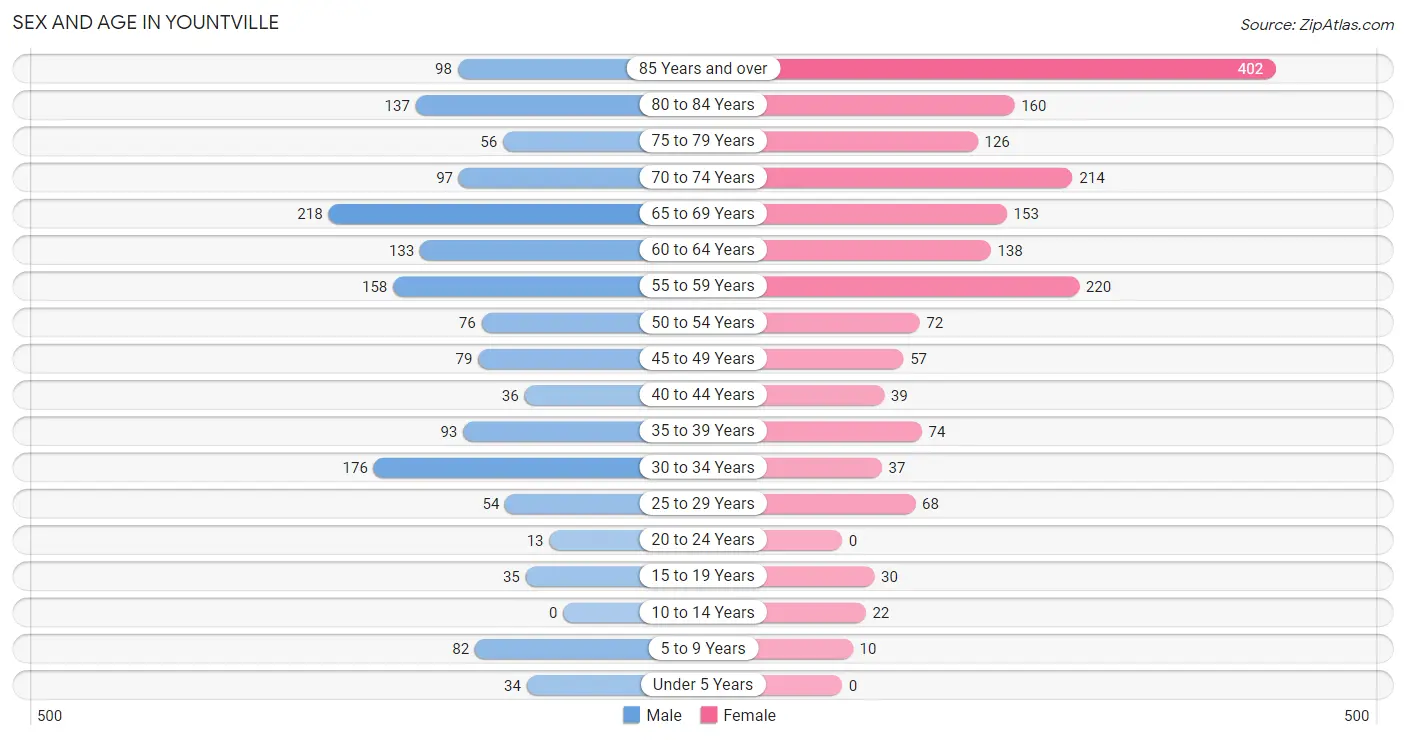
| Age Bracket | Male | Female |
| Under 5 Years | 34 (2.2%) | 0 (0.0%) |
| 5 to 9 Years | 82 (5.2%) | 10 (0.5%) |
| 10 to 14 Years | 0 (0.0%) | 22 (1.2%) |
| 15 to 19 Years | 35 (2.2%) | 30 (1.7%) |
| 20 to 24 Years | 13 (0.8%) | 0 (0.0%) |
| 25 to 29 Years | 54 (3.4%) | 68 (3.7%) |
| 30 to 34 Years | 176 (11.2%) | 37 (2.0%) |
| 35 to 39 Years | 93 (5.9%) | 74 (4.1%) |
| 40 to 44 Years | 36 (2.3%) | 39 (2.1%) |
| 45 to 49 Years | 79 (5.0%) | 57 (3.1%) |
| 50 to 54 Years | 76 (4.8%) | 72 (4.0%) |
| 55 to 59 Years | 158 (10.0%) | 220 (12.1%) |
| 60 to 64 Years | 133 (8.4%) | 138 (7.6%) |
| 65 to 69 Years | 218 (13.8%) | 153 (8.4%) |
| 70 to 74 Years | 97 (6.2%) | 214 (11.7%) |
| 75 to 79 Years | 56 (3.6%) | 126 (6.9%) |
| 80 to 84 Years | 137 (8.7%) | 160 (8.8%) |
| 85 Years and over | 98 (6.2%) | 402 (22.1%) |
| Total | 1,575 (100.0%) | 1,822 (100.0%) |
Families and Households in Yountville
Median Family Size in Yountville
The median family size in Yountville is 2.66 persons per family, with single female/mother families (68 | 11.5%) accounting for the largest median family size of 3.19 persons per family. On the other hand, single male/father families (19 | 3.2%) represent the smallest median family size with 2.21 persons per family.
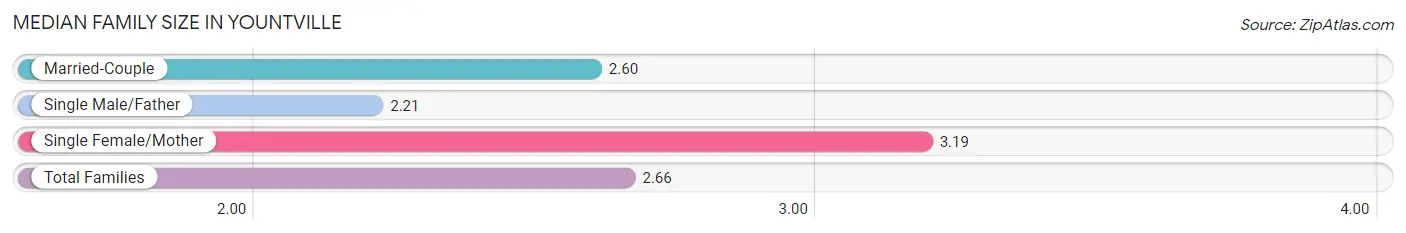
| Family Type | # Families | Family Size |
| Married-Couple | 502 (85.2%) | 2.60 |
| Single Male/Father | 19 (3.2%) | 2.21 |
| Single Female/Mother | 68 (11.5%) | 3.19 |
| Total Families | 589 (100.0%) | 2.66 |
Median Household Size in Yountville
The median household size in Yountville is 1.75 persons per household, with single female/mother households (68 | 4.5%) accounting for the largest median household size of 3.59 persons per household. non-family households (927 | 61.2%) represent the smallest median household size with 1.14 persons per household.
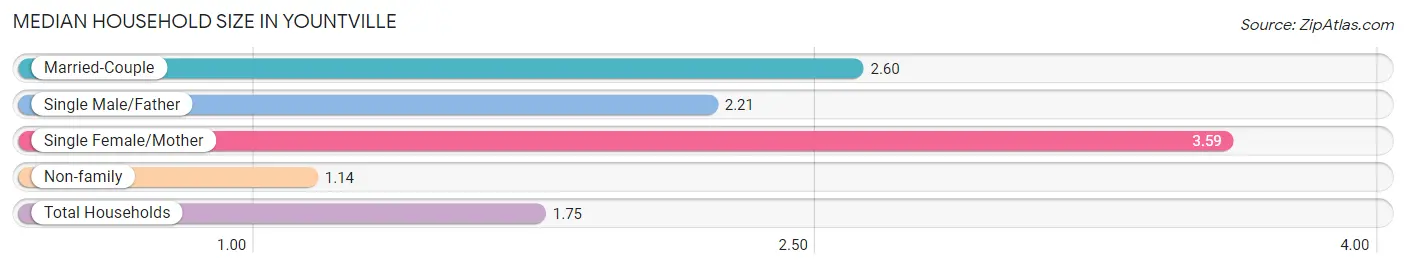
| Household Type | # Households | Household Size |
| Married-Couple | 502 (33.1%) | 2.60 |
| Single Male/Father | 19 (1.3%) | 2.21 |
| Single Female/Mother | 68 (4.5%) | 3.59 |
| Non-family | 927 (61.2%) | 1.14 |
| Total Households | 1,516 (100.0%) | 1.75 |
Household Size by Marriage Status in Yountville
Out of a total of 1,516 households in Yountville, 589 (38.9%) are family households, while 927 (61.2%) are nonfamily households. The most numerous type of family households are 2-person households, comprising 392, and the most common type of nonfamily households are 1-person households, comprising 803.
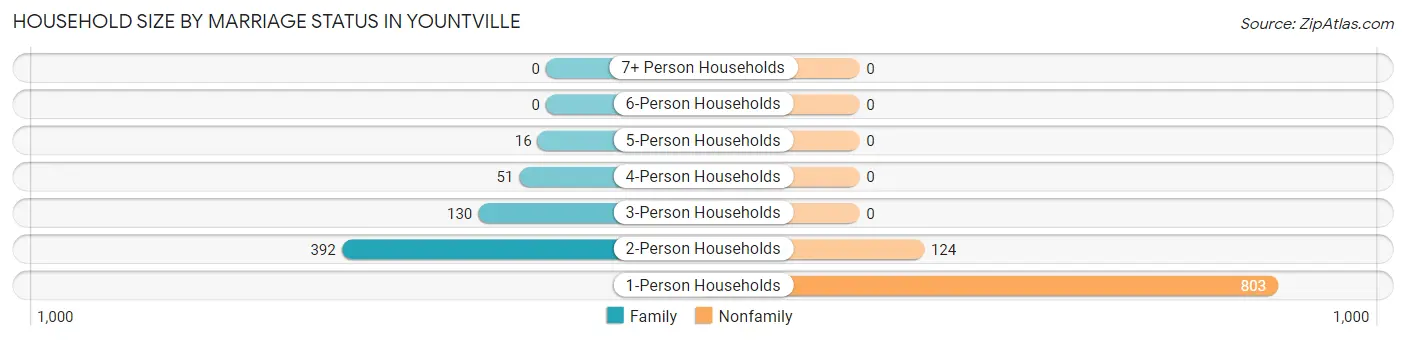
| Household Size | Family Households | Nonfamily Households |
| 1-Person Households | - | 803 (53.0%) |
| 2-Person Households | 392 (25.9%) | 124 (8.2%) |
| 3-Person Households | 130 (8.6%) | 0 (0.0%) |
| 4-Person Households | 51 (3.4%) | 0 (0.0%) |
| 5-Person Households | 16 (1.1%) | 0 (0.0%) |
| 6-Person Households | 0 (0.0%) | 0 (0.0%) |
| 7+ Person Households | 0 (0.0%) | 0 (0.0%) |
| Total | 589 (38.9%) | 927 (61.2%) |
Female Fertility in Yountville
Fertility by Age in Yountville
Average fertility rate in Yountville is 22.0 births per 1,000 women. Women in the age bracket of 20 to 34 years have the highest fertility rate with 67.0 births per 1,000 women. Women in the age bracket of 20 to 34 years acount for 100.0% of all women with births.
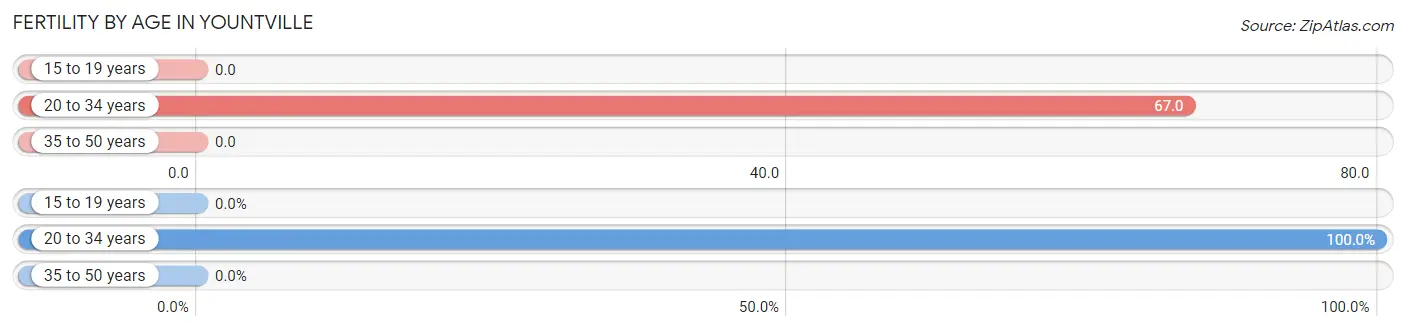
| Age Bracket | Women with Births | Births / 1,000 Women |
| 15 to 19 years | 0 (0.0%) | 0.0 |
| 20 to 34 years | 7 (100.0%) | 67.0 |
| 35 to 50 years | 0 (0.0%) | 0.0 |
| Total | 7 (100.0%) | 22.0 |
Fertility by Age by Marriage Status in Yountville
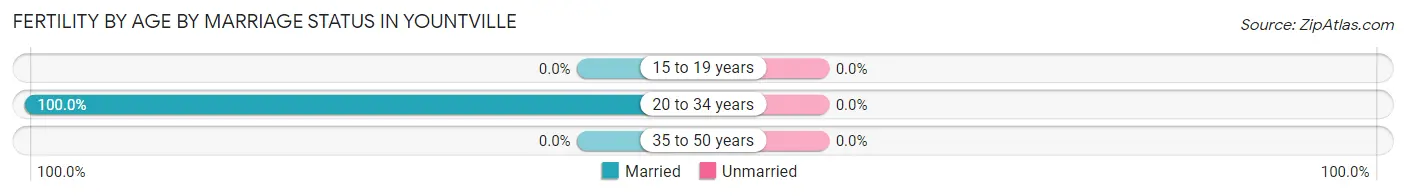
| Age Bracket | Married | Unmarried |
| 15 to 19 years | 0 (0.0%) | 0 (0.0%) |
| 20 to 34 years | 7 (100.0%) | 0 (0.0%) |
| 35 to 50 years | 0 (0.0%) | 0 (0.0%) |
| Total | 7 (100.0%) | 0 (0.0%) |
Fertility by Education in Yountville
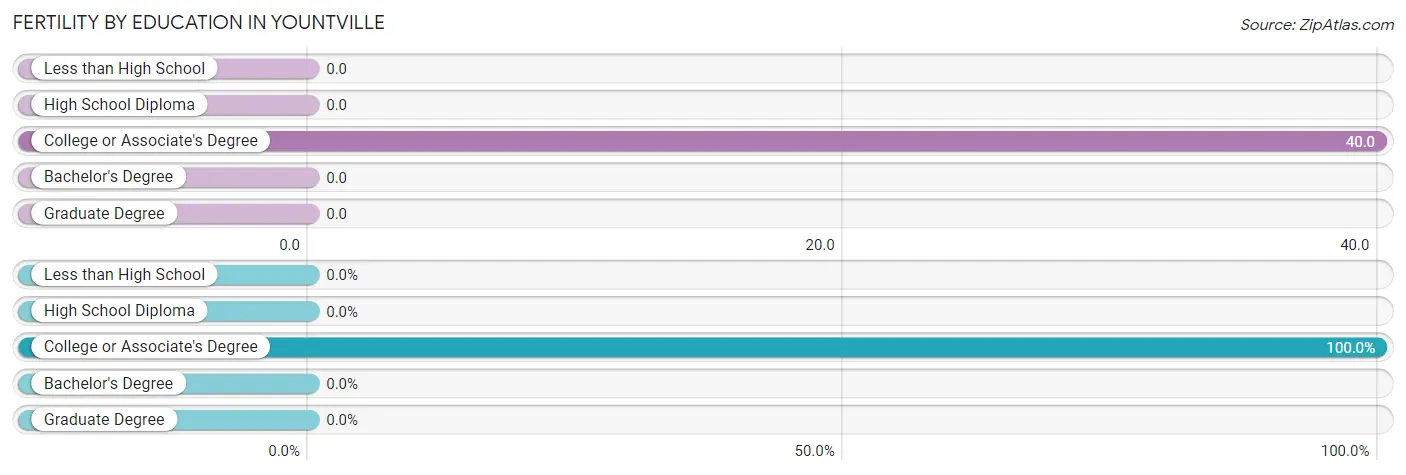
| Educational Attainment | Women with Births | Births / 1,000 Women |
| Less than High School | 0 (0.0%) | 0.0 |
| High School Diploma | 0 (0.0%) | 0.0 |
| College or Associate's Degree | 7 (100.0%) | 40.0 |
| Bachelor's Degree | 0 (0.0%) | 0.0 |
| Graduate Degree | 0 (0.0%) | 0.0 |
| Total | 7 (100.0%) | 22.0 |
Fertility by Education by Marriage Status in Yountville
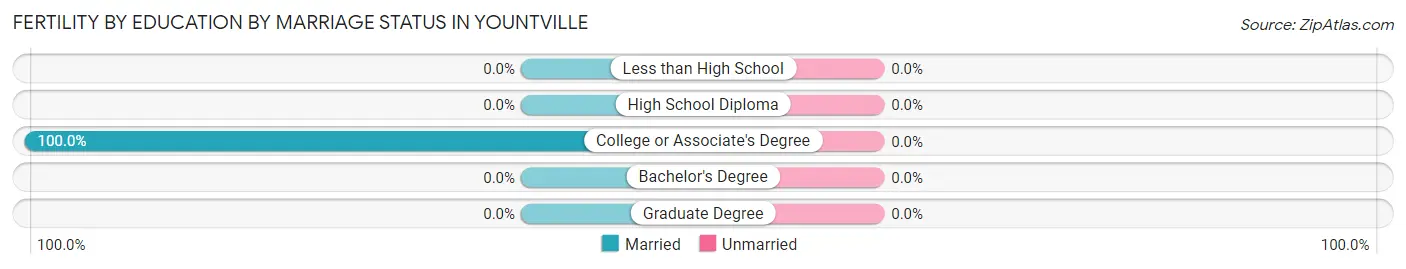
| Educational Attainment | Married | Unmarried |
| Less than High School | 0 (0.0%) | 0 (0.0%) |
| High School Diploma | 0 (0.0%) | 0 (0.0%) |
| College or Associate's Degree | 7 (100.0%) | 0 (0.0%) |
| Bachelor's Degree | 0 (0.0%) | 0 (0.0%) |
| Graduate Degree | 0 (0.0%) | 0 (0.0%) |
| Total | 7 (100.0%) | 0 (0.0%) |
Employment Characteristics in Yountville
Employment by Class of Employer in Yountville
Among the 1,295 employed individuals in Yountville, private company employees (830 | 64.1%), self-employed (not incorporated) (178 | 13.8%), and self-employed (incorporated) (84 | 6.5%) make up the most common classes of employment.
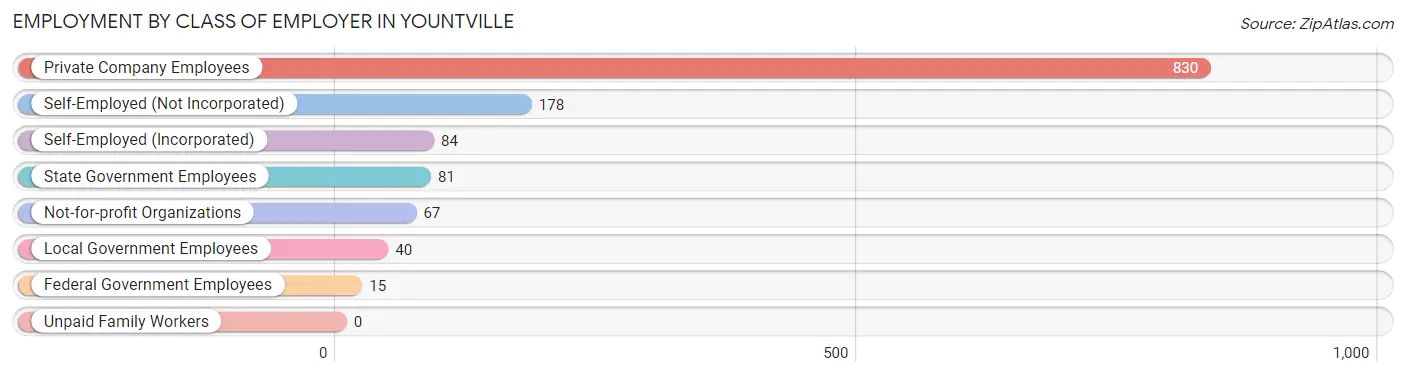
| Employer Class | # Employees | % Employees |
| Private Company Employees | 830 | 64.1% |
| Self-Employed (Incorporated) | 84 | 6.5% |
| Self-Employed (Not Incorporated) | 178 | 13.8% |
| Not-for-profit Organizations | 67 | 5.2% |
| Local Government Employees | 40 | 3.1% |
| State Government Employees | 81 | 6.2% |
| Federal Government Employees | 15 | 1.2% |
| Unpaid Family Workers | 0 | 0.0% |
| Total | 1,295 | 100.0% |
Employment Status by Age in Yountville
According to the labor force statistics for Yountville, out of the total population over 16 years of age (3,249), 44.2% or 1,436 individuals are in the labor force, with 7.2% or 103 of them unemployed. The age group with the highest labor force participation rate is 30 to 34 years, with 92.0% or 196 individuals in the labor force. Within the labor force, the 16 to 19 years age range has the highest percentage of unemployed individuals, with 46.7% or 14 of them being unemployed.
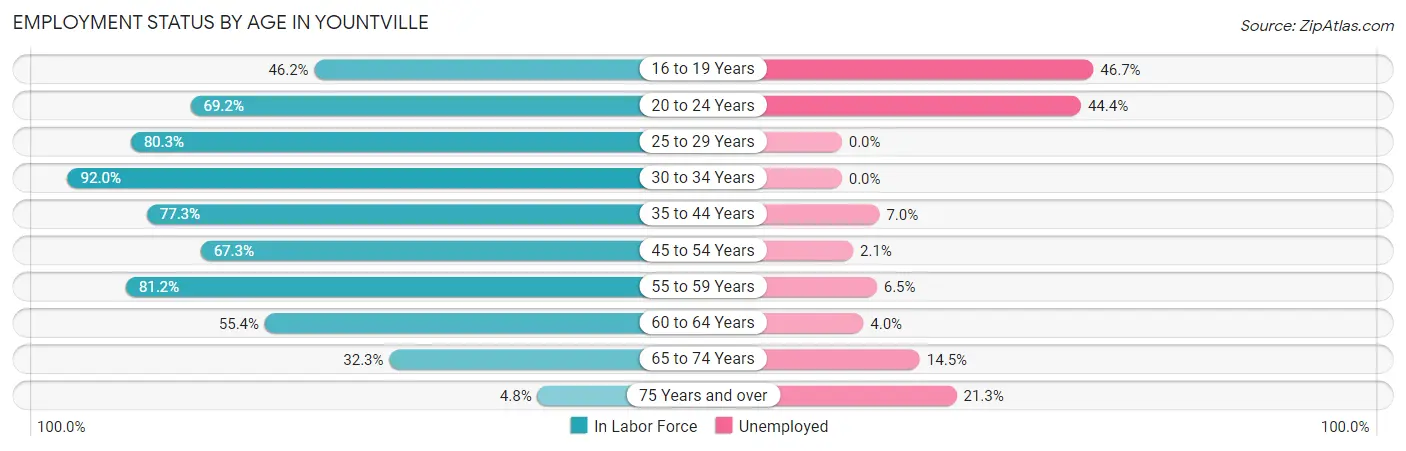
| Age Bracket | In Labor Force | Unemployed |
| 16 to 19 Years | 30 (46.2%) | 14 (46.7%) |
| 20 to 24 Years | 9 (69.2%) | 4 (44.4%) |
| 25 to 29 Years | 98 (80.3%) | 0 (0.0%) |
| 30 to 34 Years | 196 (92.0%) | 0 (0.0%) |
| 35 to 44 Years | 187 (77.3%) | 13 (7.0%) |
| 45 to 54 Years | 191 (67.3%) | 4 (2.1%) |
| 55 to 59 Years | 307 (81.2%) | 20 (6.5%) |
| 60 to 64 Years | 150 (55.4%) | 6 (4.0%) |
| 65 to 74 Years | 220 (32.3%) | 32 (14.5%) |
| 75 Years and over | 47 (4.8%) | 10 (21.3%) |
| Total | 1,436 (44.2%) | 103 (7.2%) |
Employment Status by Educational Attainment in Yountville
According to labor force statistics for Yountville, 74.8% of individuals (1,129) out of the total population between 25 and 64 years of age (1,510) are in the labor force, with 3.8% or 43 of them being unemployed. The group with the highest labor force participation rate are those with the educational attainment of bachelor's degree or higher, with 83.0% or 453 individuals in the labor force. Within the labor force, individuals with less than high school education have the highest percentage of unemployment, with 14.3% or 4 of them being unemployed.
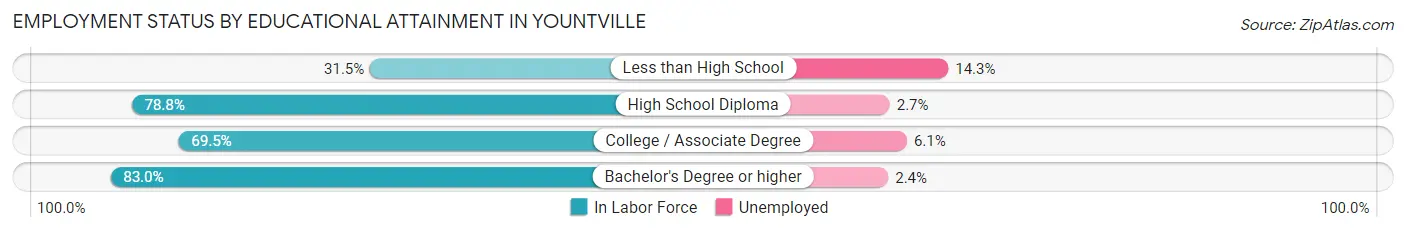
| Educational Attainment | In Labor Force | Unemployed |
| Less than High School | 28 (31.5%) | 13 (14.3%) |
| High School Diploma | 338 (78.8%) | 12 (2.7%) |
| College / Associate Degree | 310 (69.5%) | 27 (6.1%) |
| Bachelor's Degree or higher | 453 (83.0%) | 13 (2.4%) |
| Total | 1,129 (74.8%) | 57 (3.8%) |
Employment Occupations by Sex in Yountville
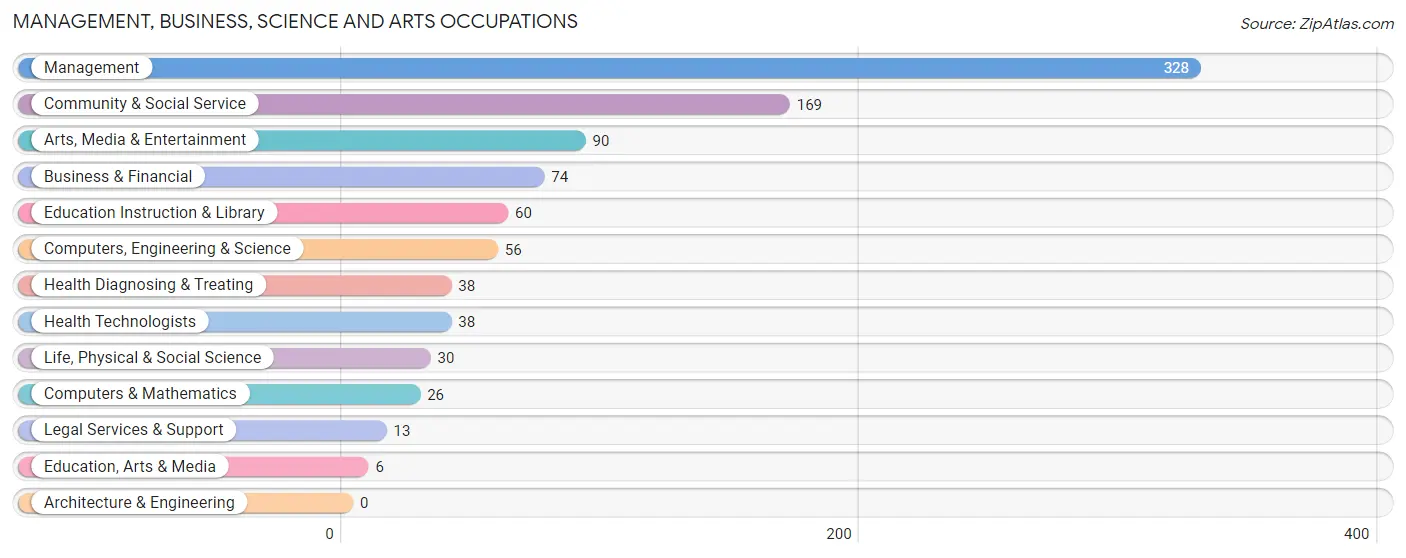
Management, Business, Science and Arts Occupations
The most common Management, Business, Science and Arts occupations in Yountville are Management (328 | 24.6%), Community & Social Service (169 | 12.7%), Arts, Media & Entertainment (90 | 6.8%), Business & Financial (74 | 5.6%), and Education Instruction & Library (60 | 4.5%).
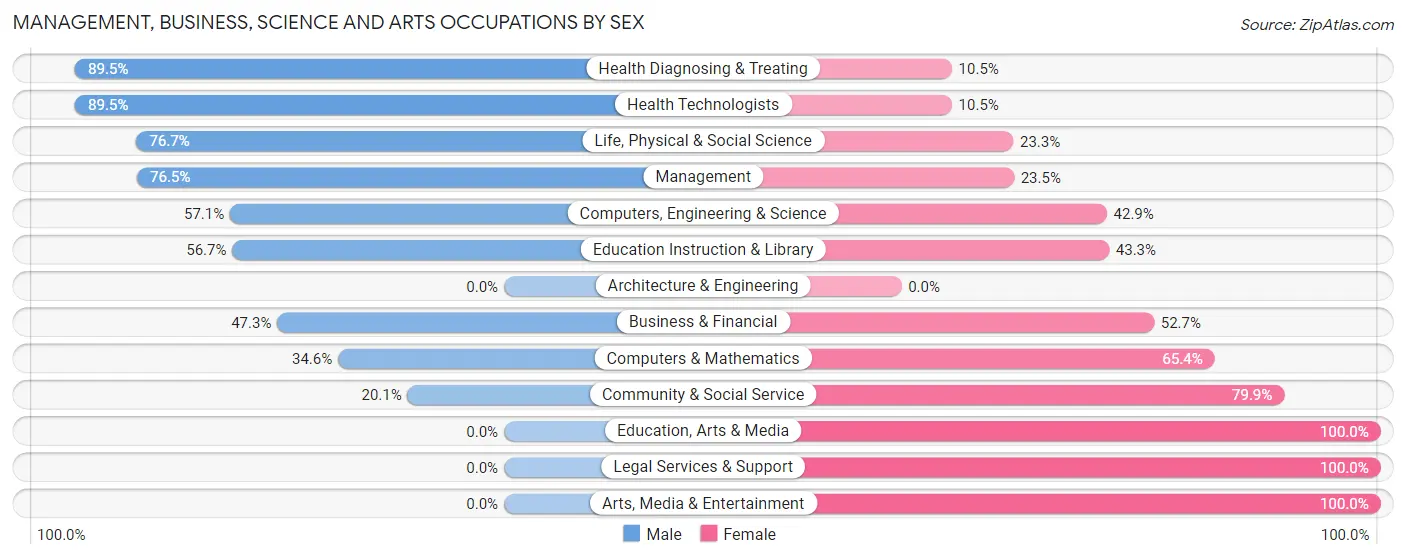
Management, Business, Science and Arts Occupations by Sex
Within the Management, Business, Science and Arts occupations in Yountville, the most male-oriented occupations are Health Diagnosing & Treating (89.5%), Health Technologists (89.5%), and Life, Physical & Social Science (76.7%), while the most female-oriented occupations are Education, Arts & Media (100.0%), Legal Services & Support (100.0%), and Arts, Media & Entertainment (100.0%).
| Occupation | Male | Female |
| Management | 251 (76.5%) | 77 (23.5%) |
| Business & Financial | 35 (47.3%) | 39 (52.7%) |
| Computers, Engineering & Science | 32 (57.1%) | 24 (42.9%) |
| Computers & Mathematics | 9 (34.6%) | 17 (65.4%) |
| Architecture & Engineering | 0 (0.0%) | 0 (0.0%) |
| Life, Physical & Social Science | 23 (76.7%) | 7 (23.3%) |
| Community & Social Service | 34 (20.1%) | 135 (79.9%) |
| Education, Arts & Media | 0 (0.0%) | 6 (100.0%) |
| Legal Services & Support | 0 (0.0%) | 13 (100.0%) |
| Education Instruction & Library | 34 (56.7%) | 26 (43.3%) |
| Arts, Media & Entertainment | 0 (0.0%) | 90 (100.0%) |
| Health Diagnosing & Treating | 34 (89.5%) | 4 (10.5%) |
| Health Technologists | 34 (89.5%) | 4 (10.5%) |
| Total (Category) | 386 (58.1%) | 279 (41.9%) |
| Total (Overall) | 741 (55.6%) | 591 (44.4%) |
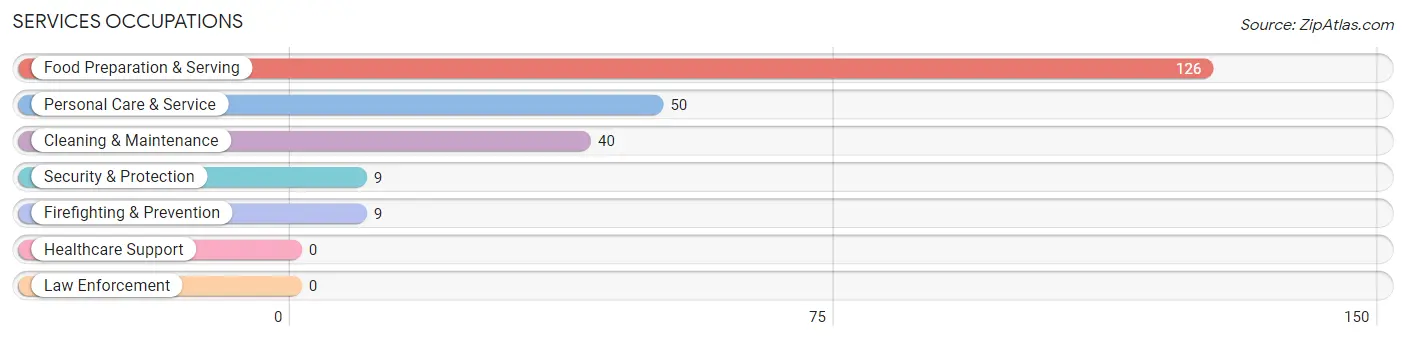
Services Occupations
The most common Services occupations in Yountville are Food Preparation & Serving (126 | 9.5%), Personal Care & Service (50 | 3.7%), Cleaning & Maintenance (40 | 3.0%), Security & Protection (9 | 0.7%), and Firefighting & Prevention (9 | 0.7%).
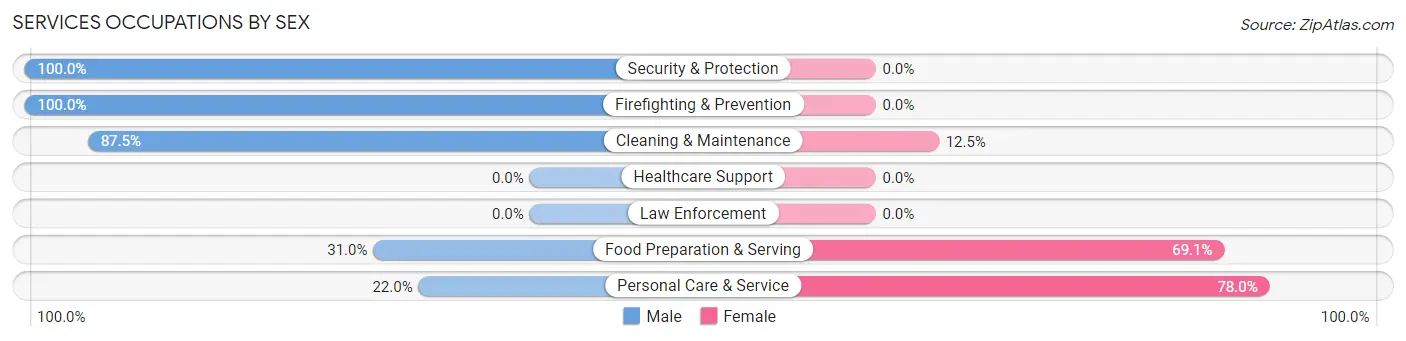
Services Occupations by Sex
Within the Services occupations in Yountville, the most male-oriented occupations are Security & Protection (100.0%), Firefighting & Prevention (100.0%), and Cleaning & Maintenance (87.5%), while the most female-oriented occupations are Personal Care & Service (78.0%), Food Preparation & Serving (69.1%), and Cleaning & Maintenance (12.5%).
| Occupation | Male | Female |
| Healthcare Support | 0 (0.0%) | 0 (0.0%) |
| Security & Protection | 9 (100.0%) | 0 (0.0%) |
| Firefighting & Prevention | 9 (100.0%) | 0 (0.0%) |
| Law Enforcement | 0 (0.0%) | 0 (0.0%) |
| Food Preparation & Serving | 39 (30.9%) | 87 (69.1%) |
| Cleaning & Maintenance | 35 (87.5%) | 5 (12.5%) |
| Personal Care & Service | 11 (22.0%) | 39 (78.0%) |
| Total (Category) | 94 (41.8%) | 131 (58.2%) |
| Total (Overall) | 741 (55.6%) | 591 (44.4%) |
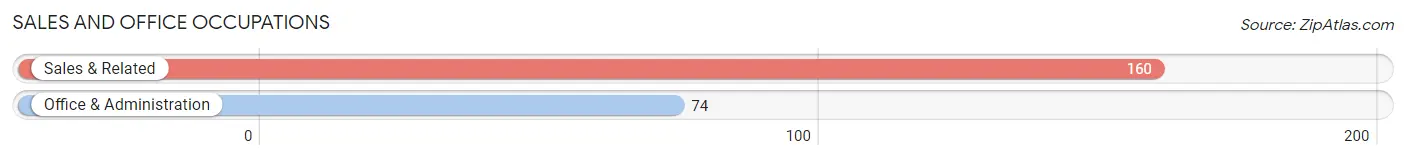
Sales and Office Occupations
The most common Sales and Office occupations in Yountville are Sales & Related (160 | 12.0%), and Office & Administration (74 | 5.6%).
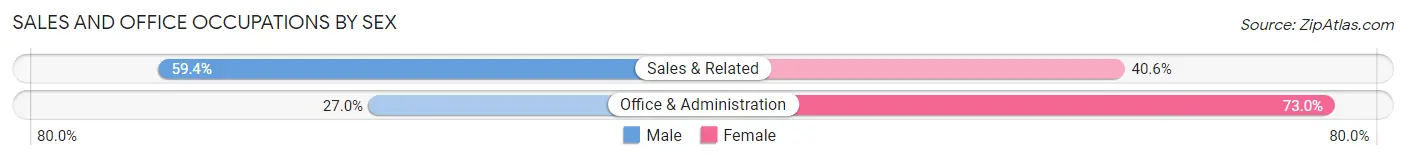
Sales and Office Occupations by Sex
| Occupation | Male | Female |
| Sales & Related | 95 (59.4%) | 65 (40.6%) |
| Office & Administration | 20 (27.0%) | 54 (73.0%) |
| Total (Category) | 115 (49.1%) | 119 (50.8%) |
| Total (Overall) | 741 (55.6%) | 591 (44.4%) |
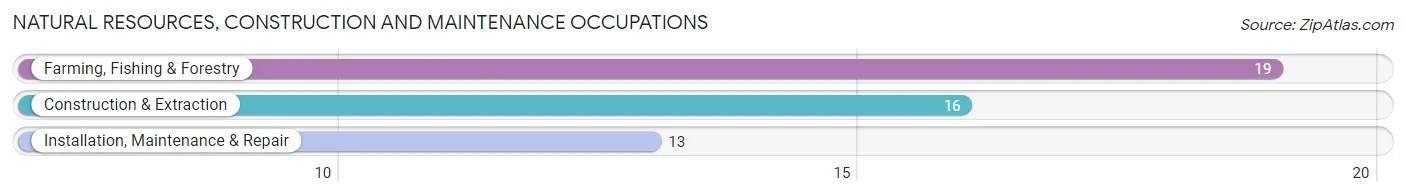
Natural Resources, Construction and Maintenance Occupations
The most common Natural Resources, Construction and Maintenance occupations in Yountville are Farming, Fishing & Forestry (19 | 1.4%), Construction & Extraction (16 | 1.2%), and Installation, Maintenance & Repair (13 | 1.0%).
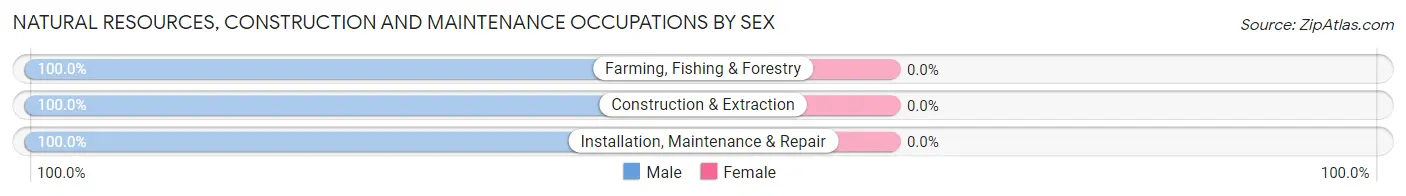
Natural Resources, Construction and Maintenance Occupations by Sex
| Occupation | Male | Female |
| Farming, Fishing & Forestry | 19 (100.0%) | 0 (0.0%) |
| Construction & Extraction | 16 (100.0%) | 0 (0.0%) |
| Installation, Maintenance & Repair | 13 (100.0%) | 0 (0.0%) |
| Total (Category) | 48 (100.0%) | 0 (0.0%) |
| Total (Overall) | 741 (55.6%) | 591 (44.4%) |
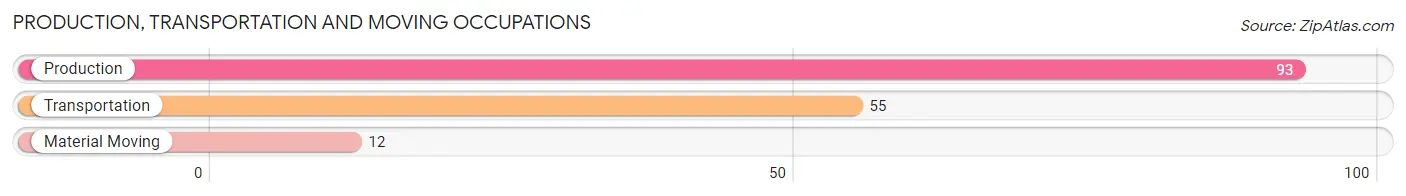
Production, Transportation and Moving Occupations
The most common Production, Transportation and Moving occupations in Yountville are Production (93 | 7.0%), Transportation (55 | 4.1%), and Material Moving (12 | 0.9%).
Production, Transportation and Moving Occupations by Sex
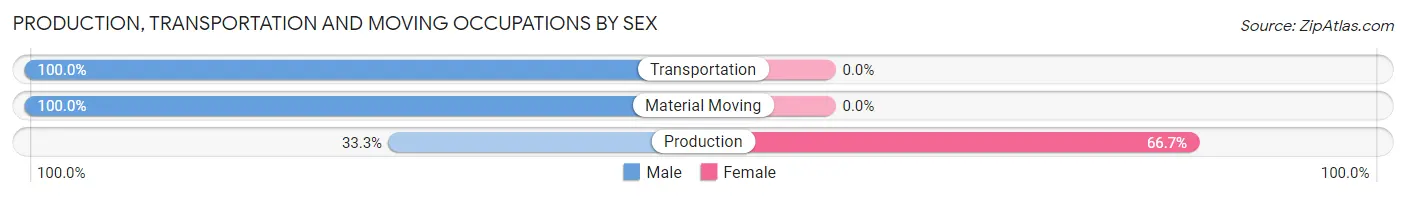
| Occupation | Male | Female |
| Production | 31 (33.3%) | 62 (66.7%) |
| Transportation | 55 (100.0%) | 0 (0.0%) |
| Material Moving | 12 (100.0%) | 0 (0.0%) |
| Total (Category) | 98 (61.3%) | 62 (38.8%) |
| Total (Overall) | 741 (55.6%) | 591 (44.4%) |
Employment Industries by Sex in Yountville
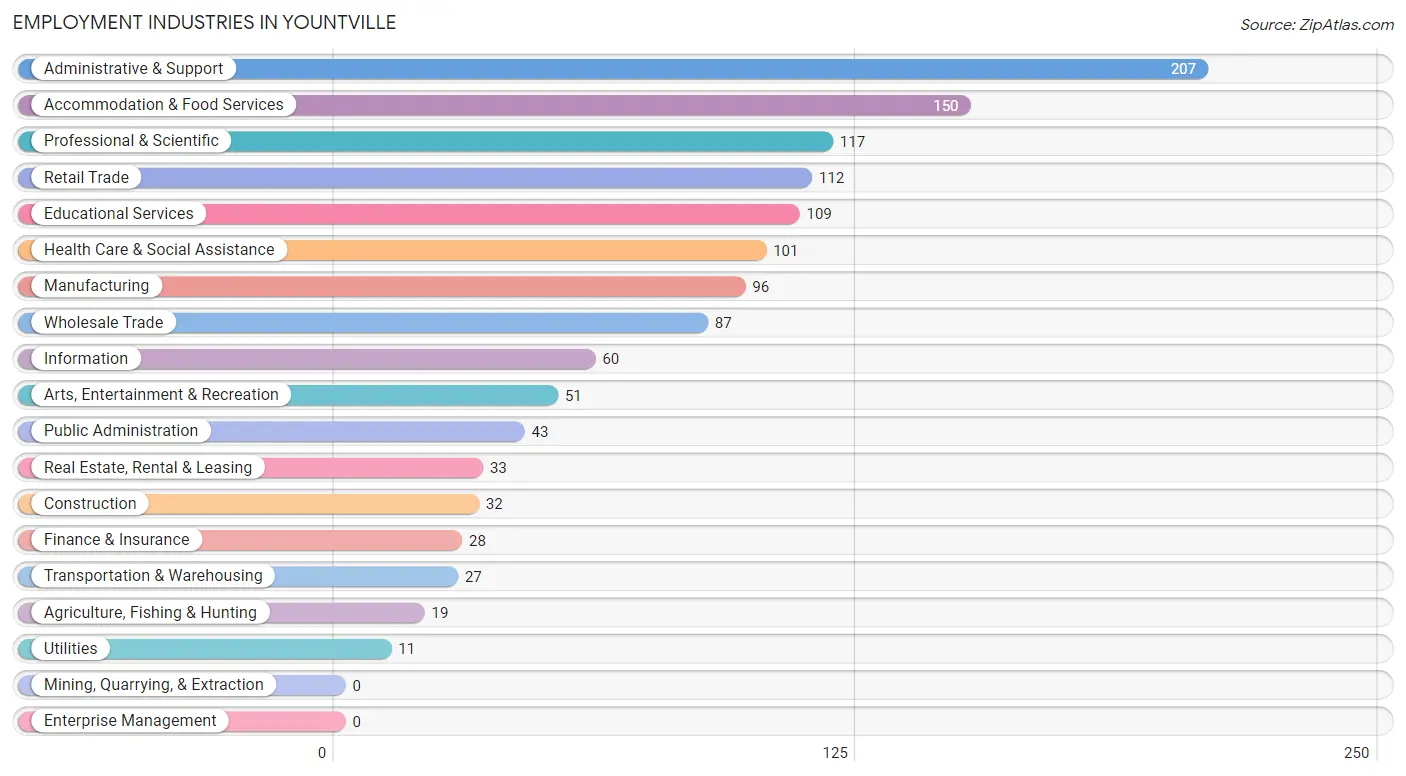
Employment Industries in Yountville
The major employment industries in Yountville include Administrative & Support (207 | 15.5%), Accommodation & Food Services (150 | 11.3%), Professional & Scientific (117 | 8.8%), Retail Trade (112 | 8.4%), and Educational Services (109 | 8.2%).
Employment Industries by Sex in Yountville
The Yountville industries that see more men than women are Agriculture, Fishing & Hunting (100.0%), Construction (100.0%), and Transportation & Warehousing (100.0%), whereas the industries that tend to have a higher number of women are Professional & Scientific (82.9%), Information (71.7%), and Health Care & Social Assistance (66.3%).
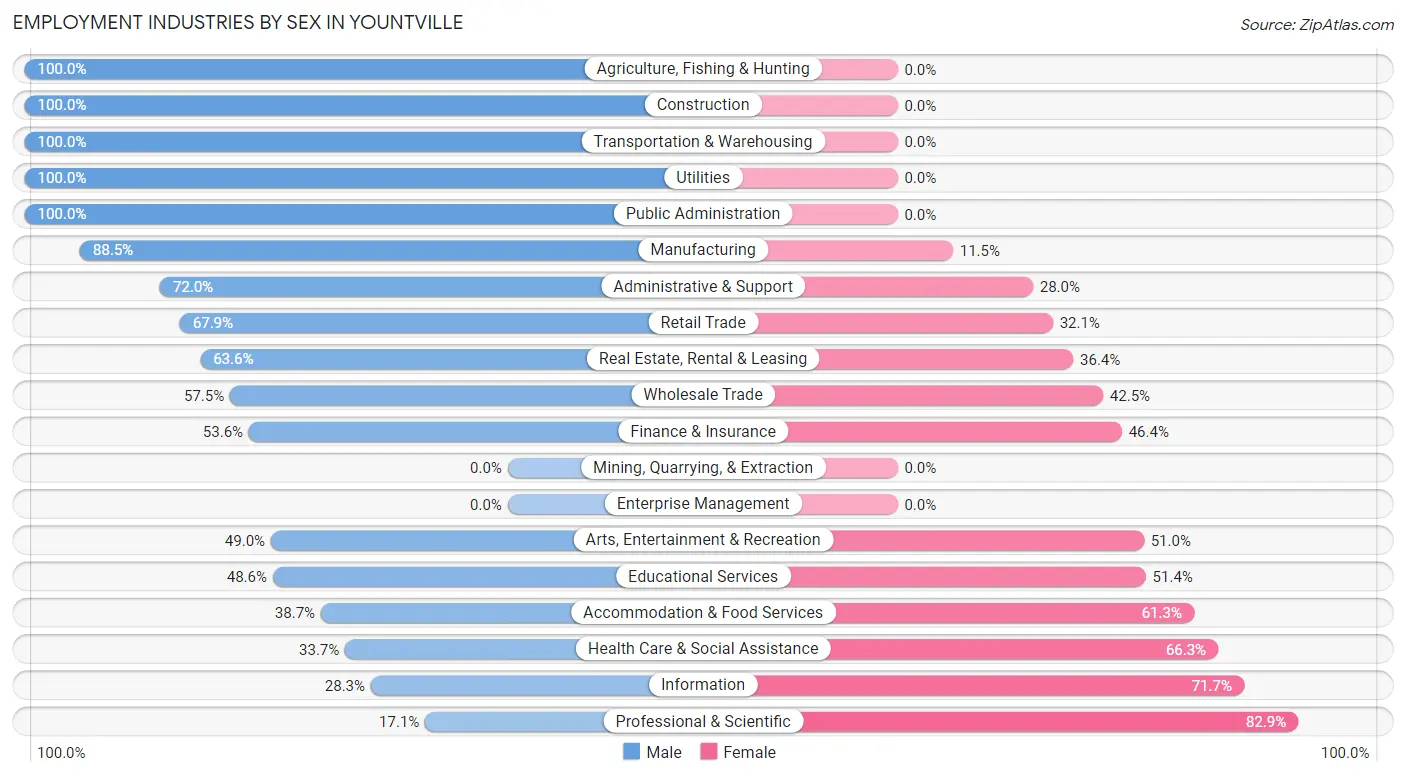
| Industry | Male | Female |
| Agriculture, Fishing & Hunting | 19 (100.0%) | 0 (0.0%) |
| Mining, Quarrying, & Extraction | 0 (0.0%) | 0 (0.0%) |
| Construction | 32 (100.0%) | 0 (0.0%) |
| Manufacturing | 85 (88.5%) | 11 (11.5%) |
| Wholesale Trade | 50 (57.5%) | 37 (42.5%) |
| Retail Trade | 76 (67.9%) | 36 (32.1%) |
| Transportation & Warehousing | 27 (100.0%) | 0 (0.0%) |
| Utilities | 11 (100.0%) | 0 (0.0%) |
| Information | 17 (28.3%) | 43 (71.7%) |
| Finance & Insurance | 15 (53.6%) | 13 (46.4%) |
| Real Estate, Rental & Leasing | 21 (63.6%) | 12 (36.4%) |
| Professional & Scientific | 20 (17.1%) | 97 (82.9%) |
| Enterprise Management | 0 (0.0%) | 0 (0.0%) |
| Administrative & Support | 149 (72.0%) | 58 (28.0%) |
| Educational Services | 53 (48.6%) | 56 (51.4%) |
| Health Care & Social Assistance | 34 (33.7%) | 67 (66.3%) |
| Arts, Entertainment & Recreation | 25 (49.0%) | 26 (51.0%) |
| Accommodation & Food Services | 58 (38.7%) | 92 (61.3%) |
| Public Administration | 43 (100.0%) | 0 (0.0%) |
| Total | 741 (55.6%) | 591 (44.4%) |
Education in Yountville
School Enrollment in Yountville
The most common levels of schooling among the 277 students in Yountville are elementary school (73 | 26.4%), college / undergraduate (51 | 18.4%), and high school (49 | 17.7%).
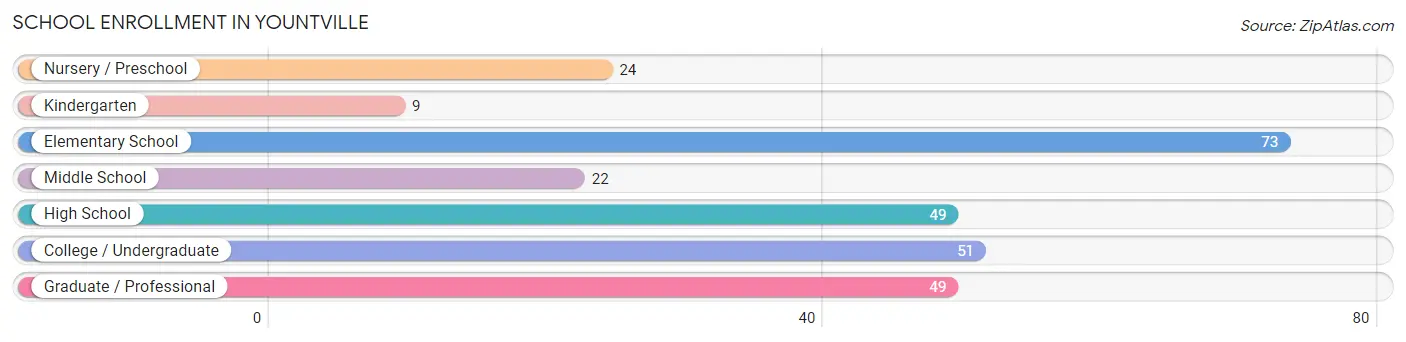
| School Level | # Students | % Students |
| Nursery / Preschool | 24 | 8.7% |
| Kindergarten | 9 | 3.3% |
| Elementary School | 73 | 26.4% |
| Middle School | 22 | 7.9% |
| High School | 49 | 17.7% |
| College / Undergraduate | 51 | 18.4% |
| Graduate / Professional | 49 | 17.7% |
| Total | 277 | 100.0% |
School Enrollment by Age by Funding Source in Yountville
Out of a total of 277 students who are enrolled in schools in Yountville, 100 (36.1%) attend a private institution, while the remaining 177 (63.9%) are enrolled in public schools. The age group of 3 to 4 year olds has the highest likelihood of being enrolled in private schools, with 24 (100.0% in the age bracket) enrolled. Conversely, the age group of 10 to 14 year olds has the lowest likelihood of being enrolled in a private school, with 22 (100.0% in the age bracket) attending a public institution.
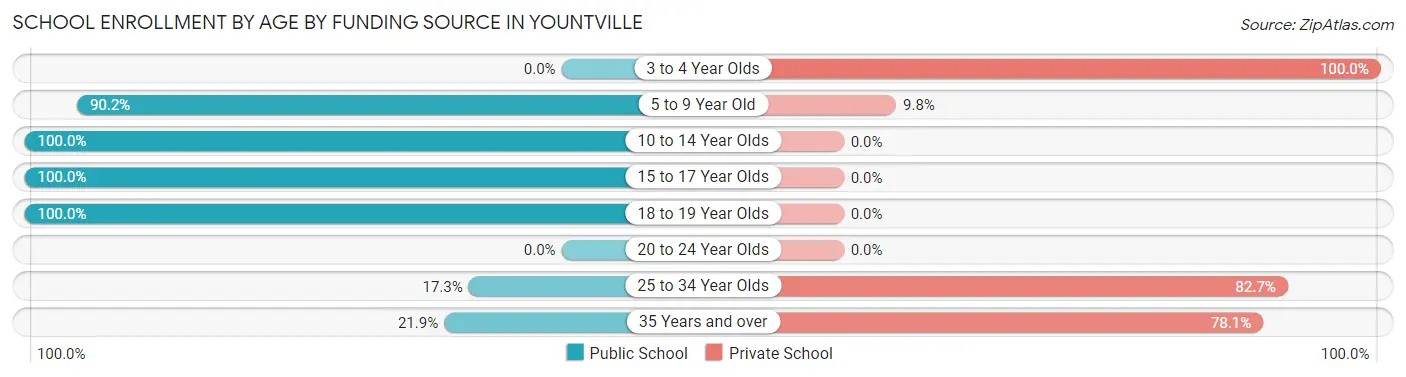
| Age Bracket | Public School | Private School |
| 3 to 4 Year Olds | 0 (0.0%) | 24 (100.0%) |
| 5 to 9 Year Old | 74 (90.2%) | 8 (9.8%) |
| 10 to 14 Year Olds | 22 (100.0%) | 0 (0.0%) |
| 15 to 17 Year Olds | 33 (100.0%) | 0 (0.0%) |
| 18 to 19 Year Olds | 32 (100.0%) | 0 (0.0%) |
| 20 to 24 Year Olds | 0 (0.0%) | 0 (0.0%) |
| 25 to 34 Year Olds | 9 (17.3%) | 43 (82.7%) |
| 35 Years and over | 7 (21.9%) | 25 (78.1%) |
| Total | 177 (63.9%) | 100 (36.1%) |
Educational Attainment by Field of Study in Yountville
Business (164 | 14.3%), liberal arts & history (108 | 9.4%), visual & performing arts (101 | 8.8%), literature & languages (96 | 8.4%), and social sciences (91 | 8.0%) are the most common fields of study among 1,145 individuals in Yountville who have obtained a bachelor's degree or higher.
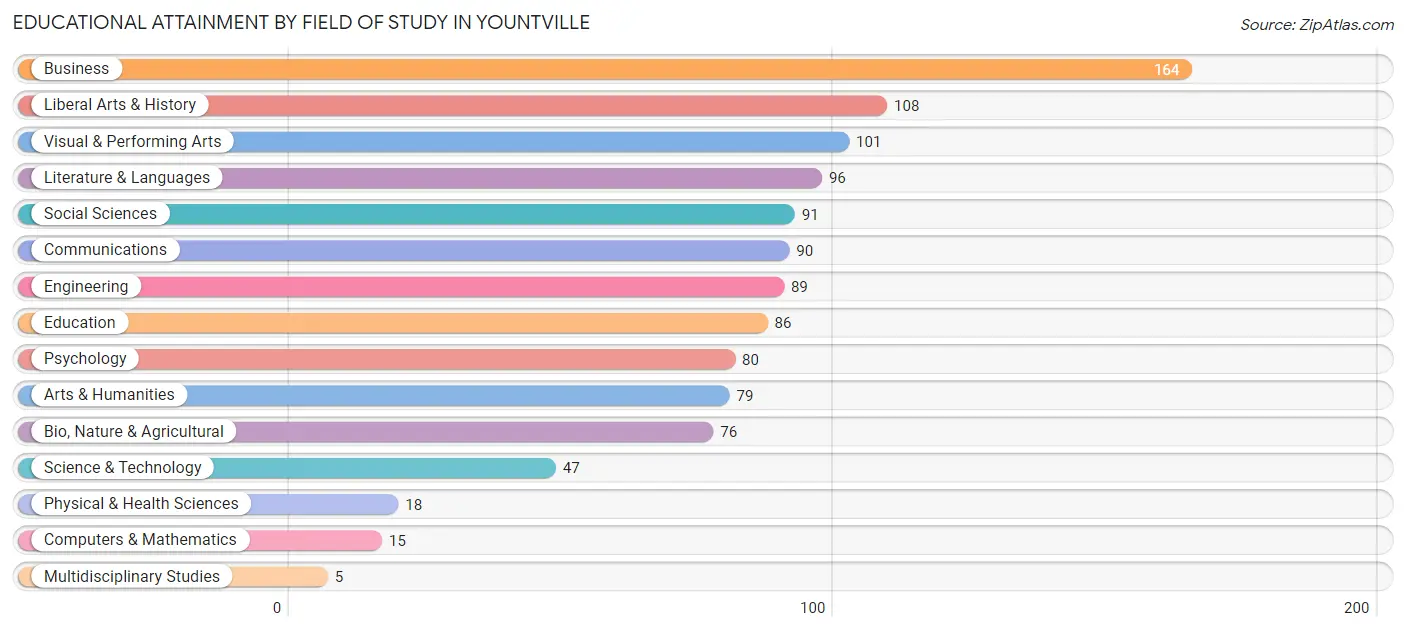
| Field of Study | # Graduates | % Graduates |
| Computers & Mathematics | 15 | 1.3% |
| Bio, Nature & Agricultural | 76 | 6.6% |
| Physical & Health Sciences | 18 | 1.6% |
| Psychology | 80 | 7.0% |
| Social Sciences | 91 | 8.0% |
| Engineering | 89 | 7.8% |
| Multidisciplinary Studies | 5 | 0.4% |
| Science & Technology | 47 | 4.1% |
| Business | 164 | 14.3% |
| Education | 86 | 7.5% |
| Literature & Languages | 96 | 8.4% |
| Liberal Arts & History | 108 | 9.4% |
| Visual & Performing Arts | 101 | 8.8% |
| Communications | 90 | 7.9% |
| Arts & Humanities | 79 | 6.9% |
| Total | 1,145 | 100.0% |
Transportation & Commute in Yountville
Vehicle Availability by Sex in Yountville
The most prevalent vehicle ownership categories in Yountville are males with 1 vehicle (340, accounting for 48.6%) and females with 1 vehicle (172, making up 65.3%).
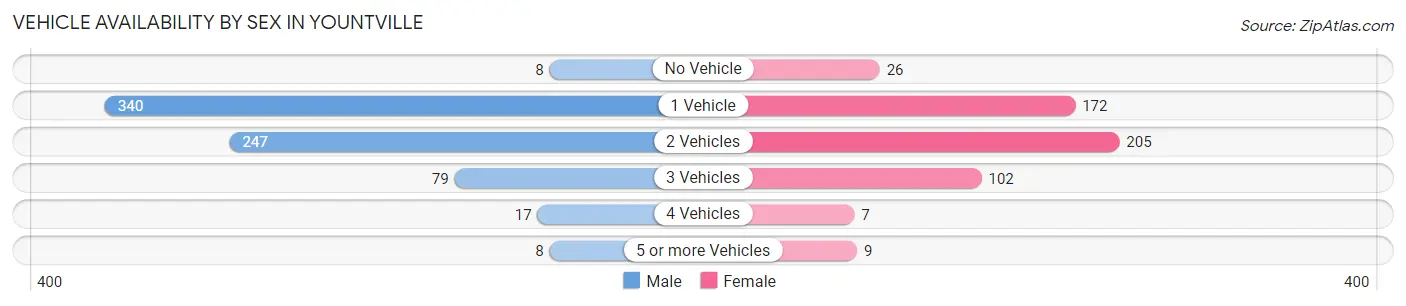
| Vehicles Available | Male | Female |
| No Vehicle | 8 (1.1%) | 26 (5.0%) |
| 1 Vehicle | 340 (48.6%) | 172 (33.0%) |
| 2 Vehicles | 247 (35.3%) | 205 (39.4%) |
| 3 Vehicles | 79 (11.3%) | 102 (19.6%) |
| 4 Vehicles | 17 (2.4%) | 7 (1.3%) |
| 5 or more Vehicles | 8 (1.1%) | 9 (1.7%) |
| Total | 699 (100.0%) | 521 (100.0%) |
Commute Time in Yountville
The most frequently occuring commute durations in Yountville are 5 to 9 minutes (267 commuters, 25.6%), 30 to 34 minutes (176 commuters, 16.9%), and 15 to 19 minutes (141 commuters, 13.5%).
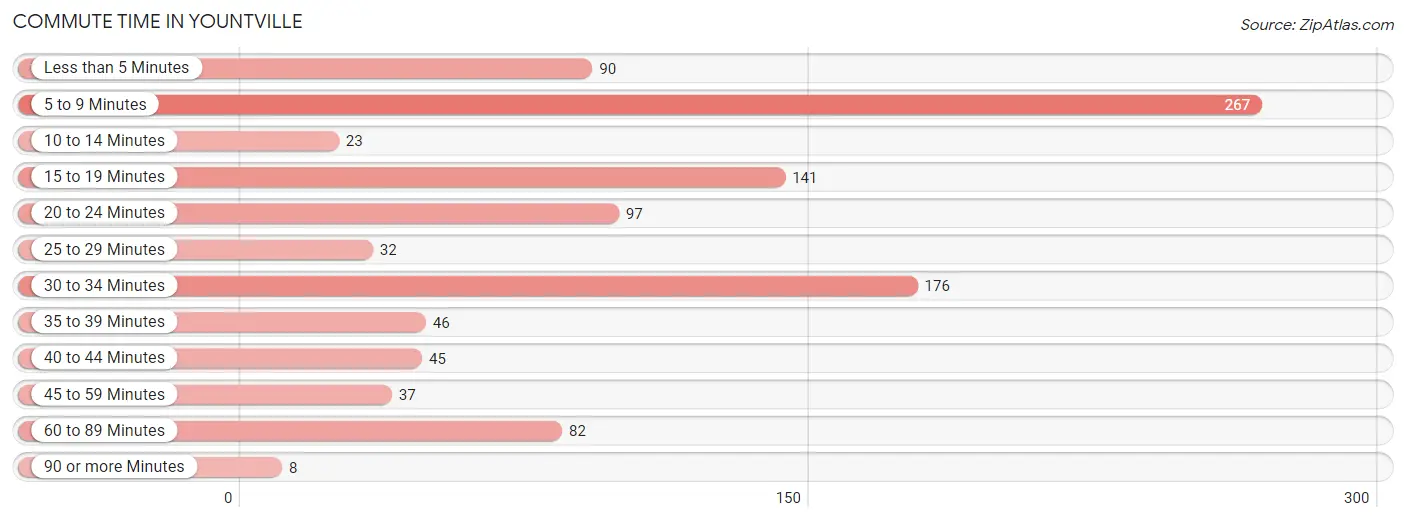
| Commute Time | # Commuters | % Commuters |
| Less than 5 Minutes | 90 | 8.6% |
| 5 to 9 Minutes | 267 | 25.6% |
| 10 to 14 Minutes | 23 | 2.2% |
| 15 to 19 Minutes | 141 | 13.5% |
| 20 to 24 Minutes | 97 | 9.3% |
| 25 to 29 Minutes | 32 | 3.1% |
| 30 to 34 Minutes | 176 | 16.9% |
| 35 to 39 Minutes | 46 | 4.4% |
| 40 to 44 Minutes | 45 | 4.3% |
| 45 to 59 Minutes | 37 | 3.5% |
| 60 to 89 Minutes | 82 | 7.9% |
| 90 or more Minutes | 8 | 0.8% |
Commute Time by Sex in Yountville
The most common commute times in Yountville are 5 to 9 minutes (216 commuters, 32.7%) for males and 15 to 19 minutes (106 commuters, 27.6%) for females.
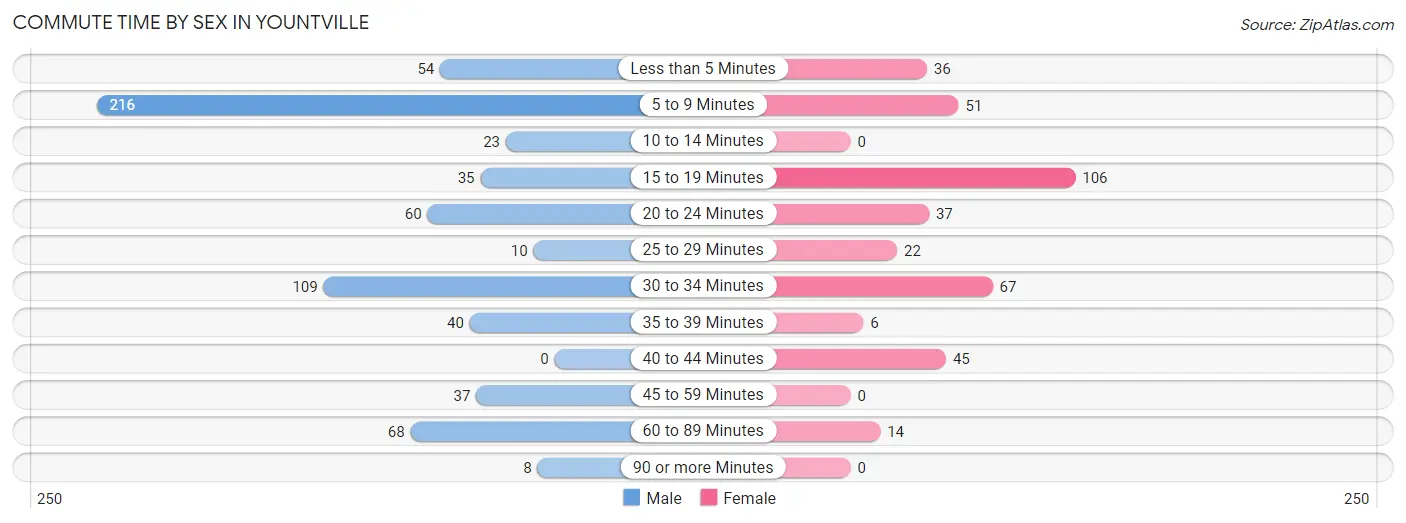
| Commute Time | Male | Female |
| Less than 5 Minutes | 54 (8.2%) | 36 (9.4%) |
| 5 to 9 Minutes | 216 (32.7%) | 51 (13.3%) |
| 10 to 14 Minutes | 23 (3.5%) | 0 (0.0%) |
| 15 to 19 Minutes | 35 (5.3%) | 106 (27.6%) |
| 20 to 24 Minutes | 60 (9.1%) | 37 (9.6%) |
| 25 to 29 Minutes | 10 (1.5%) | 22 (5.7%) |
| 30 to 34 Minutes | 109 (16.5%) | 67 (17.4%) |
| 35 to 39 Minutes | 40 (6.1%) | 6 (1.6%) |
| 40 to 44 Minutes | 0 (0.0%) | 45 (11.7%) |
| 45 to 59 Minutes | 37 (5.6%) | 0 (0.0%) |
| 60 to 89 Minutes | 68 (10.3%) | 14 (3.6%) |
| 90 or more Minutes | 8 (1.2%) | 0 (0.0%) |
Time of Departure to Work by Sex in Yountville
The most frequent times of departure to work in Yountville are 8:00 AM to 8:29 AM (161, 24.4%) for males and 9:00 AM to 9:59 AM (139, 36.2%) for females.
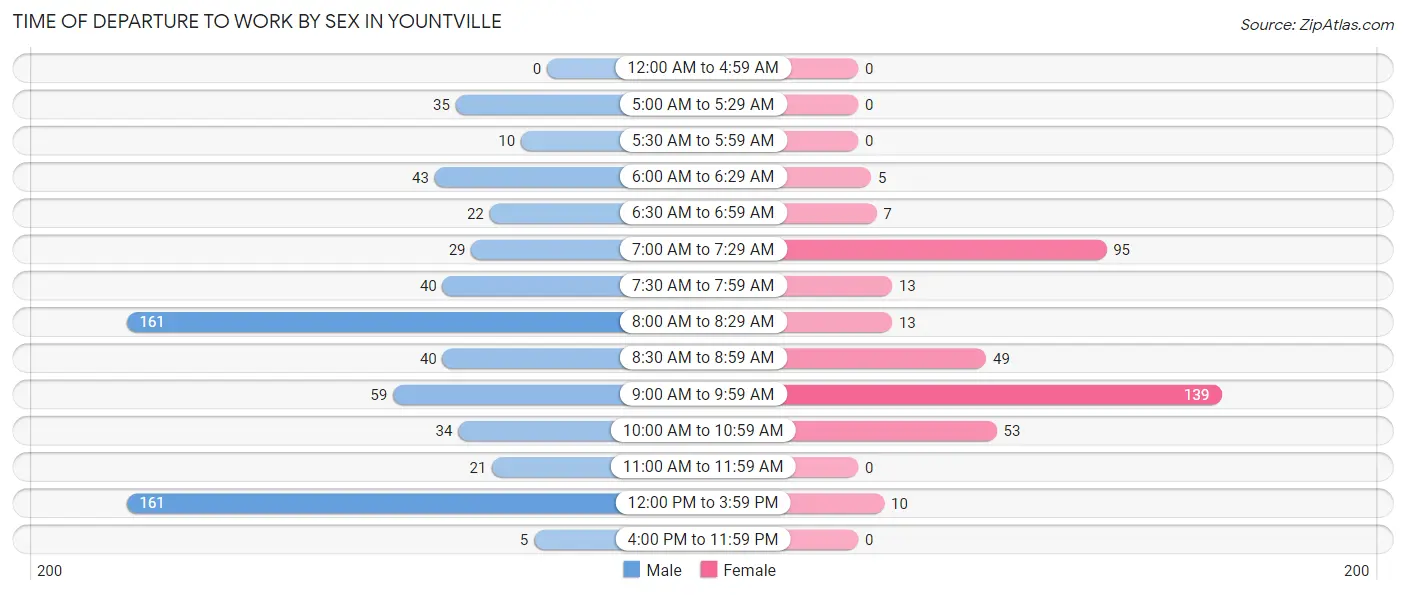
| Time of Departure | Male | Female |
| 12:00 AM to 4:59 AM | 0 (0.0%) | 0 (0.0%) |
| 5:00 AM to 5:29 AM | 35 (5.3%) | 0 (0.0%) |
| 5:30 AM to 5:59 AM | 10 (1.5%) | 0 (0.0%) |
| 6:00 AM to 6:29 AM | 43 (6.5%) | 5 (1.3%) |
| 6:30 AM to 6:59 AM | 22 (3.3%) | 7 (1.8%) |
| 7:00 AM to 7:29 AM | 29 (4.4%) | 95 (24.7%) |
| 7:30 AM to 7:59 AM | 40 (6.1%) | 13 (3.4%) |
| 8:00 AM to 8:29 AM | 161 (24.4%) | 13 (3.4%) |
| 8:30 AM to 8:59 AM | 40 (6.1%) | 49 (12.8%) |
| 9:00 AM to 9:59 AM | 59 (8.9%) | 139 (36.2%) |
| 10:00 AM to 10:59 AM | 34 (5.1%) | 53 (13.8%) |
| 11:00 AM to 11:59 AM | 21 (3.2%) | 0 (0.0%) |
| 12:00 PM to 3:59 PM | 161 (24.4%) | 10 (2.6%) |
| 4:00 PM to 11:59 PM | 5 (0.8%) | 0 (0.0%) |
| Total | 660 (100.0%) | 384 (100.0%) |
Housing Occupancy in Yountville
Occupancy by Ownership in Yountville
Of the total 1,516 dwellings in Yountville, owner-occupied units account for 1,002 (66.1%), while renter-occupied units make up 514 (33.9%).
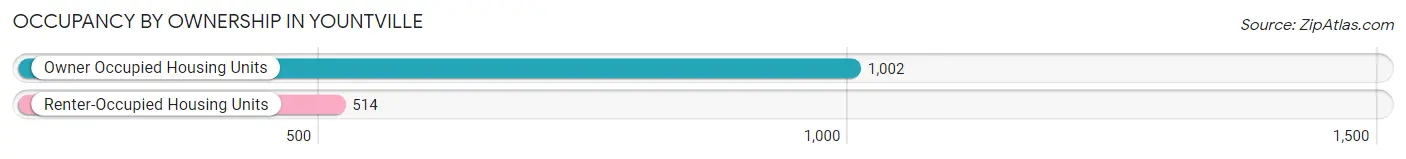
| Occupancy | # Housing Units | % Housing Units |
| Owner Occupied Housing Units | 1,002 | 66.1% |
| Renter-Occupied Housing Units | 514 | 33.9% |
| Total Occupied Housing Units | 1,516 | 100.0% |
Occupancy by Household Size in Yountville
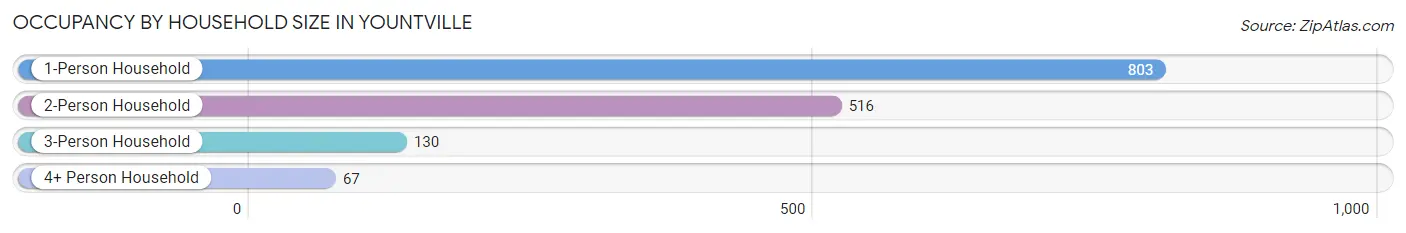
| Household Size | # Housing Units | % Housing Units |
| 1-Person Household | 803 | 53.0% |
| 2-Person Household | 516 | 34.0% |
| 3-Person Household | 130 | 8.6% |
| 4+ Person Household | 67 | 4.4% |
| Total Housing Units | 1,516 | 100.0% |
Occupancy by Ownership by Household Size in Yountville
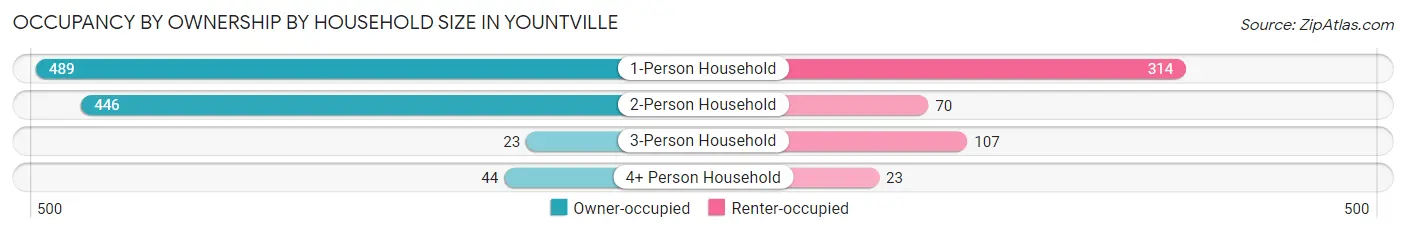
| Household Size | Owner-occupied | Renter-occupied |
| 1-Person Household | 489 (60.9%) | 314 (39.1%) |
| 2-Person Household | 446 (86.4%) | 70 (13.6%) |
| 3-Person Household | 23 (17.7%) | 107 (82.3%) |
| 4+ Person Household | 44 (65.7%) | 23 (34.3%) |
| Total Housing Units | 1,002 (66.1%) | 514 (33.9%) |
Occupancy by Educational Attainment in Yountville
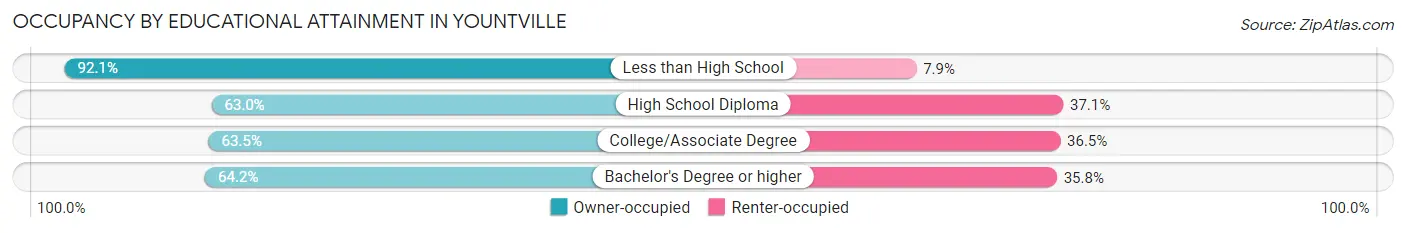
| Household Size | Owner-occupied | Renter-occupied |
| Less than High School | 116 (92.1%) | 10 (7.9%) |
| High School Diploma | 141 (62.9%) | 83 (37.0%) |
| College/Associate Degree | 338 (63.5%) | 194 (36.5%) |
| Bachelor's Degree or higher | 407 (64.2%) | 227 (35.8%) |
Occupancy by Age of Householder in Yountville
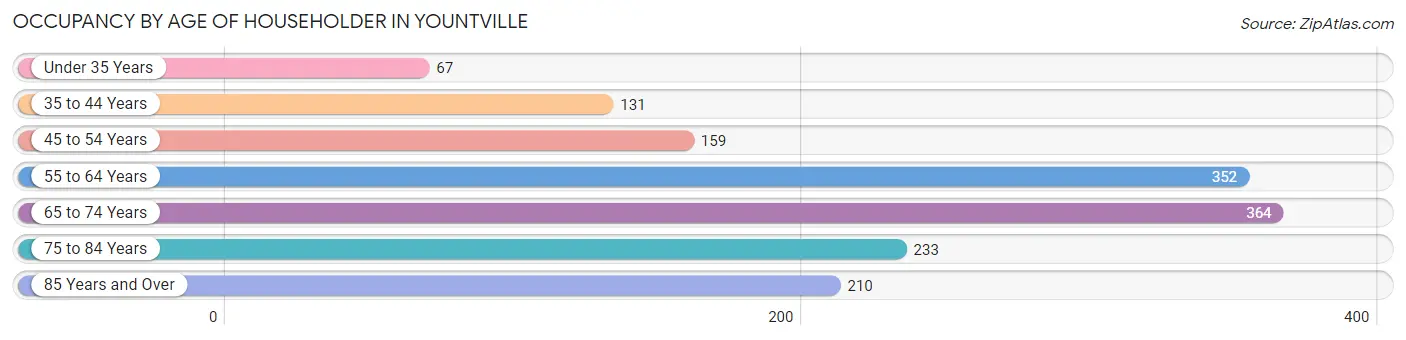
| Age Bracket | # Households | % Households |
| Under 35 Years | 67 | 4.4% |
| 35 to 44 Years | 131 | 8.6% |
| 45 to 54 Years | 159 | 10.5% |
| 55 to 64 Years | 352 | 23.2% |
| 65 to 74 Years | 364 | 24.0% |
| 75 to 84 Years | 233 | 15.4% |
| 85 Years and Over | 210 | 13.9% |
| Total | 1,516 | 100.0% |
Housing Finances in Yountville
Median Income by Occupancy in Yountville
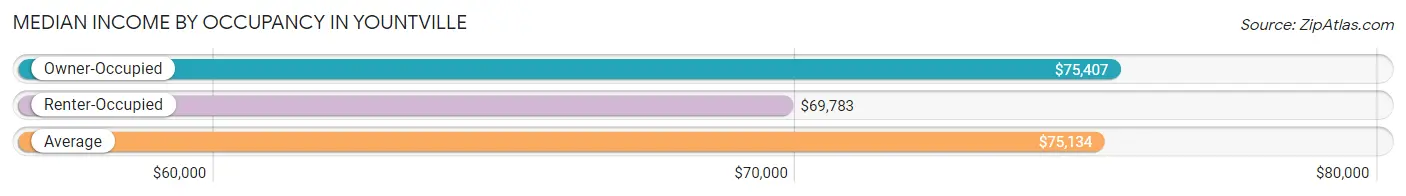
| Occupancy Type | # Households | Median Income |
| Owner-Occupied | 1,002 (66.1%) | $75,407 |
| Renter-Occupied | 514 (33.9%) | $69,783 |
| Average | 1,516 (100.0%) | $75,134 |
Occupancy by Householder Income Bracket in Yountville
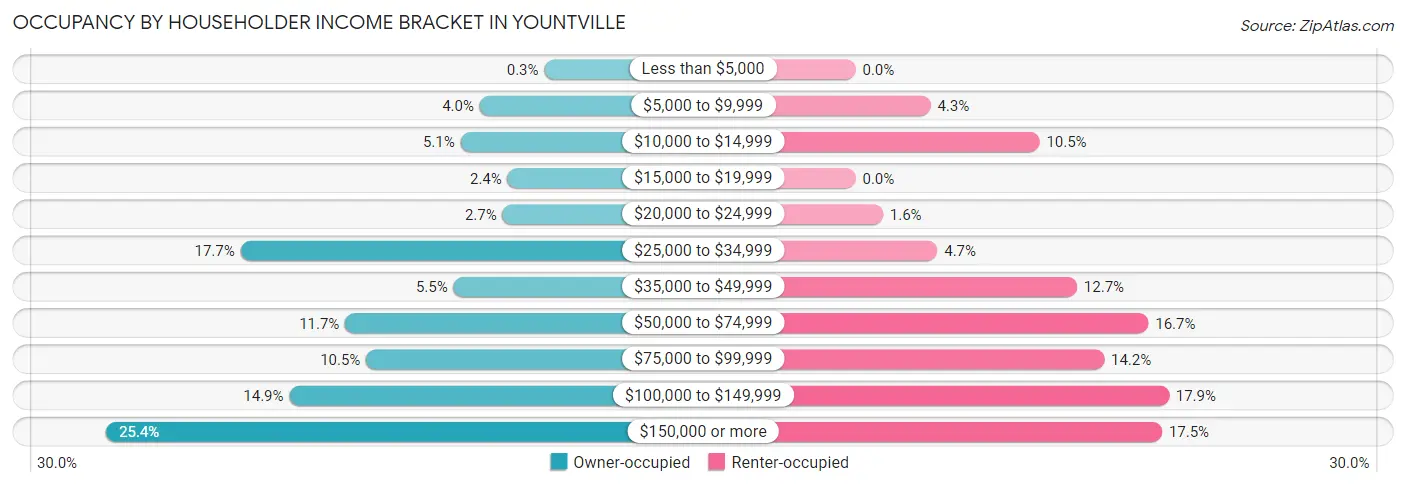
| Income Bracket | Owner-occupied | Renter-occupied |
| Less than $5,000 | 3 (0.3%) | 0 (0.0%) |
| $5,000 to $9,999 | 40 (4.0%) | 22 (4.3%) |
| $10,000 to $14,999 | 51 (5.1%) | 54 (10.5%) |
| $15,000 to $19,999 | 24 (2.4%) | 0 (0.0%) |
| $20,000 to $24,999 | 27 (2.7%) | 8 (1.6%) |
| $25,000 to $34,999 | 177 (17.7%) | 24 (4.7%) |
| $35,000 to $49,999 | 55 (5.5%) | 65 (12.7%) |
| $50,000 to $74,999 | 117 (11.7%) | 86 (16.7%) |
| $75,000 to $99,999 | 105 (10.5%) | 73 (14.2%) |
| $100,000 to $149,999 | 149 (14.9%) | 92 (17.9%) |
| $150,000 or more | 254 (25.4%) | 90 (17.5%) |
| Total | 1,002 (100.0%) | 514 (100.0%) |
Monthly Housing Cost Tiers in Yountville
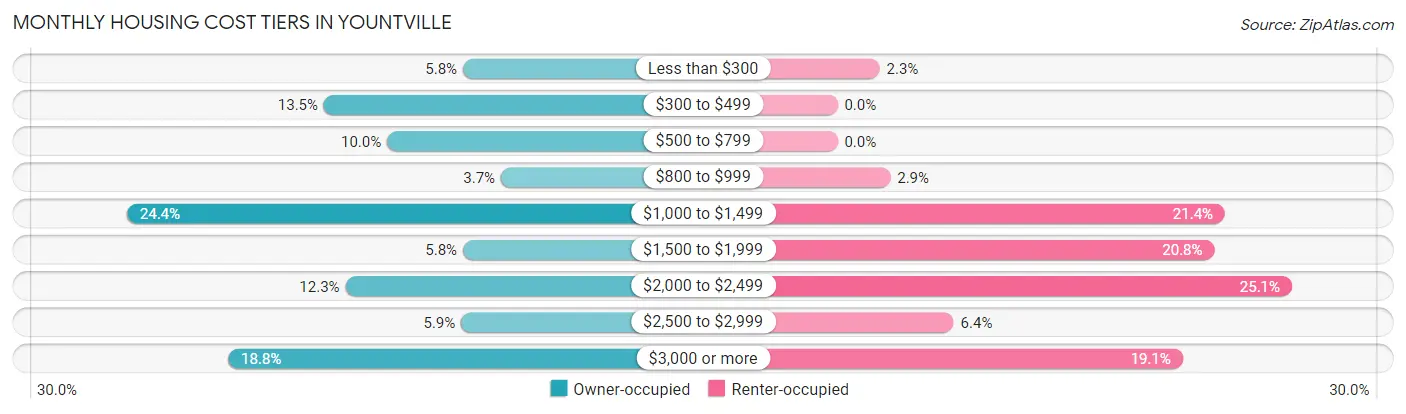
| Monthly Cost | Owner-occupied | Renter-occupied |
| Less than $300 | 58 (5.8%) | 12 (2.3%) |
| $300 to $499 | 135 (13.5%) | 0 (0.0%) |
| $500 to $799 | 100 (10.0%) | 0 (0.0%) |
| $800 to $999 | 37 (3.7%) | 15 (2.9%) |
| $1,000 to $1,499 | 244 (24.3%) | 110 (21.4%) |
| $1,500 to $1,999 | 58 (5.8%) | 107 (20.8%) |
| $2,000 to $2,499 | 123 (12.3%) | 129 (25.1%) |
| $2,500 to $2,999 | 59 (5.9%) | 33 (6.4%) |
| $3,000 or more | 188 (18.8%) | 98 (19.1%) |
| Total | 1,002 (100.0%) | 514 (100.0%) |
Physical Housing Characteristics in Yountville
Housing Structures in Yountville
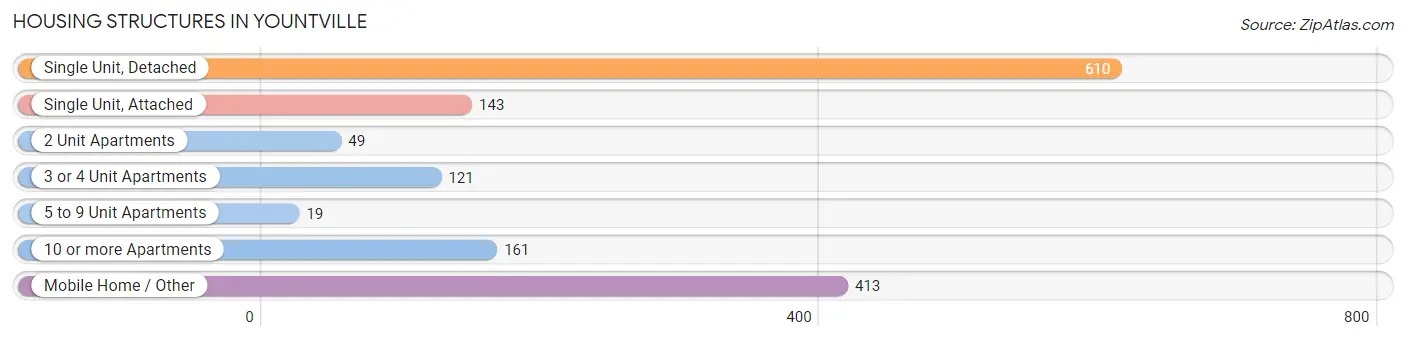
| Structure Type | # Housing Units | % Housing Units |
| Single Unit, Detached | 610 | 40.2% |
| Single Unit, Attached | 143 | 9.4% |
| 2 Unit Apartments | 49 | 3.2% |
| 3 or 4 Unit Apartments | 121 | 8.0% |
| 5 to 9 Unit Apartments | 19 | 1.3% |
| 10 or more Apartments | 161 | 10.6% |
| Mobile Home / Other | 413 | 27.2% |
| Total | 1,516 | 100.0% |
Housing Structures by Occupancy in Yountville
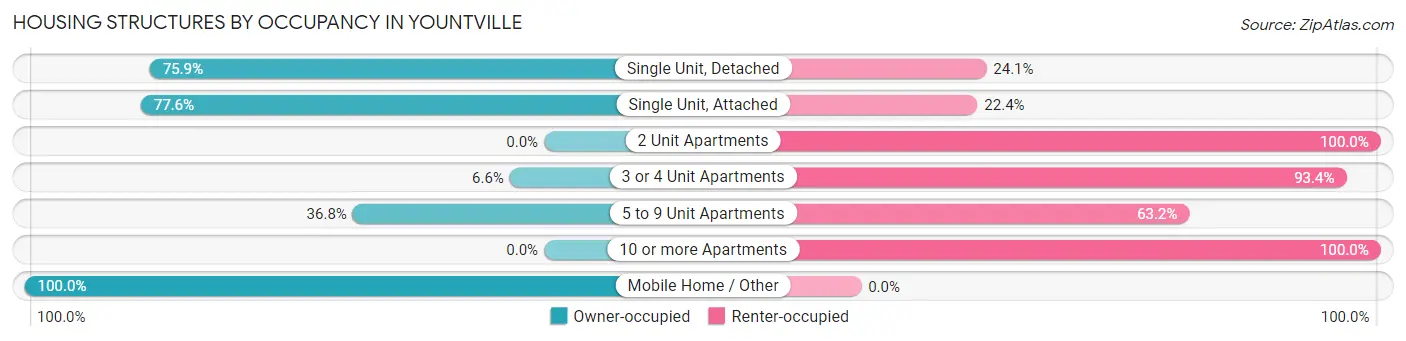
| Structure Type | Owner-occupied | Renter-occupied |
| Single Unit, Detached | 463 (75.9%) | 147 (24.1%) |
| Single Unit, Attached | 111 (77.6%) | 32 (22.4%) |
| 2 Unit Apartments | 0 (0.0%) | 49 (100.0%) |
| 3 or 4 Unit Apartments | 8 (6.6%) | 113 (93.4%) |
| 5 to 9 Unit Apartments | 7 (36.8%) | 12 (63.2%) |
| 10 or more Apartments | 0 (0.0%) | 161 (100.0%) |
| Mobile Home / Other | 413 (100.0%) | 0 (0.0%) |
| Total | 1,002 (66.1%) | 514 (33.9%) |
Housing Structures by Number of Rooms in Yountville
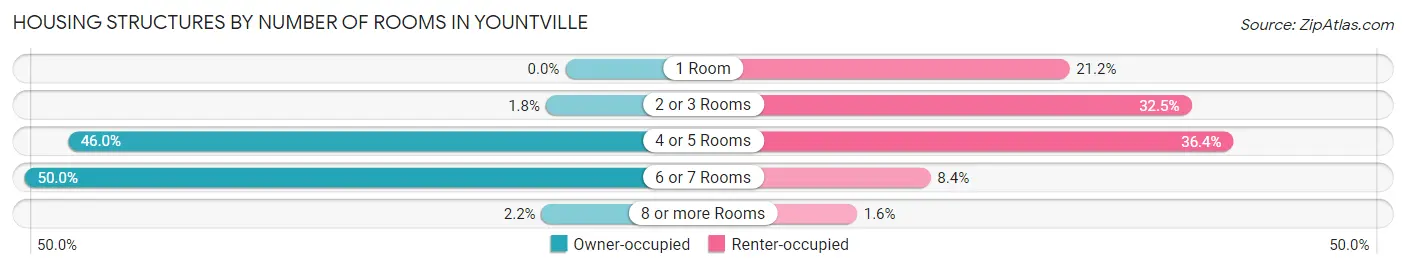
| Number of Rooms | Owner-occupied | Renter-occupied |
| 1 Room | 0 (0.0%) | 109 (21.2%) |
| 2 or 3 Rooms | 18 (1.8%) | 167 (32.5%) |
| 4 or 5 Rooms | 461 (46.0%) | 187 (36.4%) |
| 6 or 7 Rooms | 501 (50.0%) | 43 (8.4%) |
| 8 or more Rooms | 22 (2.2%) | 8 (1.6%) |
| Total | 1,002 (100.0%) | 514 (100.0%) |
Housing Structure by Heating Type in Yountville
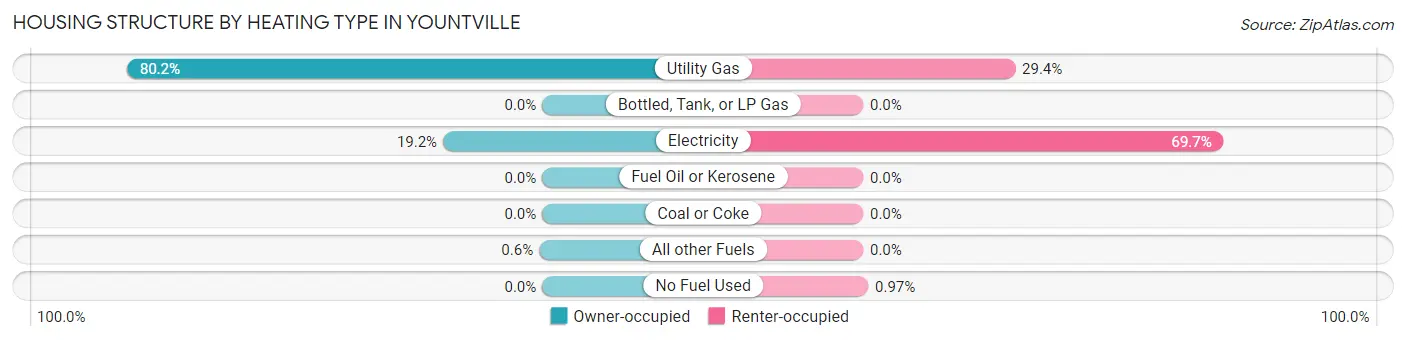
| Heating Type | Owner-occupied | Renter-occupied |
| Utility Gas | 804 (80.2%) | 151 (29.4%) |
| Bottled, Tank, or LP Gas | 0 (0.0%) | 0 (0.0%) |
| Electricity | 192 (19.2%) | 358 (69.7%) |
| Fuel Oil or Kerosene | 0 (0.0%) | 0 (0.0%) |
| Coal or Coke | 0 (0.0%) | 0 (0.0%) |
| All other Fuels | 6 (0.6%) | 0 (0.0%) |
| No Fuel Used | 0 (0.0%) | 5 (1.0%) |
| Total | 1,002 (100.0%) | 514 (100.0%) |
Household Vehicle Usage in Yountville
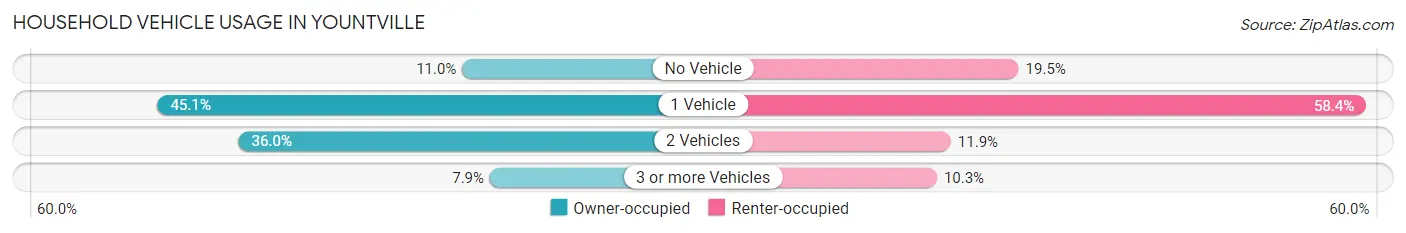
| Vehicles per Household | Owner-occupied | Renter-occupied |
| No Vehicle | 110 (11.0%) | 100 (19.5%) |
| 1 Vehicle | 452 (45.1%) | 300 (58.4%) |
| 2 Vehicles | 361 (36.0%) | 61 (11.9%) |
| 3 or more Vehicles | 79 (7.9%) | 53 (10.3%) |
| Total | 1,002 (100.0%) | 514 (100.0%) |
Real Estate & Mortgages in Yountville
Real Estate and Mortgage Overview in Yountville
| Characteristic | Without Mortgage | With Mortgage |
| Housing Units | 598 | 404 |
| Median Property Value | $335,600 | $921,600 |
| Median Household Income | $53,500 | $172 |
| Monthly Housing Costs | $924 | $176 |
| Real Estate Taxes | $1,190 | $12 |
Property Value by Mortgage Status in Yountville
| Property Value | Without Mortgage | With Mortgage |
| Less than $50,000 | 27 (4.5%) | 5 (1.2%) |
| $50,000 to $99,999 | 8 (1.3%) | 0 (0.0%) |
| $100,000 to $299,999 | 233 (39.0%) | 41 (10.2%) |
| $300,000 to $499,999 | 123 (20.6%) | 8 (2.0%) |
| $500,000 to $749,999 | 53 (8.9%) | 43 (10.6%) |
| $750,000 to $999,999 | 42 (7.0%) | 153 (37.9%) |
| $1,000,000 or more | 112 (18.7%) | 154 (38.1%) |
| Total | 598 (100.0%) | 404 (100.0%) |
Household Income by Mortgage Status in Yountville
| Household Income | Without Mortgage | With Mortgage |
| Less than $10,000 | 37 (6.2%) | 0 (0.0%) |
| $10,000 to $24,999 | 58 (9.7%) | 6 (1.5%) |
| $25,000 to $34,999 | 139 (23.2%) | 44 (10.9%) |
| $35,000 to $49,999 | 41 (6.9%) | 38 (9.4%) |
| $50,000 to $74,999 | 103 (17.2%) | 14 (3.5%) |
| $75,000 to $99,999 | 57 (9.5%) | 14 (3.5%) |
| $100,000 to $149,999 | 81 (13.6%) | 48 (11.9%) |
| $150,000 or more | 82 (13.7%) | 68 (16.8%) |
| Total | 598 (100.0%) | 404 (100.0%) |
Property Value to Household Income Ratio in Yountville
| Value-to-Income Ratio | Without Mortgage | With Mortgage |
| Less than 2.0x | 106 (17.7%) | 116,250 (28,774.8%) |
| 2.0x to 2.9x | 65 (10.9%) | 39 (9.7%) |
| 3.0x to 3.9x | 23 (3.8%) | 30 (7.4%) |
| 4.0x or more | 404 (67.6%) | 30 (7.4%) |
| Total | 598 (100.0%) | 404 (100.0%) |
Real Estate Taxes by Mortgage Status in Yountville
| Property Taxes | Without Mortgage | With Mortgage |
| Less than $800 | 157 (26.3%) | 0 (0.0%) |
| $800 to $1,499 | 178 (29.8%) | 5 (1.2%) |
| $800 to $1,499 | 185 (30.9%) | 48 (11.9%) |
| Total | 598 (100.0%) | 404 (100.0%) |
Health & Disability in Yountville
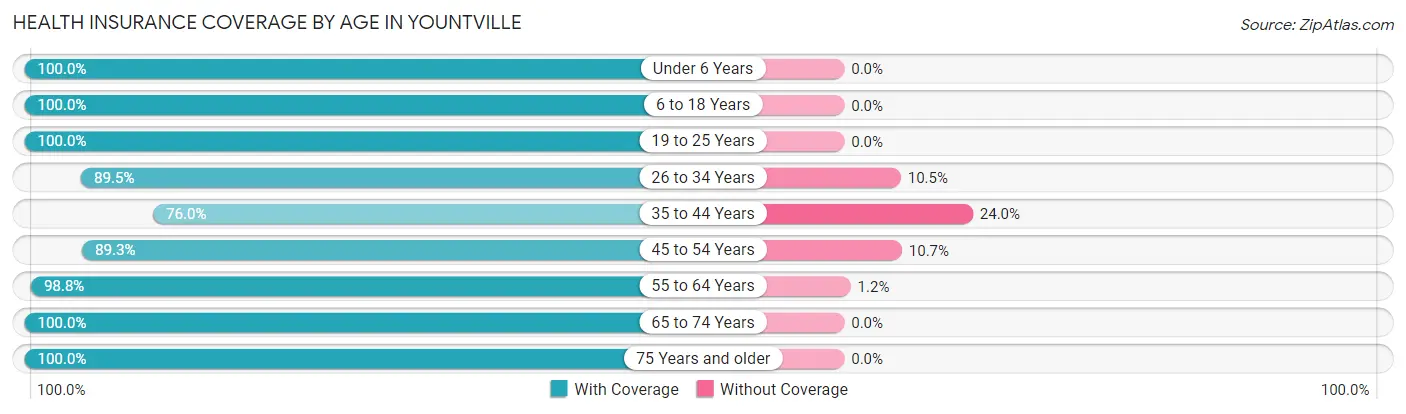
Health Insurance Coverage by Age in Yountville
| Age Bracket | With Coverage | Without Coverage |
| Under 6 Years | 43 (100.0%) | 0 (0.0%) |
| 6 to 18 Years | 154 (100.0%) | 0 (0.0%) |
| 19 to 25 Years | 51 (100.0%) | 0 (0.0%) |
| 26 to 34 Years | 280 (89.5%) | 33 (10.5%) |
| 35 to 44 Years | 184 (76.0%) | 58 (24.0%) |
| 45 to 54 Years | 241 (89.3%) | 29 (10.7%) |
| 55 to 64 Years | 580 (98.8%) | 7 (1.2%) |
| 65 to 74 Years | 608 (100.0%) | 0 (0.0%) |
| 75 Years and older | 617 (100.0%) | 0 (0.0%) |
| Total | 2,758 (95.6%) | 127 (4.4%) |
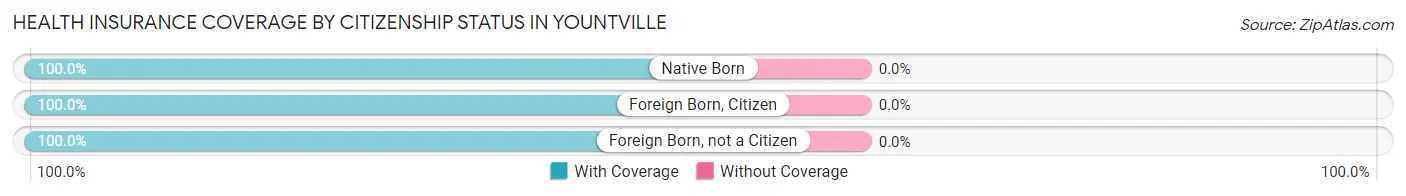
Health Insurance Coverage by Citizenship Status in Yountville
| Citizenship Status | With Coverage | Without Coverage |
| Native Born | 43 (100.0%) | 0 (0.0%) |
| Foreign Born, Citizen | 154 (100.0%) | 0 (0.0%) |
| Foreign Born, not a Citizen | 51 (100.0%) | 0 (0.0%) |
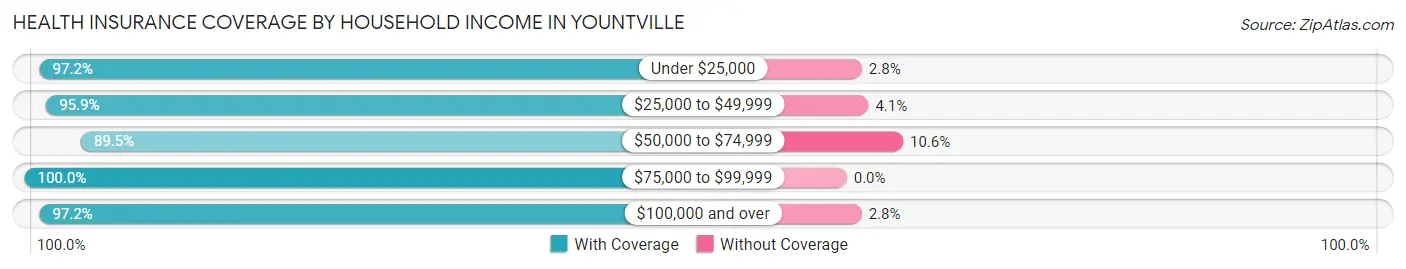
Health Insurance Coverage by Household Income in Yountville
| Household Income | With Coverage | Without Coverage |
| Under $25,000 | 275 (97.2%) | 8 (2.8%) |
| $25,000 to $49,999 | 402 (95.9%) | 17 (4.1%) |
| $50,000 to $74,999 | 339 (89.4%) | 40 (10.5%) |
| $75,000 to $99,999 | 533 (100.0%) | 0 (0.0%) |
| $100,000 and over | 1,009 (97.2%) | 29 (2.8%) |
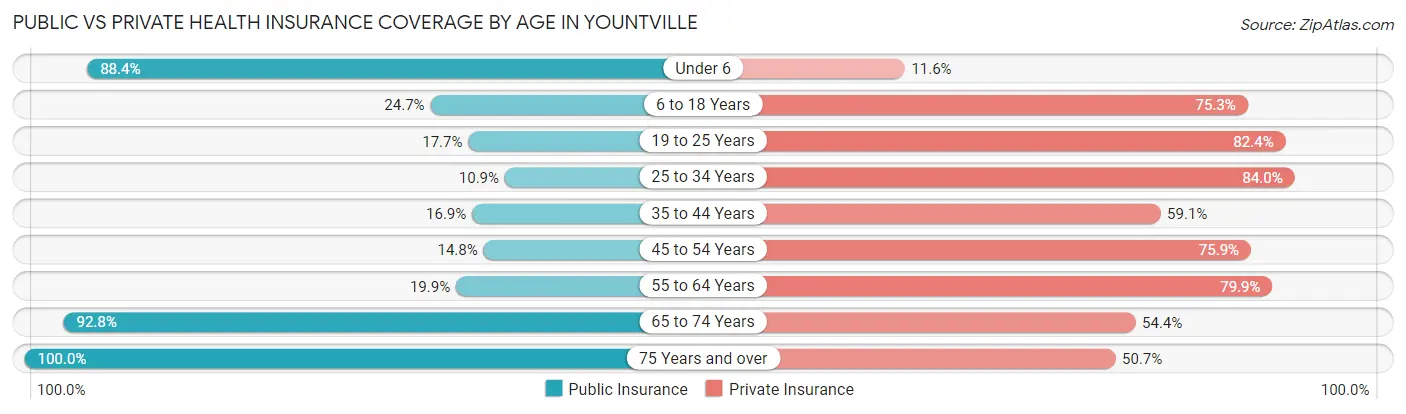
Public vs Private Health Insurance Coverage by Age in Yountville
| Age Bracket | Public Insurance | Private Insurance |
| Under 6 | 38 (88.4%) | 5 (11.6%) |
| 6 to 18 Years | 38 (24.7%) | 116 (75.3%) |
| 19 to 25 Years | 9 (17.6%) | 42 (82.4%) |
| 25 to 34 Years | 34 (10.9%) | 263 (84.0%) |
| 35 to 44 Years | 41 (16.9%) | 143 (59.1%) |
| 45 to 54 Years | 40 (14.8%) | 205 (75.9%) |
| 55 to 64 Years | 117 (19.9%) | 469 (79.9%) |
| 65 to 74 Years | 564 (92.8%) | 331 (54.4%) |
| 75 Years and over | 617 (100.0%) | 313 (50.7%) |
| Total | 1,498 (51.9%) | 1,887 (65.4%) |
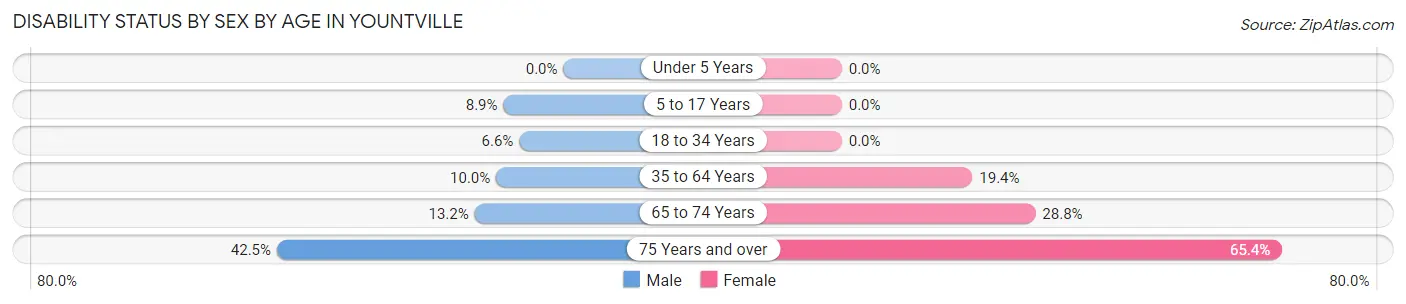
Disability Status by Sex by Age in Yountville
| Age Bracket | Male | Female |
| Under 5 Years | 0 (0.0%) | 0 (0.0%) |
| 5 to 17 Years | 9 (8.9%) | 0 (0.0%) |
| 18 to 34 Years | 17 (6.6%) | 0 (0.0%) |
| 35 to 64 Years | 51 (10.0%) | 114 (19.4%) |
| 65 to 74 Years | 38 (13.2%) | 92 (28.7%) |
| 75 Years and over | 77 (42.5%) | 285 (65.4%) |
Disability Class by Sex by Age in Yountville
Disability Class: Hearing Difficulty
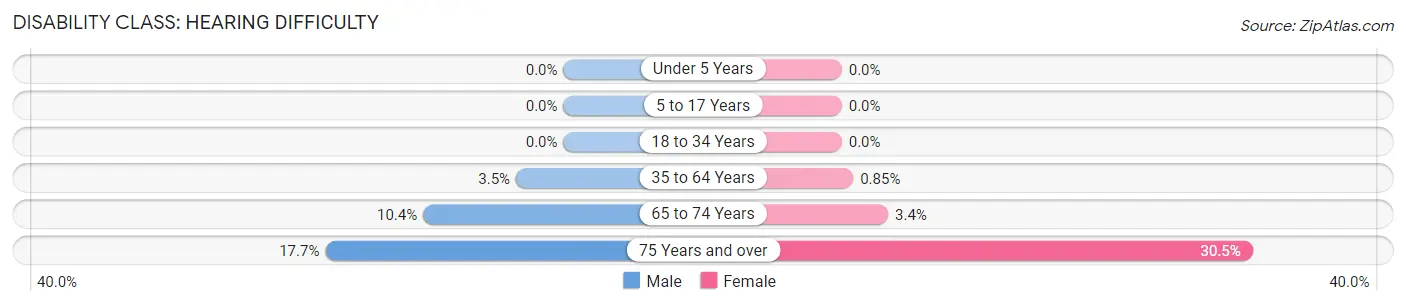
| Age Bracket | Male | Female |
| Under 5 Years | 0 (0.0%) | 0 (0.0%) |
| 5 to 17 Years | 0 (0.0%) | 0 (0.0%) |
| 18 to 34 Years | 0 (0.0%) | 0 (0.0%) |
| 35 to 64 Years | 18 (3.5%) | 5 (0.9%) |
| 65 to 74 Years | 30 (10.4%) | 11 (3.4%) |
| 75 Years and over | 32 (17.7%) | 133 (30.5%) |
Disability Class: Vision Difficulty
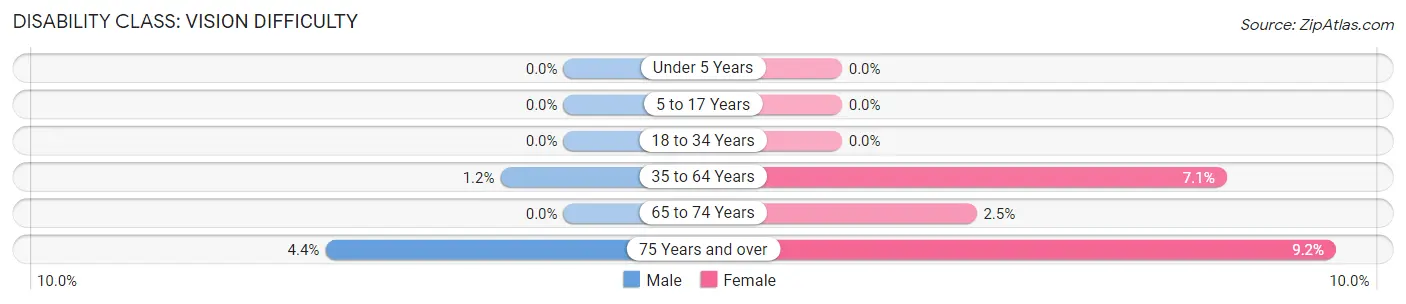
| Age Bracket | Male | Female |
| Under 5 Years | 0 (0.0%) | 0 (0.0%) |
| 5 to 17 Years | 0 (0.0%) | 0 (0.0%) |
| 18 to 34 Years | 0 (0.0%) | 0 (0.0%) |
| 35 to 64 Years | 6 (1.2%) | 42 (7.1%) |
| 65 to 74 Years | 0 (0.0%) | 8 (2.5%) |
| 75 Years and over | 8 (4.4%) | 40 (9.2%) |
Disability Class: Cognitive Difficulty
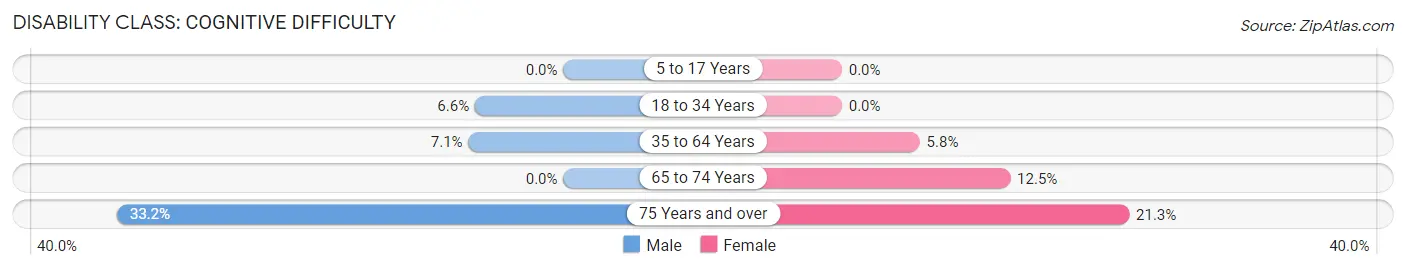
| Age Bracket | Male | Female |
| 5 to 17 Years | 0 (0.0%) | 0 (0.0%) |
| 18 to 34 Years | 17 (6.6%) | 0 (0.0%) |
| 35 to 64 Years | 36 (7.0%) | 34 (5.8%) |
| 65 to 74 Years | 0 (0.0%) | 40 (12.5%) |
| 75 Years and over | 60 (33.2%) | 93 (21.3%) |
Disability Class: Ambulatory Difficulty
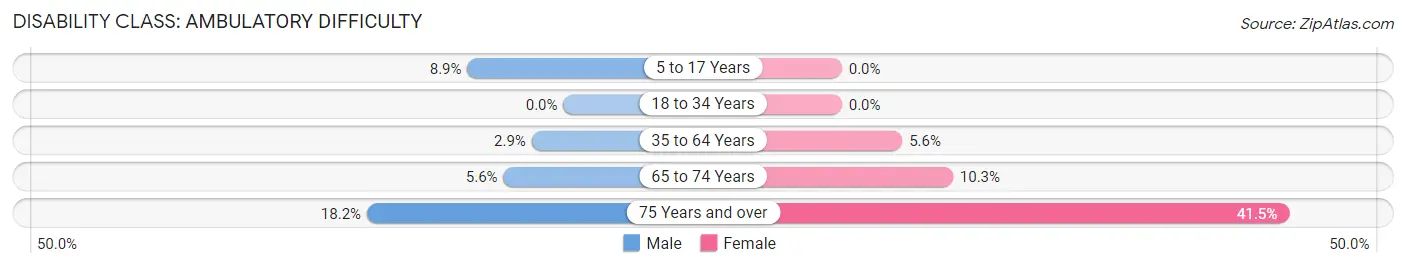
| Age Bracket | Male | Female |
| 5 to 17 Years | 9 (8.9%) | 0 (0.0%) |
| 18 to 34 Years | 0 (0.0%) | 0 (0.0%) |
| 35 to 64 Years | 15 (2.9%) | 33 (5.6%) |
| 65 to 74 Years | 16 (5.6%) | 33 (10.3%) |
| 75 Years and over | 33 (18.2%) | 181 (41.5%) |
Disability Class: Self-Care Difficulty
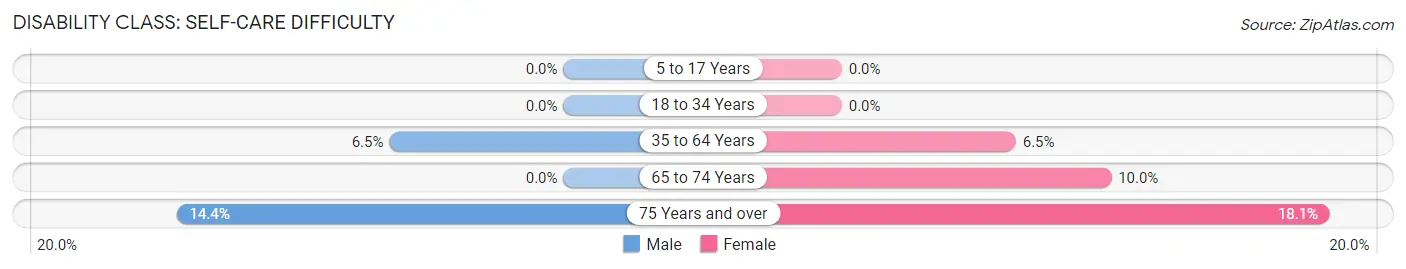
| Age Bracket | Male | Female |
| 5 to 17 Years | 0 (0.0%) | 0 (0.0%) |
| 18 to 34 Years | 0 (0.0%) | 0 (0.0%) |
| 35 to 64 Years | 33 (6.5%) | 38 (6.5%) |
| 65 to 74 Years | 0 (0.0%) | 32 (10.0%) |
| 75 Years and over | 26 (14.4%) | 79 (18.1%) |
Technology Access in Yountville
Computing Device Access in Yountville
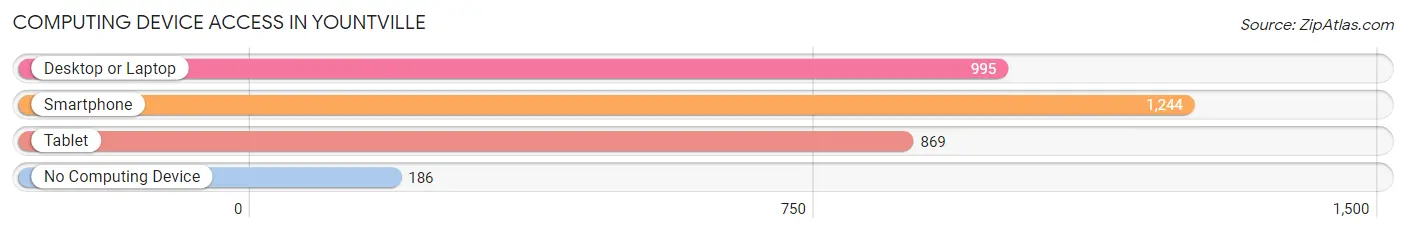
| Device Type | # Households | % Households |
| Desktop or Laptop | 995 | 65.6% |
| Smartphone | 1,244 | 82.1% |
| Tablet | 869 | 57.3% |
| No Computing Device | 186 | 12.3% |
| Total | 1,516 | 100.0% |
Internet Access in Yountville
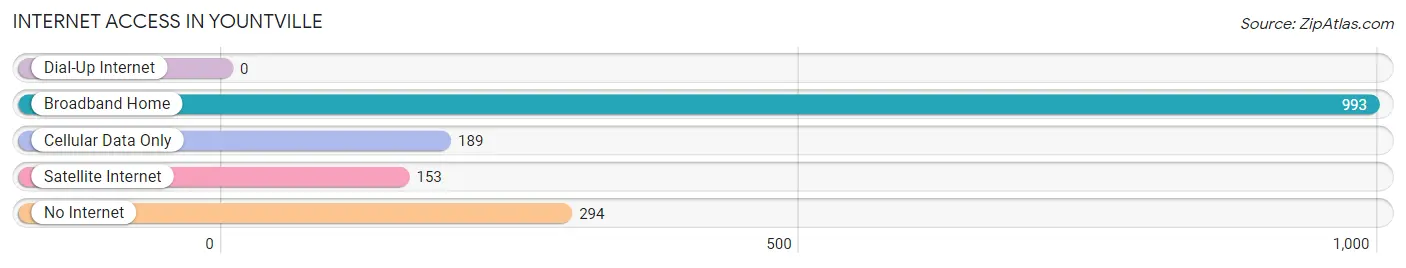
| Internet Type | # Households | % Households |
| Dial-Up Internet | 0 | 0.0% |
| Broadband Home | 993 | 65.5% |
| Cellular Data Only | 189 | 12.5% |
| Satellite Internet | 153 | 10.1% |
| No Internet | 294 | 19.4% |
| Total | 1,516 | 100.0% |
Yountville Summary
Yountville is a small town located in the heart of the Napa Valley in California. It is situated in the northern part of the valley, just south of the city of Napa. The town is known for its wineries, restaurants, and resorts, and is a popular tourist destination.
History
Yountville was founded in 1836 by George Calvert Yount, a pioneer who was granted the land by the Mexican government. Yount was the first to plant grapes in the area, and the town was named after him. The town grew slowly over the years, and by the late 19th century, it had become a popular destination for tourists.
In the early 20th century, Yountville began to attract more visitors, and the town began to develop. The first hotel was built in 1912, and the first winery was established in 1914. The town was incorporated in 1917, and the population grew steadily over the next few decades.
Geography
Yountville is located in the northern part of the Napa Valley, just south of the city of Napa. The town is situated on the eastern side of the valley, and is surrounded by vineyards and rolling hills. The town is located at an elevation of about 200 feet, and has a Mediterranean climate with hot, dry summers and mild, wet winters.
Economy
Yountville is known for its wineries, restaurants, and resorts, and is a popular tourist destination. The town is home to several wineries, including Robert Mondavi Winery, Beringer Vineyards, and Domaine Chandon. The town also has several restaurants, including the French Laundry, Bouchon, and Bottega.
Yountville is also home to several resorts, including the Villagio Inn & Spa, the Bardessono Hotel & Spa, and the Napa Valley Lodge. The town is also home to several art galleries, including the Yountville Art Gallery and the Yountville Arts Center.
Demographics
As of the 2010 census, Yountville had a population of 2,933. The racial makeup of the town was 87.3% White, 0.7% African American, 0.3% Native American, 5.2% Asian, 0.1% Pacific Islander, 3.2% from other races, and 3.3% from two or more races. Hispanic or Latino of any race were 8.2% of the population.
The median income for a household in Yountville was $76,944, and the median income for a family was $90,917. The per capita income for the town was $45,945. About 4.2% of families and 5.7% of the population were below the poverty line, including 6.3% of those under age 18 and 4.2% of those age 65 or over.
Common Questions
What is Per Capita Income in Yountville?
Per Capita income in Yountville is $61,414.
What is the Median Family Income in Yountville?
Median Family Income in Yountville is $103,036.
What is the Median Household income in Yountville?
Median Household Income in Yountville is $75,134.
What is Income or Wage Gap in Yountville?
Income or Wage Gap in Yountville is 1.9%.
Women in Yountville earn 98.1 cents for every dollar earned by a man.
What is Inequality or Gini Index in Yountville?
Inequality or Gini Index in Yountville is 0.54.
What is the Total Population of Yountville?
Total Population of Yountville is 3,397.
What is the Total Male Population of Yountville?
Total Male Population of Yountville is 1,575.
What is the Total Female Population of Yountville?
Total Female Population of Yountville is 1,822.
What is the Ratio of Males per 100 Females in Yountville?
There are 86.44 Males per 100 Females in Yountville.
What is the Ratio of Females per 100 Males in Yountville?
There are 115.68 Females per 100 Males in Yountville.
What is the Median Population Age in Yountville?
Median Population Age in Yountville is 64.5 Years.
What is the Average Family Size in Yountville
Average Family Size in Yountville is 2.7 People.
What is the Average Household Size in Yountville
Average Household Size in Yountville is 1.8 People.
How Large is the Labor Force in Yountville?
There are 1,436 People in the Labor Forcein in Yountville.
What is the Percentage of People in the Labor Force in Yountville?
44.2% of People are in the Labor Force in Yountville.
What is the Unemployment Rate in Yountville?
Unemployment Rate in Yountville is 7.2%.