Cities with the Highest Unemployment Rate Amomg Youth Under the Age of 25 in Georgia
RELATED REPORTS & OPTIONS
Highest Unemployment | Youth < 25
Georgia
Compare Cities
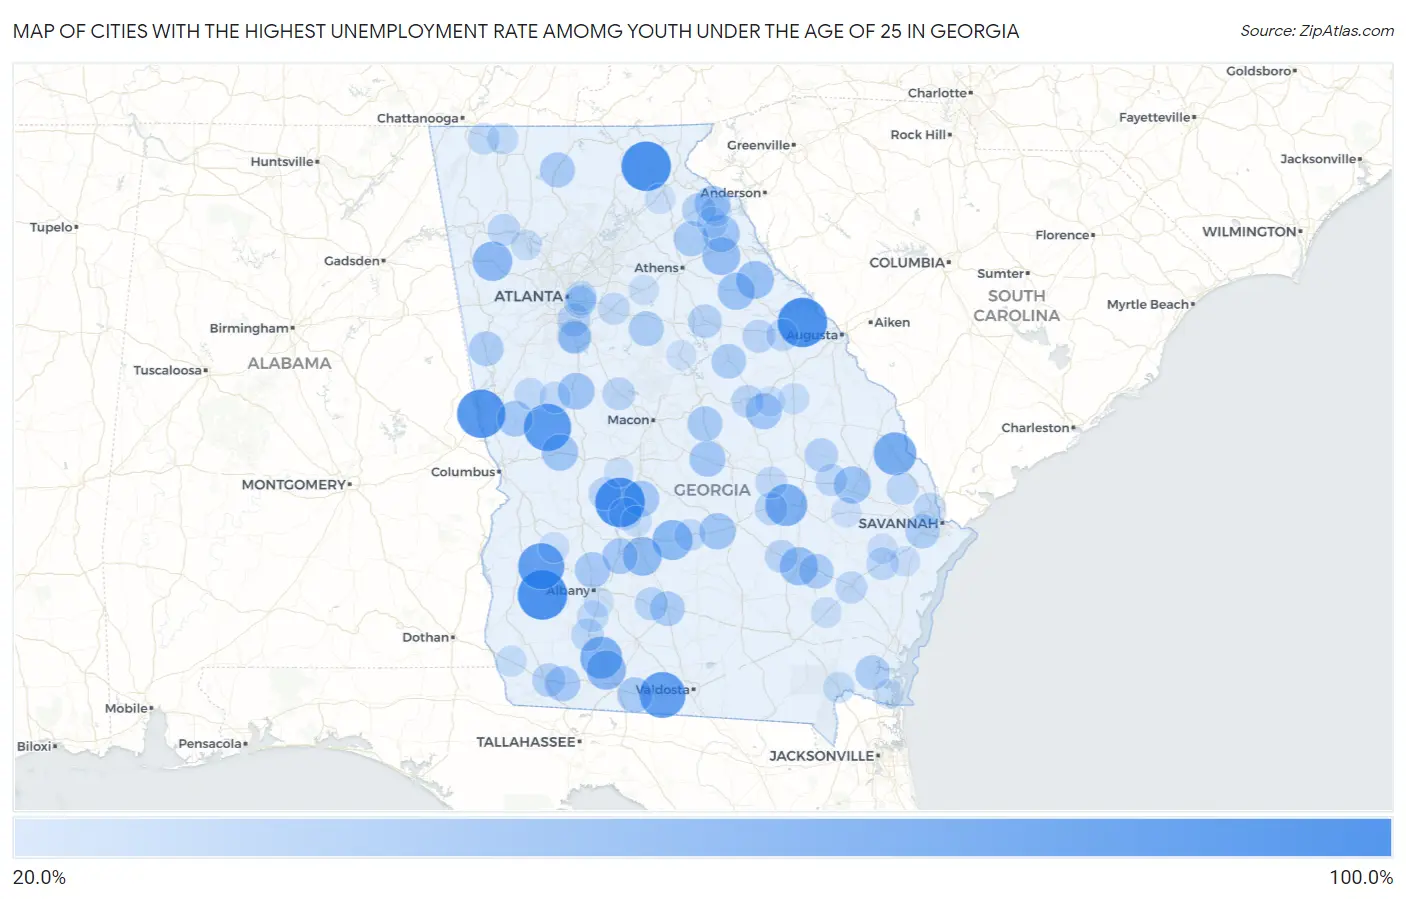
Map of Cities with the Highest Unemployment Rate Amomg Youth Under the Age of 25 in Georgia
0.0%
100.0%
Cities with the Highest Unemployment Rate Amomg Youth Under the Age of 25 in Georgia
| City | Youth Unemployment | vs State | vs National | |
| 1. | Sautee Nacoochee | 100.0% | 11.3%(+88.7)#1 | 10.9%(+89.1)#109 |
| 2. | Dooling | 100.0% | 11.3%(+88.7)#2 | 10.9%(+89.1)#311 |
| 3. | Morgan | 99.9% | 11.3%(+88.6)#3 | 10.9%(+89.0)#325 |
| 4. | Appling | 99.9% | 11.3%(+88.6)#4 | 10.9%(+89.0)#341 |
| 5. | West Point | 95.2% | 11.3%(+83.9)#5 | 10.9%(+84.3)#384 |
| 6. | Woodland | 90.9% | 11.3%(+79.6)#6 | 10.9%(+80.0)#400 |
| 7. | Shellman | 86.3% | 11.3%(+75.0)#7 | 10.9%(+75.4)#422 |
| 8. | Quitman | 85.5% | 11.3%(+74.2)#8 | 10.9%(+74.6)#426 |
| 9. | Georgetown Quitman County Unified Government | 78.8% | 11.3%(+67.5)#9 | 10.9%(+67.9)#474 |
| 10. | Newington | 72.2% | 11.3%(+60.9)#10 | 10.9%(+61.3)#551 |
| 11. | Meigs | 69.3% | 11.3%(+58.0)#11 | 10.9%(+58.4)#595 |
| 12. | Higgston | 69.2% | 11.3%(+57.9)#12 | 10.9%(+58.3)#598 |
| 13. | Rochelle | 61.4% | 11.3%(+50.1)#13 | 10.9%(+50.5)#738 |
| 14. | Rockmart | 59.3% | 11.3%(+48.0)#14 | 10.9%(+48.4)#792 |
| 15. | Ochlocknee | 58.8% | 11.3%(+47.5)#15 | 10.9%(+47.9)#805 |
| 16. | Arabi | 57.1% | 11.3%(+45.8)#16 | 10.9%(+46.2)#849 |
| 17. | Baxley | 53.4% | 11.3%(+42.1)#17 | 10.9%(+42.5)#975 |
| 18. | Carlton | 52.9% | 11.3%(+41.6)#18 | 10.9%(+42.0)#997 |
| 19. | Tignall | 51.8% | 11.3%(+40.5)#19 | 10.9%(+40.9)#1,032 |
| 20. | Register | 50.0% | 11.3%(+38.7)#20 | 10.9%(+39.1)#1,125 |
| 21. | Rayle | 49.9% | 11.3%(+38.6)#21 | 10.9%(+39.0)#1,182 |
| 22. | Bowman | 48.7% | 11.3%(+37.4)#22 | 10.9%(+37.8)#1,217 |
| 23. | Meansville | 47.8% | 11.3%(+36.5)#23 | 10.9%(+36.9)#1,249 |
| 24. | Junction City | 47.3% | 11.3%(+36.0)#24 | 10.9%(+36.4)#1,260 |
| 25. | Milan | 47.1% | 11.3%(+35.8)#25 | 10.9%(+36.2)#1,263 |
| 26. | Montrose | 45.4% | 11.3%(+34.1)#26 | 10.9%(+34.5)#1,341 |
| 27. | Riddleville | 45.4% | 11.3%(+34.1)#27 | 10.9%(+34.5)#1,349 |
| 28. | Unadilla | 45.1% | 11.3%(+33.8)#28 | 10.9%(+34.2)#1,354 |
| 29. | Pine Mountain | 44.4% | 11.3%(+33.1)#29 | 10.9%(+33.5)#1,391 |
| 30. | Lavonia | 44.3% | 11.3%(+33.0)#30 | 10.9%(+33.4)#1,402 |
| 31. | Leesburg | 43.6% | 11.3%(+32.3)#31 | 10.9%(+32.7)#1,440 |
| 32. | Warwick | 43.5% | 11.3%(+32.2)#32 | 10.9%(+32.6)#1,453 |
| 33. | Climax | 42.8% | 11.3%(+31.5)#33 | 10.9%(+31.9)#1,523 |
| 34. | Boston | 42.5% | 11.3%(+31.2)#34 | 10.9%(+31.6)#1,539 |
| 35. | Webster County Unified Government | 41.7% | 11.3%(+30.4)#35 | 10.9%(+30.8)#1,583 |
| 36. | East Ellijay | 41.6% | 11.3%(+30.3)#36 | 10.9%(+30.7)#1,592 |
| 37. | Ila | 41.6% | 11.3%(+30.3)#37 | 10.9%(+30.7)#1,595 |
| 38. | Irwinton | 41.1% | 11.3%(+29.8)#38 | 10.9%(+30.2)#1,635 |
| 39. | Newborn | 40.9% | 11.3%(+29.6)#39 | 10.9%(+30.0)#1,650 |
| 40. | Unionville | 40.1% | 11.3%(+28.8)#40 | 10.9%(+29.2)#1,684 |
| 41. | Sparta | 39.9% | 11.3%(+28.6)#41 | 10.9%(+29.0)#1,720 |
| 42. | Centralhatchee | 39.9% | 11.3%(+28.6)#42 | 10.9%(+29.0)#1,725 |
| 43. | Surrency | 39.9% | 11.3%(+28.6)#43 | 10.9%(+29.0)#1,734 |
| 44. | Woodbine | 39.0% | 11.3%(+27.7)#44 | 10.9%(+28.1)#1,782 |
| 45. | Henderson | 38.6% | 11.3%(+27.3)#45 | 10.9%(+27.7)#1,803 |
| 46. | Greensboro | 35.9% | 11.3%(+24.6)#46 | 10.9%(+25.0)#2,020 |
| 47. | Carnesville | 35.8% | 11.3%(+24.5)#47 | 10.9%(+24.9)#2,034 |
| 48. | Bainbridge | 35.7% | 11.3%(+24.4)#48 | 10.9%(+24.8)#2,036 |
| 49. | Twin City | 35.5% | 11.3%(+24.2)#49 | 10.9%(+24.6)#2,058 |
| 50. | Waresboro | 35.5% | 11.3%(+24.2)#50 | 10.9%(+24.6)#2,062 |
| 51. | Bonanza | 35.0% | 11.3%(+23.7)#51 | 10.9%(+24.1)#2,109 |
| 52. | Ty Ty | 34.4% | 11.3%(+23.1)#52 | 10.9%(+23.5)#2,164 |
| 53. | Morrow | 34.3% | 11.3%(+23.0)#53 | 10.9%(+23.4)#2,169 |
| 54. | Lovejoy | 33.9% | 11.3%(+22.6)#54 | 10.9%(+23.0)#2,205 |
| 55. | Antioch | 33.8% | 11.3%(+22.5)#55 | 10.9%(+22.9)#2,219 |
| 56. | Oglethorpe | 33.3% | 11.3%(+22.0)#56 | 10.9%(+22.4)#2,253 |
| 57. | Norwood | 33.3% | 11.3%(+22.0)#57 | 10.9%(+22.4)#2,305 |
| 58. | Mount Vernon | 33.2% | 11.3%(+21.9)#58 | 10.9%(+22.3)#2,351 |
| 59. | Graham | 33.1% | 11.3%(+21.8)#59 | 10.9%(+22.2)#2,357 |
| 60. | Forsyth | 32.7% | 11.3%(+21.4)#60 | 10.9%(+21.8)#2,376 |
| 61. | Sandersville | 32.3% | 11.3%(+21.0)#61 | 10.9%(+21.4)#2,411 |
| 62. | Camilla | 32.0% | 11.3%(+20.7)#62 | 10.9%(+21.1)#2,448 |
| 63. | Walthourville | 31.6% | 11.3%(+20.3)#63 | 10.9%(+20.7)#2,491 |
| 64. | Lilly | 31.5% | 11.3%(+20.2)#64 | 10.9%(+20.6)#2,514 |
| 65. | Thomson | 30.9% | 11.3%(+19.6)#65 | 10.9%(+20.0)#2,575 |
| 66. | Kingston | 30.8% | 11.3%(+19.5)#66 | 10.9%(+19.9)#2,586 |
| 67. | Port Wentworth | 30.7% | 11.3%(+19.4)#67 | 10.9%(+19.8)#2,590 |
| 68. | Guyton | 30.7% | 11.3%(+19.4)#68 | 10.9%(+19.8)#2,594 |
| 69. | Jesup | 30.2% | 11.3%(+18.9)#69 | 10.9%(+19.3)#2,651 |
| 70. | Metter | 29.9% | 11.3%(+18.6)#70 | 10.9%(+19.0)#2,691 |
| 71. | Conyers | 29.3% | 11.3%(+18.0)#71 | 10.9%(+18.4)#2,774 |
| 72. | Soperton | 29.3% | 11.3%(+18.0)#72 | 10.9%(+18.4)#2,778 |
| 73. | Greenville | 28.5% | 11.3%(+17.2)#73 | 10.9%(+17.6)#2,872 |
| 74. | Ringgold | 28.3% | 11.3%(+17.0)#74 | 10.9%(+17.4)#2,919 |
| 75. | Abbeville | 28.3% | 11.3%(+17.0)#75 | 10.9%(+17.4)#2,920 |
| 76. | Molena | 28.2% | 11.3%(+16.9)#76 | 10.9%(+17.3)#2,943 |
| 77. | Panthersville | 28.1% | 11.3%(+16.8)#77 | 10.9%(+17.2)#2,946 |
| 78. | Baconton | 27.6% | 11.3%(+16.3)#78 | 10.9%(+16.7)#3,027 |
| 79. | Folkston | 27.0% | 11.3%(+15.7)#79 | 10.9%(+16.1)#3,112 |
| 80. | Varnell | 26.9% | 11.3%(+15.6)#80 | 10.9%(+16.0)#3,133 |
| 81. | Royston | 26.8% | 11.3%(+15.5)#81 | 10.9%(+15.9)#3,143 |
| 82. | Louisville | 26.7% | 11.3%(+15.4)#82 | 10.9%(+15.8)#3,159 |
| 83. | Belvedere Park | 26.5% | 11.3%(+15.2)#83 | 10.9%(+15.6)#3,200 |
| 84. | Donalsonville | 26.1% | 11.3%(+14.8)#84 | 10.9%(+15.2)#3,284 |
| 85. | Candler Mcafee | 25.7% | 11.3%(+14.4)#85 | 10.9%(+14.8)#3,350 |
| 86. | Vienna | 25.4% | 11.3%(+14.1)#86 | 10.9%(+14.5)#3,402 |
| 87. | Offerman | 25.0% | 11.3%(+13.7)#87 | 10.9%(+14.1)#3,470 |
| 88. | Parrott | 25.0% | 11.3%(+13.7)#88 | 10.9%(+14.1)#3,510 |
| 89. | Bowersville | 24.9% | 11.3%(+13.6)#89 | 10.9%(+14.0)#3,536 |
| 90. | Emerson | 24.5% | 11.3%(+13.2)#90 | 10.9%(+13.6)#3,604 |
| 91. | Midway | 24.0% | 11.3%(+12.7)#91 | 10.9%(+13.1)#3,700 |
| 92. | Alto | 23.8% | 11.3%(+12.5)#92 | 10.9%(+12.9)#3,743 |
| 93. | Fort Stewart | 23.5% | 11.3%(+12.2)#93 | 10.9%(+12.6)#3,803 |
| 94. | Kings Bay Base | 23.3% | 11.3%(+12.0)#94 | 10.9%(+12.4)#3,851 |
| 95. | Monroe | 23.2% | 11.3%(+11.9)#95 | 10.9%(+12.3)#3,870 |
| 96. | Davisboro | 23.0% | 11.3%(+11.7)#96 | 10.9%(+12.1)#3,922 |
| 97. | Hagan | 23.0% | 11.3%(+11.7)#97 | 10.9%(+12.1)#3,929 |
| 98. | Eatonton | 22.9% | 11.3%(+11.6)#98 | 10.9%(+12.0)#3,960 |
| 99. | Putney | 22.5% | 11.3%(+11.2)#99 | 10.9%(+11.6)#4,043 |
| 100. | Marshallville | 22.3% | 11.3%(+11.0)#100 | 10.9%(+11.4)#4,106 |
Common Questions
What are the Top 10 Cities with the Highest Unemployment Rate Amomg Youth Under the Age of 25 in Georgia?
Top 10 Cities with the Highest Unemployment Rate Amomg Youth Under the Age of 25 in Georgia are:
#1
100.0%
#2
100.0%
#3
99.9%
#4
99.9%
#5
95.2%
#6
90.9%
#7
86.3%
#8
85.5%
#9
72.2%
#10
69.3%
What city has the Highest Unemployment Rate Amomg Youth Under the Age of 25 in Georgia?
Sautee Nacoochee has the Highest Unemployment Rate Amomg Youth Under the Age of 25 in Georgia with 100.0%.
What is the Unemployment Rate Amomg Youth Under the Age of 25 in the State of Georgia?
Unemployment Rate Amomg Youth Under the Age of 25 in Georgia is 11.3%.
What is the Unemployment Rate Amomg Youth Under the Age of 25 in the United States?
Unemployment Rate Amomg Youth Under the Age of 25 in the United States is 10.9%.