Cities with the Highest Unemployment Rate Amomg Youth Under the Age of 25 in Utah
RELATED REPORTS & OPTIONS
Highest Unemployment | Youth < 25
Utah
Compare Cities
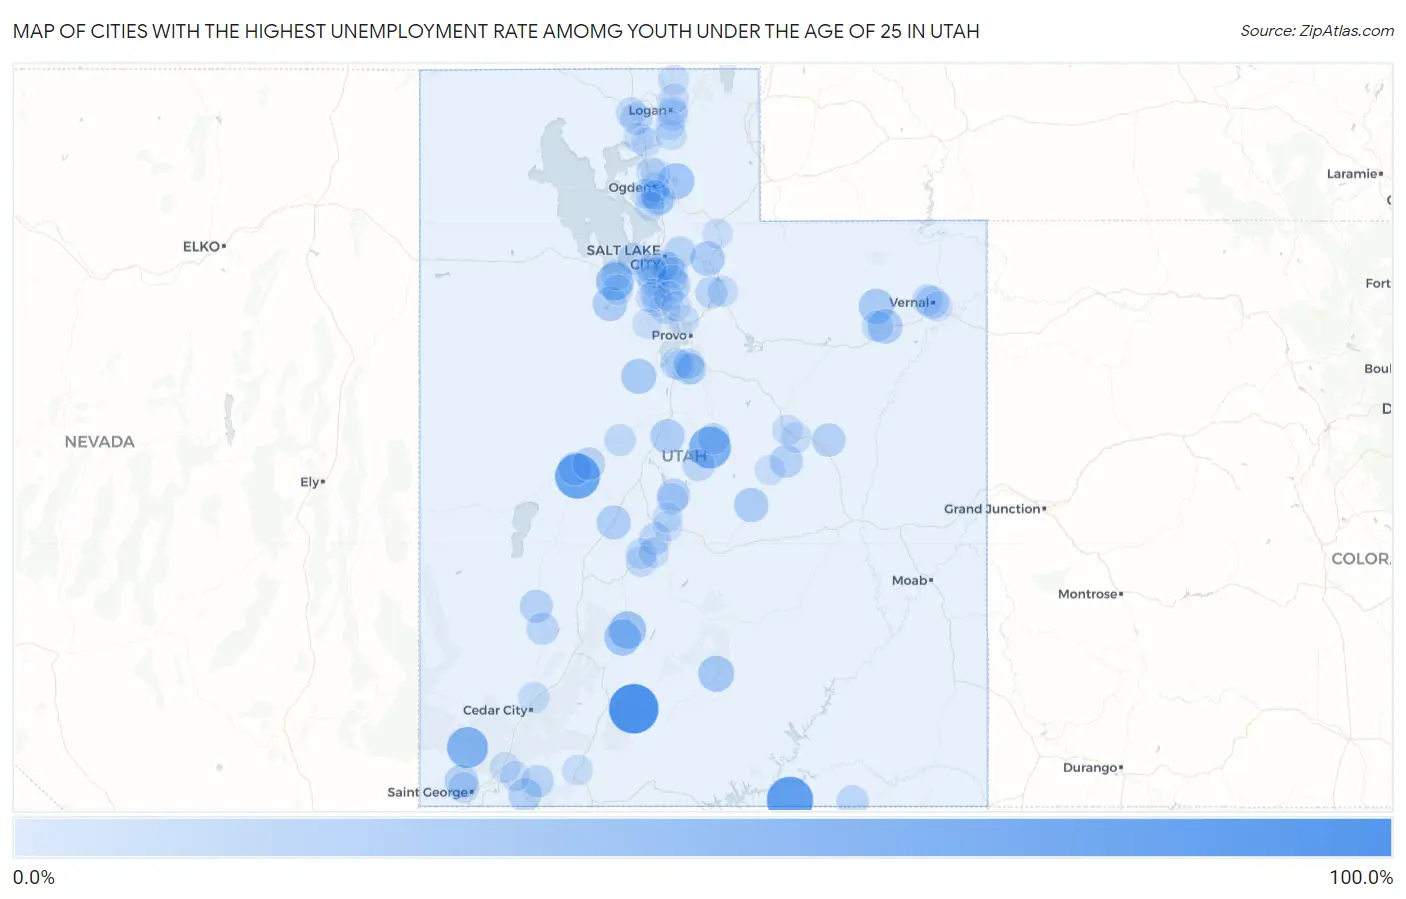
Map of Cities with the Highest Unemployment Rate Amomg Youth Under the Age of 25 in Utah
0.0%
100.0%
Cities with the Highest Unemployment Rate Amomg Youth Under the Age of 25 in Utah
| City | Youth Unemployment | vs State | vs National | |
| 1. | Bryce Canyon City | 100.0% | 6.7%(+93.3)#1 | 10.9%(+89.1)#178 |
| 2. | Navajo Mountain | 84.2% | 6.7%(+77.5)#2 | 10.9%(+73.3)#432 |
| 3. | Deseret | 77.0% | 6.7%(+70.3)#3 | 10.9%(+66.1)#486 |
| 4. | Spring City | 62.6% | 6.7%(+55.9)#4 | 10.9%(+51.7)#717 |
| 5. | Central | 57.8% | 6.7%(+51.1)#5 | 10.9%(+46.9)#827 |
| 6. | Erda | 41.9% | 6.7%(+35.2)#6 | 10.9%(+31.0)#1,567 |
| 7. | Junction | 40.0% | 6.7%(+33.3)#7 | 10.9%(+29.1)#1,697 |
| 8. | Circleville | 35.3% | 6.7%(+28.6)#8 | 10.9%(+24.4)#2,082 |
| 9. | Huntsville | 34.6% | 6.7%(+27.9)#9 | 10.9%(+23.7)#2,149 |
| 10. | Boulder | 33.3% | 6.7%(+26.6)#10 | 10.9%(+22.4)#2,288 |
| 11. | Eureka | 29.4% | 6.7%(+22.7)#11 | 10.9%(+18.5)#2,768 |
| 12. | Neola | 29.1% | 6.7%(+22.4)#12 | 10.9%(+18.2)#2,806 |
| 13. | Ballard | 28.2% | 6.7%(+21.5)#13 | 10.9%(+17.3)#2,938 |
| 14. | Silver Summit | 27.5% | 6.7%(+20.8)#14 | 10.9%(+16.6)#3,036 |
| 15. | Stockton | 27.1% | 6.7%(+20.4)#15 | 10.9%(+16.2)#3,107 |
| 16. | Ferron | 26.7% | 6.7%(+20.0)#16 | 10.9%(+15.8)#3,161 |
| 17. | Levan | 26.2% | 6.7%(+19.5)#17 | 10.9%(+15.3)#3,275 |
| 18. | Fillmore | 24.8% | 6.7%(+18.1)#18 | 10.9%(+13.9)#3,558 |
| 19. | Granite | 22.6% | 6.7%(+15.9)#19 | 10.9%(+11.7)#4,034 |
| 20. | Ivins | 22.3% | 6.7%(+15.6)#20 | 10.9%(+11.4)#4,087 |
| 21. | White | 22.3% | 6.7%(+15.6)#21 | 10.9%(+11.4)#4,092 |
| 22. | Apple Valley | 22.2% | 6.7%(+15.5)#22 | 10.9%(+11.3)#4,131 |
| 23. | East Carbon | 21.6% | 6.7%(+14.9)#23 | 10.9%(+10.7)#4,285 |
| 24. | Hinckley | 21.2% | 6.7%(+14.5)#24 | 10.9%(+10.3)#4,393 |
| 25. | Elmo | 20.6% | 6.7%(+13.9)#25 | 10.9%(+9.70)#4,555 |
| 26. | Milford | 20.1% | 6.7%(+13.4)#26 | 10.9%(+9.20)#4,675 |
| 27. | Delta | 19.1% | 6.7%(+12.4)#27 | 10.9%(+8.20)#5,007 |
| 28. | Gunnison | 18.6% | 6.7%(+11.9)#28 | 10.9%(+7.70)#5,173 |
| 29. | Vernal | 18.2% | 6.7%(+11.5)#29 | 10.9%(+7.30)#5,283 |
| 30. | Springdale | 18.1% | 6.7%(+11.4)#30 | 10.9%(+7.20)#5,340 |
| 31. | Kearns | 16.9% | 6.7%(+10.2)#31 | 10.9%(+6.00)#5,810 |
| 32. | Minersville | 16.8% | 6.7%(+10.1)#32 | 10.9%(+5.90)#5,884 |
| 33. | Ephraim | 16.2% | 6.7%(+9.50)#33 | 10.9%(+5.30)#6,124 |
| 34. | Magna | 16.0% | 6.7%(+9.30)#34 | 10.9%(+5.10)#6,192 |
| 35. | Elwood | 15.9% | 6.7%(+9.20)#35 | 10.9%(+5.00)#6,275 |
| 36. | Oljato Monument Valley | 15.9% | 6.7%(+9.20)#36 | 10.9%(+5.00)#6,284 |
| 37. | Sigurd | 15.7% | 6.7%(+9.00)#37 | 10.9%(+4.80)#6,367 |
| 38. | Midway | 15.5% | 6.7%(+8.80)#38 | 10.9%(+4.60)#6,438 |
| 39. | Emigration Canyon | 15.5% | 6.7%(+8.80)#39 | 10.9%(+4.60)#6,457 |
| 40. | Elk Ridge | 14.8% | 6.7%(+8.10)#40 | 10.9%(+3.90)#6,789 |
| 41. | Mount Pleasant | 14.3% | 6.7%(+7.60)#41 | 10.9%(+3.40)#7,012 |
| 42. | Leamington | 14.2% | 6.7%(+7.50)#42 | 10.9%(+3.30)#7,117 |
| 43. | Uintah | 13.8% | 6.7%(+7.10)#43 | 10.9%(+2.90)#7,346 |
| 44. | South Weber | 13.5% | 6.7%(+6.80)#44 | 10.9%(+2.60)#7,532 |
| 45. | Maeser | 12.9% | 6.7%(+6.20)#45 | 10.9%(+2.00)#7,874 |
| 46. | Centerfield | 12.5% | 6.7%(+5.80)#46 | 10.9%(+1.60)#8,118 |
| 47. | Roosevelt | 12.4% | 6.7%(+5.70)#47 | 10.9%(+1.50)#8,188 |
| 48. | Central Valley | 12.3% | 6.7%(+5.60)#48 | 10.9%(+1.40)#8,266 |
| 49. | West Mountain | 12.2% | 6.7%(+5.50)#49 | 10.9%(+1.30)#8,321 |
| 50. | Providence | 12.0% | 6.7%(+5.30)#50 | 10.9%(+1.10)#8,403 |
| 51. | Enoch | 11.7% | 6.7%(+5.00)#51 | 10.9%(+0.800)#8,577 |
| 52. | Millcreek | 11.5% | 6.7%(+4.80)#52 | 10.9%(+0.600)#8,697 |
| 53. | Santa Clara | 11.3% | 6.7%(+4.60)#53 | 10.9%(+0.400)#8,852 |
| 54. | West Jordan | 11.1% | 6.7%(+4.40)#54 | 10.9%(+0.200)#8,945 |
| 55. | Taylorsville | 11.1% | 6.7%(+4.40)#55 | 10.9%(+0.200)#8,947 |
| 56. | Holladay | 10.9% | 6.7%(+4.20)#56 | 10.9%(=0.000)#9,110 |
| 57. | Stansbury Park | 10.8% | 6.7%(+4.10)#57 | 10.9%(-0.100)#9,191 |
| 58. | South Salt Lake | 10.6% | 6.7%(+3.90)#58 | 10.9%(-0.300)#9,311 |
| 59. | Tremonton | 10.5% | 6.7%(+3.80)#59 | 10.9%(-0.400)#9,402 |
| 60. | Heber | 10.4% | 6.7%(+3.70)#60 | 10.9%(-0.500)#9,483 |
| 61. | Richfield | 10.4% | 6.7%(+3.70)#61 | 10.9%(-0.500)#9,501 |
| 62. | Payson | 10.3% | 6.7%(+3.60)#62 | 10.9%(-0.600)#9,555 |
| 63. | Richmond | 10.3% | 6.7%(+3.60)#63 | 10.9%(-0.600)#9,588 |
| 64. | Wellington | 10.3% | 6.7%(+3.60)#64 | 10.9%(-0.600)#9,605 |
| 65. | Lehi | 10.2% | 6.7%(+3.50)#65 | 10.9%(-0.700)#9,629 |
| 66. | Woodland Hills | 10.2% | 6.7%(+3.50)#66 | 10.9%(-0.700)#9,682 |
| 67. | Riverdale | 10.1% | 6.7%(+3.40)#67 | 10.9%(-0.800)#9,728 |
| 68. | Salem | 10.0% | 6.7%(+3.30)#68 | 10.9%(-0.900)#9,795 |
| 69. | Toquerville | 9.9% | 6.7%(+3.20)#69 | 10.9%(-1.000)#9,908 |
| 70. | Price | 9.6% | 6.7%(+2.90)#70 | 10.9%(-1.30)#10,119 |
| 71. | Paradise | 9.6% | 6.7%(+2.90)#71 | 10.9%(-1.30)#10,147 |
| 72. | Bluffdale | 9.3% | 6.7%(+2.60)#72 | 10.9%(-1.60)#10,335 |
| 73. | West Valley City | 9.2% | 6.7%(+2.50)#73 | 10.9%(-1.70)#10,407 |
| 74. | Tooele | 9.2% | 6.7%(+2.50)#74 | 10.9%(-1.70)#10,420 |
| 75. | Orderville | 9.0% | 6.7%(+2.30)#75 | 10.9%(-1.90)#10,612 |
| 76. | Riverton | 8.9% | 6.7%(+2.20)#76 | 10.9%(-2.00)#10,662 |
| 77. | Lindon | 8.9% | 6.7%(+2.20)#77 | 10.9%(-2.00)#10,685 |
| 78. | Herriman | 8.8% | 6.7%(+2.10)#78 | 10.9%(-2.10)#10,729 |
| 79. | Virgin | 8.8% | 6.7%(+2.10)#79 | 10.9%(-2.10)#10,806 |
| 80. | Cottonwood Heights | 8.7% | 6.7%(+2.00)#80 | 10.9%(-2.20)#10,831 |
| 81. | Ogden | 8.5% | 6.7%(+1.80)#81 | 10.9%(-2.40)#10,994 |
| 82. | Eagle Mountain | 8.3% | 6.7%(+1.60)#82 | 10.9%(-2.60)#11,165 |
| 83. | River Heights | 8.3% | 6.7%(+1.60)#83 | 10.9%(-2.60)#11,211 |
| 84. | Glenwood | 8.3% | 6.7%(+1.60)#84 | 10.9%(-2.60)#11,234 |
| 85. | Draper | 8.2% | 6.7%(+1.50)#85 | 10.9%(-2.70)#11,260 |
| 86. | Huntington | 8.2% | 6.7%(+1.50)#86 | 10.9%(-2.70)#11,303 |
| 87. | North Ogden | 8.1% | 6.7%(+1.40)#87 | 10.9%(-2.80)#11,325 |
| 88. | Hyde Park | 8.1% | 6.7%(+1.40)#88 | 10.9%(-2.80)#11,348 |
| 89. | Coalville | 8.1% | 6.7%(+1.40)#89 | 10.9%(-2.80)#11,366 |
| 90. | Corinne | 7.8% | 6.7%(+1.10)#90 | 10.9%(-3.10)#11,598 |
| 91. | Brigham City | 7.6% | 6.7%(+0.900)#91 | 10.9%(-3.30)#11,696 |
| 92. | Naples | 7.5% | 6.7%(+0.800)#92 | 10.9%(-3.40)#11,825 |
| 93. | Roy | 7.2% | 6.7%(+0.500)#93 | 10.9%(-3.70)#12,023 |
| 94. | Highland | 7.0% | 6.7%(+0.300)#94 | 10.9%(-3.90)#12,186 |
| 95. | Salina | 7.0% | 6.7%(+0.300)#95 | 10.9%(-3.90)#12,222 |
| 96. | Redmond | 6.9% | 6.7%(+0.200)#96 | 10.9%(-4.00)#12,296 |
| 97. | Pleasant View | 6.8% | 6.7%(+0.100)#97 | 10.9%(-4.10)#12,327 |
| 98. | Washington Terrace | 6.8% | 6.7%(+0.100)#98 | 10.9%(-4.10)#12,334 |
| 99. | Hyrum | 6.6% | 6.7%(-0.100)#99 | 10.9%(-4.30)#12,483 |
| 100. | Clearfield | 6.5% | 6.7%(-0.200)#100 | 10.9%(-4.40)#12,549 |
1
2Common Questions
What are the Top 10 Cities with the Highest Unemployment Rate Amomg Youth Under the Age of 25 in Utah?
Top 10 Cities with the Highest Unemployment Rate Amomg Youth Under the Age of 25 in Utah are:
#1
100.0%
#2
84.2%
#3
77.0%
#4
62.6%
#5
57.8%
#6
41.9%
#7
40.0%
#8
35.3%
#9
34.6%
#10
33.3%
What city has the Highest Unemployment Rate Amomg Youth Under the Age of 25 in Utah?
Bryce Canyon City has the Highest Unemployment Rate Amomg Youth Under the Age of 25 in Utah with 100.0%.
What is the Unemployment Rate Amomg Youth Under the Age of 25 in the State of Utah?
Unemployment Rate Amomg Youth Under the Age of 25 in Utah is 6.7%.
What is the Unemployment Rate Amomg Youth Under the Age of 25 in the United States?
Unemployment Rate Amomg Youth Under the Age of 25 in the United States is 10.9%.