Cities with the Highest Unemployment Rate Amomg Youth Under the Age of 25 in Alabama
RELATED REPORTS & OPTIONS
Highest Unemployment | Youth < 25
Alabama
Compare Cities
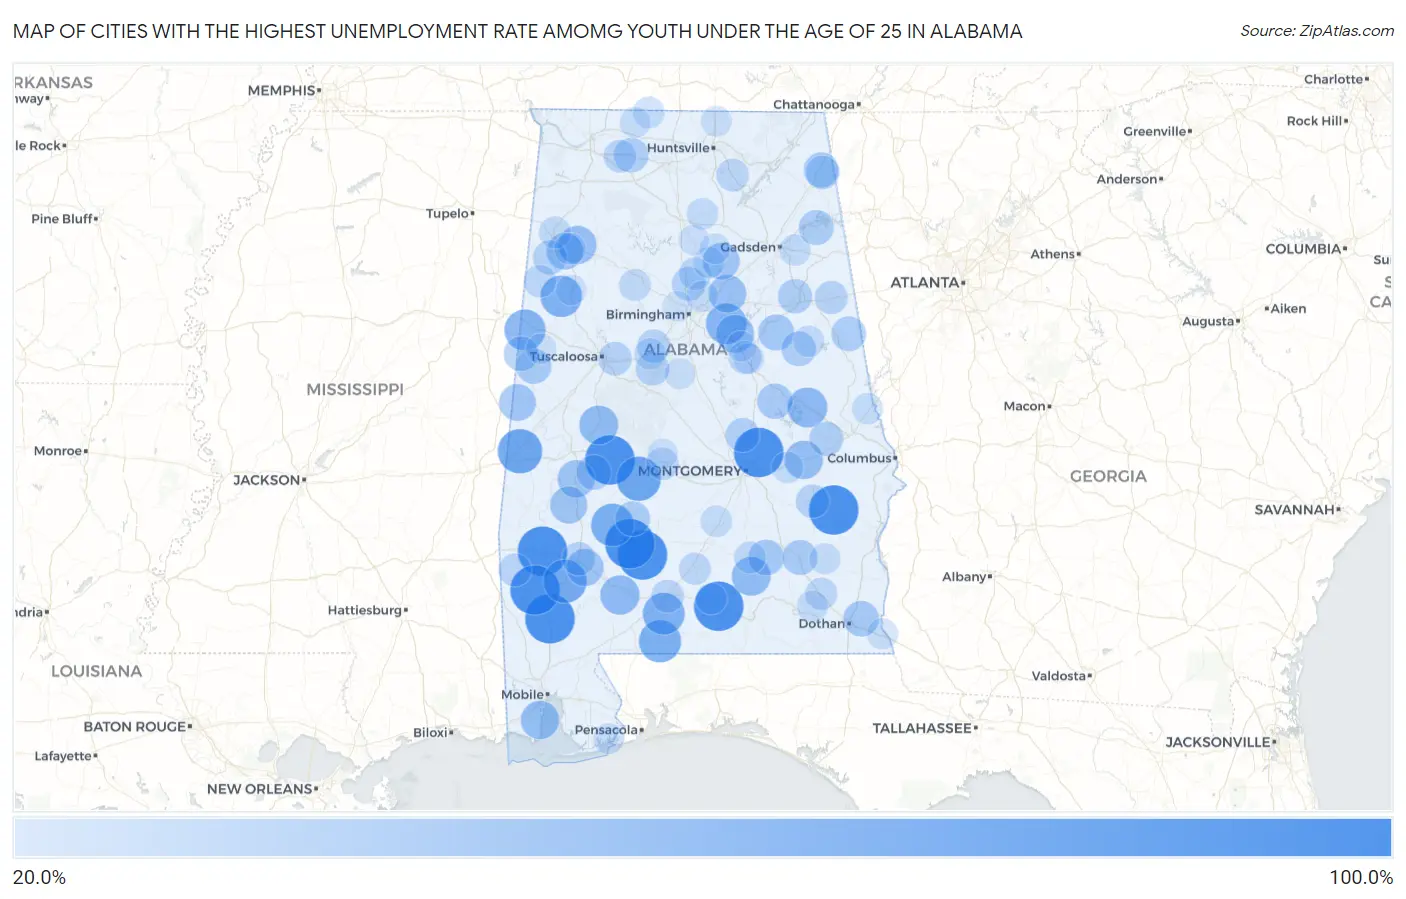
Map of Cities with the Highest Unemployment Rate Amomg Youth Under the Age of 25 in Alabama
0.0%
100.0%
Cities with the Highest Unemployment Rate Amomg Youth Under the Age of 25 in Alabama
| City | Youth Unemployment | vs State | vs National | |
| 1. | Mcintosh | 100.0% | 10.9%(+89.1)#1 | 10.9%(+89.1)#16 |
| 2. | Blue Ridge | 100.0% | 10.9%(+89.1)#2 | 10.9%(+89.1)#53 |
| 3. | Midway | 100.0% | 10.9%(+89.1)#3 | 10.9%(+89.1)#104 |
| 4. | River Falls | 100.0% | 10.9%(+89.1)#4 | 10.9%(+89.1)#107 |
| 5. | Abanda | 100.0% | 10.9%(+89.1)#5 | 10.9%(+89.1)#133 |
| 6. | Coffeeville | 100.0% | 10.9%(+89.1)#6 | 10.9%(+89.1)#181 |
| 7. | Beatrice | 100.0% | 10.9%(+89.1)#7 | 10.9%(+89.1)#204 |
| 8. | Hobson | 100.0% | 10.9%(+89.1)#8 | 10.9%(+89.1)#236 |
| 9. | Uniontown | 99.9% | 10.9%(+89.0)#9 | 10.9%(+89.0)#326 |
| 10. | Vredenburgh | 99.9% | 10.9%(+89.0)#10 | 10.9%(+89.0)#361 |
| 11. | York | 79.1% | 10.9%(+68.2)#11 | 10.9%(+68.2)#468 |
| 12. | Orrville | 78.9% | 10.9%(+68.0)#12 | 10.9%(+68.0)#473 |
| 13. | Jackson | 74.7% | 10.9%(+63.8)#13 | 10.9%(+63.8)#524 |
| 14. | Yellow Bluff | 72.2% | 10.9%(+61.3)#14 | 10.9%(+61.3)#553 |
| 15. | East Brewton | 70.6% | 10.9%(+59.7)#15 | 10.9%(+59.7)#576 |
| 16. | Castleberry | 68.7% | 10.9%(+57.8)#16 | 10.9%(+57.8)#607 |
| 17. | Belk | 67.4% | 10.9%(+56.5)#17 | 10.9%(+56.5)#621 |
| 18. | Macedonia | 65.7% | 10.9%(+54.8)#18 | 10.9%(+54.8)#665 |
| 19. | Sterrett | 64.1% | 10.9%(+53.2)#19 | 10.9%(+53.2)#686 |
| 20. | Dadeville | 60.5% | 10.9%(+49.6)#20 | 10.9%(+49.6)#758 |
| 21. | Frisco City | 58.2% | 10.9%(+47.3)#21 | 10.9%(+47.3)#821 |
| 22. | Brantley | 57.1% | 10.9%(+46.2)#22 | 10.9%(+46.2)#848 |
| 23. | Greensboro | 56.9% | 10.9%(+46.0)#23 | 10.9%(+46.0)#867 |
| 24. | Franklin | 55.2% | 10.9%(+44.3)#24 | 10.9%(+44.3)#921 |
| 25. | Belle Fontaine | 54.8% | 10.9%(+43.9)#25 | 10.9%(+43.9)#936 |
| 26. | Vincent | 53.4% | 10.9%(+42.5)#26 | 10.9%(+42.5)#976 |
| 27. | Brilliant | 53.4% | 10.9%(+42.5)#27 | 10.9%(+42.5)#977 |
| 28. | Margaret | 51.9% | 10.9%(+41.0)#28 | 10.9%(+41.0)#1,022 |
| 29. | Linden | 50.4% | 10.9%(+39.5)#29 | 10.9%(+39.5)#1,074 |
| 30. | Sweet Water | 50.0% | 10.9%(+39.1)#30 | 10.9%(+39.1)#1,115 |
| 31. | Whatley | 50.0% | 10.9%(+39.1)#31 | 10.9%(+39.1)#1,124 |
| 32. | Allgood | 48.6% | 10.9%(+37.7)#32 | 10.9%(+37.7)#1,222 |
| 33. | Geiger | 48.6% | 10.9%(+37.7)#33 | 10.9%(+37.7)#1,223 |
| 34. | Guin | 47.8% | 10.9%(+36.9)#34 | 10.9%(+36.9)#1,248 |
| 35. | Waldo | 45.4% | 10.9%(+34.5)#35 | 10.9%(+34.5)#1,344 |
| 36. | Goshen | 44.4% | 10.9%(+33.5)#36 | 10.9%(+33.5)#1,396 |
| 37. | Webb | 44.1% | 10.9%(+33.2)#37 | 10.9%(+33.2)#1,413 |
| 38. | Ray | 43.1% | 10.9%(+32.2)#38 | 10.9%(+32.2)#1,484 |
| 39. | Aliceville | 42.2% | 10.9%(+31.3)#39 | 10.9%(+31.3)#1,546 |
| 40. | Hammondville | 41.6% | 10.9%(+30.7)#40 | 10.9%(+30.7)#1,594 |
| 41. | Brundidge | 41.5% | 10.9%(+30.6)#41 | 10.9%(+30.6)#1,611 |
| 42. | Centre | 41.3% | 10.9%(+30.4)#42 | 10.9%(+30.4)#1,619 |
| 43. | Dayton | 41.1% | 10.9%(+30.2)#43 | 10.9%(+30.2)#1,639 |
| 44. | Camden | 41.0% | 10.9%(+30.1)#44 | 10.9%(+30.1)#1,642 |
| 45. | Pickensville | 40.6% | 10.9%(+29.7)#45 | 10.9%(+29.7)#1,663 |
| 46. | Ashland | 40.2% | 10.9%(+29.3)#46 | 10.9%(+29.3)#1,679 |
| 47. | Woodland | 40.2% | 10.9%(+29.3)#47 | 10.9%(+29.3)#1,681 |
| 48. | North Courtland | 39.9% | 10.9%(+29.0)#48 | 10.9%(+29.0)#1,727 |
| 49. | West End Cobb Town | 39.1% | 10.9%(+28.2)#49 | 10.9%(+28.2)#1,767 |
| 50. | Holtville | 38.1% | 10.9%(+27.2)#50 | 10.9%(+27.2)#1,839 |
| 51. | Loachapoka | 38.0% | 10.9%(+27.1)#51 | 10.9%(+27.1)#1,854 |
| 52. | Beaverton | 37.5% | 10.9%(+26.6)#52 | 10.9%(+26.6)#1,902 |
| 53. | Morris | 36.6% | 10.9%(+25.7)#53 | 10.9%(+25.7)#1,963 |
| 54. | West Blocton | 36.1% | 10.9%(+25.2)#54 | 10.9%(+25.2)#2,005 |
| 55. | Cottondale | 36.0% | 10.9%(+25.1)#55 | 10.9%(+25.1)#2,011 |
| 56. | Valley Head | 36.0% | 10.9%(+25.1)#56 | 10.9%(+25.1)#2,015 |
| 57. | Lake View | 35.6% | 10.9%(+24.7)#57 | 10.9%(+24.7)#2,047 |
| 58. | Grove Hill | 35.6% | 10.9%(+24.7)#58 | 10.9%(+24.7)#2,049 |
| 59. | Union Springs | 35.3% | 10.9%(+24.4)#59 | 10.9%(+24.4)#2,075 |
| 60. | Heflin | 33.9% | 10.9%(+23.0)#60 | 10.9%(+23.0)#2,208 |
| 61. | Evergreen | 33.3% | 10.9%(+22.4)#61 | 10.9%(+22.4)#2,244 |
| 62. | Oak Grove | 33.3% | 10.9%(+22.4)#62 | 10.9%(+22.4)#2,257 |
| 63. | Millry | 33.3% | 10.9%(+22.4)#63 | 10.9%(+22.4)#2,268 |
| 64. | Town Creek | 32.6% | 10.9%(+21.7)#64 | 10.9%(+21.7)#2,389 |
| 65. | New Hope | 32.2% | 10.9%(+21.3)#65 | 10.9%(+21.3)#2,426 |
| 66. | Selma | 31.3% | 10.9%(+20.4)#66 | 10.9%(+20.4)#2,528 |
| 67. | Vernon | 31.2% | 10.9%(+20.3)#67 | 10.9%(+20.3)#2,537 |
| 68. | Trafford | 31.2% | 10.9%(+20.3)#68 | 10.9%(+20.3)#2,544 |
| 69. | Ozark | 30.2% | 10.9%(+19.3)#69 | 10.9%(+19.3)#2,648 |
| 70. | Georgiana | 29.9% | 10.9%(+19.0)#70 | 10.9%(+19.0)#2,700 |
| 71. | Hamilton | 29.7% | 10.9%(+18.8)#71 | 10.9%(+18.8)#2,724 |
| 72. | Luverne | 29.1% | 10.9%(+18.2)#72 | 10.9%(+18.2)#2,798 |
| 73. | Parrish | 29.0% | 10.9%(+18.1)#73 | 10.9%(+18.1)#2,820 |
| 74. | Shorter | 28.5% | 10.9%(+17.6)#74 | 10.9%(+17.6)#2,885 |
| 75. | Lester | 28.5% | 10.9%(+17.6)#75 | 10.9%(+17.6)#2,900 |
| 76. | Woodstock | 28.3% | 10.9%(+17.4)#76 | 10.9%(+17.4)#2,926 |
| 77. | Fort Deposit | 27.8% | 10.9%(+16.9)#77 | 10.9%(+16.9)#2,991 |
| 78. | Locust Fork | 27.7% | 10.9%(+16.8)#78 | 10.9%(+16.8)#3,007 |
| 79. | Fairview | 27.7% | 10.9%(+16.8)#79 | 10.9%(+16.8)#3,012 |
| 80. | Twin | 27.7% | 10.9%(+16.8)#80 | 10.9%(+16.8)#3,015 |
| 81. | Lineville | 27.4% | 10.9%(+16.5)#81 | 10.9%(+16.5)#3,047 |
| 82. | Hokes Bluff | 27.3% | 10.9%(+16.4)#82 | 10.9%(+16.4)#3,060 |
| 83. | Red Level | 27.2% | 10.9%(+16.3)#83 | 10.9%(+16.3)#3,081 |
| 84. | Lanett | 27.0% | 10.9%(+16.1)#84 | 10.9%(+16.1)#3,111 |
| 85. | Clio | 26.9% | 10.9%(+16.0)#85 | 10.9%(+16.0)#3,135 |
| 86. | Center Point | 26.5% | 10.9%(+15.6)#86 | 10.9%(+15.6)#3,199 |
| 87. | Fort Rucker | 26.1% | 10.9%(+15.2)#87 | 10.9%(+15.2)#3,282 |
| 88. | Gordon | 25.8% | 10.9%(+14.9)#88 | 10.9%(+14.9)#3,346 |
| 89. | Sylacauga | 25.6% | 10.9%(+14.7)#89 | 10.9%(+14.7)#3,370 |
| 90. | Wilton | 25.0% | 10.9%(+14.1)#90 | 10.9%(+14.1)#3,474 |
| 91. | Anderson | 25.0% | 10.9%(+14.1)#91 | 10.9%(+14.1)#3,498 |
| 92. | Perdido Beach | 24.9% | 10.9%(+14.0)#92 | 10.9%(+14.0)#3,537 |
| 93. | Hazel Green | 24.8% | 10.9%(+13.9)#93 | 10.9%(+13.9)#3,554 |
| 94. | Cleveland | 24.7% | 10.9%(+13.8)#94 | 10.9%(+13.8)#3,576 |
| 95. | Childersburg | 23.9% | 10.9%(+13.0)#95 | 10.9%(+13.0)#3,711 |
| 96. | Fayette | 23.9% | 10.9%(+13.0)#96 | 10.9%(+13.0)#3,712 |
| 97. | Hanceville | 23.8% | 10.9%(+12.9)#97 | 10.9%(+12.9)#3,737 |
| 98. | Carrollton | 23.4% | 10.9%(+12.5)#98 | 10.9%(+12.5)#3,840 |
| 99. | Forestdale | 23.3% | 10.9%(+12.4)#99 | 10.9%(+12.4)#3,847 |
| 100. | Valley Grande | 22.7% | 10.9%(+11.8)#100 | 10.9%(+11.8)#4,002 |
Common Questions
What are the Top 10 Cities with the Highest Unemployment Rate Amomg Youth Under the Age of 25 in Alabama?
Top 10 Cities with the Highest Unemployment Rate Amomg Youth Under the Age of 25 in Alabama are:
#1
100.0%
#2
100.0%
#3
100.0%
#4
100.0%
#5
100.0%
#6
100.0%
#7
100.0%
#8
99.9%
#9
99.9%
#10
79.1%
What city has the Highest Unemployment Rate Amomg Youth Under the Age of 25 in Alabama?
McIntosh has the Highest Unemployment Rate Amomg Youth Under the Age of 25 in Alabama with 100.0%.
What is the Unemployment Rate Amomg Youth Under the Age of 25 in the State of Alabama?
Unemployment Rate Amomg Youth Under the Age of 25 in Alabama is 10.9%.
What is the Unemployment Rate Amomg Youth Under the Age of 25 in the United States?
Unemployment Rate Amomg Youth Under the Age of 25 in the United States is 10.9%.