Cities with the Highest Unemployment Rate Amomg Youth Under the Age of 25 in Oklahoma
RELATED REPORTS & OPTIONS
Highest Unemployment | Youth < 25
Oklahoma
Compare Cities
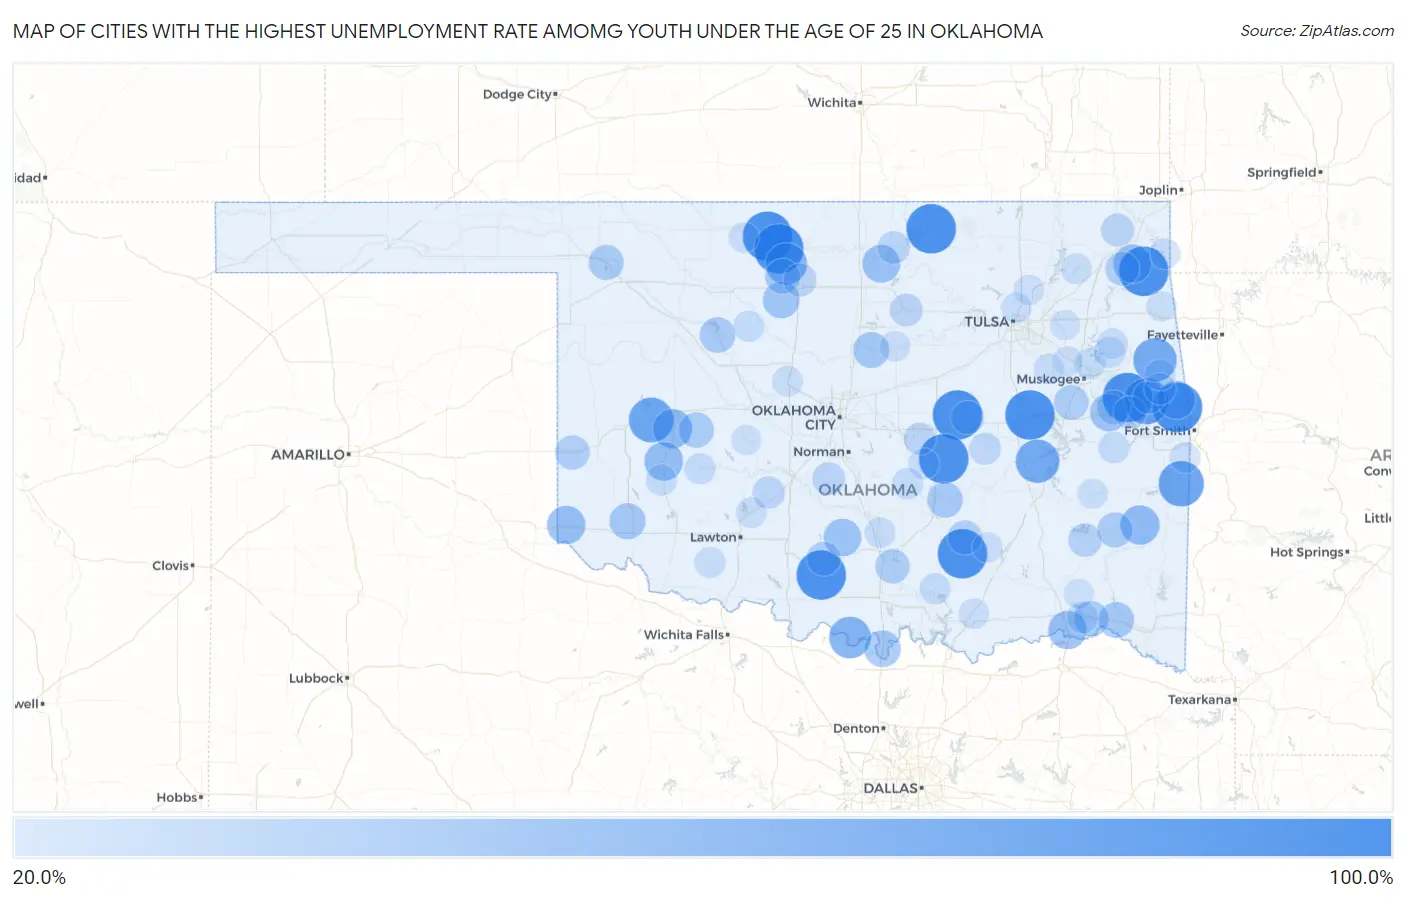
Map of Cities with the Highest Unemployment Rate Amomg Youth Under the Age of 25 in Oklahoma
0.0%
100.0%
Cities with the Highest Unemployment Rate Amomg Youth Under the Age of 25 in Oklahoma
| City | Youth Unemployment | vs State | vs National | |
| 1. | Belfonte | 100.0% | 9.4%(+90.6)#1 | 10.9%(+89.1)#18 |
| 2. | Cottonwood | 100.0% | 9.4%(+90.6)#2 | 10.9%(+89.1)#28 |
| 3. | Boley | 100.0% | 9.4%(+90.6)#3 | 10.9%(+89.1)#56 |
| 4. | Cumberland | 100.0% | 9.4%(+90.6)#4 | 10.9%(+89.1)#76 |
| 5. | Clarita | 100.0% | 9.4%(+90.6)#5 | 10.9%(+89.1)#200 |
| 6. | Zena | 100.0% | 9.4%(+90.6)#6 | 10.9%(+89.1)#206 |
| 7. | Enterprise | 100.0% | 9.4%(+90.6)#7 | 10.9%(+89.1)#231 |
| 8. | Nescatunga | 100.0% | 9.4%(+90.6)#8 | 10.9%(+89.1)#238 |
| 9. | Nash | 100.0% | 9.4%(+90.6)#9 | 10.9%(+89.1)#240 |
| 10. | Hoffman | 100.0% | 9.4%(+90.6)#10 | 10.9%(+89.1)#272 |
| 11. | Loco | 100.0% | 9.4%(+90.6)#11 | 10.9%(+89.1)#295 |
| 12. | Lima | 100.0% | 9.4%(+90.6)#12 | 10.9%(+89.1)#296 |
| 13. | Blackgum | 100.0% | 9.4%(+90.6)#13 | 10.9%(+89.1)#304 |
| 14. | Webb City | 100.0% | 9.4%(+90.6)#14 | 10.9%(+89.1)#306 |
| 15. | Marble City | 84.6% | 9.4%(+75.2)#15 | 10.9%(+73.7)#429 |
| 16. | Monroe | 82.6% | 9.4%(+73.2)#16 | 10.9%(+71.7)#441 |
| 17. | Foss | 79.9% | 9.4%(+70.5)#17 | 10.9%(+69.0)#462 |
| 18. | Indianola | 75.0% | 9.4%(+65.6)#18 | 10.9%(+64.1)#515 |
| 19. | Titanic | 74.9% | 9.4%(+65.5)#19 | 10.9%(+64.0)#519 |
| 20. | Leon | 66.7% | 9.4%(+57.3)#20 | 10.9%(+55.8)#634 |
| 21. | Hillsdale | 66.6% | 9.4%(+57.2)#21 | 10.9%(+55.7)#652 |
| 22. | Bessie | 57.1% | 9.4%(+47.7)#22 | 10.9%(+46.2)#856 |
| 23. | Whitesboro | 57.1% | 9.4%(+47.7)#23 | 10.9%(+46.2)#862 |
| 24. | Taylor Ferry | 55.5% | 9.4%(+46.1)#24 | 10.9%(+44.6)#899 |
| 25. | Rocky | 55.5% | 9.4%(+46.1)#25 | 10.9%(+44.6)#907 |
| 26. | Grant | 54.1% | 9.4%(+44.7)#26 | 10.9%(+43.2)#951 |
| 27. | Hollis | 53.6% | 9.4%(+44.2)#27 | 10.9%(+42.7)#969 |
| 28. | Cleora | 53.2% | 9.4%(+43.8)#28 | 10.9%(+42.3)#986 |
| 29. | Nicut | 52.9% | 9.4%(+43.5)#29 | 10.9%(+42.0)#999 |
| 30. | Marland | 51.1% | 9.4%(+41.7)#30 | 10.9%(+40.2)#1,056 |
| 31. | Webbers Falls | 50.0% | 9.4%(+40.6)#31 | 10.9%(+39.1)#1,102 |
| 32. | Foster | 50.0% | 9.4%(+40.6)#32 | 10.9%(+39.1)#1,112 |
| 33. | Peckham | 50.0% | 9.4%(+40.6)#33 | 10.9%(+39.1)#1,155 |
| 34. | Drummond | 46.6% | 9.4%(+37.2)#34 | 10.9%(+35.7)#1,284 |
| 35. | Thackerville | 46.2% | 9.4%(+36.8)#35 | 10.9%(+35.3)#1,295 |
| 36. | Martha | 44.4% | 9.4%(+35.0)#36 | 10.9%(+33.5)#1,400 |
| 37. | Coyle | 43.9% | 9.4%(+34.5)#37 | 10.9%(+33.0)#1,423 |
| 38. | Valliant | 42.8% | 9.4%(+33.4)#38 | 10.9%(+31.9)#1,503 |
| 39. | Francis | 42.4% | 9.4%(+33.0)#39 | 10.9%(+31.5)#1,543 |
| 40. | Canton | 42.1% | 9.4%(+32.7)#40 | 10.9%(+31.2)#1,555 |
| 41. | Corn | 41.1% | 9.4%(+31.7)#41 | 10.9%(+30.2)#1,634 |
| 42. | Fort Towson | 41.1% | 9.4%(+31.7)#42 | 10.9%(+30.2)#1,636 |
| 43. | Fort Supply | 40.4% | 9.4%(+31.0)#43 | 10.9%(+29.5)#1,672 |
| 44. | Carrier | 40.0% | 9.4%(+30.6)#44 | 10.9%(+29.1)#1,715 |
| 45. | Albion | 39.9% | 9.4%(+30.5)#45 | 10.9%(+29.0)#1,737 |
| 46. | Oktaha | 38.8% | 9.4%(+29.4)#46 | 10.9%(+27.9)#1,798 |
| 47. | Moodys | 37.7% | 9.4%(+28.3)#47 | 10.9%(+26.8)#1,874 |
| 48. | Erick | 37.5% | 9.4%(+28.1)#48 | 10.9%(+26.6)#1,886 |
| 49. | Dougherty | 37.4% | 9.4%(+28.0)#49 | 10.9%(+26.5)#1,912 |
| 50. | Tupelo | 36.7% | 9.4%(+27.3)#50 | 10.9%(+25.8)#1,960 |
| 51. | Gore | 36.3% | 9.4%(+26.9)#51 | 10.9%(+25.4)#1,978 |
| 52. | Velma | 36.3% | 9.4%(+26.9)#52 | 10.9%(+25.4)#1,981 |
| 53. | Ketchum | 36.1% | 9.4%(+26.7)#53 | 10.9%(+25.2)#2,007 |
| 54. | Clayton | 33.9% | 9.4%(+24.5)#54 | 10.9%(+23.0)#2,211 |
| 55. | Castle | 33.3% | 9.4%(+23.9)#55 | 10.9%(+22.4)#2,328 |
| 56. | North Enid | 31.8% | 9.4%(+22.4)#56 | 10.9%(+20.9)#2,471 |
| 57. | Bluejacket | 31.8% | 9.4%(+22.4)#57 | 10.9%(+20.9)#2,475 |
| 58. | Vian | 31.5% | 9.4%(+22.1)#58 | 10.9%(+20.6)#2,505 |
| 59. | Dibble | 31.0% | 9.4%(+21.6)#59 | 10.9%(+20.1)#2,568 |
| 60. | Glencoe | 30.7% | 9.4%(+21.3)#60 | 10.9%(+19.8)#2,602 |
| 61. | Mccord | 30.2% | 9.4%(+20.8)#61 | 10.9%(+19.3)#2,656 |
| 62. | Flute Springs | 30.0% | 9.4%(+20.6)#62 | 10.9%(+19.1)#2,686 |
| 63. | Cement | 29.4% | 9.4%(+20.0)#63 | 10.9%(+18.5)#2,770 |
| 64. | Earlsboro | 28.5% | 9.4%(+19.1)#64 | 10.9%(+17.6)#2,879 |
| 65. | Wetumka | 27.7% | 9.4%(+18.3)#65 | 10.9%(+16.8)#3,005 |
| 66. | Greasy | 26.9% | 9.4%(+17.5)#66 | 10.9%(+16.0)#3,141 |
| 67. | Sawyer | 26.0% | 9.4%(+16.6)#67 | 10.9%(+15.1)#3,312 |
| 68. | Stigler | 25.2% | 9.4%(+15.8)#68 | 10.9%(+14.3)#3,438 |
| 69. | Okeene | 25.0% | 9.4%(+15.6)#69 | 10.9%(+14.1)#3,468 |
| 70. | Mountain View | 25.0% | 9.4%(+15.6)#70 | 10.9%(+14.1)#3,479 |
| 71. | Asher | 25.0% | 9.4%(+15.6)#71 | 10.9%(+14.1)#3,483 |
| 72. | Okay | 25.0% | 9.4%(+15.6)#72 | 10.9%(+14.1)#3,486 |
| 73. | Golden | 25.0% | 9.4%(+15.6)#73 | 10.9%(+14.1)#3,516 |
| 74. | Hobart | 24.7% | 9.4%(+15.3)#74 | 10.9%(+13.8)#3,567 |
| 75. | Tishomingo | 24.7% | 9.4%(+15.3)#75 | 10.9%(+13.8)#3,570 |
| 76. | Hulbert | 24.4% | 9.4%(+15.0)#76 | 10.9%(+13.5)#3,633 |
| 77. | Chelsea | 23.9% | 9.4%(+14.5)#77 | 10.9%(+13.0)#3,717 |
| 78. | Chattanooga | 23.8% | 9.4%(+14.4)#78 | 10.9%(+12.9)#3,754 |
| 79. | Lyons Switch | 23.7% | 9.4%(+14.3)#79 | 10.9%(+12.8)#3,774 |
| 80. | Rock Island | 23.6% | 9.4%(+14.2)#80 | 10.9%(+12.7)#3,799 |
| 81. | Maud | 23.2% | 9.4%(+13.8)#81 | 10.9%(+12.3)#3,885 |
| 82. | Elgin | 23.0% | 9.4%(+13.6)#82 | 10.9%(+12.1)#3,918 |
| 83. | Okarche | 23.0% | 9.4%(+13.6)#83 | 10.9%(+12.1)#3,930 |
| 84. | Lost City | 23.0% | 9.4%(+13.6)#84 | 10.9%(+12.1)#3,934 |
| 85. | Cayuga | 23.0% | 9.4%(+13.6)#85 | 10.9%(+12.1)#3,953 |
| 86. | Wynnewood | 22.9% | 9.4%(+13.5)#86 | 10.9%(+12.0)#3,970 |
| 87. | Cherokee | 22.2% | 9.4%(+12.8)#87 | 10.9%(+11.3)#4,127 |
| 88. | Armstrong | 22.2% | 9.4%(+12.8)#88 | 10.9%(+11.3)#4,170 |
| 89. | Bentley | 22.2% | 9.4%(+12.8)#89 | 10.9%(+11.3)#4,174 |
| 90. | Haskell | 22.0% | 9.4%(+12.6)#90 | 10.9%(+11.1)#4,197 |
| 91. | Collinsville | 21.9% | 9.4%(+12.5)#91 | 10.9%(+11.0)#4,208 |
| 92. | Perkins | 21.8% | 9.4%(+12.4)#92 | 10.9%(+10.9)#4,226 |
| 93. | Turley | 21.5% | 9.4%(+12.1)#93 | 10.9%(+10.6)#4,305 |
| 94. | Colcord | 21.5% | 9.4%(+12.1)#94 | 10.9%(+10.6)#4,317 |
| 95. | Wilburton | 21.4% | 9.4%(+12.0)#95 | 10.9%(+10.5)#4,334 |
| 96. | Coalgate | 21.3% | 9.4%(+11.9)#96 | 10.9%(+10.4)#4,371 |
| 97. | Inola | 21.2% | 9.4%(+11.8)#97 | 10.9%(+10.3)#4,390 |
| 98. | Porter | 21.1% | 9.4%(+11.7)#98 | 10.9%(+10.2)#4,424 |
| 99. | Binger | 20.8% | 9.4%(+11.4)#99 | 10.9%(+9.90)#4,515 |
| 100. | Rattan | 20.6% | 9.4%(+11.2)#100 | 10.9%(+9.70)#4,556 |
Common Questions
What are the Top 10 Cities with the Highest Unemployment Rate Amomg Youth Under the Age of 25 in Oklahoma?
Top 10 Cities with the Highest Unemployment Rate Amomg Youth Under the Age of 25 in Oklahoma are:
What city has the Highest Unemployment Rate Amomg Youth Under the Age of 25 in Oklahoma?
Belfonte has the Highest Unemployment Rate Amomg Youth Under the Age of 25 in Oklahoma with 100.0%.
What is the Unemployment Rate Amomg Youth Under the Age of 25 in the State of Oklahoma?
Unemployment Rate Amomg Youth Under the Age of 25 in Oklahoma is 9.4%.
What is the Unemployment Rate Amomg Youth Under the Age of 25 in the United States?
Unemployment Rate Amomg Youth Under the Age of 25 in the United States is 10.9%.