Warm Springs, CA Map & Demographics
Warm Springs Map
Warm Springs Overview
$24,052
PER CAPITA INCOME
$57,582
AVG FAMILY INCOME
$70,750
AVG HOUSEHOLD INCOME
52.1%
WAGE / INCOME GAP [ % ]
47.9¢/ $1
WAGE / INCOME GAP [ $ ]
0.39
INEQUALITY / GINI INDEX
1,876
TOTAL POPULATION
949
MALE POPULATION
927
FEMALE POPULATION
102.37
MALES / 100 FEMALES
97.68
FEMALES / 100 MALES
33.0
MEDIAN AGE
3.9
AVG FAMILY SIZE
3.5
AVG HOUSEHOLD SIZE
778
LABOR FORCE [ PEOPLE ]
56.8%
PERCENT IN LABOR FORCE
12.3%
UNEMPLOYMENT RATE
Income in Warm Springs
Income Overview in Warm Springs
Per Capita Income in Warm Springs is $24,052, while median incomes of families and households are $57,582 and $70,750 respectively.
| Characteristic | Number | Measure |
| Per Capita Income | 1,876 | $24,052 |
| Median Family Income | 399 | $57,582 |
| Mean Family Income | 399 | $76,425 |
| Median Household Income | 543 | $70,750 |
| Mean Household Income | 543 | $83,563 |
| Income Deficit | 399 | $0 |
| Wage / Income Gap (%) | 1,876 | 52.14% |
| Wage / Income Gap ($) | 1,876 | 47.86¢ per $1 |
| Gini / Inequality Index | 1,876 | 0.39 |
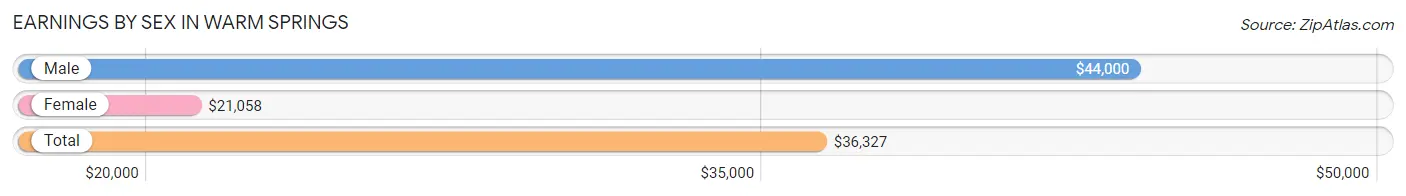
Earnings by Sex in Warm Springs
Average Earnings in Warm Springs are $36,327, $44,000 for men and $21,058 for women, a difference of 52.1%.
| Sex | Number | Average Earnings |
| Male | 446 (61.6%) | $44,000 |
| Female | 278 (38.4%) | $21,058 |
| Total | 724 (100.0%) | $36,327 |
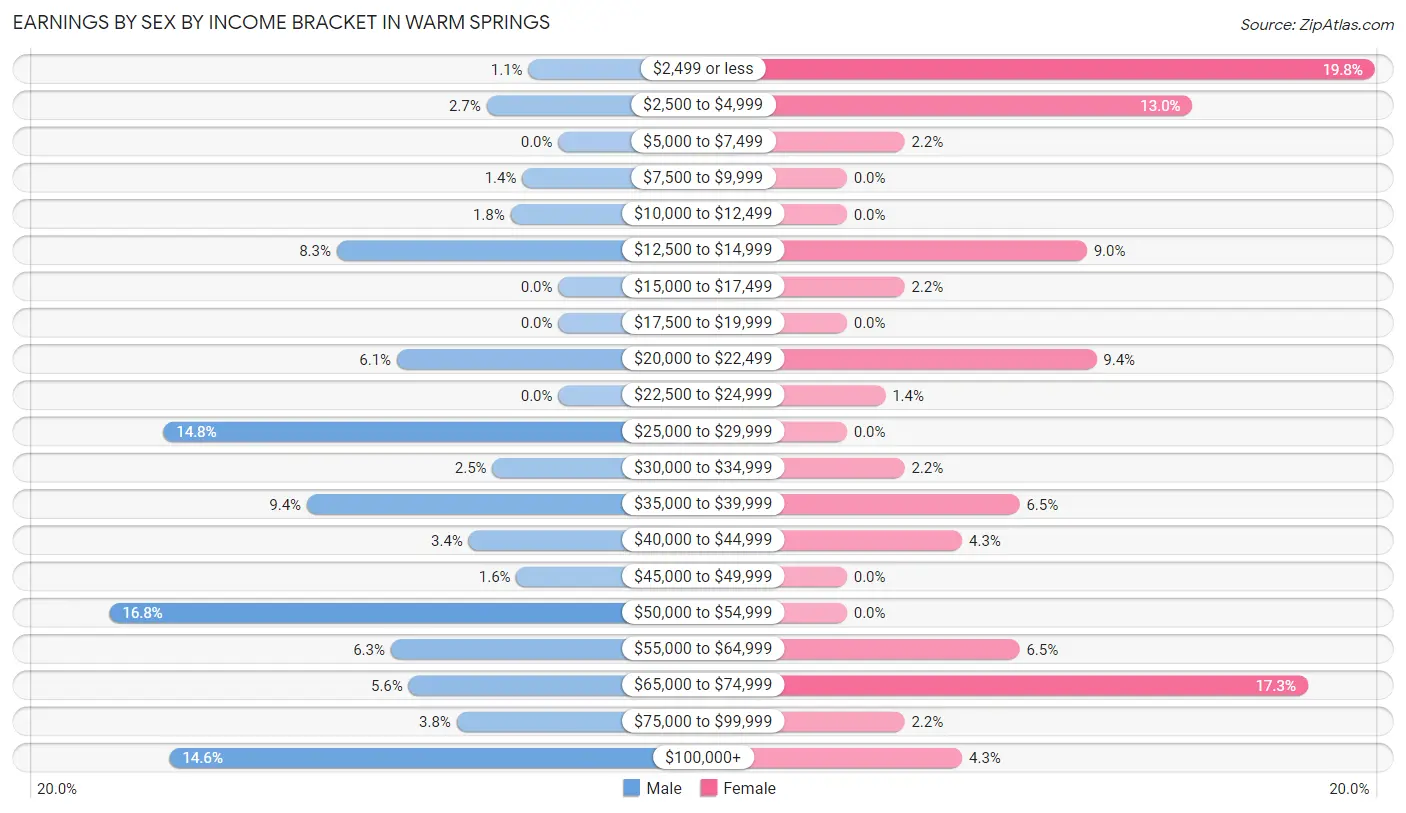
Earnings by Sex by Income Bracket in Warm Springs
The most common earnings brackets in Warm Springs are $50,000 to $54,999 for men (75 | 16.8%) and $2,499 or less for women (55 | 19.8%).
| Income | Male | Female |
| $2,499 or less | 5 (1.1%) | 55 (19.8%) |
| $2,500 to $4,999 | 12 (2.7%) | 36 (13.0%) |
| $5,000 to $7,499 | 0 (0.0%) | 6 (2.2%) |
| $7,500 to $9,999 | 6 (1.3%) | 0 (0.0%) |
| $10,000 to $12,499 | 8 (1.8%) | 0 (0.0%) |
| $12,500 to $14,999 | 37 (8.3%) | 25 (9.0%) |
| $15,000 to $17,499 | 0 (0.0%) | 6 (2.2%) |
| $17,500 to $19,999 | 0 (0.0%) | 0 (0.0%) |
| $20,000 to $22,499 | 27 (6.0%) | 26 (9.3%) |
| $22,500 to $24,999 | 0 (0.0%) | 4 (1.4%) |
| $25,000 to $29,999 | 66 (14.8%) | 0 (0.0%) |
| $30,000 to $34,999 | 11 (2.5%) | 6 (2.2%) |
| $35,000 to $39,999 | 42 (9.4%) | 18 (6.5%) |
| $40,000 to $44,999 | 15 (3.4%) | 12 (4.3%) |
| $45,000 to $49,999 | 7 (1.6%) | 0 (0.0%) |
| $50,000 to $54,999 | 75 (16.8%) | 0 (0.0%) |
| $55,000 to $64,999 | 28 (6.3%) | 18 (6.5%) |
| $65,000 to $74,999 | 25 (5.6%) | 48 (17.3%) |
| $75,000 to $99,999 | 17 (3.8%) | 6 (2.2%) |
| $100,000+ | 65 (14.6%) | 12 (4.3%) |
| Total | 446 (100.0%) | 278 (100.0%) |
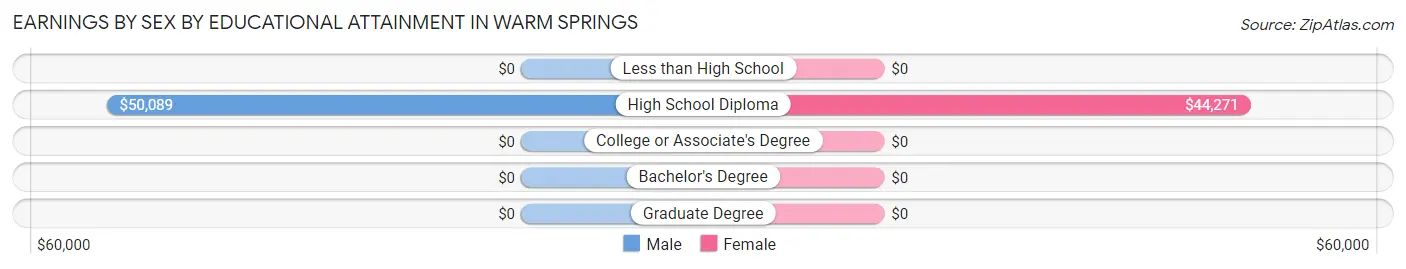
Earnings by Sex by Educational Attainment in Warm Springs
| Educational Attainment | Male Income | Female Income |
| Less than High School | - | - |
| High School Diploma | $50,089 | $44,271 |
| College or Associate's Degree | - | - |
| Bachelor's Degree | - | - |
| Graduate Degree | - | - |
| Total | $48,929 | $0 |
Family Income in Warm Springs
Family Income Brackets in Warm Springs
According to the Warm Springs family income data, there are 118 families falling into the $50,000 to $74,999 income range, which is the most common income bracket and makes up 29.6% of all families. Conversely, the $100,000 to $149,999 income bracket is the least frequent group with only 8 families (2.0%) belonging to this category.
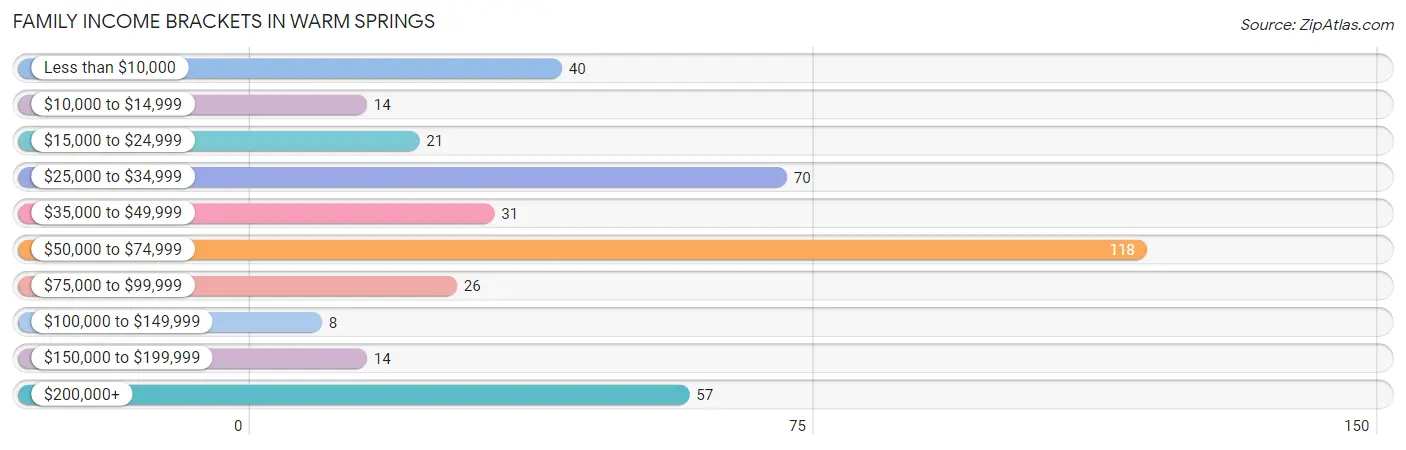
| Income Bracket | # Families | % Families |
| Less than $10,000 | 40 | 10.0% |
| $10,000 to $14,999 | 14 | 3.5% |
| $15,000 to $24,999 | 21 | 5.3% |
| $25,000 to $34,999 | 70 | 17.5% |
| $35,000 to $49,999 | 31 | 7.8% |
| $50,000 to $74,999 | 118 | 29.6% |
| $75,000 to $99,999 | 26 | 6.5% |
| $100,000 to $149,999 | 8 | 2.0% |
| $150,000 to $199,999 | 14 | 3.5% |
| $200,000+ | 57 | 14.3% |
Family Income by Famaliy Size in Warm Springs
3-person families (36 | 9.0%) account for the highest median family income in Warm Springs with $66,800 per family, while 2-person families (141 | 35.3%) have the highest median income of $28,791 per family member.
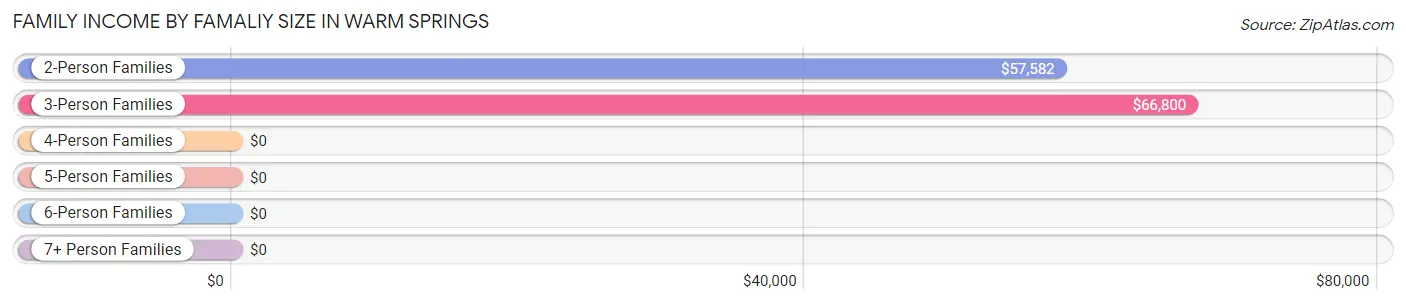
| Income Bracket | # Families | Median Income |
| 2-Person Families | 141 (35.3%) | $57,582 |
| 3-Person Families | 36 (9.0%) | $66,800 |
| 4-Person Families | 73 (18.3%) | $0 |
| 5-Person Families | 140 (35.1%) | $0 |
| 6-Person Families | 0 (0.0%) | $0 |
| 7+ Person Families | 9 (2.3%) | $0 |
| Total | 399 (100.0%) | $57,582 |
Family Income by Number of Earners in Warm Springs
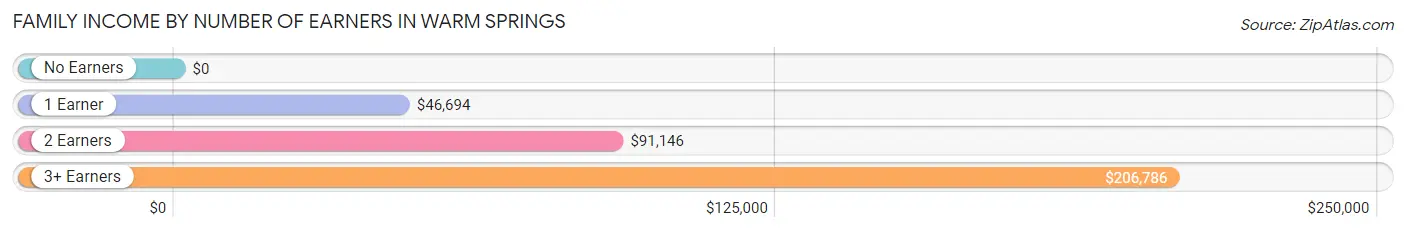
| Number of Earners | # Families | Median Income |
| No Earners | 82 (20.5%) | $0 |
| 1 Earner | 206 (51.6%) | $46,694 |
| 2 Earners | 37 (9.3%) | $91,146 |
| 3+ Earners | 74 (18.5%) | $206,786 |
| Total | 399 (100.0%) | $57,582 |
Household Income in Warm Springs
Household Income Brackets in Warm Springs
With 173 households falling in the category, the $50,000 to $74,999 income range is the most frequent in Warm Springs, accounting for 31.9% of all households. In contrast, only 9 households (1.7%) fall into the $25,000 to $34,999 income bracket, making it the least populous group.
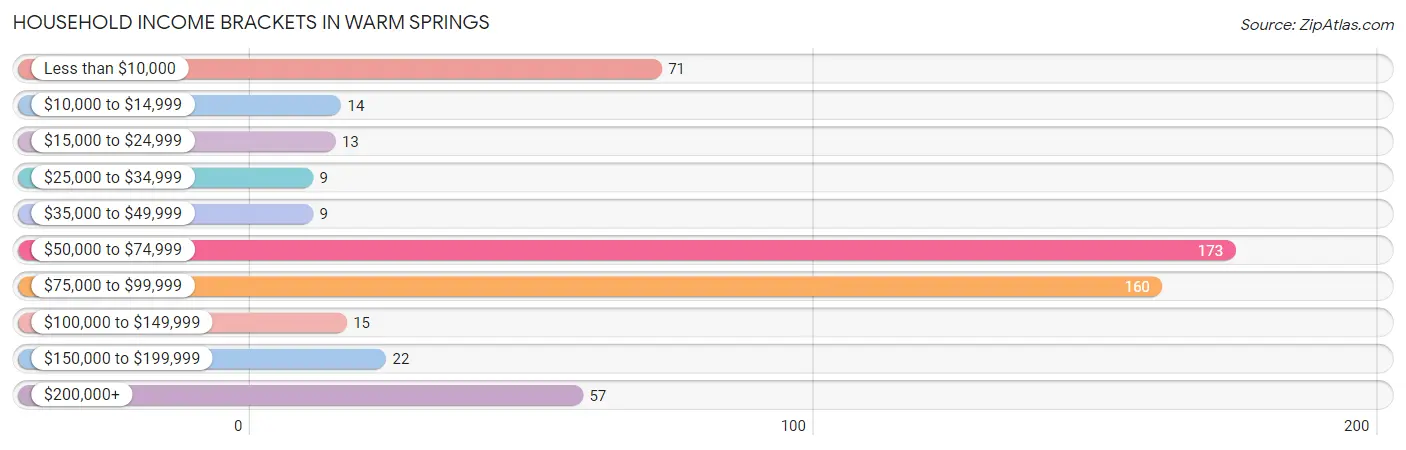
| Income Bracket | # Households | % Households |
| Less than $10,000 | 71 | 13.1% |
| $10,000 to $14,999 | 14 | 2.6% |
| $15,000 to $24,999 | 13 | 2.4% |
| $25,000 to $34,999 | 9 | 1.7% |
| $35,000 to $49,999 | 9 | 1.7% |
| $50,000 to $74,999 | 173 | 31.9% |
| $75,000 to $99,999 | 160 | 29.5% |
| $100,000 to $149,999 | 15 | 2.8% |
| $150,000 to $199,999 | 22 | 4.1% |
| $200,000+ | 57 | 10.5% |
Household Income by Householder Age in Warm Springs
The median household income in Warm Springs is $70,750, with the highest median household income of $85,903 found in the 65+ years age bracket for the primary householder. A total of 151 households (27.8%) fall into this category.
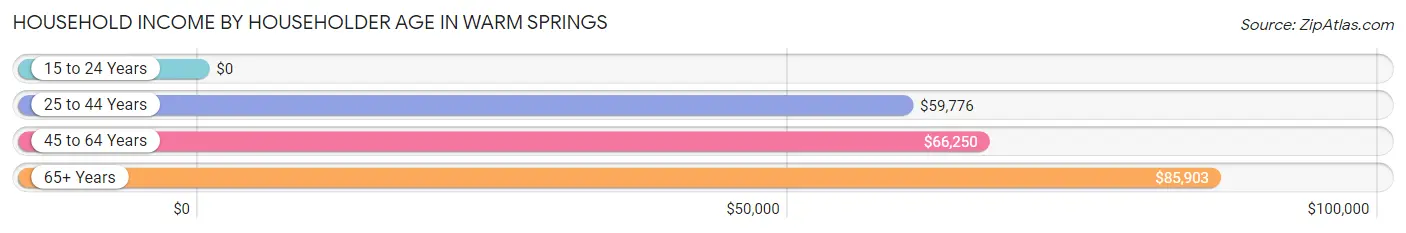
| Income Bracket | # Households | Median Income |
| 15 to 24 Years | 0 (0.0%) | $0 |
| 25 to 44 Years | 199 (36.6%) | $59,776 |
| 45 to 64 Years | 193 (35.5%) | $66,250 |
| 65+ Years | 151 (27.8%) | $85,903 |
| Total | 543 (100.0%) | $70,750 |
Poverty in Warm Springs
Income Below Poverty by Sex and Age in Warm Springs
With 33.7% poverty level for males and 28.5% for females among the residents of Warm Springs, under 5 year old males and under 5 year old females are the most vulnerable to poverty, with 58 males (69.9%) and 101 females (66.4%) in their respective age groups living below the poverty level.
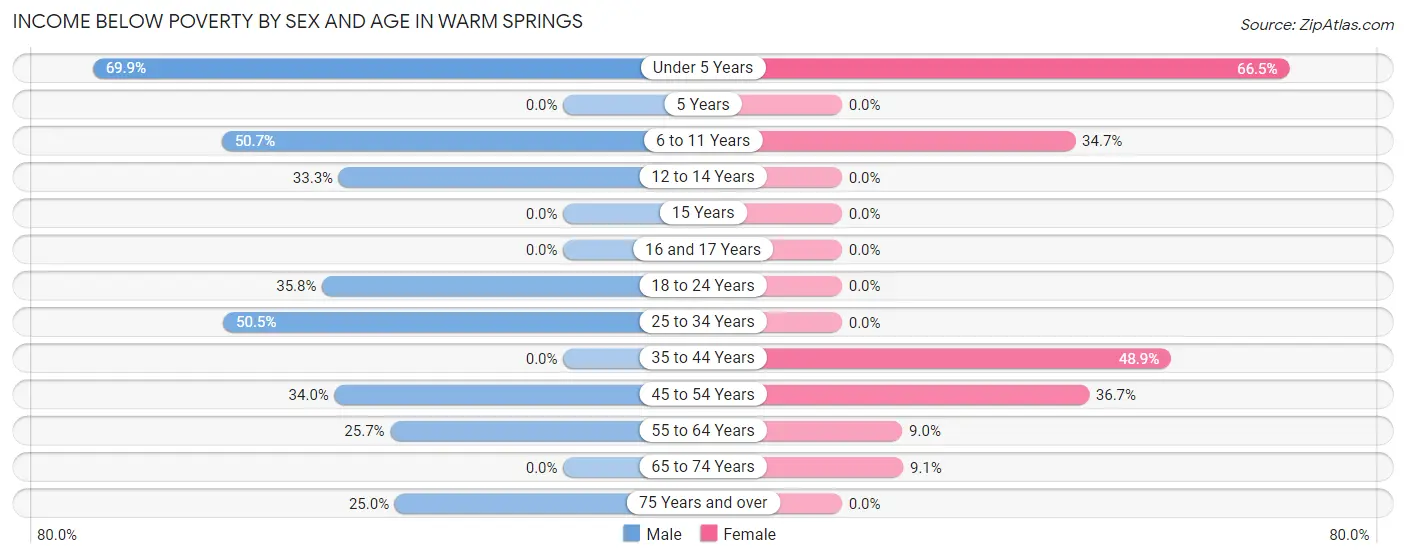
| Age Bracket | Male | Female |
| Under 5 Years | 58 (69.9%) | 101 (66.4%) |
| 5 Years | 0 (0.0%) | 0 (0.0%) |
| 6 to 11 Years | 35 (50.7%) | 35 (34.6%) |
| 12 to 14 Years | 34 (33.3%) | 0 (0.0%) |
| 15 Years | 0 (0.0%) | 0 (0.0%) |
| 16 and 17 Years | 0 (0.0%) | 0 (0.0%) |
| 18 to 24 Years | 34 (35.8%) | 0 (0.0%) |
| 25 to 34 Years | 96 (50.5%) | 0 (0.0%) |
| 35 to 44 Years | 0 (0.0%) | 66 (48.9%) |
| 45 to 54 Years | 18 (34.0%) | 51 (36.7%) |
| 55 to 64 Years | 38 (25.7%) | 6 (9.0%) |
| 65 to 74 Years | 0 (0.0%) | 5 (9.1%) |
| 75 Years and over | 7 (25.0%) | 0 (0.0%) |
| Total | 320 (33.7%) | 264 (28.5%) |
Income Above Poverty by Sex and Age in Warm Springs
According to the poverty statistics in Warm Springs, males aged 35 to 44 years and females aged 16 and 17 years are the age groups that are most secure financially, with 100.0% of males and 100.0% of females in these age groups living above the poverty line.
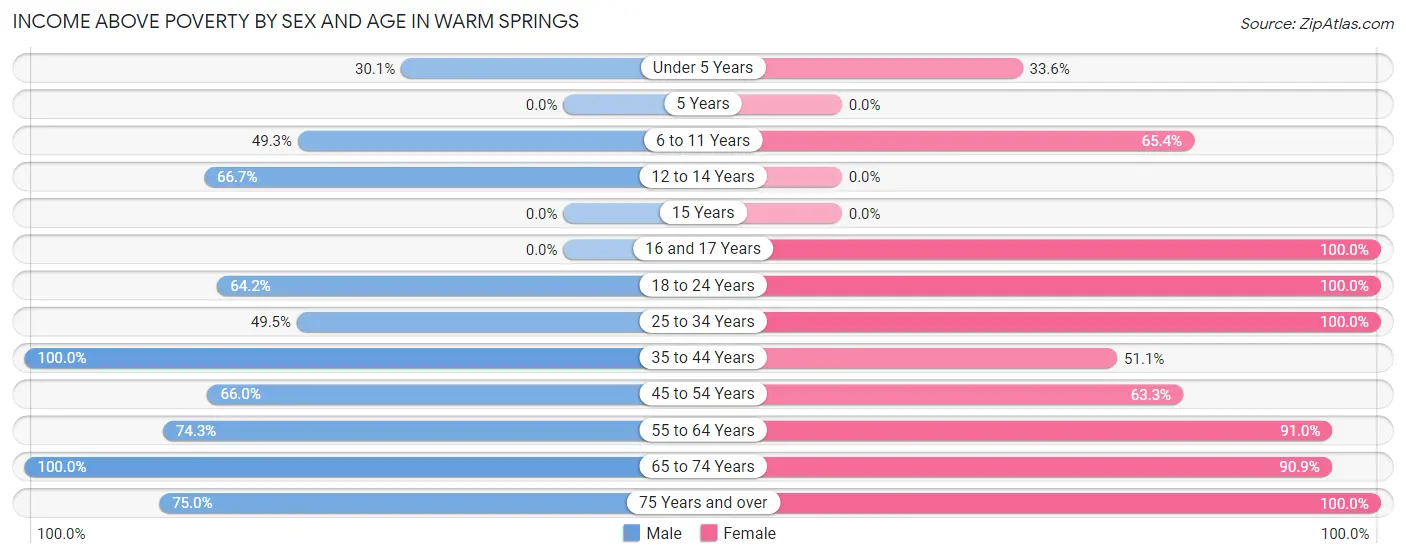
| Age Bracket | Male | Female |
| Under 5 Years | 25 (30.1%) | 51 (33.6%) |
| 5 Years | 0 (0.0%) | 0 (0.0%) |
| 6 to 11 Years | 34 (49.3%) | 66 (65.3%) |
| 12 to 14 Years | 68 (66.7%) | 0 (0.0%) |
| 15 Years | 0 (0.0%) | 0 (0.0%) |
| 16 and 17 Years | 0 (0.0%) | 12 (100.0%) |
| 18 to 24 Years | 61 (64.2%) | 37 (100.0%) |
| 25 to 34 Years | 94 (49.5%) | 135 (100.0%) |
| 35 to 44 Years | 129 (100.0%) | 69 (51.1%) |
| 45 to 54 Years | 35 (66.0%) | 88 (63.3%) |
| 55 to 64 Years | 110 (74.3%) | 61 (91.0%) |
| 65 to 74 Years | 52 (100.0%) | 50 (90.9%) |
| 75 Years and over | 21 (75.0%) | 94 (100.0%) |
| Total | 629 (66.3%) | 663 (71.5%) |
Income Below Poverty Among Married-Couple Families in Warm Springs
The poverty statistics for married-couple families in Warm Springs show that 12.9% or 28 of the total 217 families live below the poverty line. Families with no children have the highest poverty rate of 15.6%, comprising of 28 families. On the other hand, families with 1 or 2 children have the lowest poverty rate of 0.0%, which includes 0 families.
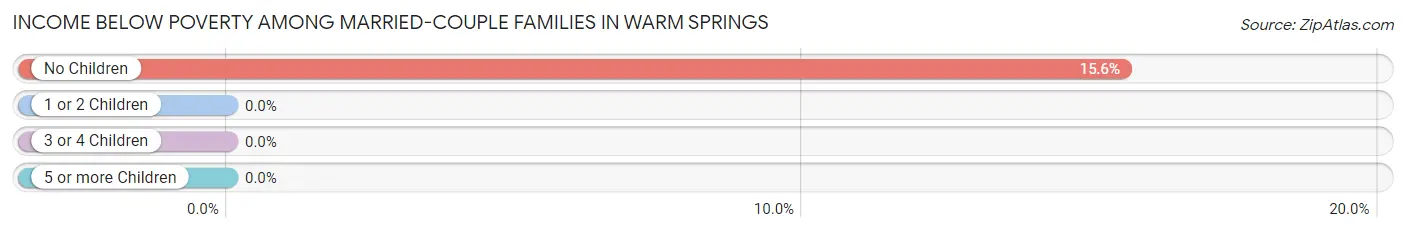
| Children | Above Poverty | Below Poverty |
| No Children | 152 (84.4%) | 28 (15.6%) |
| 1 or 2 Children | 37 (100.0%) | 0 (0.0%) |
| 3 or 4 Children | 0 (0.0%) | 0 (0.0%) |
| 5 or more Children | 0 (0.0%) | 0 (0.0%) |
| Total | 189 (87.1%) | 28 (12.9%) |
Income Below Poverty Among Single-Parent Households in Warm Springs
According to the poverty data in Warm Springs, 48.2% or 54 single-father households and 47.1% or 33 single-mother households are living below the poverty line. Among single-father households, those with 3 or 4 children have the highest poverty rate, with 54 households (63.5%) experiencing poverty. Likewise, among single-mother households, those with 3 or 4 children have the highest poverty rate, with 33 households (100.0%) falling below the poverty line.
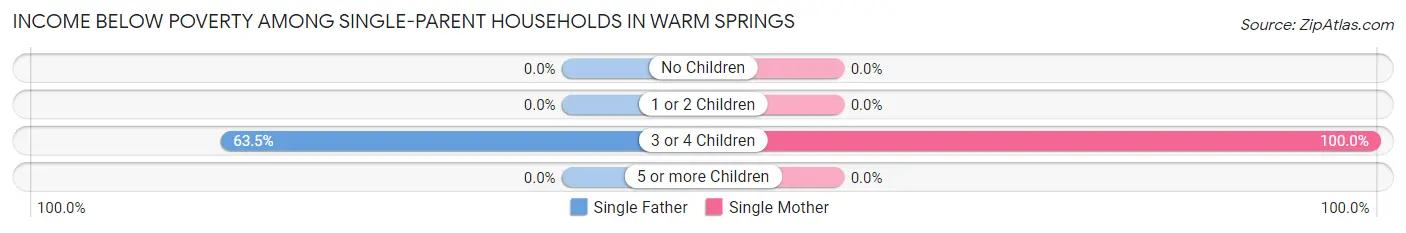
| Children | Single Father | Single Mother |
| No Children | 0 (0.0%) | 0 (0.0%) |
| 1 or 2 Children | 0 (0.0%) | 0 (0.0%) |
| 3 or 4 Children | 54 (63.5%) | 33 (100.0%) |
| 5 or more Children | 0 (0.0%) | 0 (0.0%) |
| Total | 54 (48.2%) | 33 (47.1%) |
Income Below Poverty Among Married-Couple vs Single-Parent Households in Warm Springs
The poverty data for Warm Springs shows that 28 of the married-couple family households (12.9%) and 87 of the single-parent households (47.8%) are living below the poverty level. Within the married-couple family households, those with no children have the highest poverty rate, with 28 households (15.6%) falling below the poverty line. Among the single-parent households, those with 3 or 4 children have the highest poverty rate, with 87 household (73.7%) living below poverty.
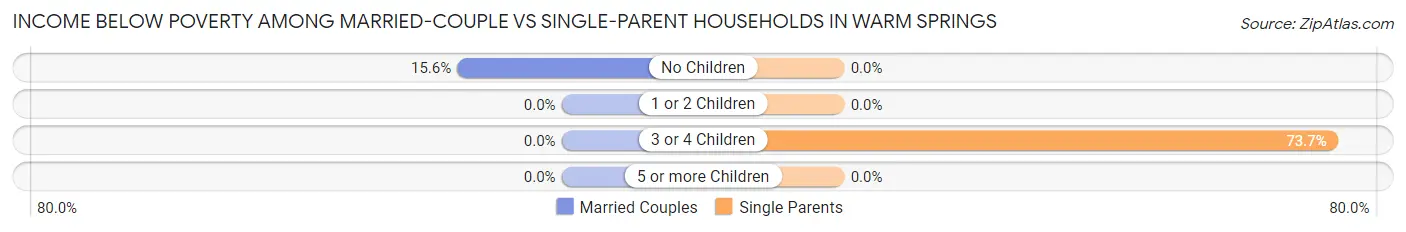
| Children | Married-Couple Families | Single-Parent Households |
| No Children | 28 (15.6%) | 0 (0.0%) |
| 1 or 2 Children | 0 (0.0%) | 0 (0.0%) |
| 3 or 4 Children | 0 (0.0%) | 87 (73.7%) |
| 5 or more Children | 0 (0.0%) | 0 (0.0%) |
| Total | 28 (12.9%) | 87 (47.8%) |
Race in Warm Springs
The most populous races in Warm Springs are Hispanic or Latino (1,223 | 65.2%), White / Caucasian (752 | 40.1%), and Some other Race (684 | 36.5%).
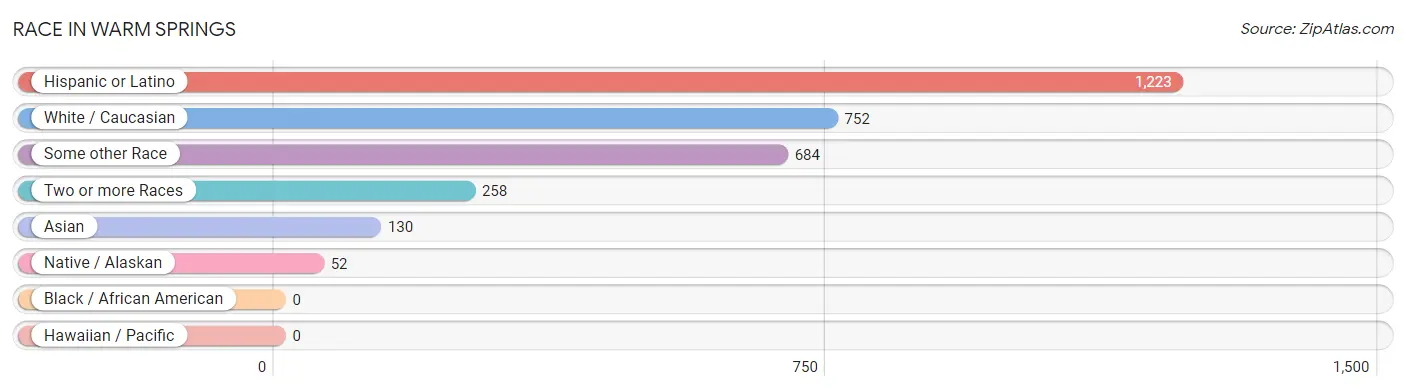
| Race | # Population | % Population |
| Asian | 130 | 6.9% |
| Black / African American | 0 | 0.0% |
| Hawaiian / Pacific | 0 | 0.0% |
| Hispanic or Latino | 1,223 | 65.2% |
| Native / Alaskan | 52 | 2.8% |
| White / Caucasian | 752 | 40.1% |
| Two or more Races | 258 | 13.8% |
| Some other Race | 684 | 36.5% |
| Total | 1,876 | 100.0% |
Ancestry in Warm Springs
The most populous ancestries reported in Warm Springs are Mexican (1,044 | 55.6%), German (163 | 8.7%), Spanish (121 | 6.5%), Korean (106 | 5.7%), and Hungarian (73 | 3.9%), together accounting for 80.3% of all Warm Springs residents.
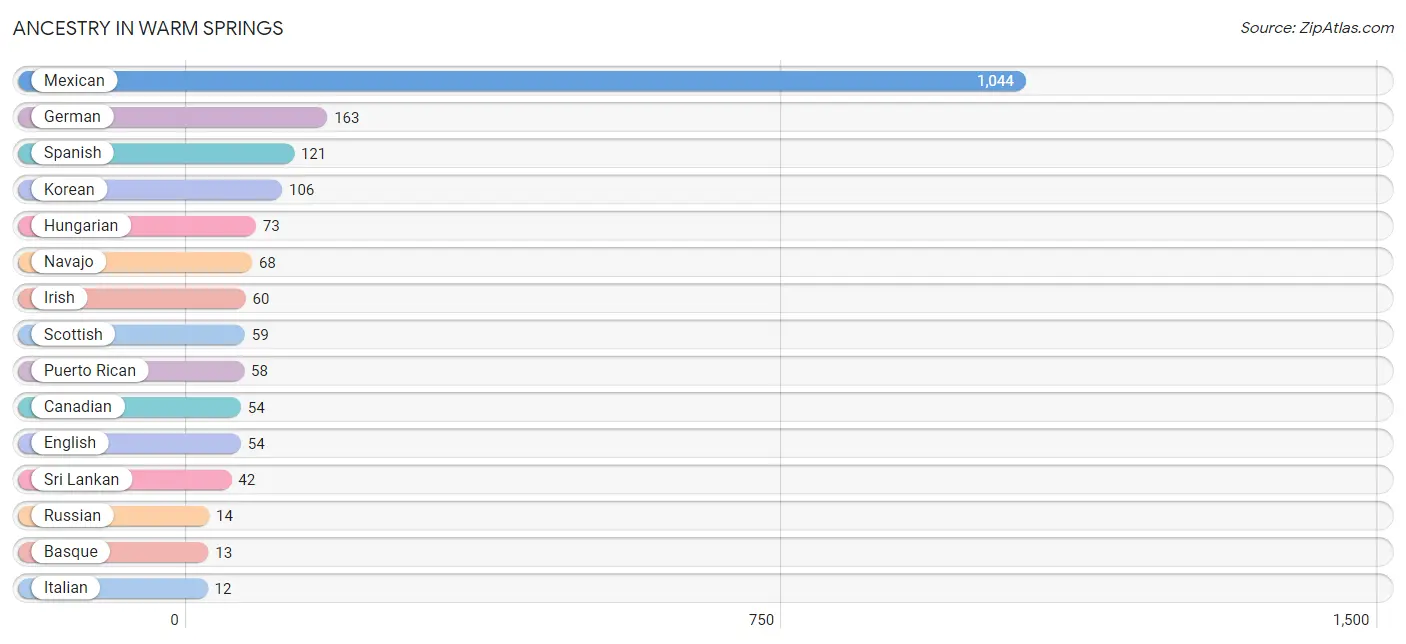
| Ancestry | # Population | % Population |
| American | 6 | 0.3% |
| Basque | 13 | 0.7% |
| Canadian | 54 | 2.9% |
| Dutch | 11 | 0.6% |
| English | 54 | 2.9% |
| German | 163 | 8.7% |
| Hungarian | 73 | 3.9% |
| Irish | 60 | 3.2% |
| Italian | 12 | 0.6% |
| Korean | 106 | 5.7% |
| Mexican | 1,044 | 55.6% |
| Navajo | 68 | 3.6% |
| Puerto Rican | 58 | 3.1% |
| Russian | 14 | 0.7% |
| Scottish | 59 | 3.1% |
| Spanish | 121 | 6.5% |
| Sri Lankan | 42 | 2.2% | View All 17 Rows |
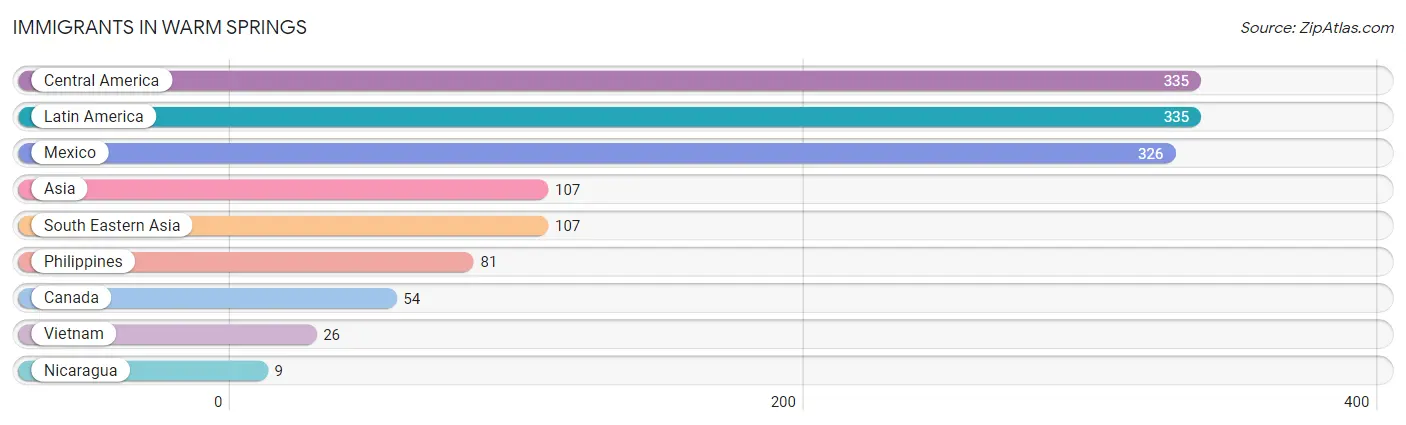
Immigrants in Warm Springs
The most numerous immigrant groups reported in Warm Springs came from Central America (335 | 17.9%), Latin America (335 | 17.9%), Mexico (326 | 17.4%), Asia (107 | 5.7%), and South Eastern Asia (107 | 5.7%), together accounting for 64.5% of all Warm Springs residents.
| Immigration Origin | # Population | % Population |
| Asia | 107 | 5.7% |
| Canada | 54 | 2.9% |
| Central America | 335 | 17.9% |
| Latin America | 335 | 17.9% |
| Mexico | 326 | 17.4% |
| Nicaragua | 9 | 0.5% |
| Philippines | 81 | 4.3% |
| South Eastern Asia | 107 | 5.7% |
| Vietnam | 26 | 1.4% | View All 9 Rows |
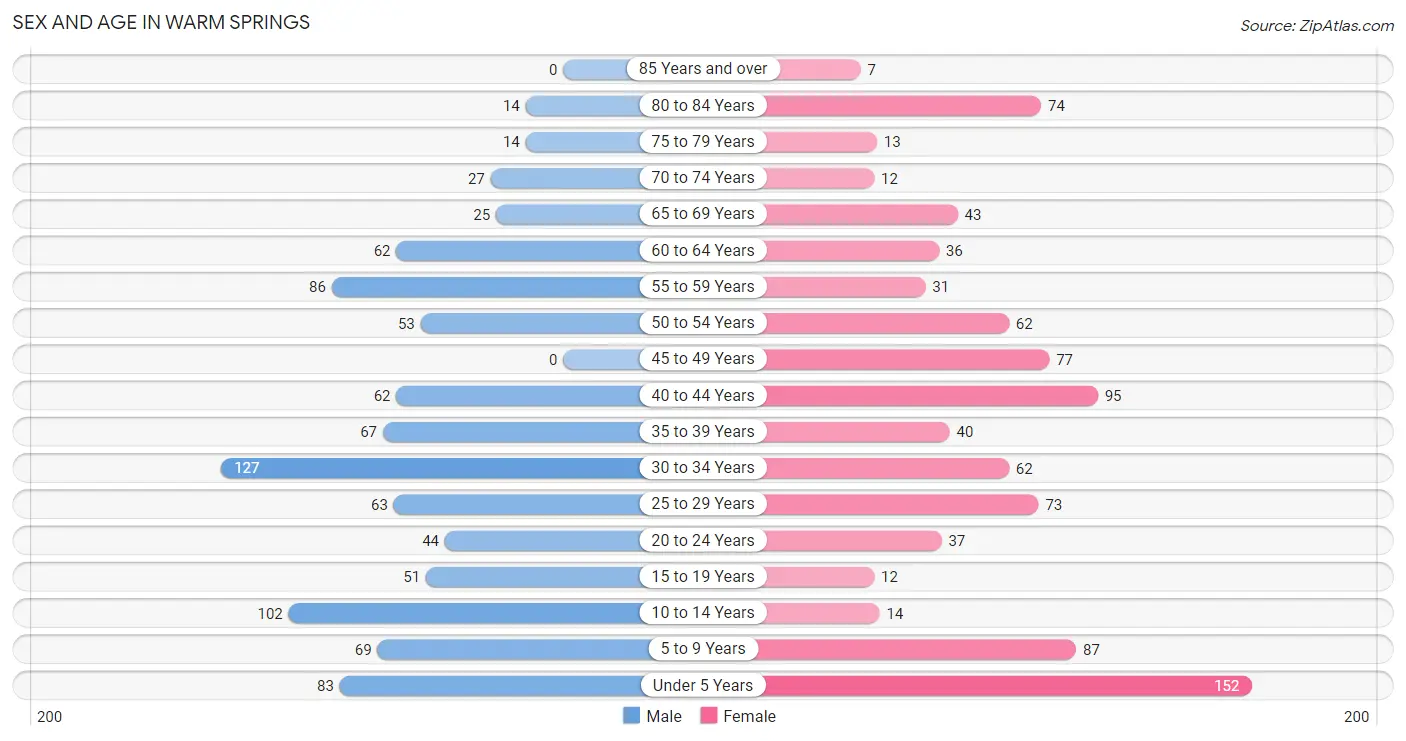
Sex and Age in Warm Springs
Sex and Age in Warm Springs
The most populous age groups in Warm Springs are 30 to 34 Years (127 | 13.4%) for men and Under 5 Years (152 | 16.4%) for women.
| Age Bracket | Male | Female |
| Under 5 Years | 83 (8.7%) | 152 (16.4%) |
| 5 to 9 Years | 69 (7.3%) | 87 (9.4%) |
| 10 to 14 Years | 102 (10.7%) | 14 (1.5%) |
| 15 to 19 Years | 51 (5.4%) | 12 (1.3%) |
| 20 to 24 Years | 44 (4.6%) | 37 (4.0%) |
| 25 to 29 Years | 63 (6.6%) | 73 (7.9%) |
| 30 to 34 Years | 127 (13.4%) | 62 (6.7%) |
| 35 to 39 Years | 67 (7.1%) | 40 (4.3%) |
| 40 to 44 Years | 62 (6.5%) | 95 (10.2%) |
| 45 to 49 Years | 0 (0.0%) | 77 (8.3%) |
| 50 to 54 Years | 53 (5.6%) | 62 (6.7%) |
| 55 to 59 Years | 86 (9.1%) | 31 (3.3%) |
| 60 to 64 Years | 62 (6.5%) | 36 (3.9%) |
| 65 to 69 Years | 25 (2.6%) | 43 (4.6%) |
| 70 to 74 Years | 27 (2.9%) | 12 (1.3%) |
| 75 to 79 Years | 14 (1.5%) | 13 (1.4%) |
| 80 to 84 Years | 14 (1.5%) | 74 (8.0%) |
| 85 Years and over | 0 (0.0%) | 7 (0.8%) |
| Total | 949 (100.0%) | 927 (100.0%) |
Families and Households in Warm Springs
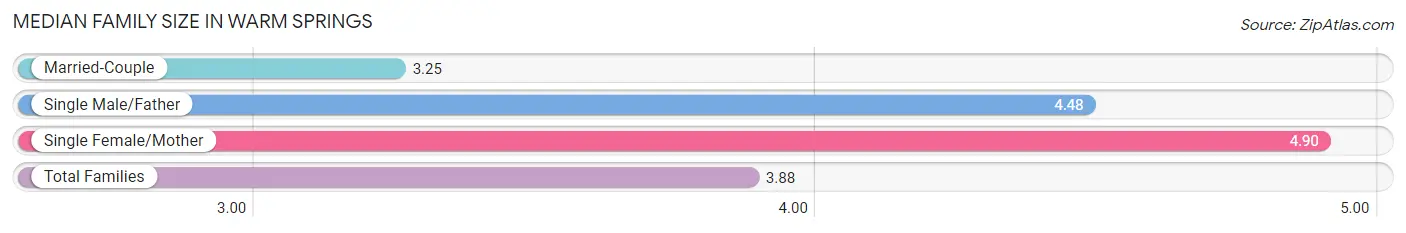
Median Family Size in Warm Springs
The median family size in Warm Springs is 3.88 persons per family, with single female/mother families (70 | 17.5%) accounting for the largest median family size of 4.9 persons per family. On the other hand, married-couple families (217 | 54.4%) represent the smallest median family size with 3.25 persons per family.
| Family Type | # Families | Family Size |
| Married-Couple | 217 (54.4%) | 3.25 |
| Single Male/Father | 112 (28.1%) | 4.48 |
| Single Female/Mother | 70 (17.5%) | 4.90 |
| Total Families | 399 (100.0%) | 3.88 |
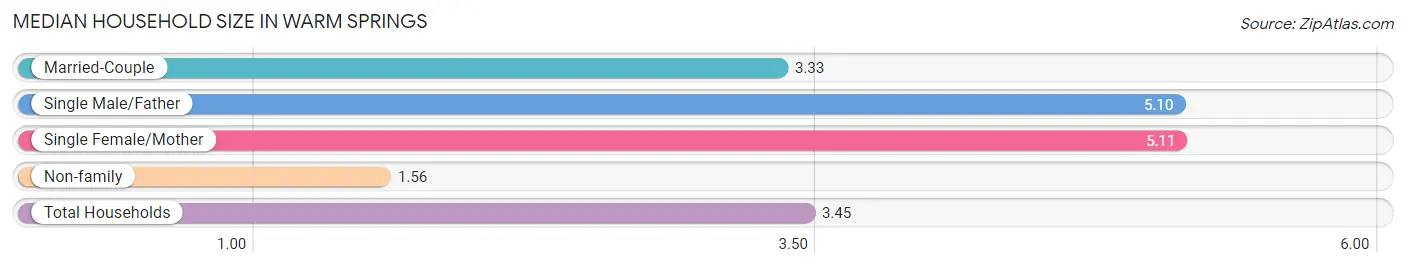
Median Household Size in Warm Springs
The median household size in Warm Springs is 3.45 persons per household, with single female/mother households (70 | 12.9%) accounting for the largest median household size of 5.11 persons per household. non-family households (144 | 26.5%) represent the smallest median household size with 1.56 persons per household.
| Household Type | # Households | Household Size |
| Married-Couple | 217 (40.0%) | 3.33 |
| Single Male/Father | 112 (20.6%) | 5.10 |
| Single Female/Mother | 70 (12.9%) | 5.11 |
| Non-family | 144 (26.5%) | 1.56 |
| Total Households | 543 (100.0%) | 3.45 |
Household Size by Marriage Status in Warm Springs
Out of a total of 543 households in Warm Springs, 399 (73.5%) are family households, while 144 (26.5%) are nonfamily households. The most numerous type of family households are 5-person households, comprising 170, and the most common type of nonfamily households are 1-person households, comprising 106.
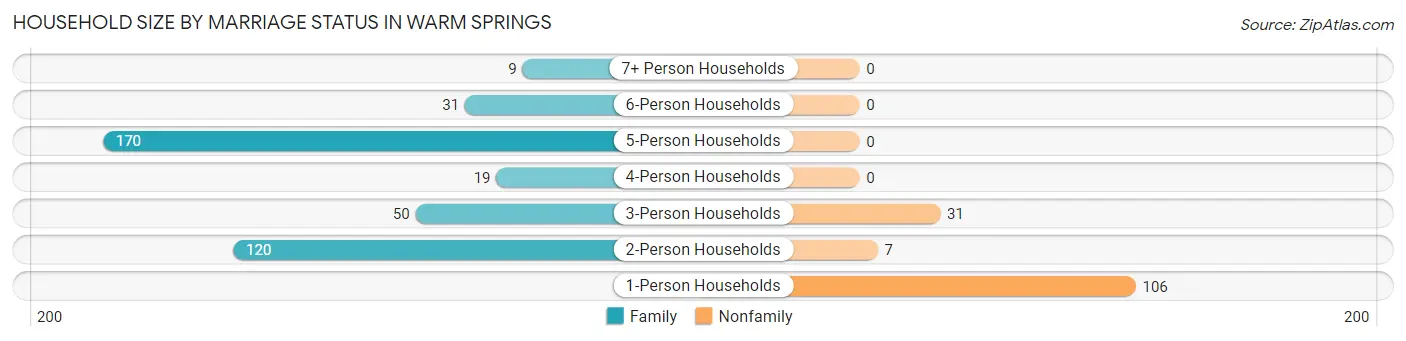
| Household Size | Family Households | Nonfamily Households |
| 1-Person Households | - | 106 (19.5%) |
| 2-Person Households | 120 (22.1%) | 7 (1.3%) |
| 3-Person Households | 50 (9.2%) | 31 (5.7%) |
| 4-Person Households | 19 (3.5%) | 0 (0.0%) |
| 5-Person Households | 170 (31.3%) | 0 (0.0%) |
| 6-Person Households | 31 (5.7%) | 0 (0.0%) |
| 7+ Person Households | 9 (1.7%) | 0 (0.0%) |
| Total | 399 (73.5%) | 144 (26.5%) |
Female Fertility in Warm Springs
Fertility by Age in Warm Springs
Average fertility rate in Warm Springs is 63.0 births per 1,000 women. Women in the age bracket of 20 to 34 years have the highest fertility rate with 145.0 births per 1,000 women. Women in the age bracket of 20 to 34 years acount for 100.0% of all women with births.
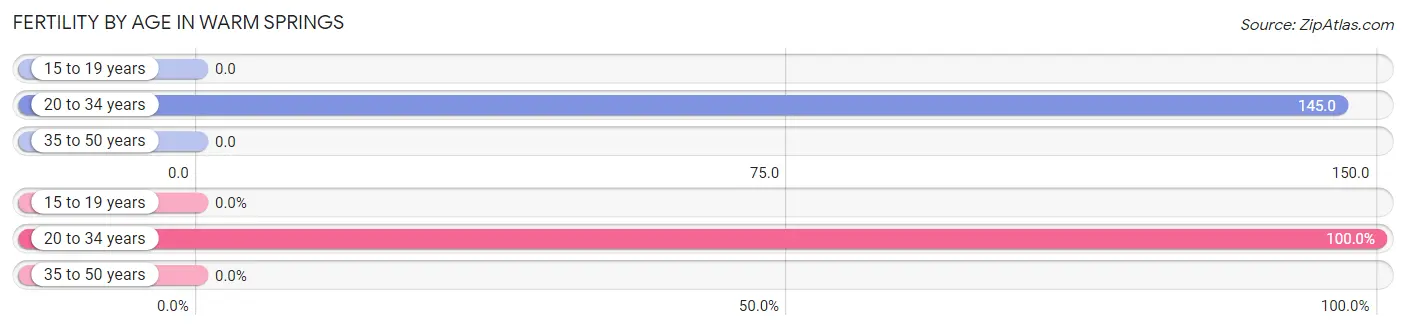
| Age Bracket | Women with Births | Births / 1,000 Women |
| 15 to 19 years | 0 (0.0%) | 0.0 |
| 20 to 34 years | 25 (100.0%) | 145.0 |
| 35 to 50 years | 0 (0.0%) | 0.0 |
| Total | 25 (100.0%) | 63.0 |
Fertility by Age by Marriage Status in Warm Springs
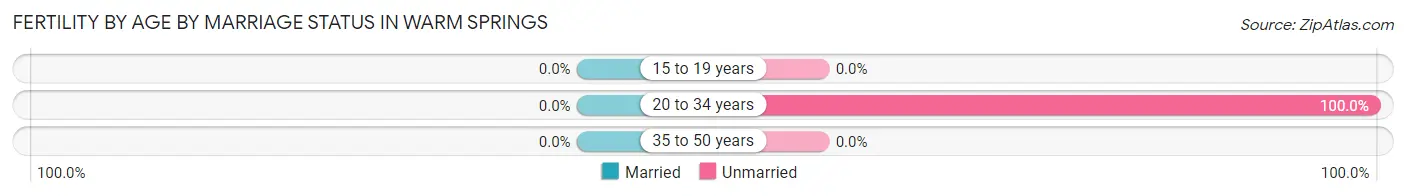
| Age Bracket | Married | Unmarried |
| 15 to 19 years | 0 (0.0%) | 0 (0.0%) |
| 20 to 34 years | 0 (0.0%) | 25 (100.0%) |
| 35 to 50 years | 0 (0.0%) | 0 (0.0%) |
| Total | 0 (0.0%) | 25 (100.0%) |
Fertility by Education in Warm Springs
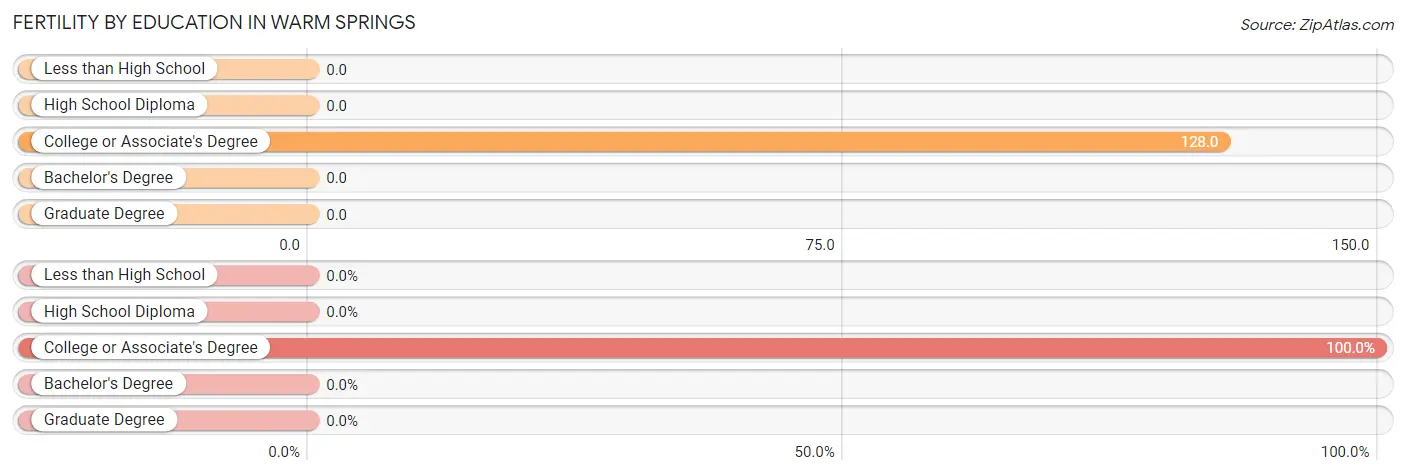
| Educational Attainment | Women with Births | Births / 1,000 Women |
| Less than High School | 0 (0.0%) | 0.0 |
| High School Diploma | 0 (0.0%) | 0.0 |
| College or Associate's Degree | 25 (100.0%) | 128.0 |
| Bachelor's Degree | 0 (0.0%) | 0.0 |
| Graduate Degree | 0 (0.0%) | 0.0 |
| Total | 25 (100.0%) | 63.0 |
Fertility by Education by Marriage Status in Warm Springs
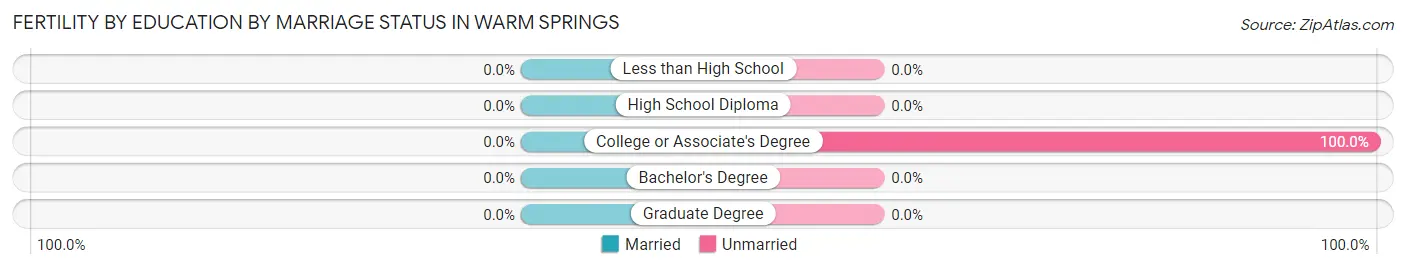
| Educational Attainment | Married | Unmarried |
| Less than High School | 0 (0.0%) | 0 (0.0%) |
| High School Diploma | 0 (0.0%) | 0 (0.0%) |
| College or Associate's Degree | 0 (0.0%) | 25 (100.0%) |
| Bachelor's Degree | 0 (0.0%) | 0 (0.0%) |
| Graduate Degree | 0 (0.0%) | 0 (0.0%) |
| Total | 0 (0.0%) | 25 (100.0%) |
Employment Characteristics in Warm Springs
Employment by Class of Employer in Warm Springs
Among the 682 employed individuals in Warm Springs, private company employees (492 | 72.1%), local government employees (69 | 10.1%), and not-for-profit organizations (48 | 7.0%) make up the most common classes of employment.
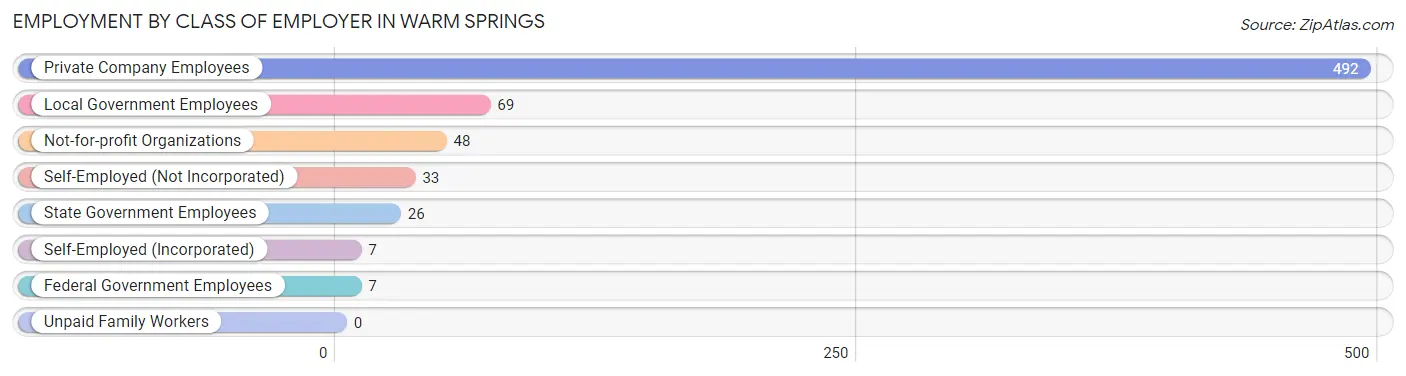
| Employer Class | # Employees | % Employees |
| Private Company Employees | 492 | 72.1% |
| Self-Employed (Incorporated) | 7 | 1.0% |
| Self-Employed (Not Incorporated) | 33 | 4.8% |
| Not-for-profit Organizations | 48 | 7.0% |
| Local Government Employees | 69 | 10.1% |
| State Government Employees | 26 | 3.8% |
| Federal Government Employees | 7 | 1.0% |
| Unpaid Family Workers | 0 | 0.0% |
| Total | 682 | 100.0% |
Employment Status by Age in Warm Springs
According to the labor force statistics for Warm Springs, out of the total population over 16 years of age (1,369), 56.8% or 778 individuals are in the labor force, with 12.3% or 96 of them unemployed. The age group with the highest labor force participation rate is 20 to 24 years, with 100.0% or 81 individuals in the labor force. Within the labor force, the 20 to 24 years age range has the highest percentage of unemployed individuals, with 40.7% or 33 of them being unemployed.
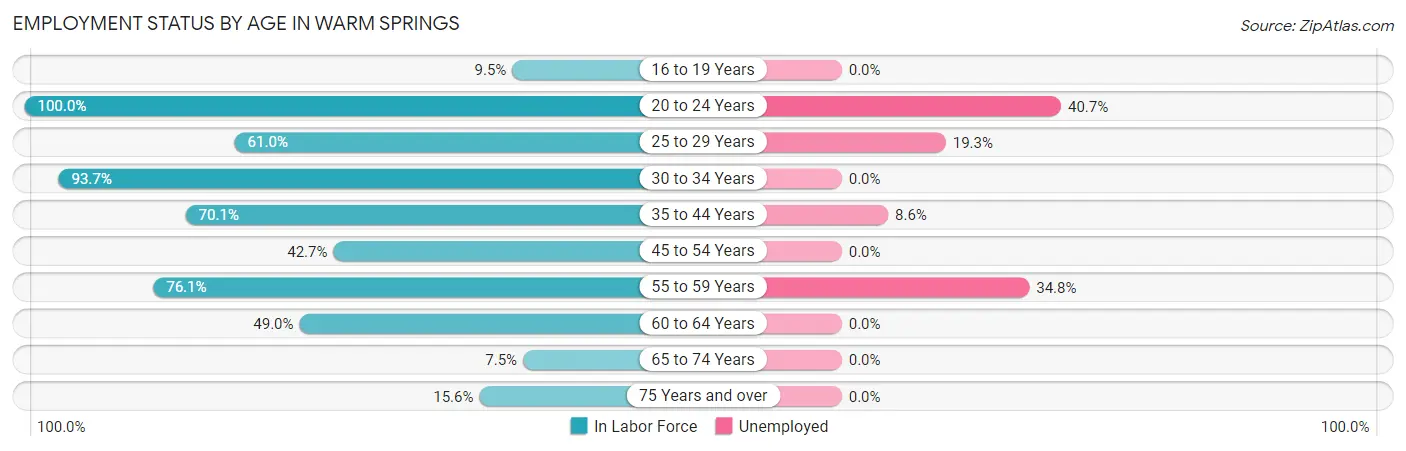
| Age Bracket | In Labor Force | Unemployed |
| 16 to 19 Years | 6 (9.5%) | 0 (0.0%) |
| 20 to 24 Years | 81 (100.0%) | 33 (40.7%) |
| 25 to 29 Years | 83 (61.0%) | 16 (19.3%) |
| 30 to 34 Years | 177 (93.7%) | 0 (0.0%) |
| 35 to 44 Years | 185 (70.1%) | 16 (8.6%) |
| 45 to 54 Years | 82 (42.7%) | 0 (0.0%) |
| 55 to 59 Years | 89 (76.1%) | 31 (34.8%) |
| 60 to 64 Years | 48 (49.0%) | 0 (0.0%) |
| 65 to 74 Years | 8 (7.5%) | 0 (0.0%) |
| 75 Years and over | 19 (15.6%) | 0 (0.0%) |
| Total | 778 (56.8%) | 96 (12.3%) |
Employment Status by Educational Attainment in Warm Springs
According to labor force statistics for Warm Springs, 66.7% of individuals (664) out of the total population between 25 and 64 years of age (996) are in the labor force, with 9.5% or 63 of them being unemployed. The group with the highest labor force participation rate are those with the educational attainment of bachelor's degree or higher, with 70.0% or 35 individuals in the labor force. Within the labor force, individuals with high school diploma education have the highest percentage of unemployment, with 18.7% or 47 of them being unemployed.
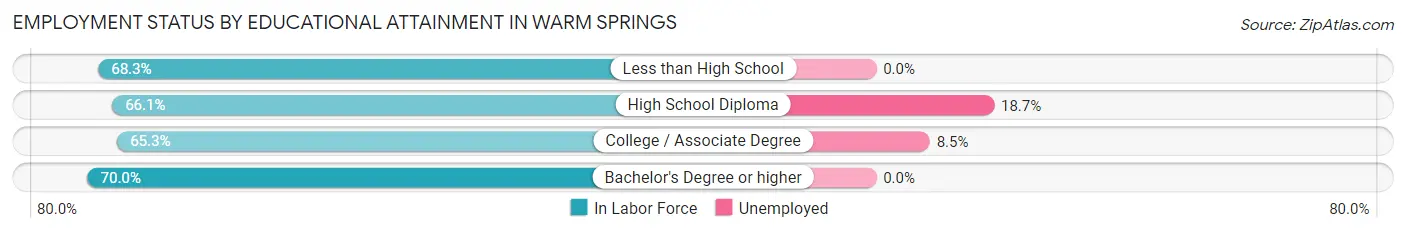
| Educational Attainment | In Labor Force | Unemployed |
| Less than High School | 190 (68.3%) | 0 (0.0%) |
| High School Diploma | 251 (66.1%) | 71 (18.7%) |
| College / Associate Degree | 188 (65.3%) | 24 (8.5%) |
| Bachelor's Degree or higher | 35 (70.0%) | 0 (0.0%) |
| Total | 664 (66.7%) | 95 (9.5%) |
Employment Occupations by Sex in Warm Springs
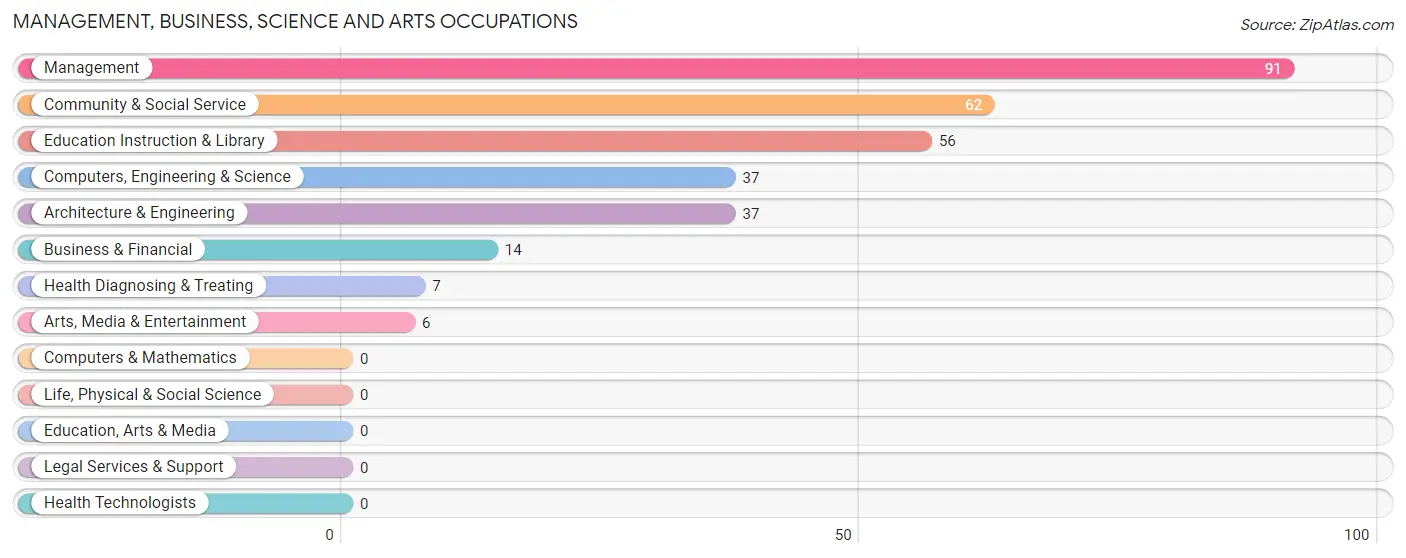
Management, Business, Science and Arts Occupations
The most common Management, Business, Science and Arts occupations in Warm Springs are Management (91 | 13.3%), Community & Social Service (62 | 9.1%), Education Instruction & Library (56 | 8.2%), Computers, Engineering & Science (37 | 5.4%), and Architecture & Engineering (37 | 5.4%).
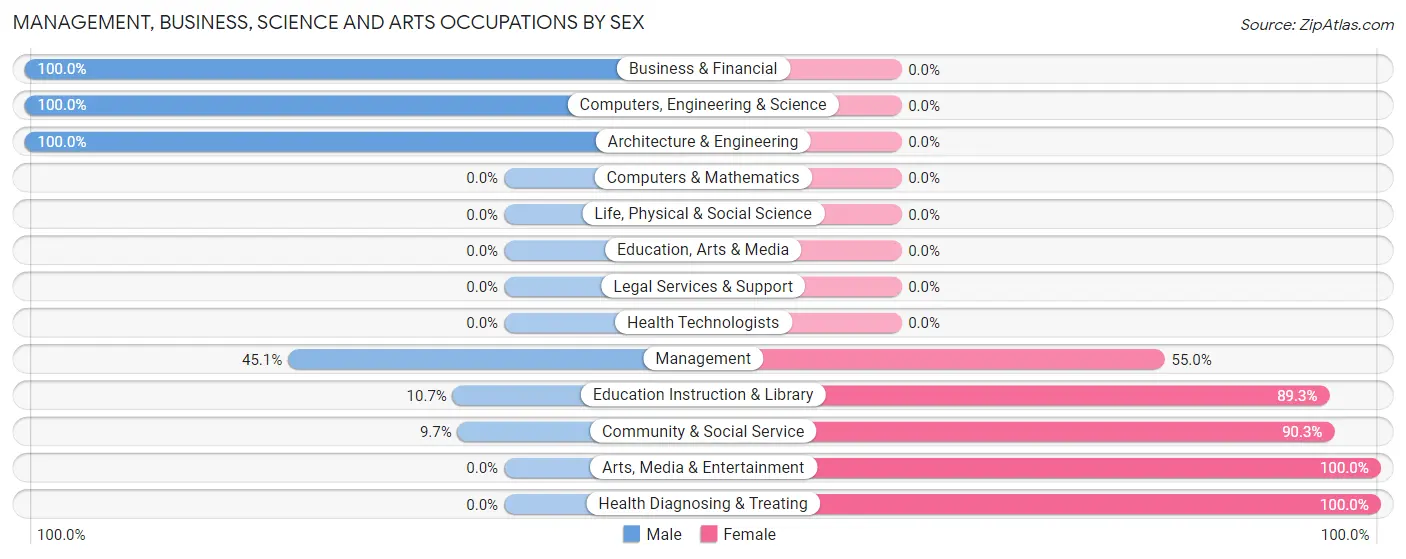
Management, Business, Science and Arts Occupations by Sex
Within the Management, Business, Science and Arts occupations in Warm Springs, the most male-oriented occupations are Business & Financial (100.0%), Computers, Engineering & Science (100.0%), and Architecture & Engineering (100.0%), while the most female-oriented occupations are Arts, Media & Entertainment (100.0%), Health Diagnosing & Treating (100.0%), and Community & Social Service (90.3%).
| Occupation | Male | Female |
| Management | 41 (45.1%) | 50 (54.9%) |
| Business & Financial | 14 (100.0%) | 0 (0.0%) |
| Computers, Engineering & Science | 37 (100.0%) | 0 (0.0%) |
| Computers & Mathematics | 0 (0.0%) | 0 (0.0%) |
| Architecture & Engineering | 37 (100.0%) | 0 (0.0%) |
| Life, Physical & Social Science | 0 (0.0%) | 0 (0.0%) |
| Community & Social Service | 6 (9.7%) | 56 (90.3%) |
| Education, Arts & Media | 0 (0.0%) | 0 (0.0%) |
| Legal Services & Support | 0 (0.0%) | 0 (0.0%) |
| Education Instruction & Library | 6 (10.7%) | 50 (89.3%) |
| Arts, Media & Entertainment | 0 (0.0%) | 6 (100.0%) |
| Health Diagnosing & Treating | 0 (0.0%) | 7 (100.0%) |
| Health Technologists | 0 (0.0%) | 0 (0.0%) |
| Total (Category) | 98 (46.5%) | 113 (53.5%) |
| Total (Overall) | 418 (61.3%) | 264 (38.7%) |
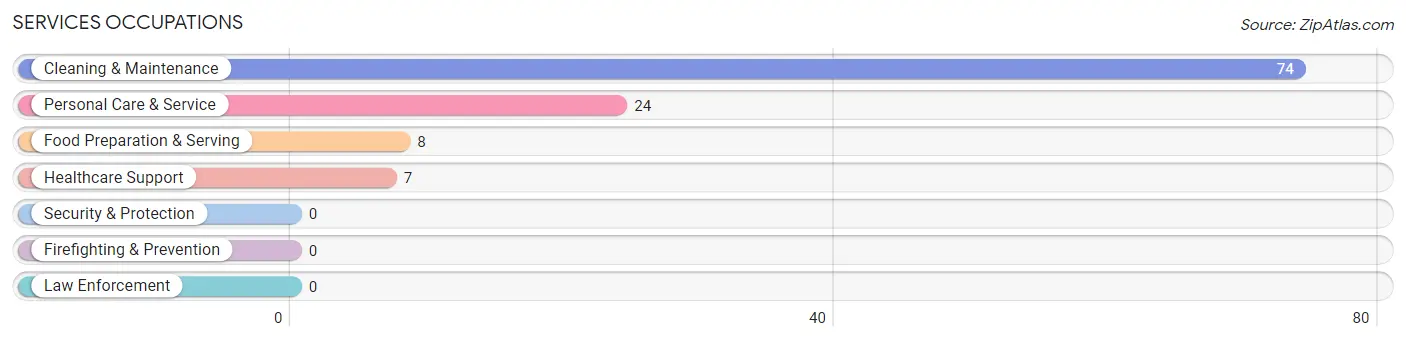
Services Occupations
The most common Services occupations in Warm Springs are Cleaning & Maintenance (74 | 10.8%), Personal Care & Service (24 | 3.5%), Food Preparation & Serving (8 | 1.2%), and Healthcare Support (7 | 1.0%).
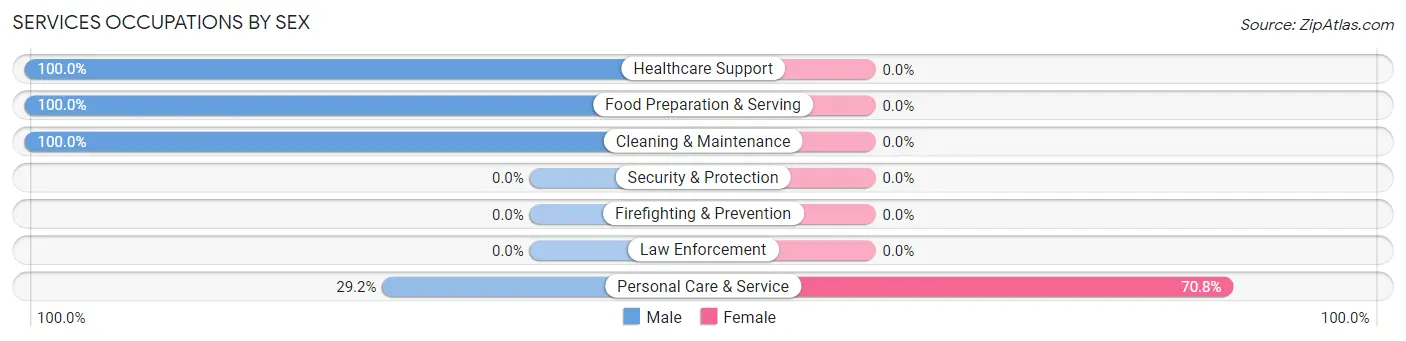
Services Occupations by Sex
| Occupation | Male | Female |
| Healthcare Support | 7 (100.0%) | 0 (0.0%) |
| Security & Protection | 0 (0.0%) | 0 (0.0%) |
| Firefighting & Prevention | 0 (0.0%) | 0 (0.0%) |
| Law Enforcement | 0 (0.0%) | 0 (0.0%) |
| Food Preparation & Serving | 8 (100.0%) | 0 (0.0%) |
| Cleaning & Maintenance | 74 (100.0%) | 0 (0.0%) |
| Personal Care & Service | 7 (29.2%) | 17 (70.8%) |
| Total (Category) | 96 (85.0%) | 17 (15.0%) |
| Total (Overall) | 418 (61.3%) | 264 (38.7%) |
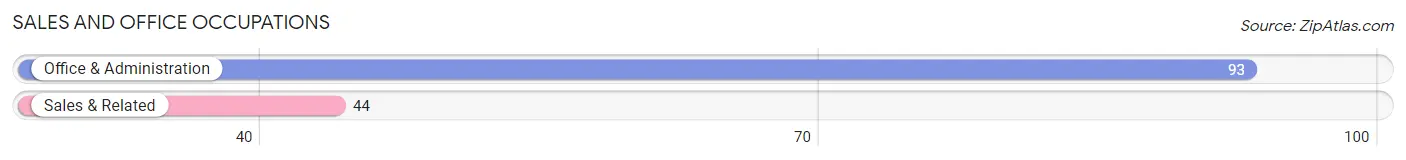
Sales and Office Occupations
The most common Sales and Office occupations in Warm Springs are Office & Administration (93 | 13.6%), and Sales & Related (44 | 6.5%).
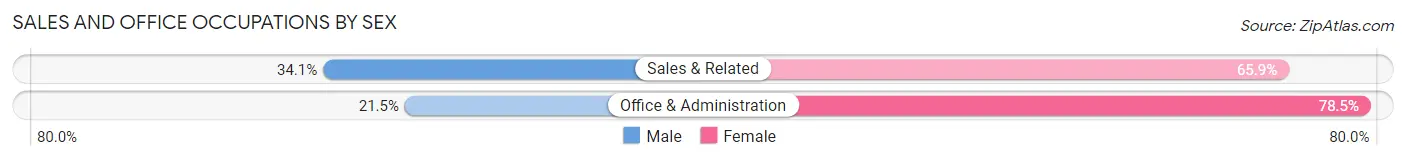
Sales and Office Occupations by Sex
| Occupation | Male | Female |
| Sales & Related | 15 (34.1%) | 29 (65.9%) |
| Office & Administration | 20 (21.5%) | 73 (78.5%) |
| Total (Category) | 35 (25.6%) | 102 (74.5%) |
| Total (Overall) | 418 (61.3%) | 264 (38.7%) |
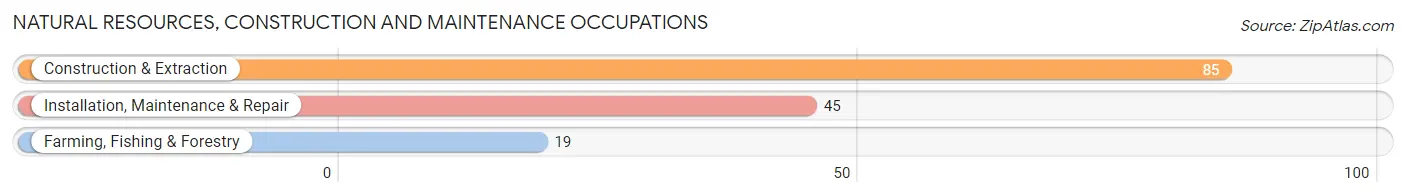
Natural Resources, Construction and Maintenance Occupations
The most common Natural Resources, Construction and Maintenance occupations in Warm Springs are Construction & Extraction (85 | 12.5%), Installation, Maintenance & Repair (45 | 6.6%), and Farming, Fishing & Forestry (19 | 2.8%).
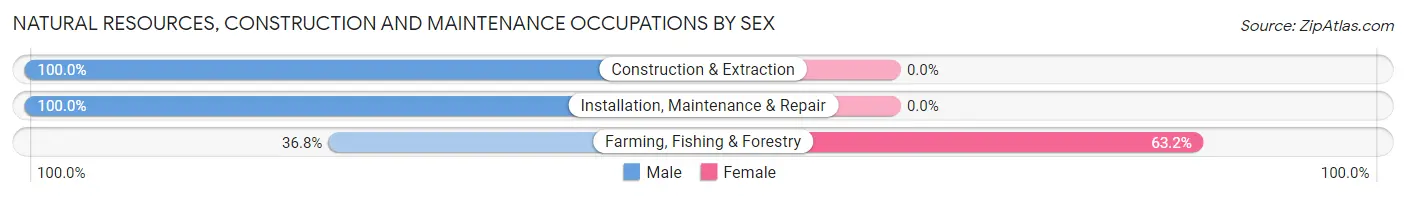
Natural Resources, Construction and Maintenance Occupations by Sex
| Occupation | Male | Female |
| Farming, Fishing & Forestry | 7 (36.8%) | 12 (63.2%) |
| Construction & Extraction | 85 (100.0%) | 0 (0.0%) |
| Installation, Maintenance & Repair | 45 (100.0%) | 0 (0.0%) |
| Total (Category) | 137 (91.9%) | 12 (8.1%) |
| Total (Overall) | 418 (61.3%) | 264 (38.7%) |
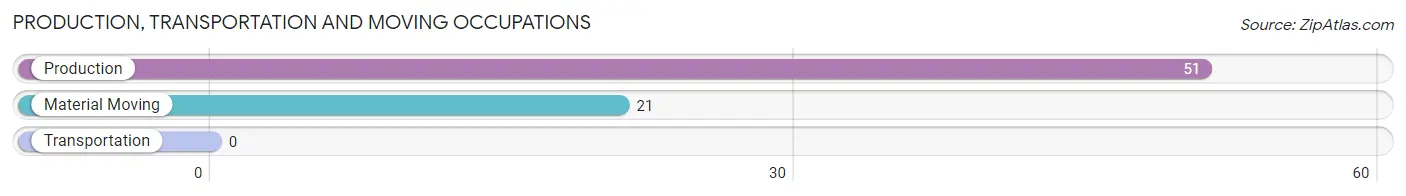
Production, Transportation and Moving Occupations
The most common Production, Transportation and Moving occupations in Warm Springs are Production (51 | 7.5%), and Material Moving (21 | 3.1%).
Production, Transportation and Moving Occupations by Sex
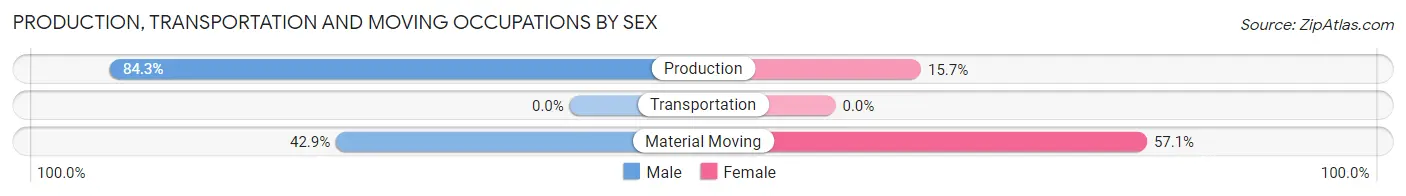
| Occupation | Male | Female |
| Production | 43 (84.3%) | 8 (15.7%) |
| Transportation | 0 (0.0%) | 0 (0.0%) |
| Material Moving | 9 (42.9%) | 12 (57.1%) |
| Total (Category) | 52 (72.2%) | 20 (27.8%) |
| Total (Overall) | 418 (61.3%) | 264 (38.7%) |
Employment Industries by Sex in Warm Springs
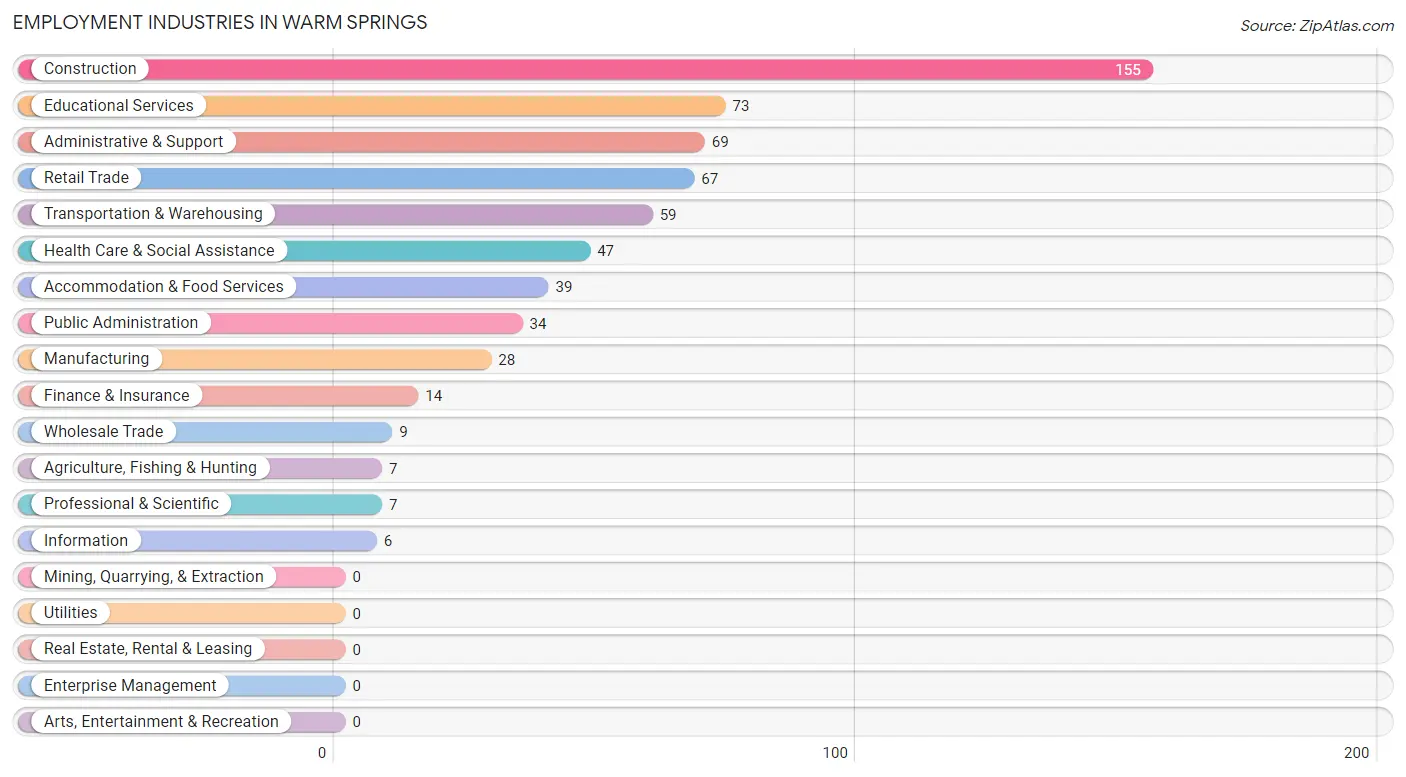
Employment Industries in Warm Springs
The major employment industries in Warm Springs include Construction (155 | 22.7%), Educational Services (73 | 10.7%), Administrative & Support (69 | 10.1%), Retail Trade (67 | 9.8%), and Transportation & Warehousing (59 | 8.6%).
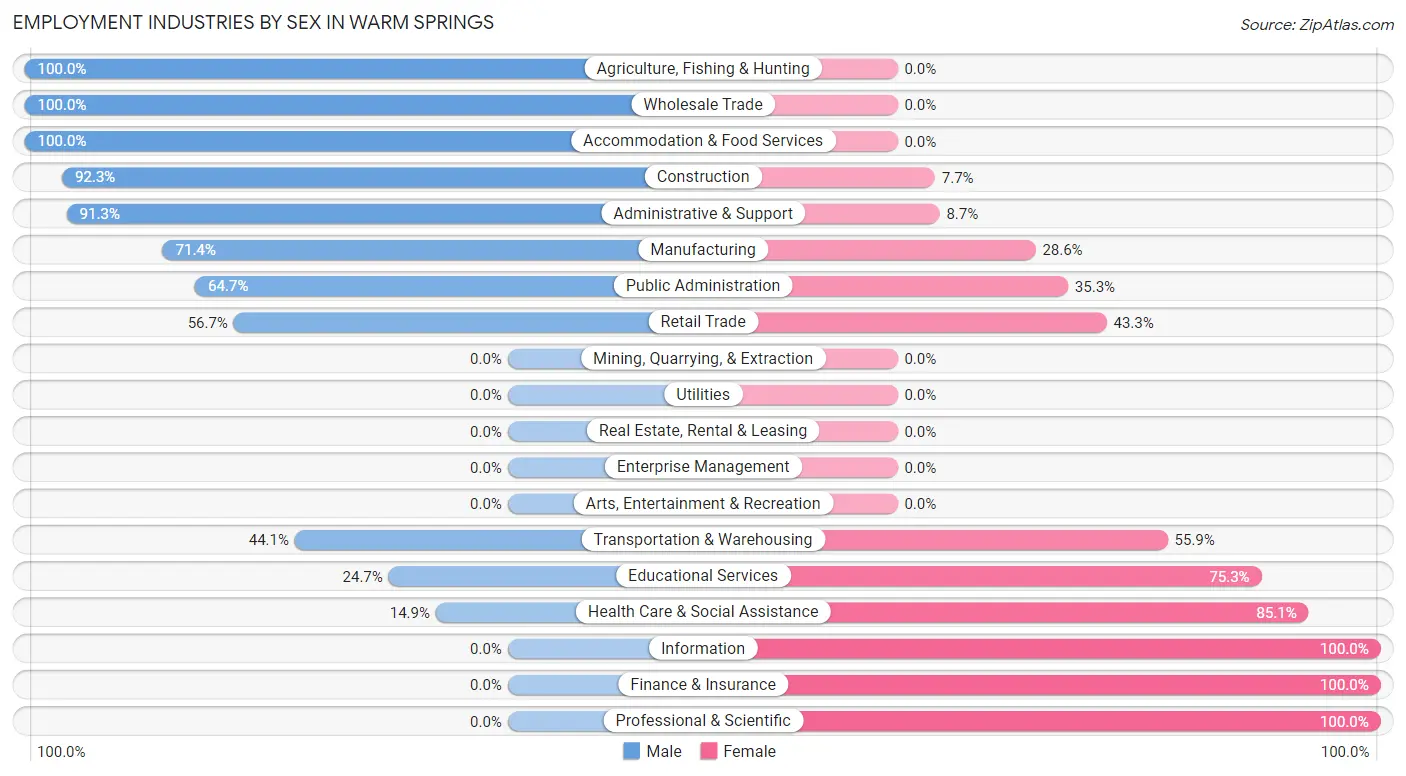
Employment Industries by Sex in Warm Springs
The Warm Springs industries that see more men than women are Agriculture, Fishing & Hunting (100.0%), Wholesale Trade (100.0%), and Accommodation & Food Services (100.0%), whereas the industries that tend to have a higher number of women are Information (100.0%), Finance & Insurance (100.0%), and Professional & Scientific (100.0%).
| Industry | Male | Female |
| Agriculture, Fishing & Hunting | 7 (100.0%) | 0 (0.0%) |
| Mining, Quarrying, & Extraction | 0 (0.0%) | 0 (0.0%) |
| Construction | 143 (92.3%) | 12 (7.7%) |
| Manufacturing | 20 (71.4%) | 8 (28.6%) |
| Wholesale Trade | 9 (100.0%) | 0 (0.0%) |
| Retail Trade | 38 (56.7%) | 29 (43.3%) |
| Transportation & Warehousing | 26 (44.1%) | 33 (55.9%) |
| Utilities | 0 (0.0%) | 0 (0.0%) |
| Information | 0 (0.0%) | 6 (100.0%) |
| Finance & Insurance | 0 (0.0%) | 14 (100.0%) |
| Real Estate, Rental & Leasing | 0 (0.0%) | 0 (0.0%) |
| Professional & Scientific | 0 (0.0%) | 7 (100.0%) |
| Enterprise Management | 0 (0.0%) | 0 (0.0%) |
| Administrative & Support | 63 (91.3%) | 6 (8.7%) |
| Educational Services | 18 (24.7%) | 55 (75.3%) |
| Health Care & Social Assistance | 7 (14.9%) | 40 (85.1%) |
| Arts, Entertainment & Recreation | 0 (0.0%) | 0 (0.0%) |
| Accommodation & Food Services | 39 (100.0%) | 0 (0.0%) |
| Public Administration | 22 (64.7%) | 12 (35.3%) |
| Total | 418 (61.3%) | 264 (38.7%) |
Education in Warm Springs
School Enrollment in Warm Springs
The most common levels of schooling among the 484 students in Warm Springs are elementary school (135 | 27.9%), high school (117 | 24.2%), and college / undergraduate (77 | 15.9%).
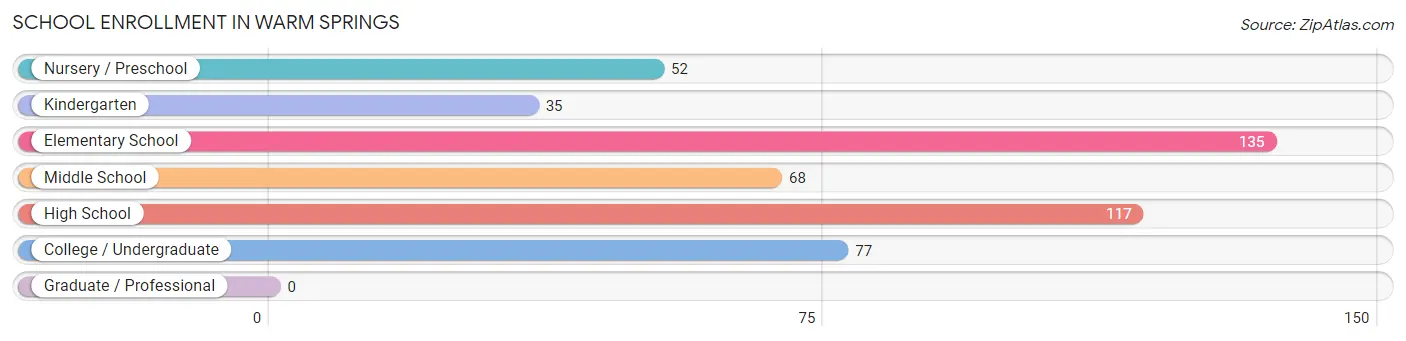
| School Level | # Students | % Students |
| Nursery / Preschool | 52 | 10.7% |
| Kindergarten | 35 | 7.2% |
| Elementary School | 135 | 27.9% |
| Middle School | 68 | 14.1% |
| High School | 117 | 24.2% |
| College / Undergraduate | 77 | 15.9% |
| Graduate / Professional | 0 | 0.0% |
| Total | 484 | 100.0% |
School Enrollment by Age by Funding Source in Warm Springs
Out of a total of 484 students who are enrolled in schools in Warm Springs, 85 (17.6%) attend a private institution, while the remaining 399 (82.4%) are enrolled in public schools. The age group of 3 to 4 year olds has the highest likelihood of being enrolled in private schools, with 52 (100.0% in the age bracket) enrolled. Conversely, the age group of 5 to 9 year old has the lowest likelihood of being enrolled in a private school, with 156 (100.0% in the age bracket) attending a public institution.
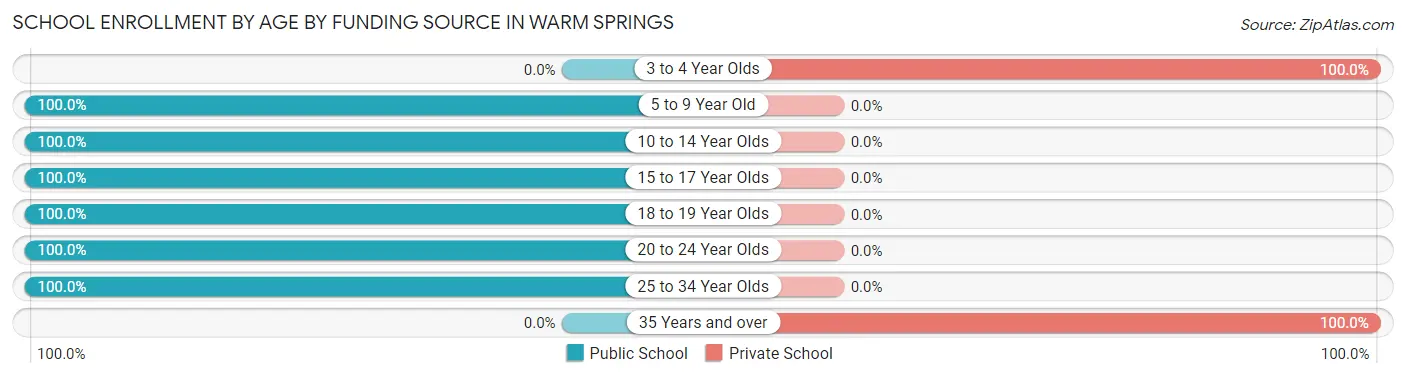
| Age Bracket | Public School | Private School |
| 3 to 4 Year Olds | 0 (0.0%) | 52 (100.0%) |
| 5 to 9 Year Old | 156 (100.0%) | 0 (0.0%) |
| 10 to 14 Year Olds | 116 (100.0%) | 0 (0.0%) |
| 15 to 17 Year Olds | 12 (100.0%) | 0 (0.0%) |
| 18 to 19 Year Olds | 34 (100.0%) | 0 (0.0%) |
| 20 to 24 Year Olds | 61 (100.0%) | 0 (0.0%) |
| 25 to 34 Year Olds | 20 (100.0%) | 0 (0.0%) |
| 35 Years and over | 0 (0.0%) | 33 (100.0%) |
| Total | 399 (82.4%) | 85 (17.6%) |
Educational Attainment by Field of Study in Warm Springs
Education (26 | 32.1%), business (22 | 27.2%), computers & mathematics (14 | 17.3%), physical & health sciences (12 | 14.8%), and psychology (7 | 8.6%) are the most common fields of study among 81 individuals in Warm Springs who have obtained a bachelor's degree or higher.
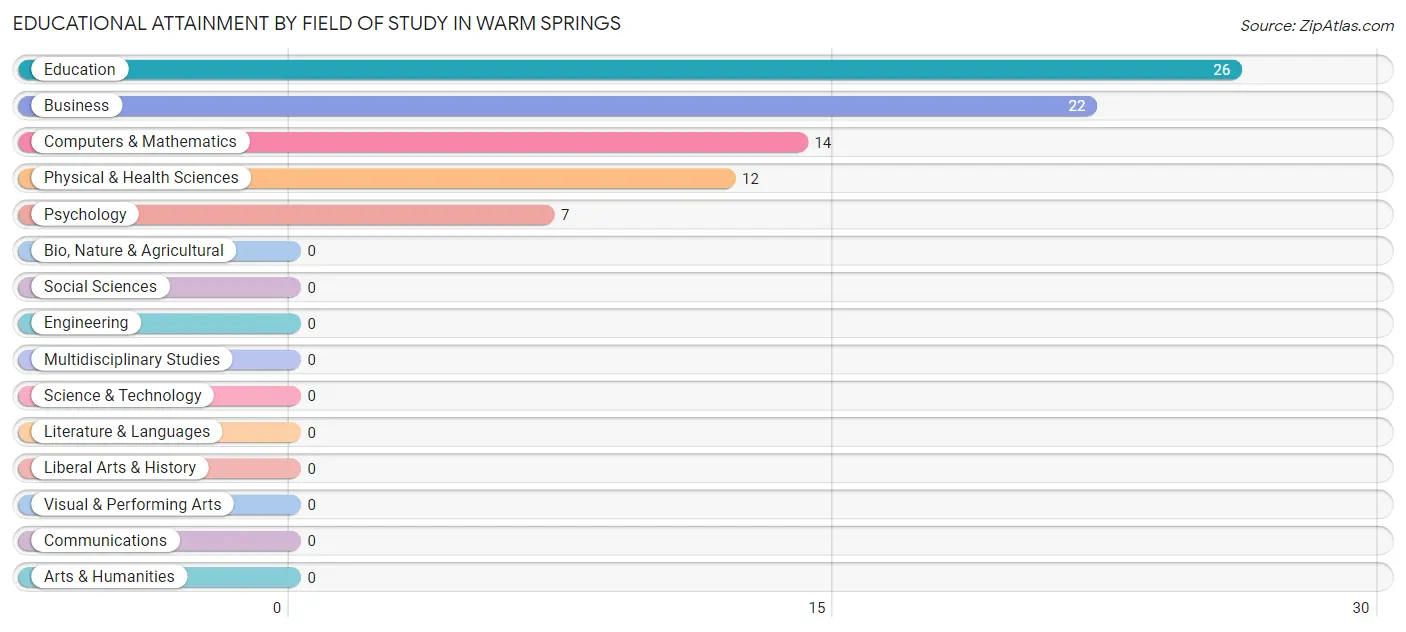
| Field of Study | # Graduates | % Graduates |
| Computers & Mathematics | 14 | 17.3% |
| Bio, Nature & Agricultural | 0 | 0.0% |
| Physical & Health Sciences | 12 | 14.8% |
| Psychology | 7 | 8.6% |
| Social Sciences | 0 | 0.0% |
| Engineering | 0 | 0.0% |
| Multidisciplinary Studies | 0 | 0.0% |
| Science & Technology | 0 | 0.0% |
| Business | 22 | 27.2% |
| Education | 26 | 32.1% |
| Literature & Languages | 0 | 0.0% |
| Liberal Arts & History | 0 | 0.0% |
| Visual & Performing Arts | 0 | 0.0% |
| Communications | 0 | 0.0% |
| Arts & Humanities | 0 | 0.0% |
| Total | 81 | 100.0% |
Transportation & Commute in Warm Springs
Vehicle Availability by Sex in Warm Springs
The most prevalent vehicle ownership categories in Warm Springs are males with 2 vehicles (167, accounting for 40.0%) and females with 2 vehicles (82, making up 63.3%).
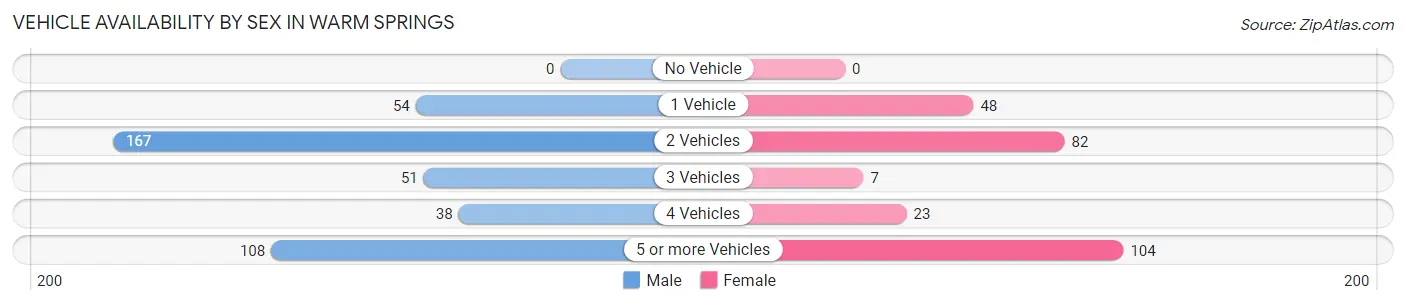
| Vehicles Available | Male | Female |
| No Vehicle | 0 (0.0%) | 0 (0.0%) |
| 1 Vehicle | 54 (12.9%) | 48 (18.2%) |
| 2 Vehicles | 167 (40.0%) | 82 (31.1%) |
| 3 Vehicles | 51 (12.2%) | 7 (2.6%) |
| 4 Vehicles | 38 (9.1%) | 23 (8.7%) |
| 5 or more Vehicles | 108 (25.8%) | 104 (39.4%) |
| Total | 418 (100.0%) | 264 (100.0%) |
Commute Time in Warm Springs
The most frequently occuring commute durations in Warm Springs are 45 to 59 minutes (128 commuters, 20.2%), 90 or more minutes (90 commuters, 14.2%), and 5 to 9 minutes (84 commuters, 13.3%).
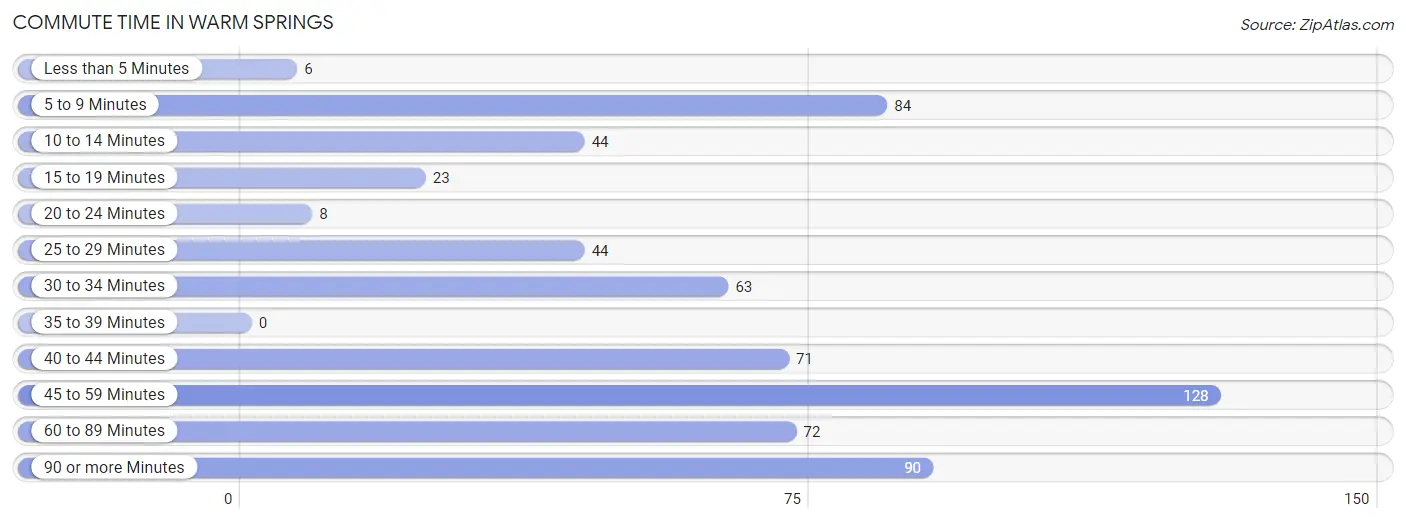
| Commute Time | # Commuters | % Commuters |
| Less than 5 Minutes | 6 | 0.9% |
| 5 to 9 Minutes | 84 | 13.3% |
| 10 to 14 Minutes | 44 | 7.0% |
| 15 to 19 Minutes | 23 | 3.6% |
| 20 to 24 Minutes | 8 | 1.3% |
| 25 to 29 Minutes | 44 | 7.0% |
| 30 to 34 Minutes | 63 | 10.0% |
| 35 to 39 Minutes | 0 | 0.0% |
| 40 to 44 Minutes | 71 | 11.2% |
| 45 to 59 Minutes | 128 | 20.2% |
| 60 to 89 Minutes | 72 | 11.4% |
| 90 or more Minutes | 90 | 14.2% |
Commute Time by Sex in Warm Springs
The most common commute times in Warm Springs are 90 or more minutes (78 commuters, 19.6%) for males and 45 to 59 minutes (62 commuters, 26.4%) for females.
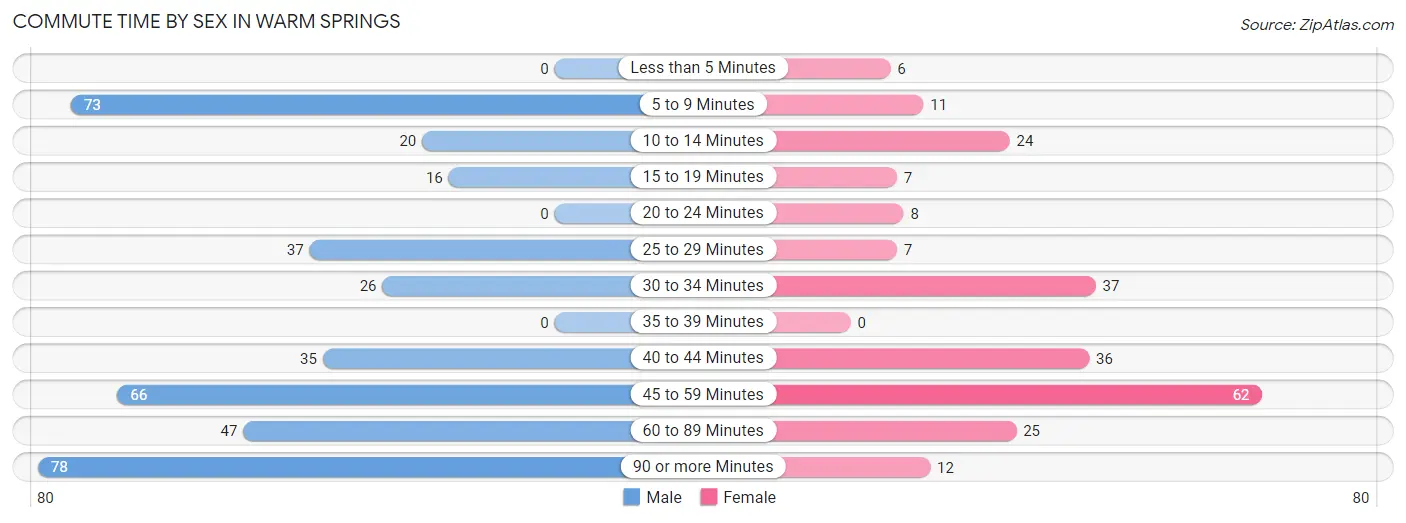
| Commute Time | Male | Female |
| Less than 5 Minutes | 0 (0.0%) | 6 (2.5%) |
| 5 to 9 Minutes | 73 (18.3%) | 11 (4.7%) |
| 10 to 14 Minutes | 20 (5.0%) | 24 (10.2%) |
| 15 to 19 Minutes | 16 (4.0%) | 7 (3.0%) |
| 20 to 24 Minutes | 0 (0.0%) | 8 (3.4%) |
| 25 to 29 Minutes | 37 (9.3%) | 7 (3.0%) |
| 30 to 34 Minutes | 26 (6.5%) | 37 (15.7%) |
| 35 to 39 Minutes | 0 (0.0%) | 0 (0.0%) |
| 40 to 44 Minutes | 35 (8.8%) | 36 (15.3%) |
| 45 to 59 Minutes | 66 (16.6%) | 62 (26.4%) |
| 60 to 89 Minutes | 47 (11.8%) | 25 (10.6%) |
| 90 or more Minutes | 78 (19.6%) | 12 (5.1%) |
Time of Departure to Work by Sex in Warm Springs
The most frequent times of departure to work in Warm Springs are 12:00 AM to 4:59 AM (117, 29.4%) for males and 7:00 AM to 7:29 AM (54, 23.0%) for females.
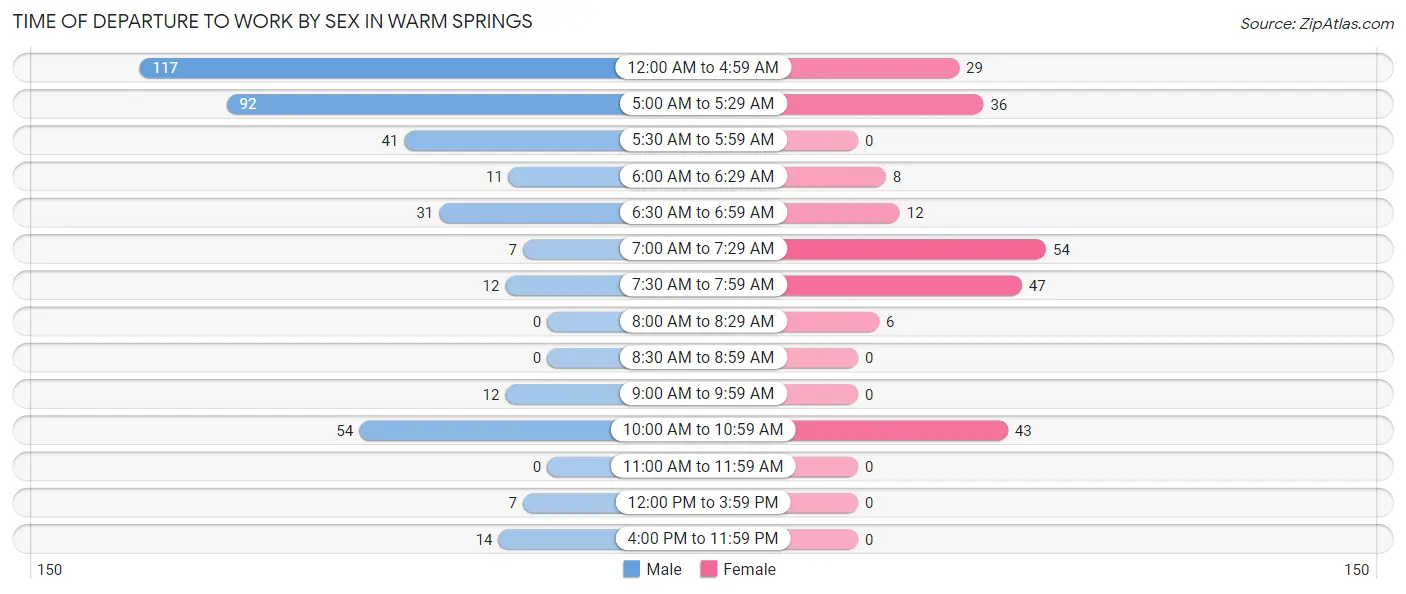
| Time of Departure | Male | Female |
| 12:00 AM to 4:59 AM | 117 (29.4%) | 29 (12.3%) |
| 5:00 AM to 5:29 AM | 92 (23.1%) | 36 (15.3%) |
| 5:30 AM to 5:59 AM | 41 (10.3%) | 0 (0.0%) |
| 6:00 AM to 6:29 AM | 11 (2.8%) | 8 (3.4%) |
| 6:30 AM to 6:59 AM | 31 (7.8%) | 12 (5.1%) |
| 7:00 AM to 7:29 AM | 7 (1.8%) | 54 (23.0%) |
| 7:30 AM to 7:59 AM | 12 (3.0%) | 47 (20.0%) |
| 8:00 AM to 8:29 AM | 0 (0.0%) | 6 (2.5%) |
| 8:30 AM to 8:59 AM | 0 (0.0%) | 0 (0.0%) |
| 9:00 AM to 9:59 AM | 12 (3.0%) | 0 (0.0%) |
| 10:00 AM to 10:59 AM | 54 (13.6%) | 43 (18.3%) |
| 11:00 AM to 11:59 AM | 0 (0.0%) | 0 (0.0%) |
| 12:00 PM to 3:59 PM | 7 (1.8%) | 0 (0.0%) |
| 4:00 PM to 11:59 PM | 14 (3.5%) | 0 (0.0%) |
| Total | 398 (100.0%) | 235 (100.0%) |
Housing Occupancy in Warm Springs
Occupancy by Ownership in Warm Springs
Of the total 543 dwellings in Warm Springs, owner-occupied units account for 354 (65.2%), while renter-occupied units make up 189 (34.8%).
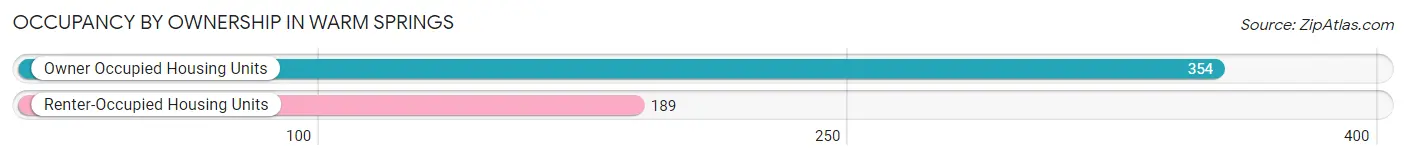
| Occupancy | # Housing Units | % Housing Units |
| Owner Occupied Housing Units | 354 | 65.2% |
| Renter-Occupied Housing Units | 189 | 34.8% |
| Total Occupied Housing Units | 543 | 100.0% |
Occupancy by Household Size in Warm Springs
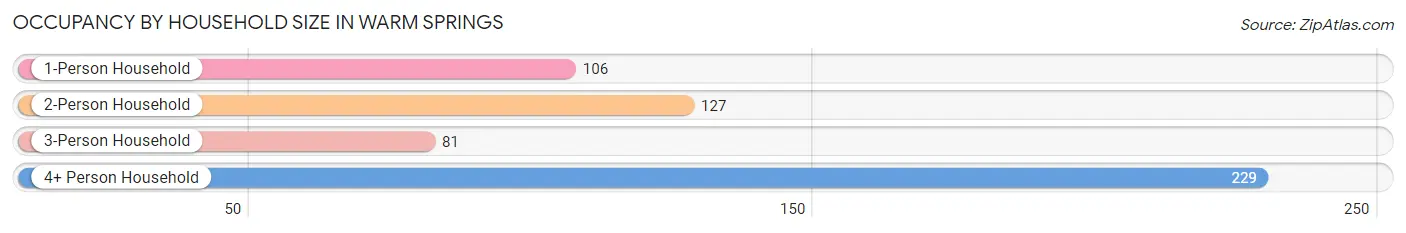
| Household Size | # Housing Units | % Housing Units |
| 1-Person Household | 106 | 19.5% |
| 2-Person Household | 127 | 23.4% |
| 3-Person Household | 81 | 14.9% |
| 4+ Person Household | 229 | 42.2% |
| Total Housing Units | 543 | 100.0% |
Occupancy by Ownership by Household Size in Warm Springs
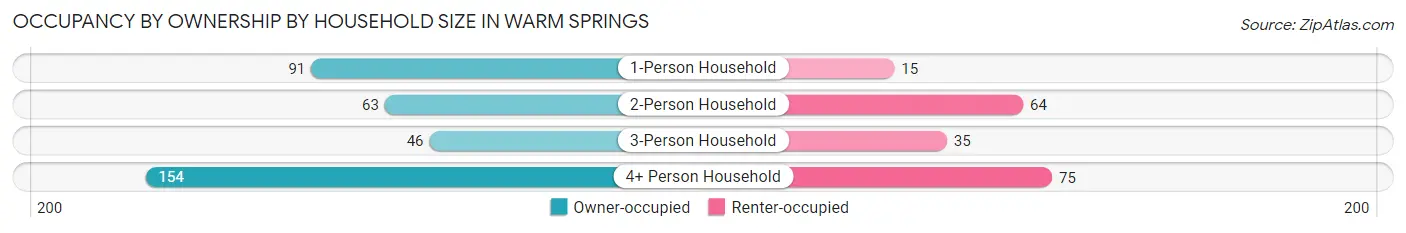
| Household Size | Owner-occupied | Renter-occupied |
| 1-Person Household | 91 (85.9%) | 15 (14.1%) |
| 2-Person Household | 63 (49.6%) | 64 (50.4%) |
| 3-Person Household | 46 (56.8%) | 35 (43.2%) |
| 4+ Person Household | 154 (67.2%) | 75 (32.8%) |
| Total Housing Units | 354 (65.2%) | 189 (34.8%) |
Occupancy by Educational Attainment in Warm Springs
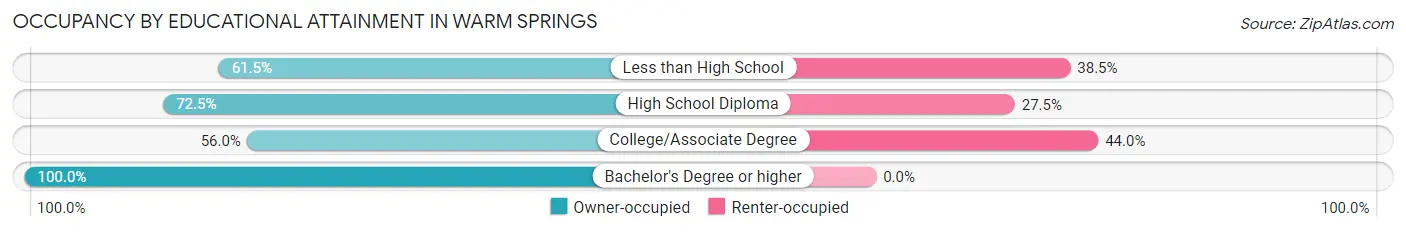
| Household Size | Owner-occupied | Renter-occupied |
| Less than High School | 115 (61.5%) | 72 (38.5%) |
| High School Diploma | 124 (72.5%) | 47 (27.5%) |
| College/Associate Degree | 89 (56.0%) | 70 (44.0%) |
| Bachelor's Degree or higher | 26 (100.0%) | 0 (0.0%) |
Occupancy by Age of Householder in Warm Springs
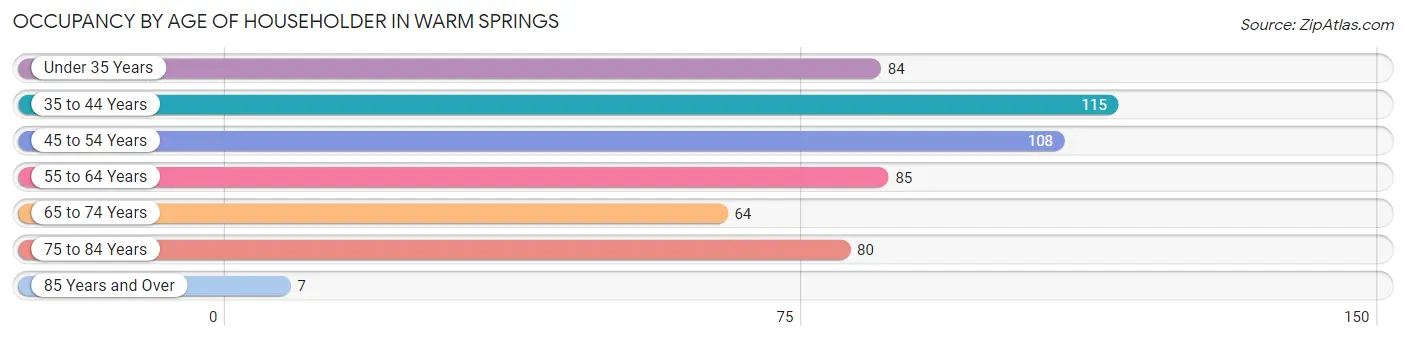
| Age Bracket | # Households | % Households |
| Under 35 Years | 84 | 15.5% |
| 35 to 44 Years | 115 | 21.2% |
| 45 to 54 Years | 108 | 19.9% |
| 55 to 64 Years | 85 | 15.7% |
| 65 to 74 Years | 64 | 11.8% |
| 75 to 84 Years | 80 | 14.7% |
| 85 Years and Over | 7 | 1.3% |
| Total | 543 | 100.0% |
Housing Finances in Warm Springs
Median Income by Occupancy in Warm Springs
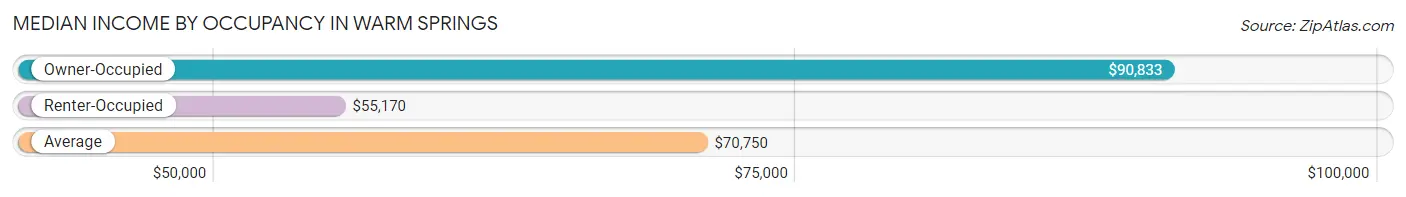
| Occupancy Type | # Households | Median Income |
| Owner-Occupied | 354 (65.2%) | $90,833 |
| Renter-Occupied | 189 (34.8%) | $55,170 |
| Average | 543 (100.0%) | $70,750 |
Occupancy by Householder Income Bracket in Warm Springs
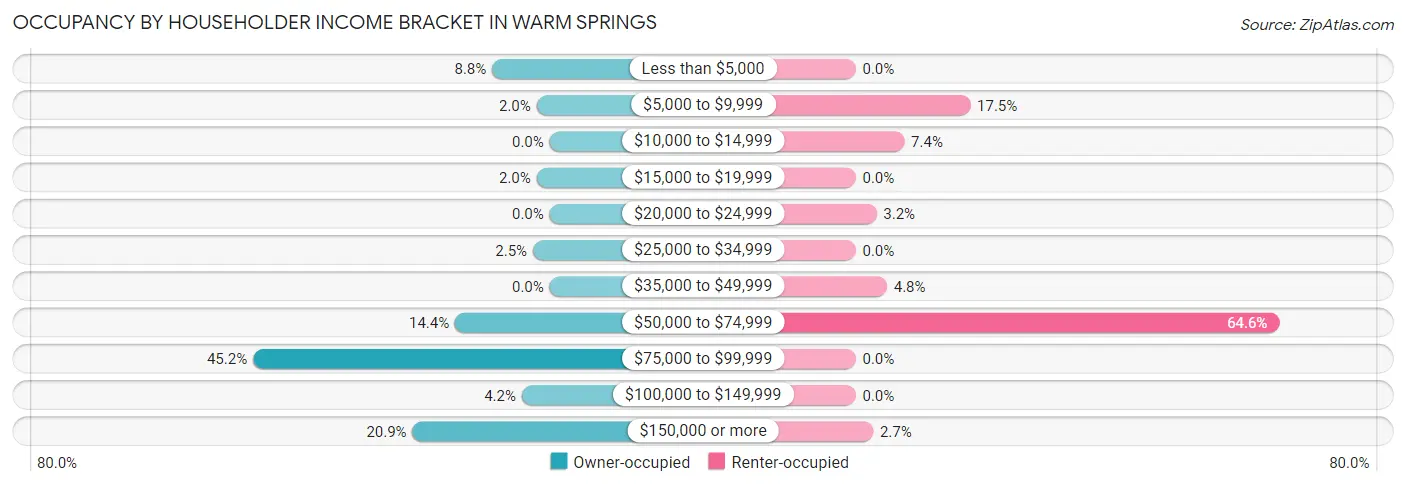
| Income Bracket | Owner-occupied | Renter-occupied |
| Less than $5,000 | 31 (8.8%) | 0 (0.0%) |
| $5,000 to $9,999 | 7 (2.0%) | 33 (17.5%) |
| $10,000 to $14,999 | 0 (0.0%) | 14 (7.4%) |
| $15,000 to $19,999 | 7 (2.0%) | 0 (0.0%) |
| $20,000 to $24,999 | 0 (0.0%) | 6 (3.2%) |
| $25,000 to $34,999 | 9 (2.5%) | 0 (0.0%) |
| $35,000 to $49,999 | 0 (0.0%) | 9 (4.8%) |
| $50,000 to $74,999 | 51 (14.4%) | 122 (64.5%) |
| $75,000 to $99,999 | 160 (45.2%) | 0 (0.0%) |
| $100,000 to $149,999 | 15 (4.2%) | 0 (0.0%) |
| $150,000 or more | 74 (20.9%) | 5 (2.6%) |
| Total | 354 (100.0%) | 189 (100.0%) |
Monthly Housing Cost Tiers in Warm Springs
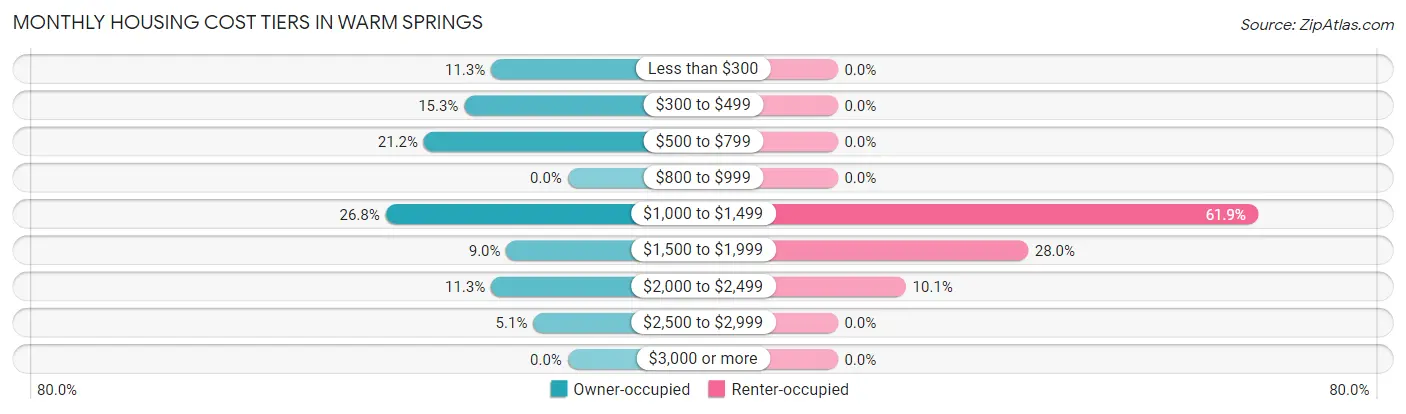
| Monthly Cost | Owner-occupied | Renter-occupied |
| Less than $300 | 40 (11.3%) | 0 (0.0%) |
| $300 to $499 | 54 (15.2%) | 0 (0.0%) |
| $500 to $799 | 75 (21.2%) | 0 (0.0%) |
| $800 to $999 | 0 (0.0%) | 0 (0.0%) |
| $1,000 to $1,499 | 95 (26.8%) | 117 (61.9%) |
| $1,500 to $1,999 | 32 (9.0%) | 53 (28.0%) |
| $2,000 to $2,499 | 40 (11.3%) | 19 (10.1%) |
| $2,500 to $2,999 | 18 (5.1%) | 0 (0.0%) |
| $3,000 or more | 0 (0.0%) | 0 (0.0%) |
| Total | 354 (100.0%) | 189 (100.0%) |
Physical Housing Characteristics in Warm Springs
Housing Structures in Warm Springs
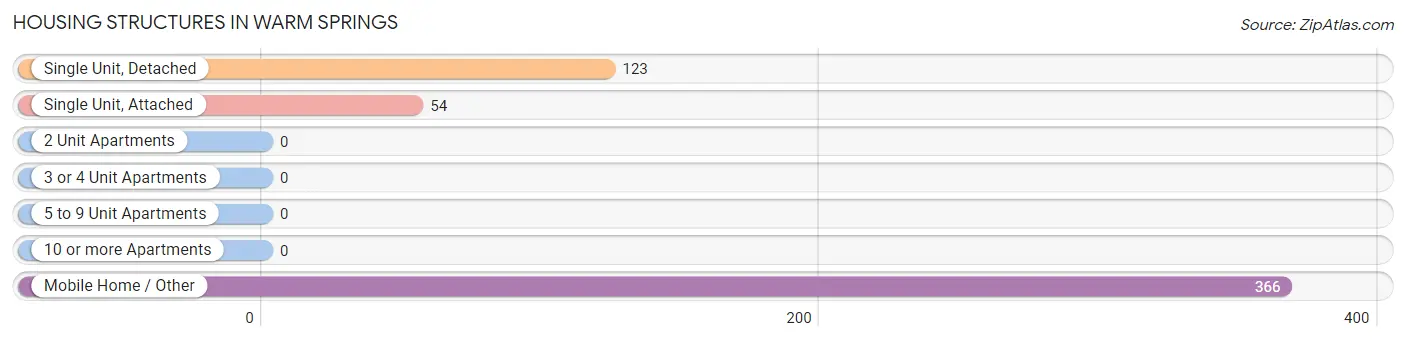
| Structure Type | # Housing Units | % Housing Units |
| Single Unit, Detached | 123 | 22.7% |
| Single Unit, Attached | 54 | 9.9% |
| 2 Unit Apartments | 0 | 0.0% |
| 3 or 4 Unit Apartments | 0 | 0.0% |
| 5 to 9 Unit Apartments | 0 | 0.0% |
| 10 or more Apartments | 0 | 0.0% |
| Mobile Home / Other | 366 | 67.4% |
| Total | 543 | 100.0% |
Housing Structures by Occupancy in Warm Springs
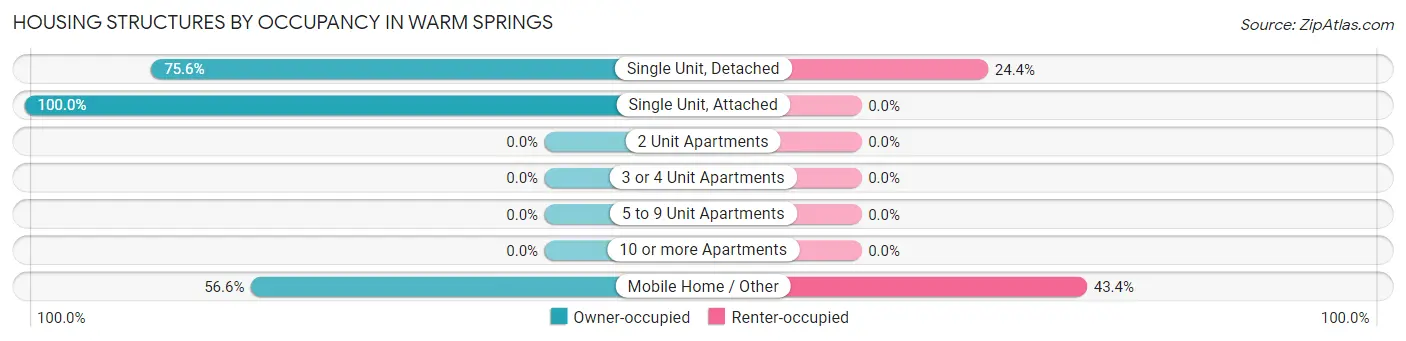
| Structure Type | Owner-occupied | Renter-occupied |
| Single Unit, Detached | 93 (75.6%) | 30 (24.4%) |
| Single Unit, Attached | 54 (100.0%) | 0 (0.0%) |
| 2 Unit Apartments | 0 (0.0%) | 0 (0.0%) |
| 3 or 4 Unit Apartments | 0 (0.0%) | 0 (0.0%) |
| 5 to 9 Unit Apartments | 0 (0.0%) | 0 (0.0%) |
| 10 or more Apartments | 0 (0.0%) | 0 (0.0%) |
| Mobile Home / Other | 207 (56.6%) | 159 (43.4%) |
| Total | 354 (65.2%) | 189 (34.8%) |
Housing Structures by Number of Rooms in Warm Springs
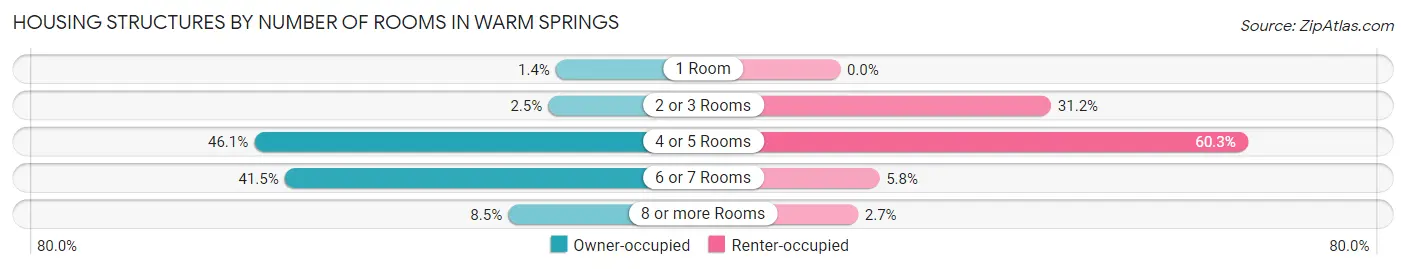
| Number of Rooms | Owner-occupied | Renter-occupied |
| 1 Room | 5 (1.4%) | 0 (0.0%) |
| 2 or 3 Rooms | 9 (2.5%) | 59 (31.2%) |
| 4 or 5 Rooms | 163 (46.1%) | 114 (60.3%) |
| 6 or 7 Rooms | 147 (41.5%) | 11 (5.8%) |
| 8 or more Rooms | 30 (8.5%) | 5 (2.6%) |
| Total | 354 (100.0%) | 189 (100.0%) |
Housing Structure by Heating Type in Warm Springs
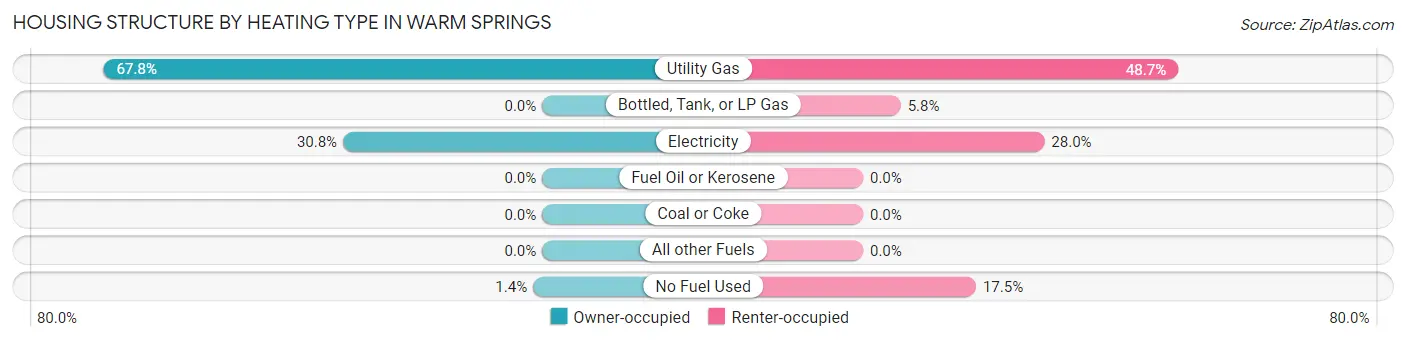
| Heating Type | Owner-occupied | Renter-occupied |
| Utility Gas | 240 (67.8%) | 92 (48.7%) |
| Bottled, Tank, or LP Gas | 0 (0.0%) | 11 (5.8%) |
| Electricity | 109 (30.8%) | 53 (28.0%) |
| Fuel Oil or Kerosene | 0 (0.0%) | 0 (0.0%) |
| Coal or Coke | 0 (0.0%) | 0 (0.0%) |
| All other Fuels | 0 (0.0%) | 0 (0.0%) |
| No Fuel Used | 5 (1.4%) | 33 (17.5%) |
| Total | 354 (100.0%) | 189 (100.0%) |
Household Vehicle Usage in Warm Springs
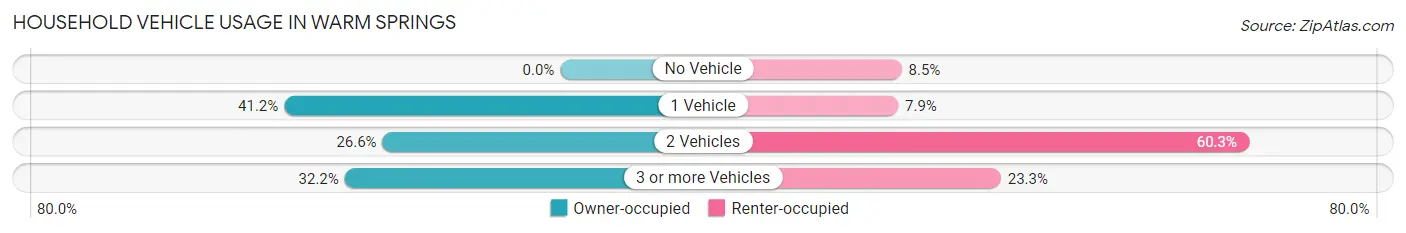
| Vehicles per Household | Owner-occupied | Renter-occupied |
| No Vehicle | 0 (0.0%) | 16 (8.5%) |
| 1 Vehicle | 146 (41.2%) | 15 (7.9%) |
| 2 Vehicles | 94 (26.6%) | 114 (60.3%) |
| 3 or more Vehicles | 114 (32.2%) | 44 (23.3%) |
| Total | 354 (100.0%) | 189 (100.0%) |
Real Estate & Mortgages in Warm Springs
Real Estate and Mortgage Overview in Warm Springs
| Characteristic | Without Mortgage | With Mortgage |
| Housing Units | 233 | 121 |
| Median Property Value | $300,500 | $380,400 |
| Median Household Income | $86,412 | $54 |
| Monthly Housing Costs | $621 | $0 |
| Real Estate Taxes | $1,410 | $47 |
Property Value by Mortgage Status in Warm Springs
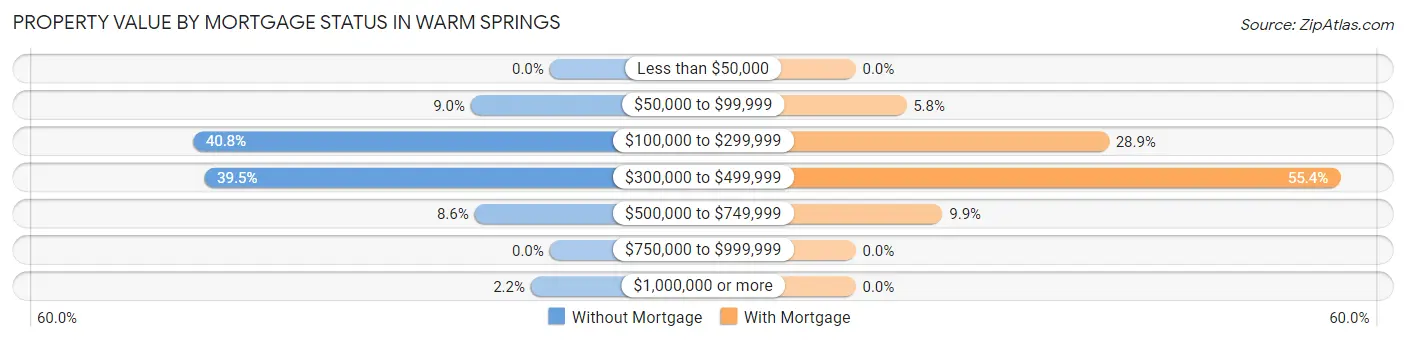
| Property Value | Without Mortgage | With Mortgage |
| Less than $50,000 | 0 (0.0%) | 0 (0.0%) |
| $50,000 to $99,999 | 21 (9.0%) | 7 (5.8%) |
| $100,000 to $299,999 | 95 (40.8%) | 35 (28.9%) |
| $300,000 to $499,999 | 92 (39.5%) | 67 (55.4%) |
| $500,000 to $749,999 | 20 (8.6%) | 12 (9.9%) |
| $750,000 to $999,999 | 0 (0.0%) | 0 (0.0%) |
| $1,000,000 or more | 5 (2.1%) | 0 (0.0%) |
| Total | 233 (100.0%) | 121 (100.0%) |
Household Income by Mortgage Status in Warm Springs
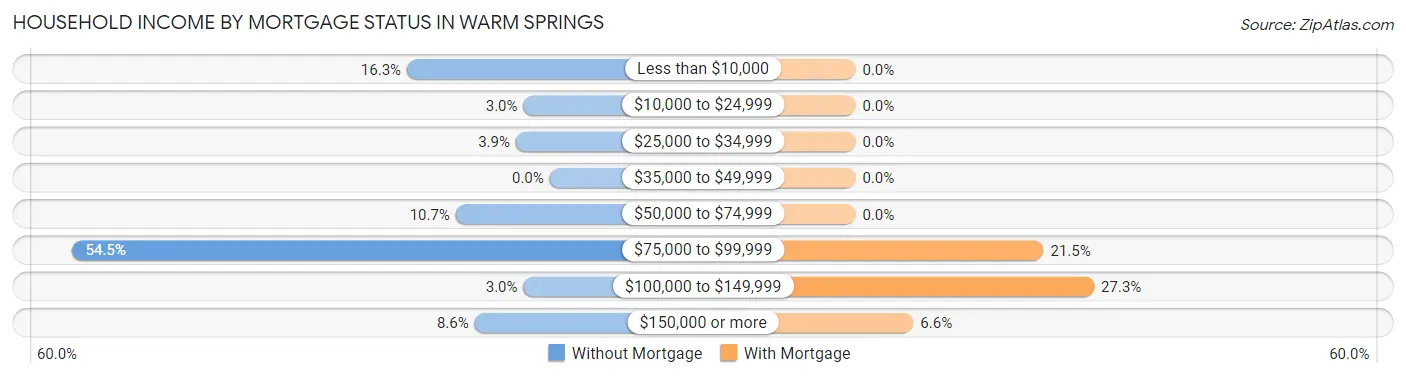
| Household Income | Without Mortgage | With Mortgage |
| Less than $10,000 | 38 (16.3%) | 0 (0.0%) |
| $10,000 to $24,999 | 7 (3.0%) | 0 (0.0%) |
| $25,000 to $34,999 | 9 (3.9%) | 0 (0.0%) |
| $35,000 to $49,999 | 0 (0.0%) | 0 (0.0%) |
| $50,000 to $74,999 | 25 (10.7%) | 0 (0.0%) |
| $75,000 to $99,999 | 127 (54.5%) | 26 (21.5%) |
| $100,000 to $149,999 | 7 (3.0%) | 33 (27.3%) |
| $150,000 or more | 20 (8.6%) | 8 (6.6%) |
| Total | 233 (100.0%) | 121 (100.0%) |
Property Value to Household Income Ratio in Warm Springs
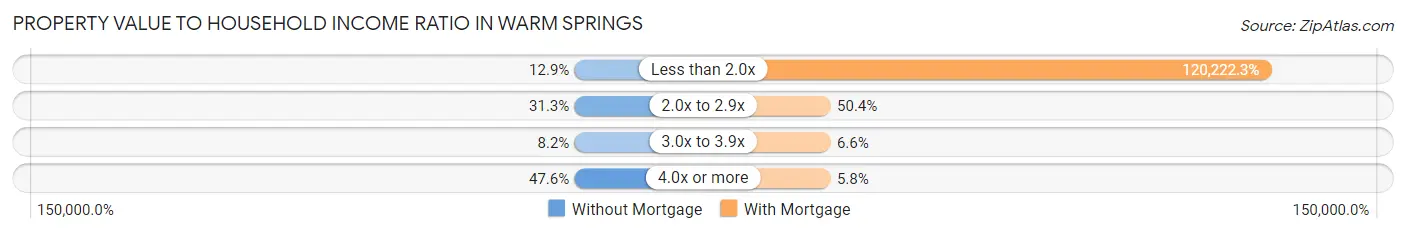
| Value-to-Income Ratio | Without Mortgage | With Mortgage |
| Less than 2.0x | 30 (12.9%) | 145,469 (120,222.3%) |
| 2.0x to 2.9x | 73 (31.3%) | 61 (50.4%) |
| 3.0x to 3.9x | 19 (8.2%) | 8 (6.6%) |
| 4.0x or more | 111 (47.6%) | 7 (5.8%) |
| Total | 233 (100.0%) | 121 (100.0%) |
Real Estate Taxes by Mortgage Status in Warm Springs
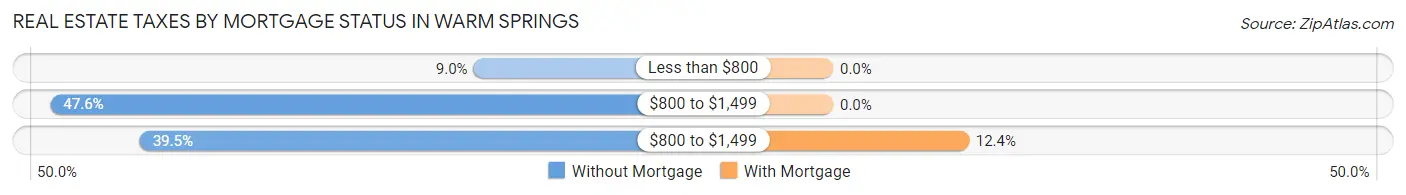
| Property Taxes | Without Mortgage | With Mortgage |
| Less than $800 | 21 (9.0%) | 0 (0.0%) |
| $800 to $1,499 | 111 (47.6%) | 0 (0.0%) |
| $800 to $1,499 | 92 (39.5%) | 15 (12.4%) |
| Total | 233 (100.0%) | 121 (100.0%) |
Health & Disability in Warm Springs
Health Insurance Coverage by Age in Warm Springs
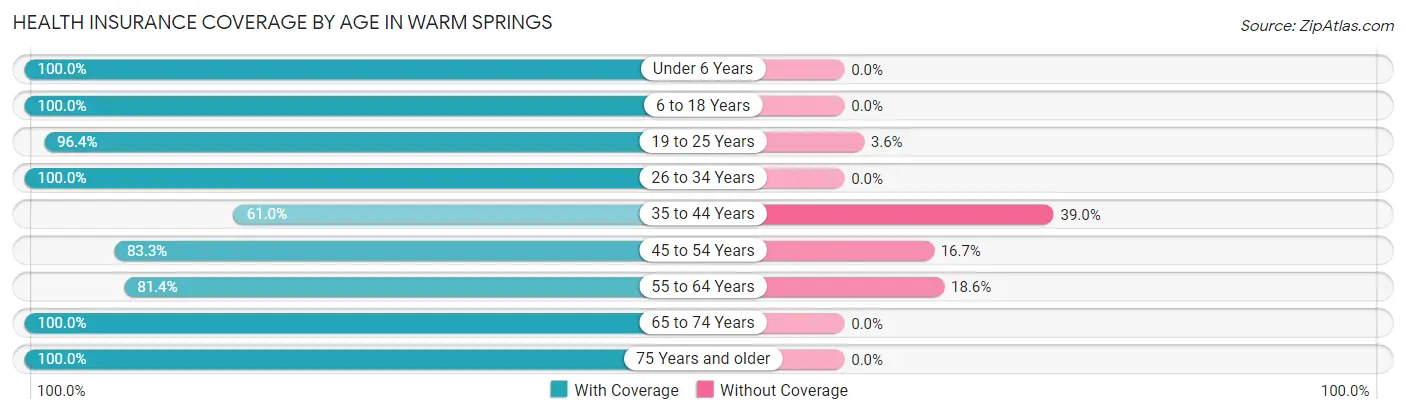
| Age Bracket | With Coverage | Without Coverage |
| Under 6 Years | 235 (100.0%) | 0 (0.0%) |
| 6 to 18 Years | 318 (100.0%) | 0 (0.0%) |
| 19 to 25 Years | 159 (96.4%) | 6 (3.6%) |
| 26 to 34 Years | 258 (100.0%) | 0 (0.0%) |
| 35 to 44 Years | 161 (61.0%) | 103 (39.0%) |
| 45 to 54 Years | 160 (83.3%) | 32 (16.7%) |
| 55 to 64 Years | 175 (81.4%) | 40 (18.6%) |
| 65 to 74 Years | 107 (100.0%) | 0 (0.0%) |
| 75 Years and older | 122 (100.0%) | 0 (0.0%) |
| Total | 1,695 (90.3%) | 181 (9.7%) |
Health Insurance Coverage by Citizenship Status in Warm Springs
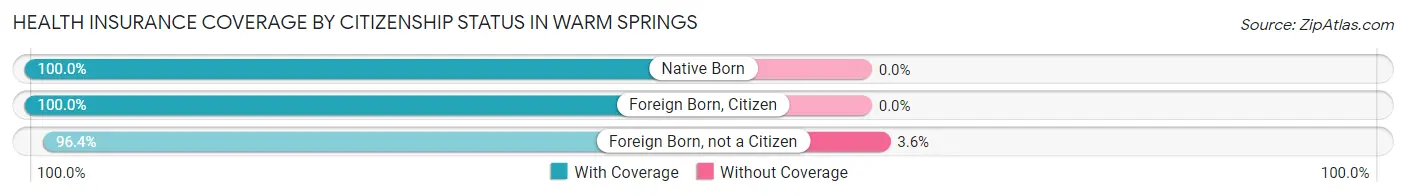
| Citizenship Status | With Coverage | Without Coverage |
| Native Born | 235 (100.0%) | 0 (0.0%) |
| Foreign Born, Citizen | 318 (100.0%) | 0 (0.0%) |
| Foreign Born, not a Citizen | 159 (96.4%) | 6 (3.6%) |
Health Insurance Coverage by Household Income in Warm Springs
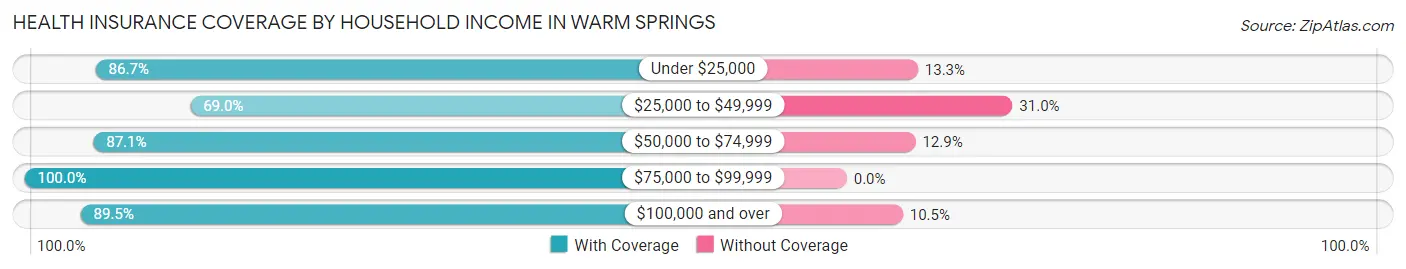
| Household Income | With Coverage | Without Coverage |
| Under $25,000 | 293 (86.7%) | 45 (13.3%) |
| $25,000 to $49,999 | 20 (69.0%) | 9 (31.0%) |
| $50,000 to $74,999 | 494 (87.1%) | 73 (12.9%) |
| $75,000 to $99,999 | 427 (100.0%) | 0 (0.0%) |
| $100,000 and over | 461 (89.5%) | 54 (10.5%) |
Public vs Private Health Insurance Coverage by Age in Warm Springs
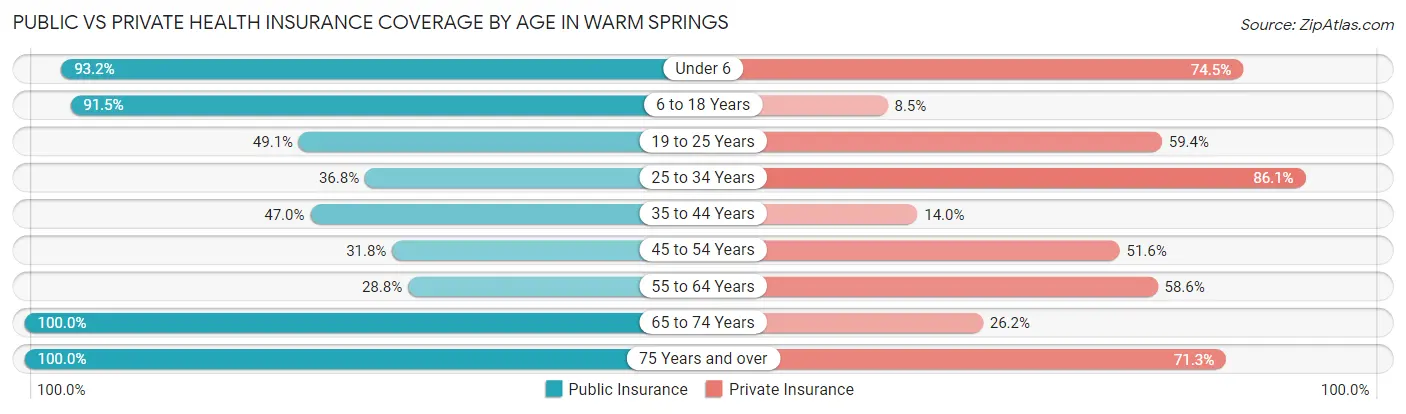
| Age Bracket | Public Insurance | Private Insurance |
| Under 6 | 219 (93.2%) | 175 (74.5%) |
| 6 to 18 Years | 291 (91.5%) | 27 (8.5%) |
| 19 to 25 Years | 81 (49.1%) | 98 (59.4%) |
| 25 to 34 Years | 95 (36.8%) | 222 (86.1%) |
| 35 to 44 Years | 124 (47.0%) | 37 (14.0%) |
| 45 to 54 Years | 61 (31.8%) | 99 (51.6%) |
| 55 to 64 Years | 62 (28.8%) | 126 (58.6%) |
| 65 to 74 Years | 107 (100.0%) | 28 (26.2%) |
| 75 Years and over | 122 (100.0%) | 87 (71.3%) |
| Total | 1,162 (61.9%) | 899 (47.9%) |
Disability Status by Sex by Age in Warm Springs
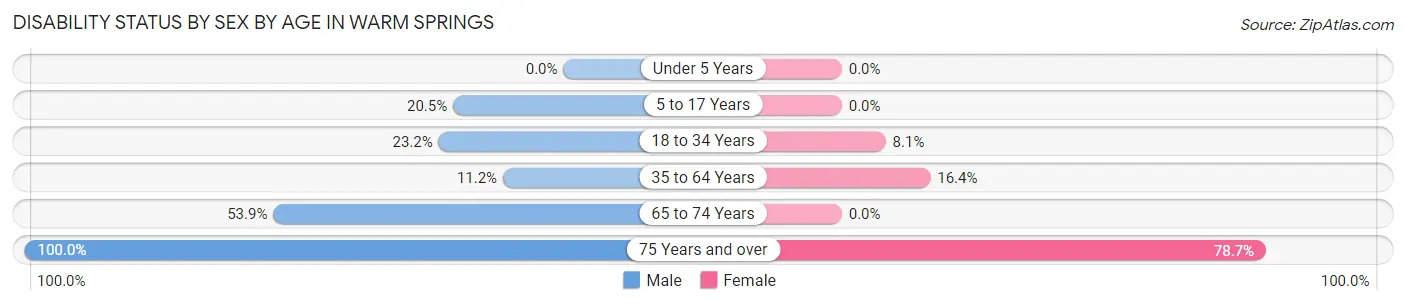
| Age Bracket | Male | Female |
| Under 5 Years | 0 (0.0%) | 0 (0.0%) |
| 5 to 17 Years | 35 (20.5%) | 0 (0.0%) |
| 18 to 34 Years | 66 (23.2%) | 14 (8.1%) |
| 35 to 64 Years | 37 (11.2%) | 56 (16.4%) |
| 65 to 74 Years | 28 (53.8%) | 0 (0.0%) |
| 75 Years and over | 28 (100.0%) | 74 (78.7%) |
Disability Class by Sex by Age in Warm Springs
Disability Class: Hearing Difficulty
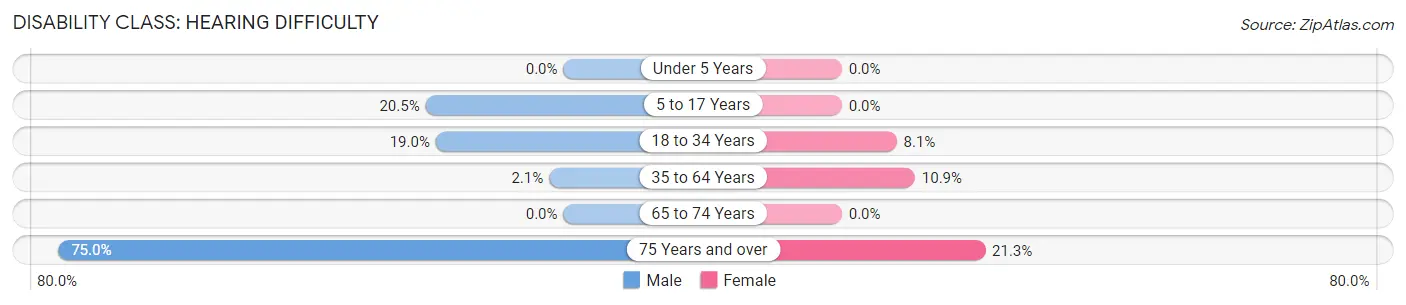
| Age Bracket | Male | Female |
| Under 5 Years | 0 (0.0%) | 0 (0.0%) |
| 5 to 17 Years | 35 (20.5%) | 0 (0.0%) |
| 18 to 34 Years | 54 (19.0%) | 14 (8.1%) |
| 35 to 64 Years | 7 (2.1%) | 37 (10.8%) |
| 65 to 74 Years | 0 (0.0%) | 0 (0.0%) |
| 75 Years and over | 21 (75.0%) | 20 (21.3%) |
Disability Class: Vision Difficulty
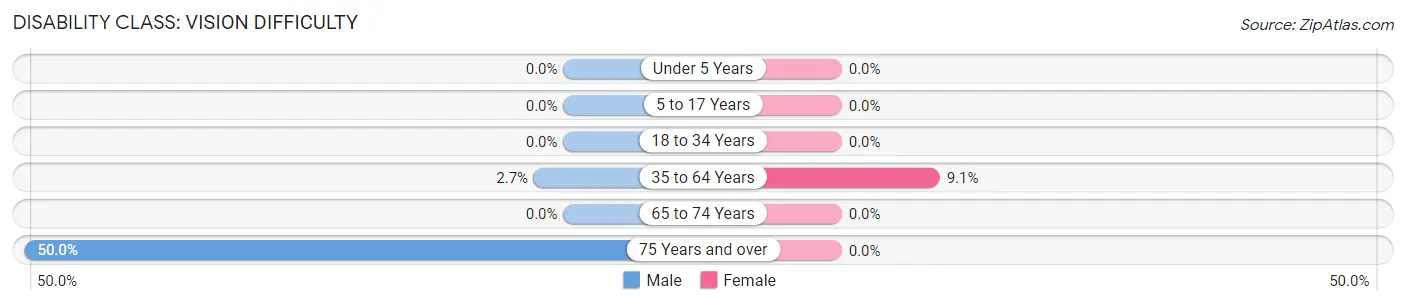
| Age Bracket | Male | Female |
| Under 5 Years | 0 (0.0%) | 0 (0.0%) |
| 5 to 17 Years | 0 (0.0%) | 0 (0.0%) |
| 18 to 34 Years | 0 (0.0%) | 0 (0.0%) |
| 35 to 64 Years | 9 (2.7%) | 31 (9.1%) |
| 65 to 74 Years | 0 (0.0%) | 0 (0.0%) |
| 75 Years and over | 14 (50.0%) | 0 (0.0%) |
Disability Class: Cognitive Difficulty
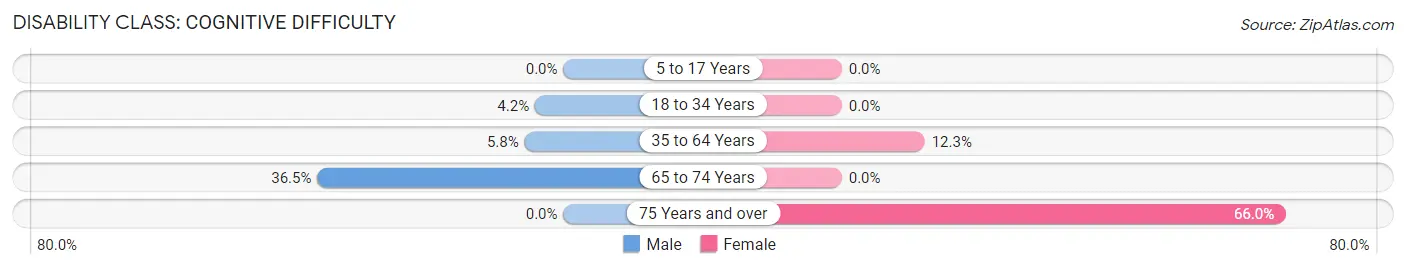
| Age Bracket | Male | Female |
| 5 to 17 Years | 0 (0.0%) | 0 (0.0%) |
| 18 to 34 Years | 12 (4.2%) | 0 (0.0%) |
| 35 to 64 Years | 19 (5.8%) | 42 (12.3%) |
| 65 to 74 Years | 19 (36.5%) | 0 (0.0%) |
| 75 Years and over | 0 (0.0%) | 62 (66.0%) |
Disability Class: Ambulatory Difficulty
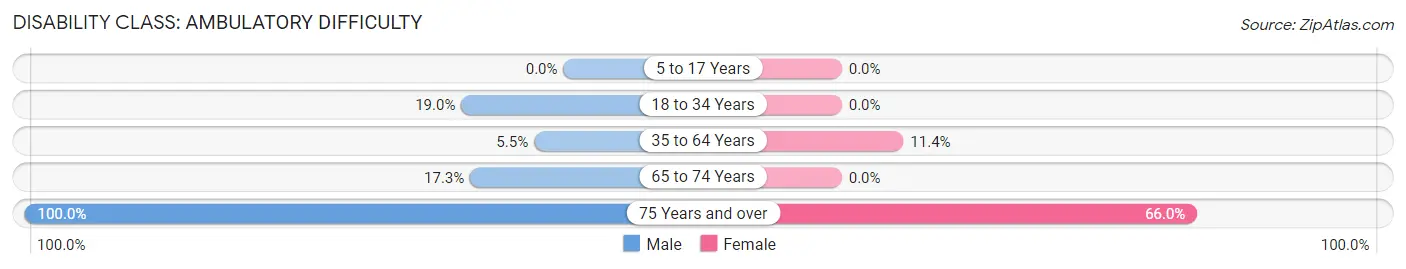
| Age Bracket | Male | Female |
| 5 to 17 Years | 0 (0.0%) | 0 (0.0%) |
| 18 to 34 Years | 54 (19.0%) | 0 (0.0%) |
| 35 to 64 Years | 18 (5.4%) | 39 (11.4%) |
| 65 to 74 Years | 9 (17.3%) | 0 (0.0%) |
| 75 Years and over | 28 (100.0%) | 62 (66.0%) |
Disability Class: Self-Care Difficulty
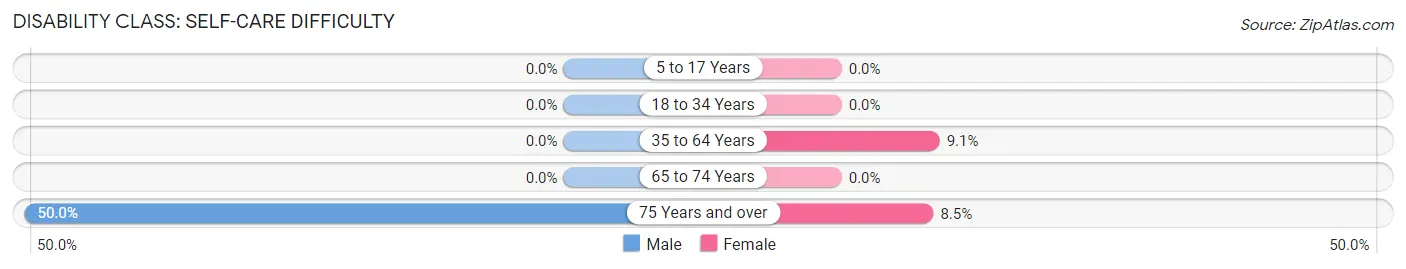
| Age Bracket | Male | Female |
| 5 to 17 Years | 0 (0.0%) | 0 (0.0%) |
| 18 to 34 Years | 0 (0.0%) | 0 (0.0%) |
| 35 to 64 Years | 0 (0.0%) | 31 (9.1%) |
| 65 to 74 Years | 0 (0.0%) | 0 (0.0%) |
| 75 Years and over | 14 (50.0%) | 8 (8.5%) |
Technology Access in Warm Springs
Computing Device Access in Warm Springs
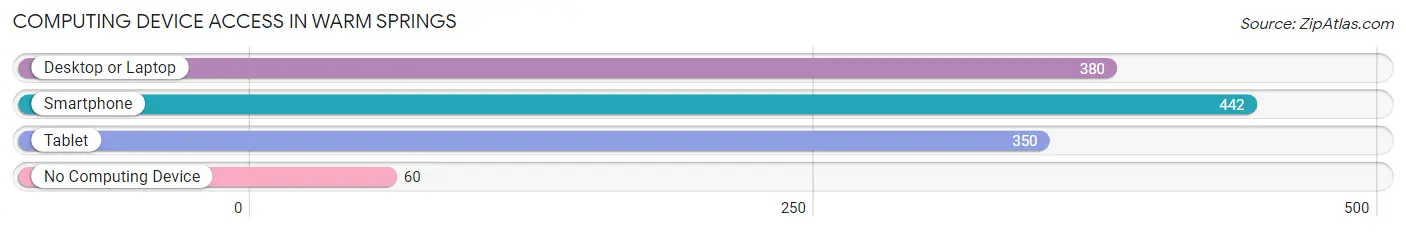
| Device Type | # Households | % Households |
| Desktop or Laptop | 380 | 70.0% |
| Smartphone | 442 | 81.4% |
| Tablet | 350 | 64.5% |
| No Computing Device | 60 | 11.1% |
| Total | 543 | 100.0% |
Internet Access in Warm Springs
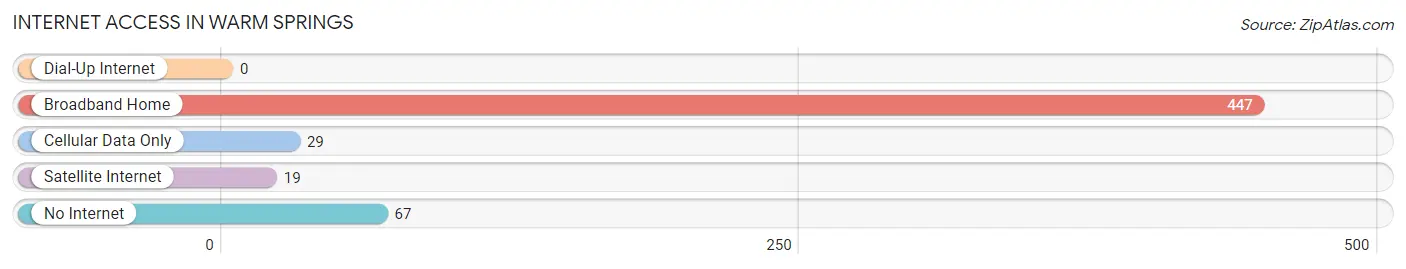
| Internet Type | # Households | % Households |
| Dial-Up Internet | 0 | 0.0% |
| Broadband Home | 447 | 82.3% |
| Cellular Data Only | 29 | 5.3% |
| Satellite Internet | 19 | 3.5% |
| No Internet | 67 | 12.3% |
| Total | 543 | 100.0% |
Warm Springs Summary
Warm Springs is a small unincorporated community located in the foothills of the Sierra Nevada Mountains in California. It is situated in the eastern part of Tuolumne County, approximately 25 miles east of Sonora. The community is located at an elevation of 2,400 feet and is surrounded by the Stanislaus National Forest.
History
The area now known as Warm Springs has been inhabited by Native Americans for thousands of years. The Miwok and Mono tribes were the primary inhabitants of the area, and they used the area for hunting, fishing, and gathering. The first European settlers arrived in the area in the mid-1800s, and the area was soon settled by miners and ranchers. The town of Warm Springs was established in 1875, and the first post office was established in 1876.
Geography
Warm Springs is located in the foothills of the Sierra Nevada Mountains in California. It is situated in the eastern part of Tuolumne County, approximately 25 miles east of Sonora. The community is located at an elevation of 2,400 feet and is surrounded by the Stanislaus National Forest. The area is characterized by rolling hills, oak woodlands, and grassy meadows. The climate is mild, with hot summers and cool winters.
Economy
The economy of Warm Springs is largely based on tourism and recreation. The area is popular with hikers, campers, and other outdoor enthusiasts. There are several campgrounds and recreational areas in the area, including the Stanislaus National Forest and the nearby Pinecrest Lake. The area is also home to several wineries and vineyards, as well as a number of small businesses.
Demographics
As of the 2010 census, the population of Warm Springs was 1,093. The population is primarily white (90.2%), with a small Hispanic population (4.2%). The median household income is $45,000, and the median age is 44. The unemployment rate is 8.2%.
Conclusion
Warm Springs is a small unincorporated community located in the foothills of the Sierra Nevada Mountains in California. It is situated in the eastern part of Tuolumne County, approximately 25 miles east of Sonora. The community is located at an elevation of 2,400 feet and is surrounded by the Stanislaus National Forest. The economy of Warm Springs is largely based on tourism and recreation, and the population is primarily white. The area is popular with hikers, campers, and other outdoor enthusiasts, and is home to several wineries and vineyards, as well as a number of small businesses.
Common Questions
What is Per Capita Income in Warm Springs?
Per Capita income in Warm Springs is $24,052.
What is the Median Family Income in Warm Springs?
Median Family Income in Warm Springs is $57,582.
What is the Median Household income in Warm Springs?
Median Household Income in Warm Springs is $70,750.
What is Income or Wage Gap in Warm Springs?
Income or Wage Gap in Warm Springs is 52.1%.
Women in Warm Springs earn 47.9 cents for every dollar earned by a man.
What is Inequality or Gini Index in Warm Springs?
Inequality or Gini Index in Warm Springs is 0.39.
What is the Total Population of Warm Springs?
Total Population of Warm Springs is 1,876.
What is the Total Male Population of Warm Springs?
Total Male Population of Warm Springs is 949.
What is the Total Female Population of Warm Springs?
Total Female Population of Warm Springs is 927.
What is the Ratio of Males per 100 Females in Warm Springs?
There are 102.37 Males per 100 Females in Warm Springs.
What is the Ratio of Females per 100 Males in Warm Springs?
There are 97.68 Females per 100 Males in Warm Springs.
What is the Median Population Age in Warm Springs?
Median Population Age in Warm Springs is 33.0 Years.
What is the Average Family Size in Warm Springs
Average Family Size in Warm Springs is 3.9 People.
What is the Average Household Size in Warm Springs
Average Household Size in Warm Springs is 3.5 People.
How Large is the Labor Force in Warm Springs?
There are 778 People in the Labor Forcein in Warm Springs.
What is the Percentage of People in the Labor Force in Warm Springs?
56.8% of People are in the Labor Force in Warm Springs.
What is the Unemployment Rate in Warm Springs?
Unemployment Rate in Warm Springs is 12.3%.