South Taft, CA Map & Demographics
South Taft Map
South Taft Overview
$14,887
PER CAPITA INCOME
$31,354
AVG FAMILY INCOME
$28,333
AVG HOUSEHOLD INCOME
30.3%
WAGE / INCOME GAP [ % ]
69.7¢/ $1
WAGE / INCOME GAP [ $ ]
0.53
INEQUALITY / GINI INDEX
2,370
TOTAL POPULATION
1,082
MALE POPULATION
1,288
FEMALE POPULATION
84.01
MALES / 100 FEMALES
119.04
FEMALES / 100 MALES
26.1
MEDIAN AGE
3.6
AVG FAMILY SIZE
3.5
AVG HOUSEHOLD SIZE
967
LABOR FORCE [ PEOPLE ]
56.7%
PERCENT IN LABOR FORCE
17.2%
UNEMPLOYMENT RATE
Income in South Taft
Income Overview in South Taft
Per Capita Income in South Taft is $14,887, while median incomes of families and households are $31,354 and $28,333 respectively.
| Characteristic | Number | Measure |
| Per Capita Income | 2,370 | $14,887 |
| Median Family Income | 556 | $31,354 |
| Mean Family Income | 556 | $50,439 |
| Median Household Income | 672 | $28,333 |
| Mean Household Income | 672 | $50,186 |
| Income Deficit | 556 | $0 |
| Wage / Income Gap (%) | 2,370 | 30.28% |
| Wage / Income Gap ($) | 2,370 | 69.72¢ per $1 |
| Gini / Inequality Index | 2,370 | 0.53 |
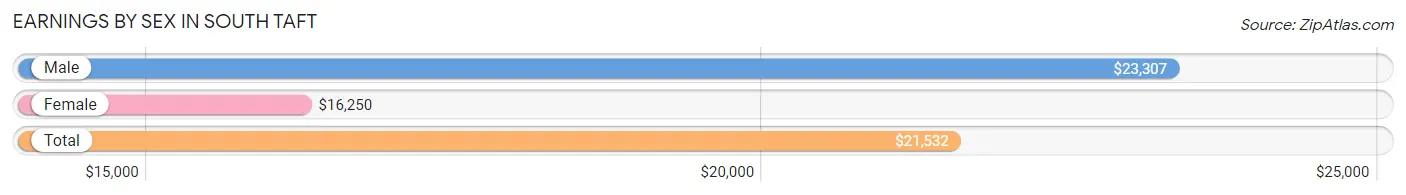
Earnings by Sex in South Taft
Average Earnings in South Taft are $21,532, $23,307 for men and $16,250 for women, a difference of 30.3%.
| Sex | Number | Average Earnings |
| Male | 460 (49.7%) | $23,307 |
| Female | 466 (50.3%) | $16,250 |
| Total | 926 (100.0%) | $21,532 |
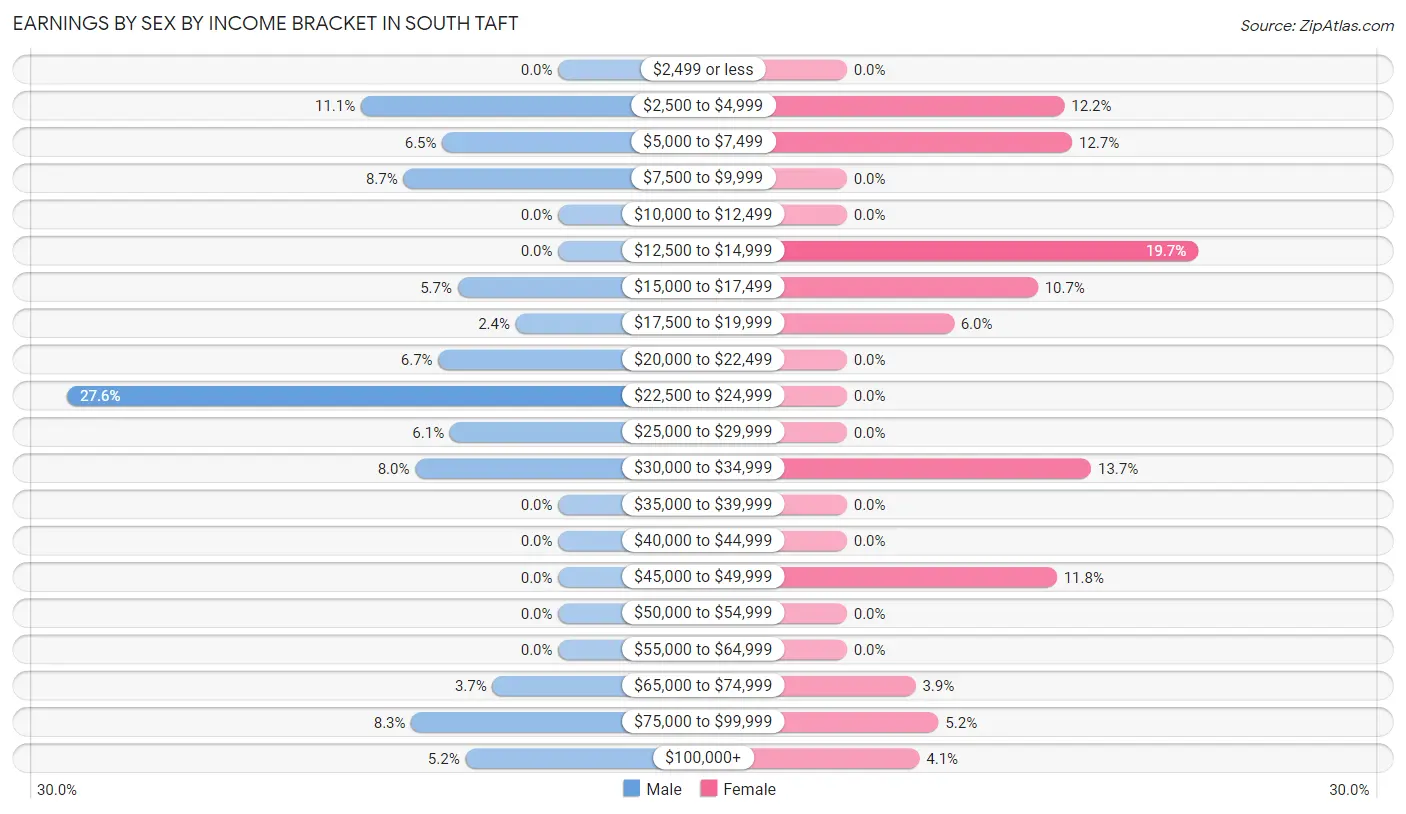
Earnings by Sex by Income Bracket in South Taft
The most common earnings brackets in South Taft are $22,500 to $24,999 for men (127 | 27.6%) and $12,500 to $14,999 for women (92 | 19.7%).
| Income | Male | Female |
| $2,499 or less | 0 (0.0%) | 0 (0.0%) |
| $2,500 to $4,999 | 51 (11.1%) | 57 (12.2%) |
| $5,000 to $7,499 | 30 (6.5%) | 59 (12.7%) |
| $7,500 to $9,999 | 40 (8.7%) | 0 (0.0%) |
| $10,000 to $12,499 | 0 (0.0%) | 0 (0.0%) |
| $12,500 to $14,999 | 0 (0.0%) | 92 (19.7%) |
| $15,000 to $17,499 | 26 (5.7%) | 50 (10.7%) |
| $17,500 to $19,999 | 11 (2.4%) | 28 (6.0%) |
| $20,000 to $22,499 | 31 (6.7%) | 0 (0.0%) |
| $22,500 to $24,999 | 127 (27.6%) | 0 (0.0%) |
| $25,000 to $29,999 | 28 (6.1%) | 0 (0.0%) |
| $30,000 to $34,999 | 37 (8.0%) | 64 (13.7%) |
| $35,000 to $39,999 | 0 (0.0%) | 0 (0.0%) |
| $40,000 to $44,999 | 0 (0.0%) | 0 (0.0%) |
| $45,000 to $49,999 | 0 (0.0%) | 55 (11.8%) |
| $50,000 to $54,999 | 0 (0.0%) | 0 (0.0%) |
| $55,000 to $64,999 | 0 (0.0%) | 0 (0.0%) |
| $65,000 to $74,999 | 17 (3.7%) | 18 (3.9%) |
| $75,000 to $99,999 | 38 (8.3%) | 24 (5.1%) |
| $100,000+ | 24 (5.2%) | 19 (4.1%) |
| Total | 460 (100.0%) | 466 (100.0%) |
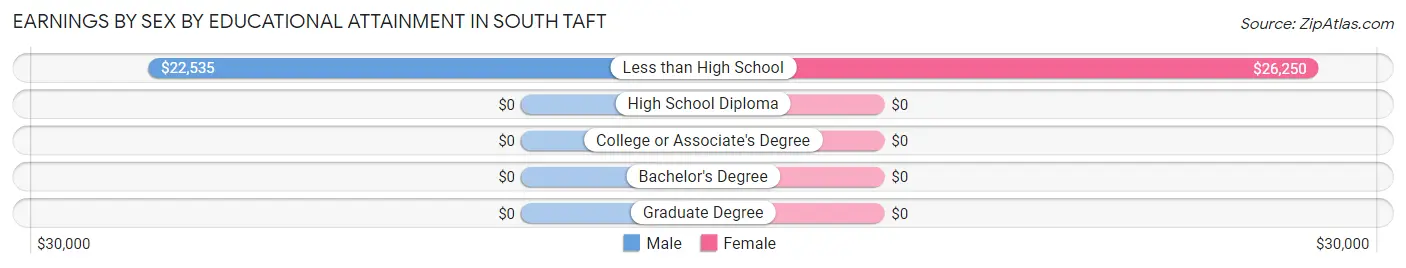
Earnings by Sex by Educational Attainment in South Taft
| Educational Attainment | Male Income | Female Income |
| Less than High School | $22,535 | $26,250 |
| High School Diploma | - | - |
| College or Associate's Degree | - | - |
| Bachelor's Degree | - | - |
| Graduate Degree | - | - |
| Total | $23,862 | $0 |
Family Income in South Taft
Family Income Brackets in South Taft
According to the South Taft family income data, there are 114 families falling into the less than $10,000 income range, which is the most common income bracket and makes up 20.5% of all families.
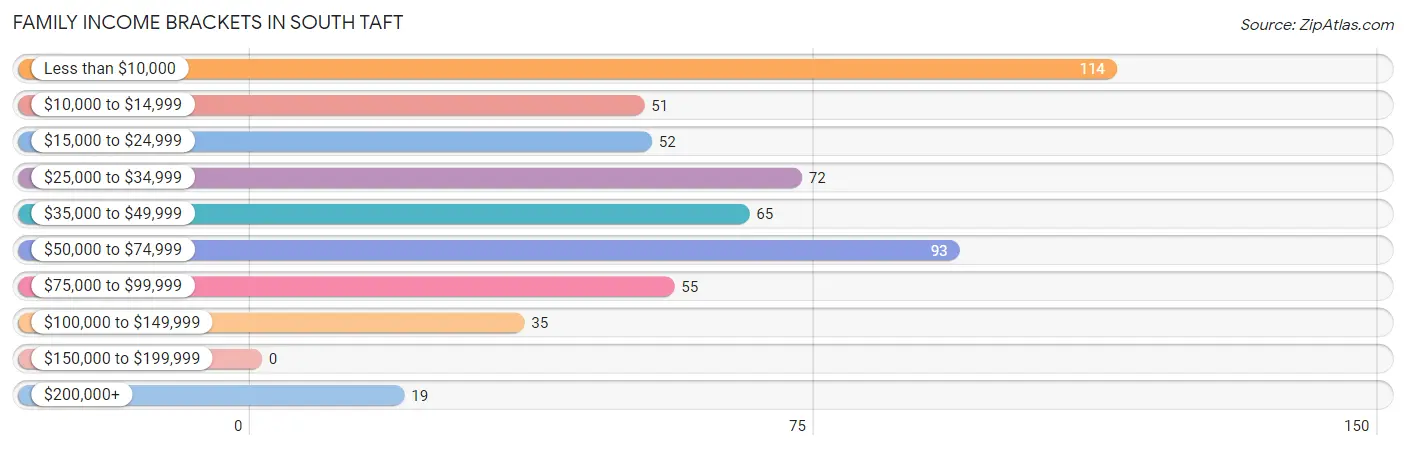
| Income Bracket | # Families | % Families |
| Less than $10,000 | 114 | 20.5% |
| $10,000 to $14,999 | 51 | 9.2% |
| $15,000 to $24,999 | 52 | 9.4% |
| $25,000 to $34,999 | 72 | 12.9% |
| $35,000 to $49,999 | 65 | 11.7% |
| $50,000 to $74,999 | 93 | 16.7% |
| $75,000 to $99,999 | 55 | 9.9% |
| $100,000 to $149,999 | 35 | 6.3% |
| $150,000 to $199,999 | 0 | 0.0% |
| $200,000+ | 19 | 3.4% |
Family Income by Famaliy Size in South Taft
4-person families (149 | 26.8%) account for the highest median family income in South Taft with $55,654 per family, while 4-person families (149 | 26.8%) have the highest median income of $13,914 per family member.
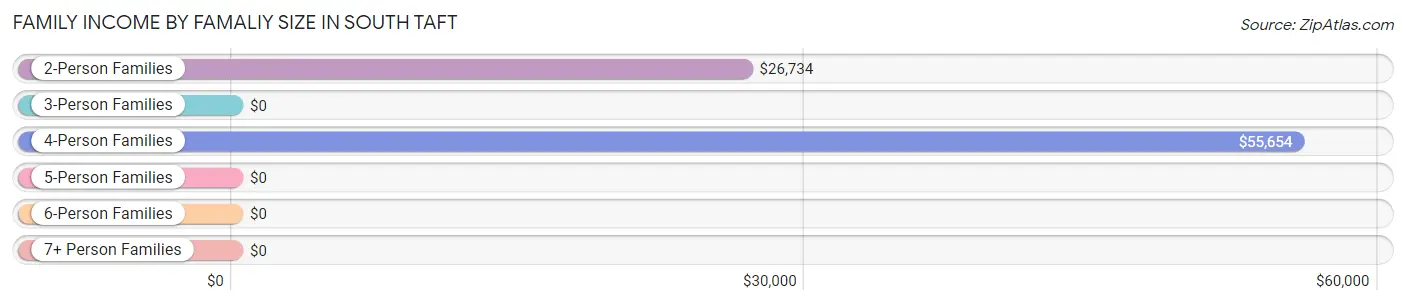
| Income Bracket | # Families | Median Income |
| 2-Person Families | 183 (32.9%) | $26,734 |
| 3-Person Families | 138 (24.8%) | $0 |
| 4-Person Families | 149 (26.8%) | $55,654 |
| 5-Person Families | 17 (3.1%) | $0 |
| 6-Person Families | 69 (12.4%) | $0 |
| 7+ Person Families | 0 (0.0%) | $0 |
| Total | 556 (100.0%) | $31,354 |
Family Income by Number of Earners in South Taft
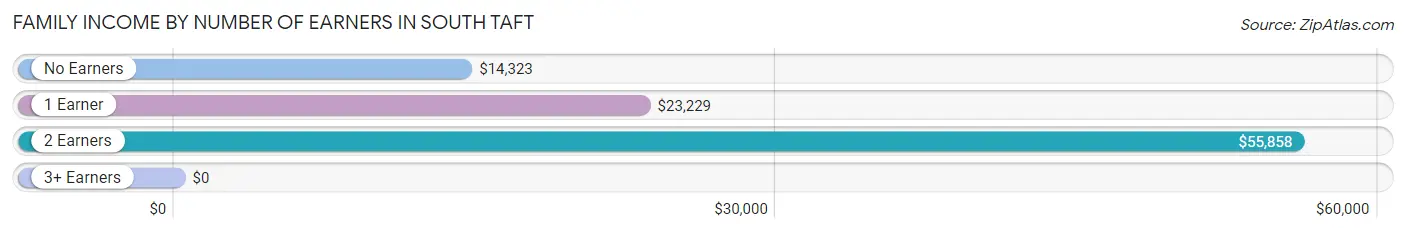
| Number of Earners | # Families | Median Income |
| No Earners | 155 (27.9%) | $14,323 |
| 1 Earner | 183 (32.9%) | $23,229 |
| 2 Earners | 187 (33.6%) | $55,858 |
| 3+ Earners | 31 (5.6%) | $0 |
| Total | 556 (100.0%) | $31,354 |
Household Income in South Taft
Household Income Brackets in South Taft
With 134 households falling in the category, the $50,000 to $74,999 income range is the most frequent in South Taft, accounting for 19.9% of all households. In contrast, only 17 households (2.5%) fall into the $150,000 to $199,999 income bracket, making it the least populous group.
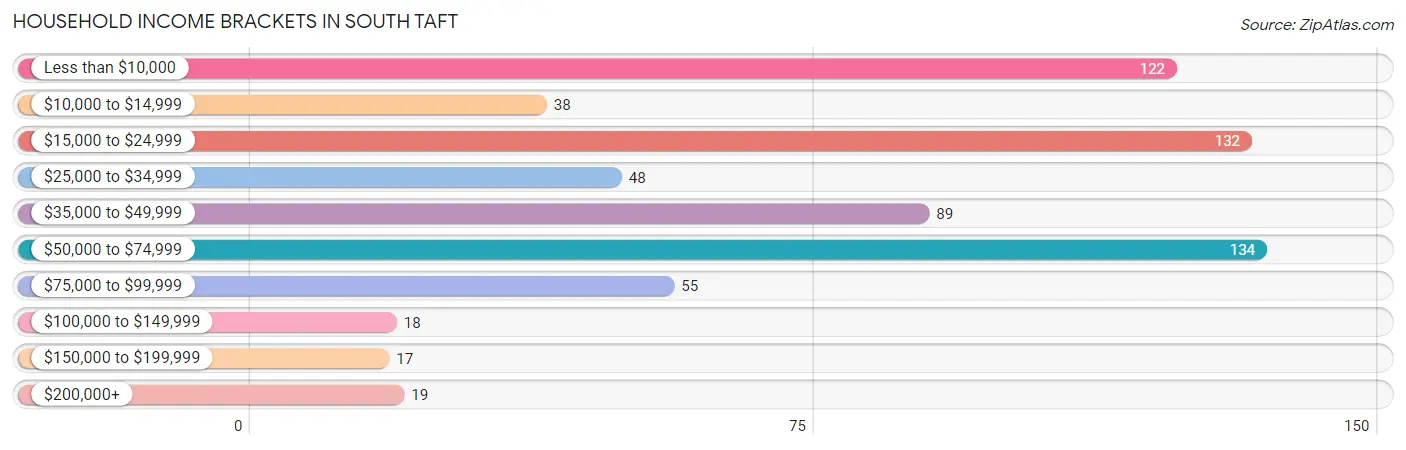
| Income Bracket | # Households | % Households |
| Less than $10,000 | 122 | 18.2% |
| $10,000 to $14,999 | 38 | 5.7% |
| $15,000 to $24,999 | 132 | 19.6% |
| $25,000 to $34,999 | 48 | 7.1% |
| $35,000 to $49,999 | 89 | 13.2% |
| $50,000 to $74,999 | 134 | 19.9% |
| $75,000 to $99,999 | 55 | 8.2% |
| $100,000 to $149,999 | 18 | 2.7% |
| $150,000 to $199,999 | 17 | 2.5% |
| $200,000+ | 19 | 2.8% |
Household Income by Householder Age in South Taft
The median household income in South Taft is $28,333, with the highest median household income of $49,469 found in the 25 to 44 years age bracket for the primary householder. A total of 195 households (29.0%) fall into this category. Meanwhile, the 15 to 24 years age bracket for the primary householder has the lowest median household income of $0, with 63 households (9.4%) in this group.
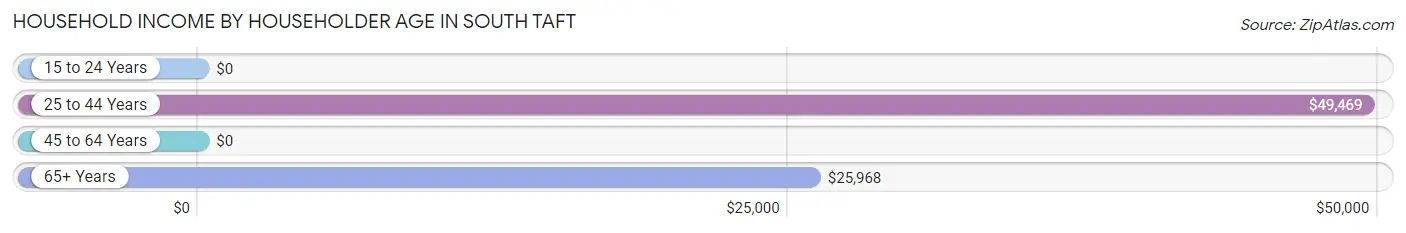
| Income Bracket | # Households | Median Income |
| 15 to 24 Years | 63 (9.4%) | $0 |
| 25 to 44 Years | 195 (29.0%) | $49,469 |
| 45 to 64 Years | 328 (48.8%) | $0 |
| 65+ Years | 86 (12.8%) | $25,968 |
| Total | 672 (100.0%) | $28,333 |
Poverty in South Taft
Income Below Poverty by Sex and Age in South Taft
With 41.7% poverty level for males and 33.5% for females among the residents of South Taft, 5 year old males and 12 to 14 year old females are the most vulnerable to poverty, with 26 males (100.0%) and 67 females (100.0%) in their respective age groups living below the poverty level.
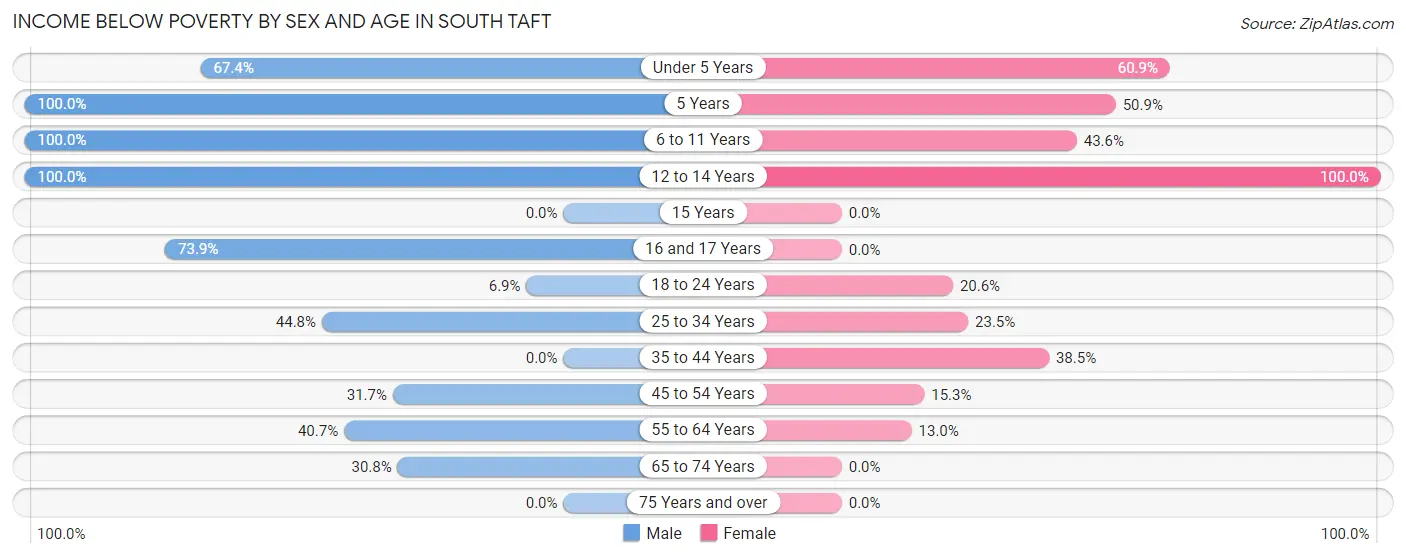
| Age Bracket | Male | Female |
| Under 5 Years | 66 (67.3%) | 98 (60.9%) |
| 5 Years | 26 (100.0%) | 30 (50.8%) |
| 6 to 11 Years | 42 (100.0%) | 41 (43.6%) |
| 12 to 14 Years | 71 (100.0%) | 67 (100.0%) |
| 15 Years | 0 (0.0%) | 0 (0.0%) |
| 16 and 17 Years | 34 (73.9%) | 0 (0.0%) |
| 18 to 24 Years | 14 (6.9%) | 39 (20.6%) |
| 25 to 34 Years | 78 (44.8%) | 34 (23.4%) |
| 35 to 44 Years | 0 (0.0%) | 85 (38.5%) |
| 45 to 54 Years | 44 (31.7%) | 17 (15.3%) |
| 55 to 64 Years | 68 (40.7%) | 21 (13.0%) |
| 65 to 74 Years | 8 (30.8%) | 0 (0.0%) |
| 75 Years and over | 0 (0.0%) | 0 (0.0%) |
| Total | 451 (41.7%) | 432 (33.5%) |
Income Above Poverty by Sex and Age in South Taft
According to the poverty statistics in South Taft, males aged 35 to 44 years and females aged 15 years are the age groups that are most secure financially, with 100.0% of males and 100.0% of females in these age groups living above the poverty line.
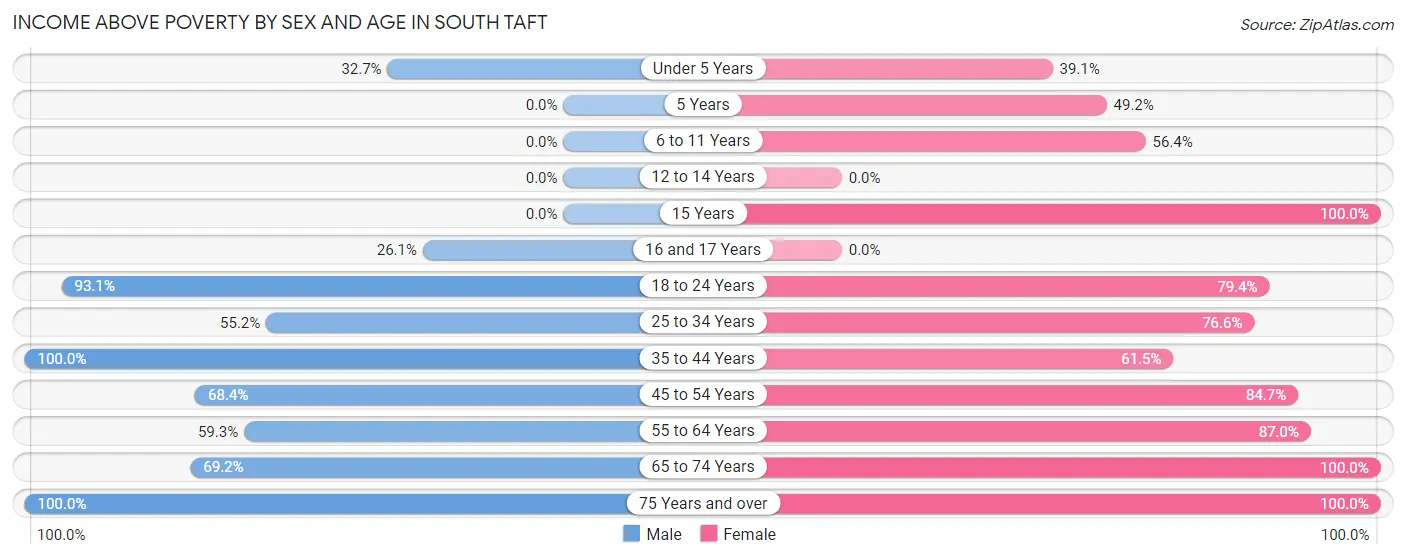
| Age Bracket | Male | Female |
| Under 5 Years | 32 (32.7%) | 63 (39.1%) |
| 5 Years | 0 (0.0%) | 29 (49.1%) |
| 6 to 11 Years | 0 (0.0%) | 53 (56.4%) |
| 12 to 14 Years | 0 (0.0%) | 0 (0.0%) |
| 15 Years | 0 (0.0%) | 47 (100.0%) |
| 16 and 17 Years | 12 (26.1%) | 0 (0.0%) |
| 18 to 24 Years | 190 (93.1%) | 150 (79.4%) |
| 25 to 34 Years | 96 (55.2%) | 111 (76.5%) |
| 35 to 44 Years | 34 (100.0%) | 136 (61.5%) |
| 45 to 54 Years | 95 (68.3%) | 94 (84.7%) |
| 55 to 64 Years | 99 (59.3%) | 141 (87.0%) |
| 65 to 74 Years | 18 (69.2%) | 20 (100.0%) |
| 75 Years and over | 55 (100.0%) | 12 (100.0%) |
| Total | 631 (58.3%) | 856 (66.5%) |
Income Below Poverty Among Married-Couple Families in South Taft
The poverty statistics for married-couple families in South Taft show that 20.4% or 65 of the total 318 families live below the poverty line. Families with 3 or 4 children have the highest poverty rate of 100.0%, comprising of 11 families. On the other hand, families with no children have the lowest poverty rate of 10.9%, which includes 22 families.
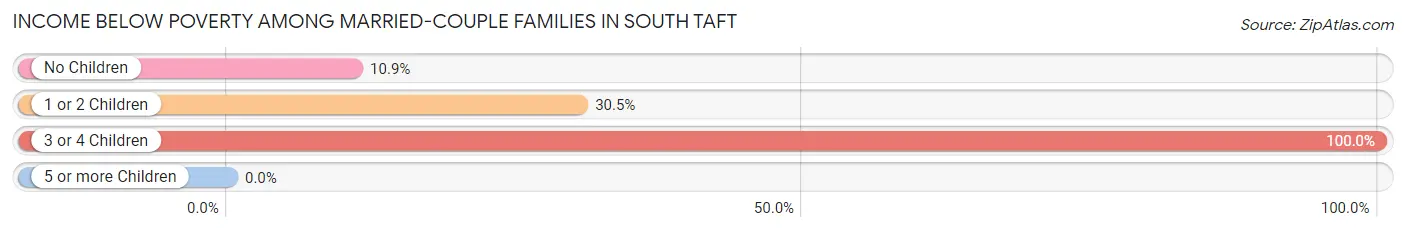
| Children | Above Poverty | Below Poverty |
| No Children | 180 (89.1%) | 22 (10.9%) |
| 1 or 2 Children | 73 (69.5%) | 32 (30.5%) |
| 3 or 4 Children | 0 (0.0%) | 11 (100.0%) |
| 5 or more Children | 0 (0.0%) | 0 (0.0%) |
| Total | 253 (79.6%) | 65 (20.4%) |
Income Below Poverty Among Single-Parent Households in South Taft
According to the poverty data in South Taft, 54.0% or 20 single-father households and 53.2% or 107 single-mother households are living below the poverty line. Among single-father households, those with 1 or 2 children have the highest poverty rate, with 16 households (100.0%) experiencing poverty. Likewise, among single-mother households, those with 3 or 4 children have the highest poverty rate, with 24 households (100.0%) falling below the poverty line.
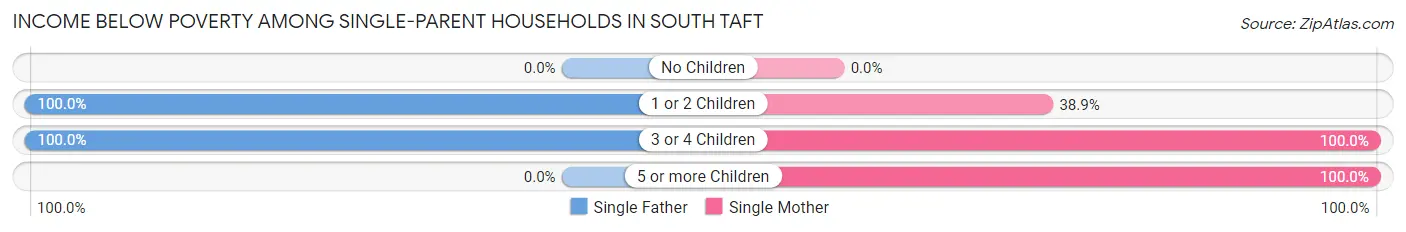
| Children | Single Father | Single Mother |
| No Children | 0 (0.0%) | 0 (0.0%) |
| 1 or 2 Children | 16 (100.0%) | 56 (38.9%) |
| 3 or 4 Children | 4 (100.0%) | 24 (100.0%) |
| 5 or more Children | 0 (0.0%) | 27 (100.0%) |
| Total | 20 (54.0%) | 107 (53.2%) |
Income Below Poverty Among Married-Couple vs Single-Parent Households in South Taft
The poverty data for South Taft shows that 65 of the married-couple family households (20.4%) and 127 of the single-parent households (53.4%) are living below the poverty level. Within the married-couple family households, those with 3 or 4 children have the highest poverty rate, with 11 households (100.0%) falling below the poverty line. Among the single-parent households, those with 3 or 4 children have the highest poverty rate, with 28 household (100.0%) living below poverty.
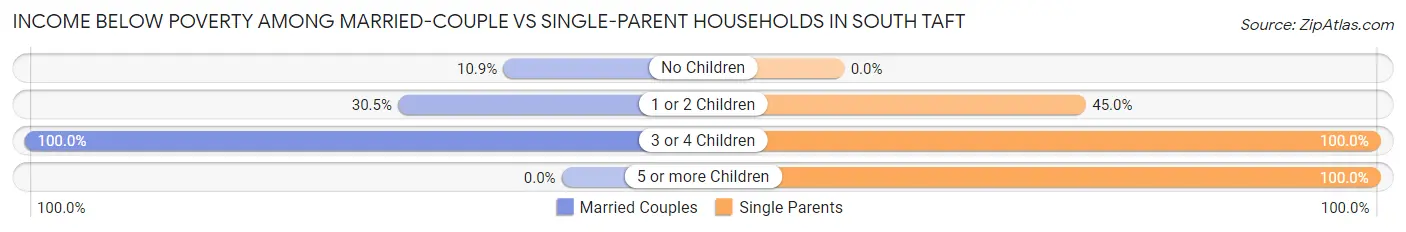
| Children | Married-Couple Families | Single-Parent Households |
| No Children | 22 (10.9%) | 0 (0.0%) |
| 1 or 2 Children | 32 (30.5%) | 72 (45.0%) |
| 3 or 4 Children | 11 (100.0%) | 28 (100.0%) |
| 5 or more Children | 0 (0.0%) | 27 (100.0%) |
| Total | 65 (20.4%) | 127 (53.4%) |
Race in South Taft
The most populous races in South Taft are Hispanic or Latino (1,645 | 69.4%), White / Caucasian (1,261 | 53.2%), and Some other Race (591 | 24.9%).
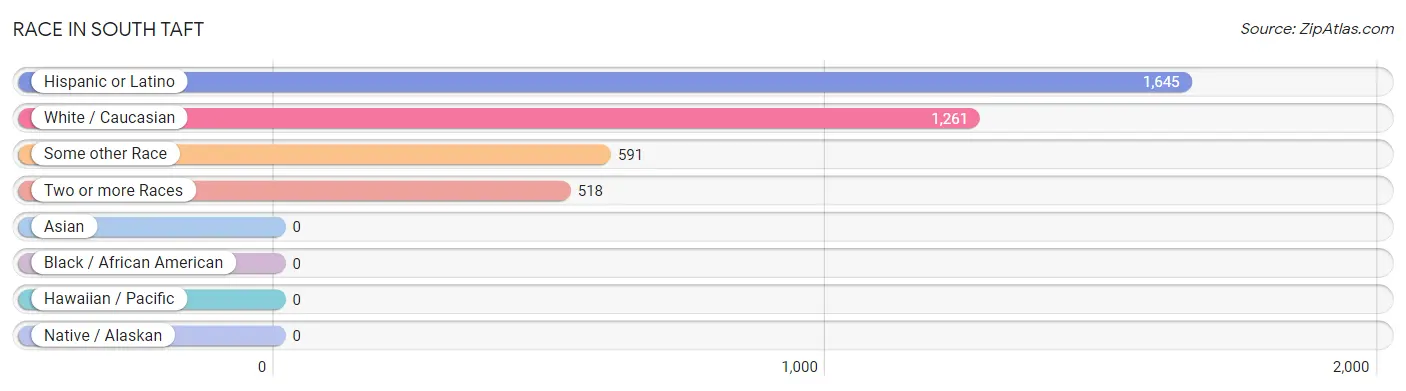
| Race | # Population | % Population |
| Asian | 0 | 0.0% |
| Black / African American | 0 | 0.0% |
| Hawaiian / Pacific | 0 | 0.0% |
| Hispanic or Latino | 1,645 | 69.4% |
| Native / Alaskan | 0 | 0.0% |
| White / Caucasian | 1,261 | 53.2% |
| Two or more Races | 518 | 21.9% |
| Some other Race | 591 | 24.9% |
| Total | 2,370 | 100.0% |
Ancestry in South Taft
The most populous ancestries reported in South Taft are Mexican (1,598 | 67.4%), Irish (141 | 5.9%), American (122 | 5.1%), German (120 | 5.1%), and Italian (118 | 5.0%), together accounting for 88.6% of all South Taft residents.
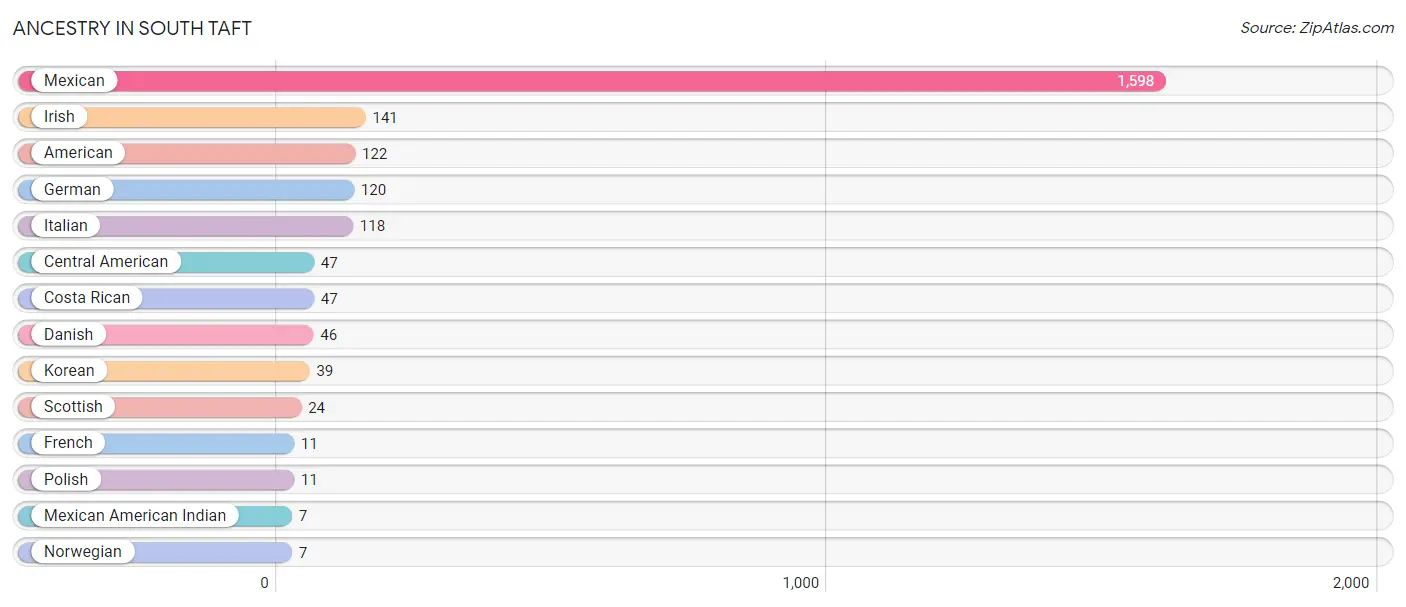
| Ancestry | # Population | % Population |
| American | 122 | 5.1% |
| Central American | 47 | 2.0% |
| Costa Rican | 47 | 2.0% |
| Danish | 46 | 1.9% |
| French | 11 | 0.5% |
| German | 120 | 5.1% |
| Irish | 141 | 5.9% |
| Italian | 118 | 5.0% |
| Korean | 39 | 1.7% |
| Mexican | 1,598 | 67.4% |
| Mexican American Indian | 7 | 0.3% |
| Norwegian | 7 | 0.3% |
| Polish | 11 | 0.5% |
| Scottish | 24 | 1.0% | View All 14 Rows |
Immigrants in South Taft
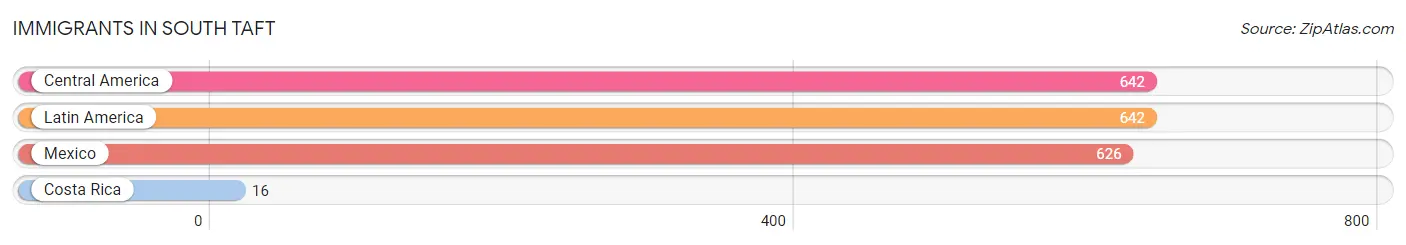
The most numerous immigrant groups reported in South Taft came from Central America (642 | 27.1%), Latin America (642 | 27.1%), Mexico (626 | 26.4%), and Costa Rica (16 | 0.7%), together accounting for 81.3% of all South Taft residents.
| Immigration Origin | # Population | % Population |
| Central America | 642 | 27.1% |
| Costa Rica | 16 | 0.7% |
| Latin America | 642 | 27.1% |
| Mexico | 626 | 26.4% | View All 4 Rows |
Sex and Age in South Taft
Sex and Age in South Taft
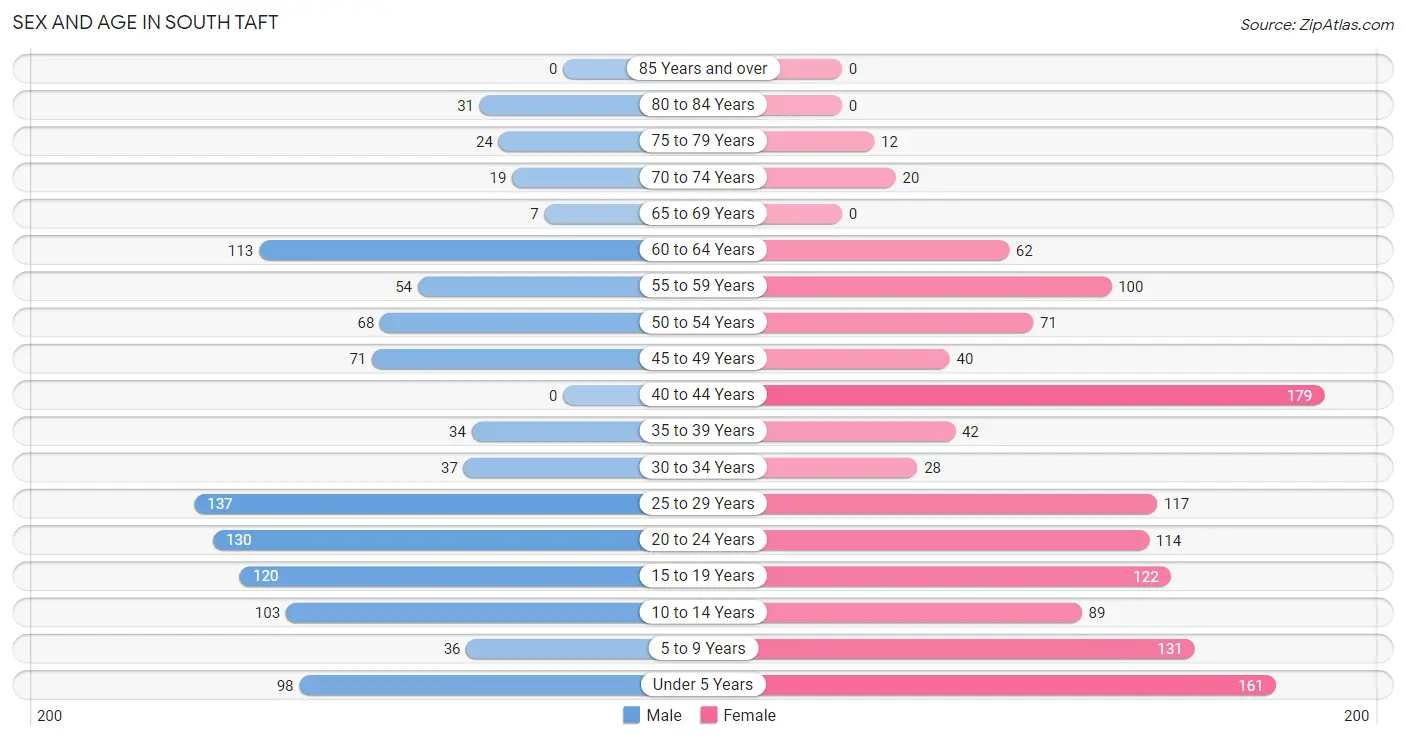
The most populous age groups in South Taft are 25 to 29 Years (137 | 12.7%) for men and 40 to 44 Years (179 | 13.9%) for women.
| Age Bracket | Male | Female |
| Under 5 Years | 98 (9.1%) | 161 (12.5%) |
| 5 to 9 Years | 36 (3.3%) | 131 (10.2%) |
| 10 to 14 Years | 103 (9.5%) | 89 (6.9%) |
| 15 to 19 Years | 120 (11.1%) | 122 (9.5%) |
| 20 to 24 Years | 130 (12.0%) | 114 (8.8%) |
| 25 to 29 Years | 137 (12.7%) | 117 (9.1%) |
| 30 to 34 Years | 37 (3.4%) | 28 (2.2%) |
| 35 to 39 Years | 34 (3.1%) | 42 (3.3%) |
| 40 to 44 Years | 0 (0.0%) | 179 (13.9%) |
| 45 to 49 Years | 71 (6.6%) | 40 (3.1%) |
| 50 to 54 Years | 68 (6.3%) | 71 (5.5%) |
| 55 to 59 Years | 54 (5.0%) | 100 (7.8%) |
| 60 to 64 Years | 113 (10.4%) | 62 (4.8%) |
| 65 to 69 Years | 7 (0.6%) | 0 (0.0%) |
| 70 to 74 Years | 19 (1.8%) | 20 (1.5%) |
| 75 to 79 Years | 24 (2.2%) | 12 (0.9%) |
| 80 to 84 Years | 31 (2.9%) | 0 (0.0%) |
| 85 Years and over | 0 (0.0%) | 0 (0.0%) |
| Total | 1,082 (100.0%) | 1,288 (100.0%) |
Families and Households in South Taft
Median Family Size in South Taft
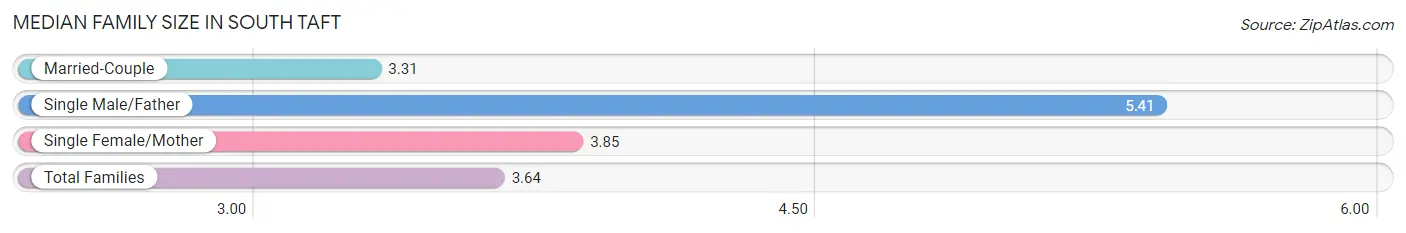
The median family size in South Taft is 3.64 persons per family, with single male/father families (37 | 6.7%) accounting for the largest median family size of 5.41 persons per family. On the other hand, married-couple families (318 | 57.2%) represent the smallest median family size with 3.31 persons per family.
| Family Type | # Families | Family Size |
| Married-Couple | 318 (57.2%) | 3.31 |
| Single Male/Father | 37 (6.7%) | 5.41 |
| Single Female/Mother | 201 (36.1%) | 3.85 |
| Total Families | 556 (100.0%) | 3.64 |
Median Household Size in South Taft
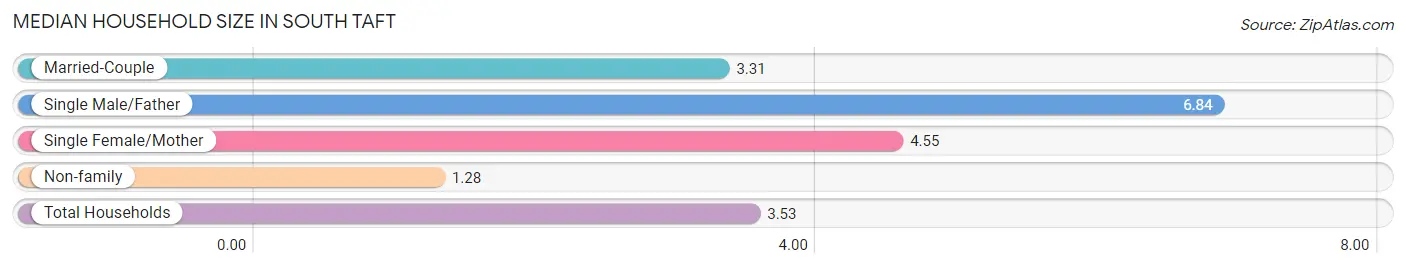
The median household size in South Taft is 3.53 persons per household, with single male/father households (37 | 5.5%) accounting for the largest median household size of 6.84 persons per household. non-family households (116 | 17.3%) represent the smallest median household size with 1.28 persons per household.
| Household Type | # Households | Household Size |
| Married-Couple | 318 (47.3%) | 3.31 |
| Single Male/Father | 37 (5.5%) | 6.84 |
| Single Female/Mother | 201 (29.9%) | 4.55 |
| Non-family | 116 (17.3%) | 1.28 |
| Total Households | 672 (100.0%) | 3.53 |
Household Size by Marriage Status in South Taft
Out of a total of 672 households in South Taft, 556 (82.7%) are family households, while 116 (17.3%) are nonfamily households. The most numerous type of family households are 2-person households, comprising 171, and the most common type of nonfamily households are 1-person households, comprising 86.

| Household Size | Family Households | Nonfamily Households |
| 1-Person Households | - | 86 (12.8%) |
| 2-Person Households | 171 (25.5%) | 30 (4.5%) |
| 3-Person Households | 123 (18.3%) | 0 (0.0%) |
| 4-Person Households | 124 (18.4%) | 0 (0.0%) |
| 5-Person Households | 52 (7.7%) | 0 (0.0%) |
| 6-Person Households | 42 (6.2%) | 0 (0.0%) |
| 7+ Person Households | 44 (6.6%) | 0 (0.0%) |
| Total | 556 (82.7%) | 116 (17.3%) |
Female Fertility in South Taft
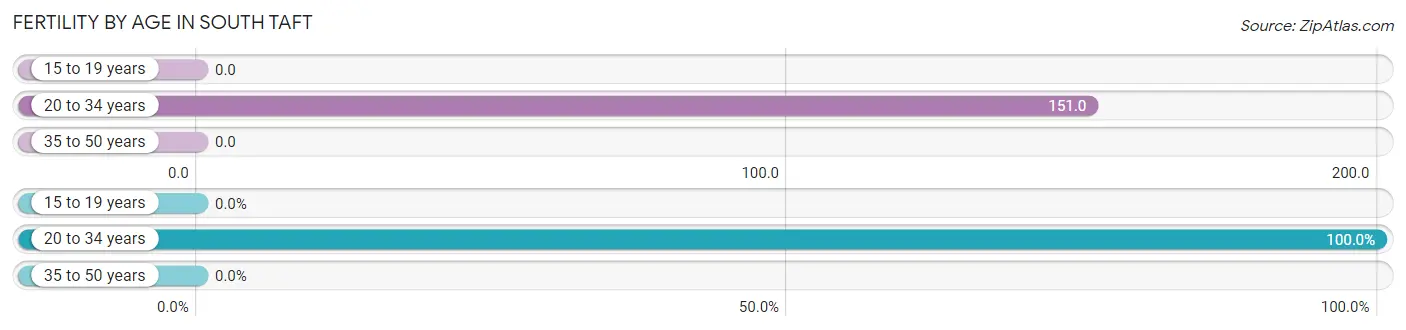
Fertility by Age in South Taft
Average fertility rate in South Taft is 61.0 births per 1,000 women. Women in the age bracket of 20 to 34 years have the highest fertility rate with 151.0 births per 1,000 women. Women in the age bracket of 20 to 34 years acount for 100.0% of all women with births.
| Age Bracket | Women with Births | Births / 1,000 Women |
| 15 to 19 years | 0 (0.0%) | 0.0 |
| 20 to 34 years | 39 (100.0%) | 151.0 |
| 35 to 50 years | 0 (0.0%) | 0.0 |
| Total | 39 (100.0%) | 61.0 |
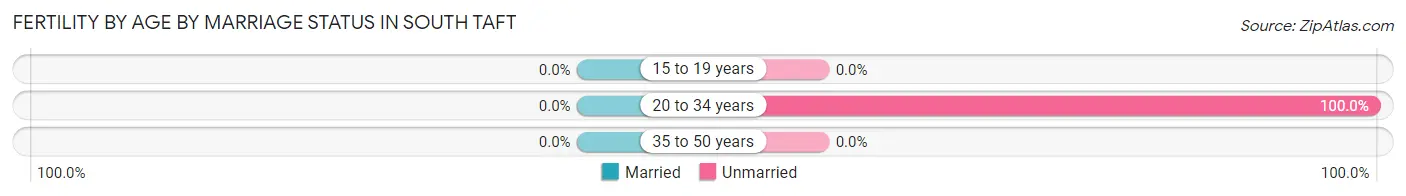
Fertility by Age by Marriage Status in South Taft
| Age Bracket | Married | Unmarried |
| 15 to 19 years | 0 (0.0%) | 0 (0.0%) |
| 20 to 34 years | 0 (0.0%) | 39 (100.0%) |
| 35 to 50 years | 0 (0.0%) | 0 (0.0%) |
| Total | 0 (0.0%) | 39 (100.0%) |
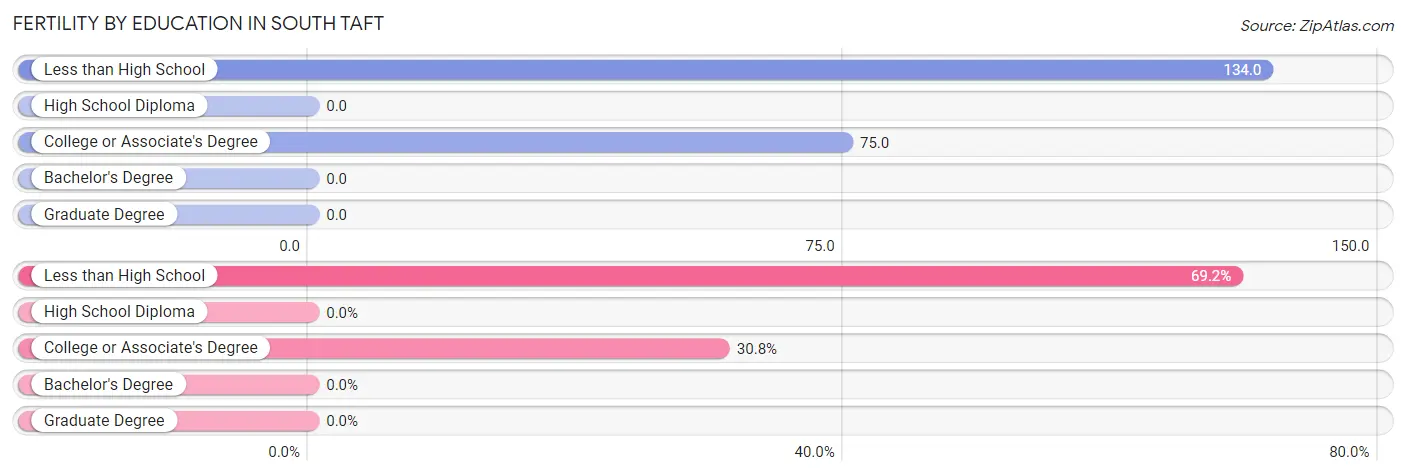
Fertility by Education in South Taft
| Educational Attainment | Women with Births | Births / 1,000 Women |
| Less than High School | 27 (69.2%) | 134.0 |
| High School Diploma | 0 (0.0%) | 0.0 |
| College or Associate's Degree | 12 (30.8%) | 75.0 |
| Bachelor's Degree | 0 (0.0%) | 0.0 |
| Graduate Degree | 0 (0.0%) | 0.0 |
| Total | 39 (100.0%) | 61.0 |
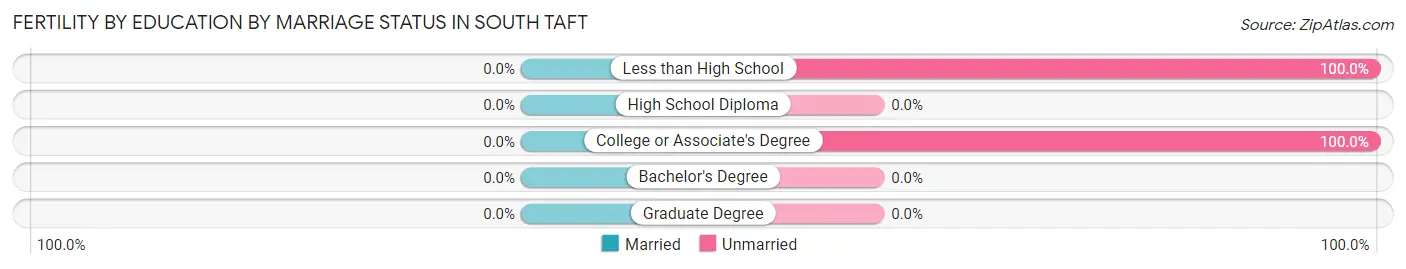
Fertility by Education by Marriage Status in South Taft
| Educational Attainment | Married | Unmarried |
| Less than High School | 0 (0.0%) | 27 (100.0%) |
| High School Diploma | 0 (0.0%) | 0 (0.0%) |
| College or Associate's Degree | 0 (0.0%) | 12 (100.0%) |
| Bachelor's Degree | 0 (0.0%) | 0 (0.0%) |
| Graduate Degree | 0 (0.0%) | 0 (0.0%) |
| Total | 0 (0.0%) | 39 (100.0%) |
Employment Characteristics in South Taft
Employment by Class of Employer in South Taft
Among the 744 employed individuals in South Taft, private company employees (594 | 79.8%), not-for-profit organizations (80 | 10.7%), and local government employees (29 | 3.9%) make up the most common classes of employment.
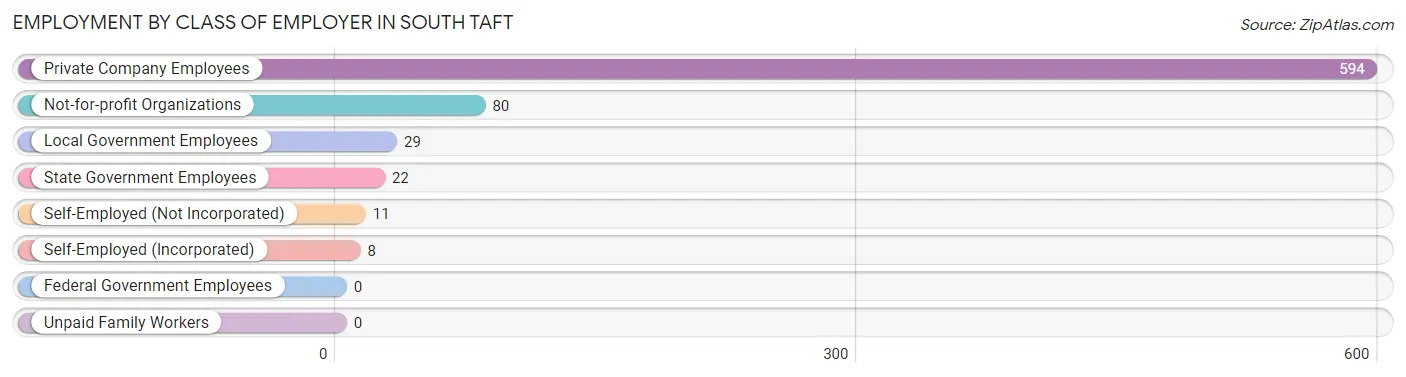
| Employer Class | # Employees | % Employees |
| Private Company Employees | 594 | 79.8% |
| Self-Employed (Incorporated) | 8 | 1.1% |
| Self-Employed (Not Incorporated) | 11 | 1.5% |
| Not-for-profit Organizations | 80 | 10.7% |
| Local Government Employees | 29 | 3.9% |
| State Government Employees | 22 | 3.0% |
| Federal Government Employees | 0 | 0.0% |
| Unpaid Family Workers | 0 | 0.0% |
| Total | 744 | 100.0% |
Employment Status by Age in South Taft
According to the labor force statistics for South Taft, out of the total population over 16 years of age (1,705), 56.7% or 967 individuals are in the labor force, with 17.2% or 166 of them unemployed. The age group with the highest labor force participation rate is 25 to 29 years, with 96.1% or 244 individuals in the labor force. Within the labor force, the 16 to 19 years age range has the highest percentage of unemployed individuals, with 100.0% or 89 of them being unemployed.
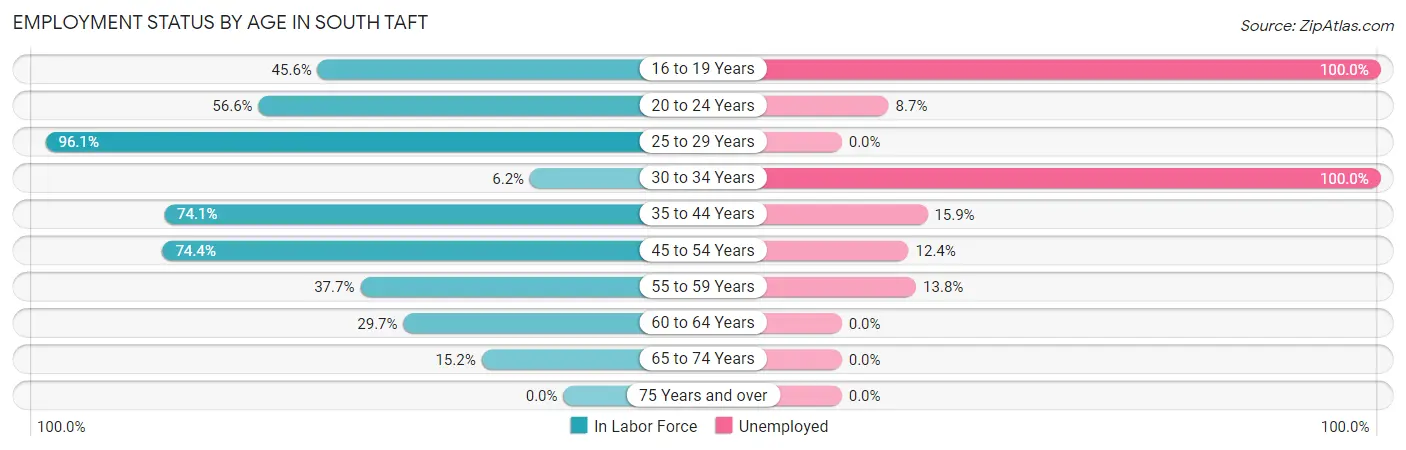
| Age Bracket | In Labor Force | Unemployed |
| 16 to 19 Years | 89 (45.6%) | 89 (100.0%) |
| 20 to 24 Years | 138 (56.6%) | 12 (8.7%) |
| 25 to 29 Years | 244 (96.1%) | 0 (0.0%) |
| 30 to 34 Years | 4 (6.2%) | 4 (100.0%) |
| 35 to 44 Years | 189 (74.1%) | 30 (15.9%) |
| 45 to 54 Years | 186 (74.4%) | 23 (12.4%) |
| 55 to 59 Years | 58 (37.7%) | 8 (13.8%) |
| 60 to 64 Years | 52 (29.7%) | 0 (0.0%) |
| 65 to 74 Years | 7 (15.2%) | 0 (0.0%) |
| 75 Years and over | 0 (0.0%) | 0 (0.0%) |
| Total | 967 (56.7%) | 166 (17.2%) |
Employment Status by Educational Attainment in South Taft
According to labor force statistics for South Taft, 63.6% of individuals (733) out of the total population between 25 and 64 years of age (1,153) are in the labor force, with 8.9% or 65 of them being unemployed. The group with the highest labor force participation rate are those with the educational attainment of bachelor's degree or higher, with 100.0% or 84 individuals in the labor force. Within the labor force, individuals with bachelor's degree or higher education have the highest percentage of unemployment, with 35.7% or 30 of them being unemployed.
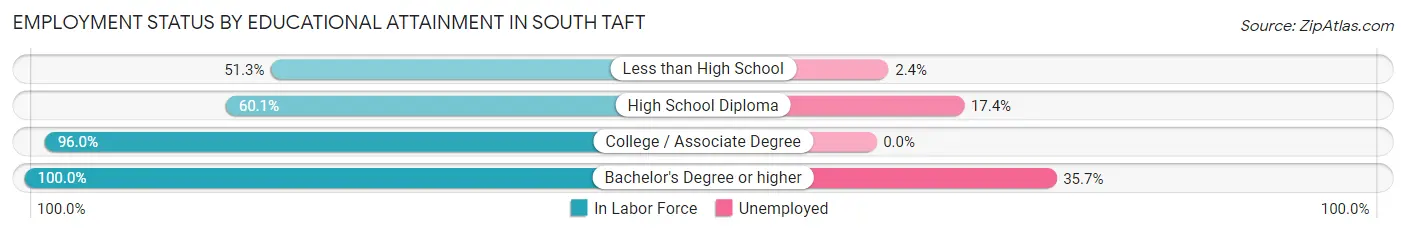
| Educational Attainment | In Labor Force | Unemployed |
| Less than High School | 327 (51.3%) | 15 (2.4%) |
| High School Diploma | 155 (60.1%) | 45 (17.4%) |
| College / Associate Degree | 167 (96.0%) | 0 (0.0%) |
| Bachelor's Degree or higher | 84 (100.0%) | 30 (35.7%) |
| Total | 733 (63.6%) | 103 (8.9%) |
Employment Occupations by Sex in South Taft
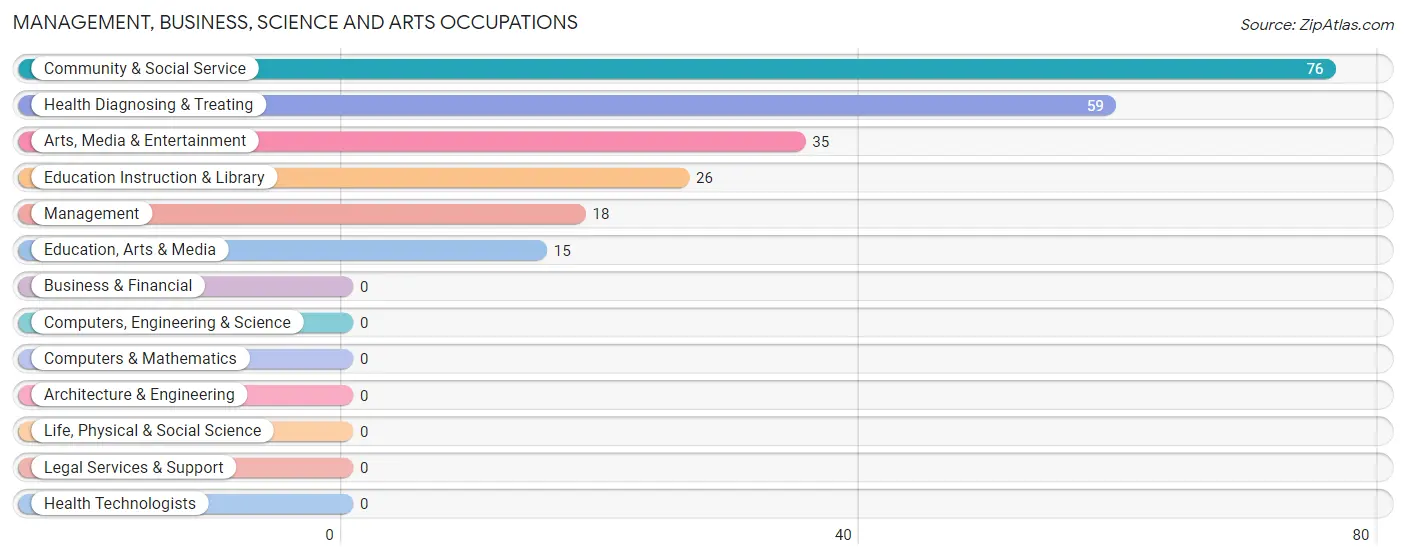
Management, Business, Science and Arts Occupations
The most common Management, Business, Science and Arts occupations in South Taft are Community & Social Service (76 | 9.5%), Health Diagnosing & Treating (59 | 7.4%), Arts, Media & Entertainment (35 | 4.4%), Education Instruction & Library (26 | 3.3%), and Management (18 | 2.2%).
Management, Business, Science and Arts Occupations by Sex
Within the Management, Business, Science and Arts occupations in South Taft, the most male-oriented occupations are Education Instruction & Library (69.2%), and Community & Social Service (23.7%), while the most female-oriented occupations are Management (100.0%), Education, Arts & Media (100.0%), and Arts, Media & Entertainment (100.0%).
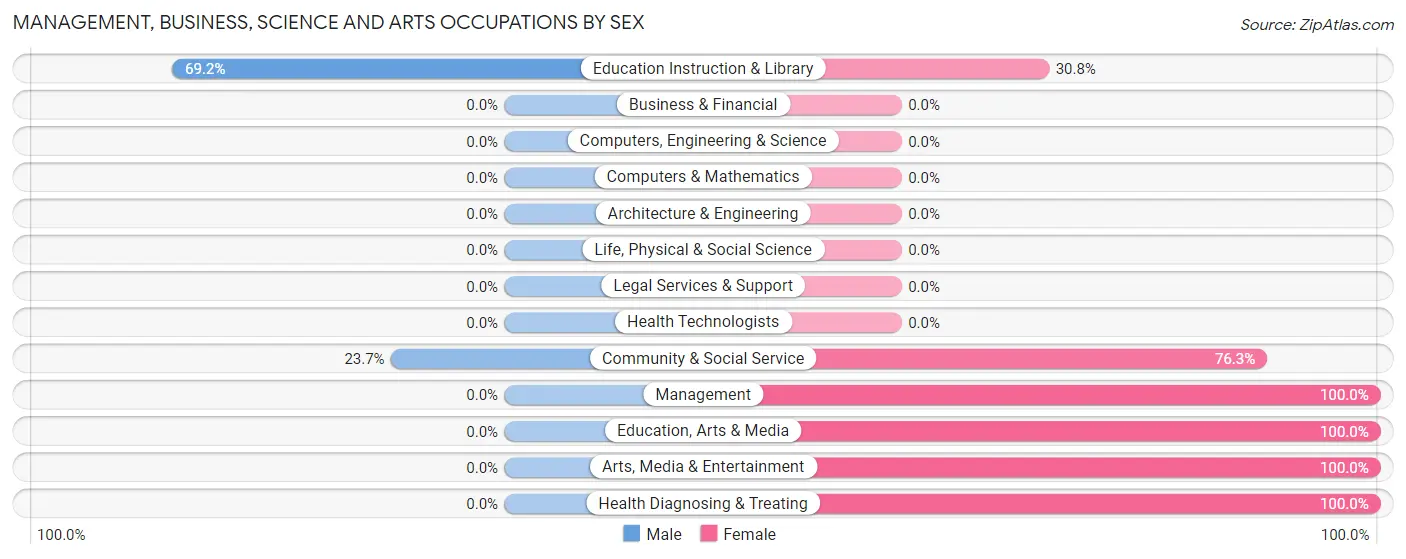
| Occupation | Male | Female |
| Management | 0 (0.0%) | 18 (100.0%) |
| Business & Financial | 0 (0.0%) | 0 (0.0%) |
| Computers, Engineering & Science | 0 (0.0%) | 0 (0.0%) |
| Computers & Mathematics | 0 (0.0%) | 0 (0.0%) |
| Architecture & Engineering | 0 (0.0%) | 0 (0.0%) |
| Life, Physical & Social Science | 0 (0.0%) | 0 (0.0%) |
| Community & Social Service | 18 (23.7%) | 58 (76.3%) |
| Education, Arts & Media | 0 (0.0%) | 15 (100.0%) |
| Legal Services & Support | 0 (0.0%) | 0 (0.0%) |
| Education Instruction & Library | 18 (69.2%) | 8 (30.8%) |
| Arts, Media & Entertainment | 0 (0.0%) | 35 (100.0%) |
| Health Diagnosing & Treating | 0 (0.0%) | 59 (100.0%) |
| Health Technologists | 0 (0.0%) | 0 (0.0%) |
| Total (Category) | 18 (11.8%) | 135 (88.2%) |
| Total (Overall) | 401 (50.1%) | 400 (49.9%) |
Services Occupations
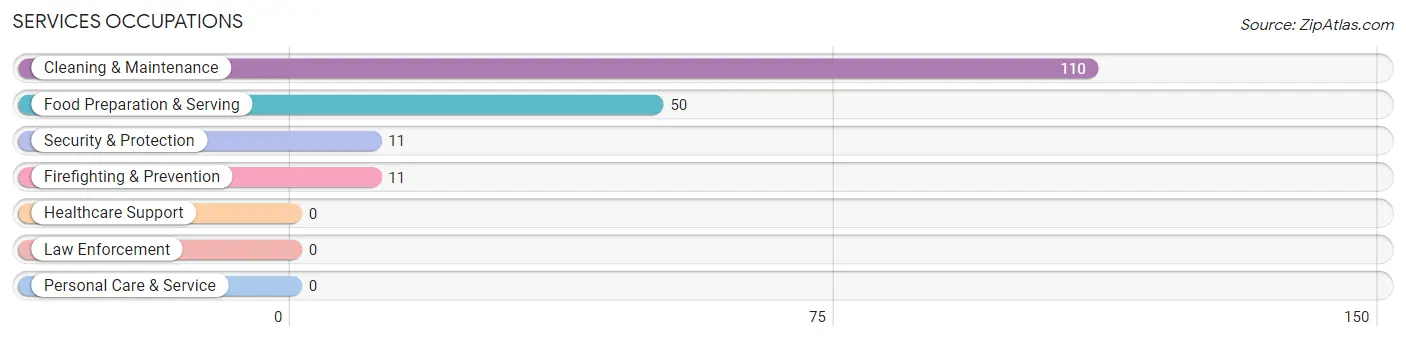
The most common Services occupations in South Taft are Cleaning & Maintenance (110 | 13.7%), Food Preparation & Serving (50 | 6.2%), Security & Protection (11 | 1.4%), and Firefighting & Prevention (11 | 1.4%).
Services Occupations by Sex
Within the Services occupations in South Taft, the most male-oriented occupations are Security & Protection (100.0%), Firefighting & Prevention (100.0%), and Cleaning & Maintenance (78.2%), while the most female-oriented occupations are Food Preparation & Serving (40.0%), and Cleaning & Maintenance (21.8%).
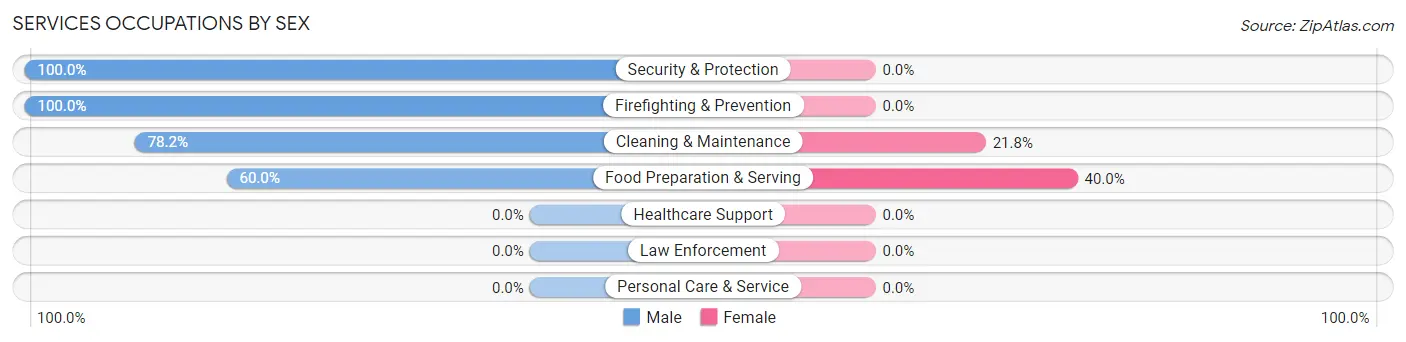
| Occupation | Male | Female |
| Healthcare Support | 0 (0.0%) | 0 (0.0%) |
| Security & Protection | 11 (100.0%) | 0 (0.0%) |
| Firefighting & Prevention | 11 (100.0%) | 0 (0.0%) |
| Law Enforcement | 0 (0.0%) | 0 (0.0%) |
| Food Preparation & Serving | 30 (60.0%) | 20 (40.0%) |
| Cleaning & Maintenance | 86 (78.2%) | 24 (21.8%) |
| Personal Care & Service | 0 (0.0%) | 0 (0.0%) |
| Total (Category) | 127 (74.3%) | 44 (25.7%) |
| Total (Overall) | 401 (50.1%) | 400 (49.9%) |
Sales and Office Occupations
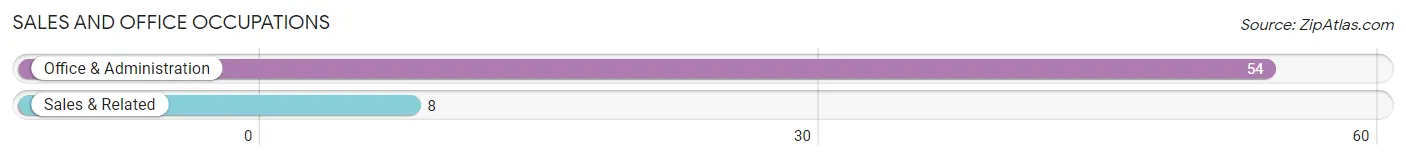
The most common Sales and Office occupations in South Taft are Office & Administration (54 | 6.7%), and Sales & Related (8 | 1.0%).
Sales and Office Occupations by Sex
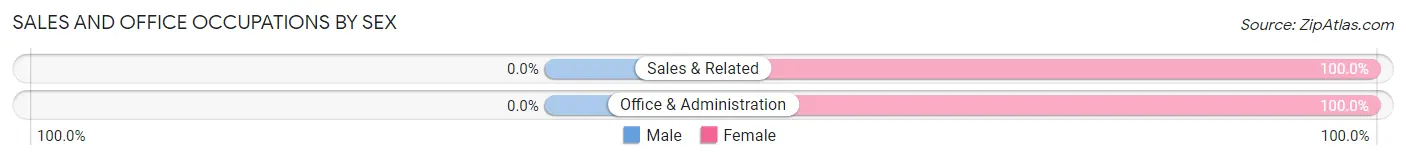
| Occupation | Male | Female |
| Sales & Related | 0 (0.0%) | 8 (100.0%) |
| Office & Administration | 0 (0.0%) | 54 (100.0%) |
| Total (Category) | 0 (0.0%) | 62 (100.0%) |
| Total (Overall) | 401 (50.1%) | 400 (49.9%) |
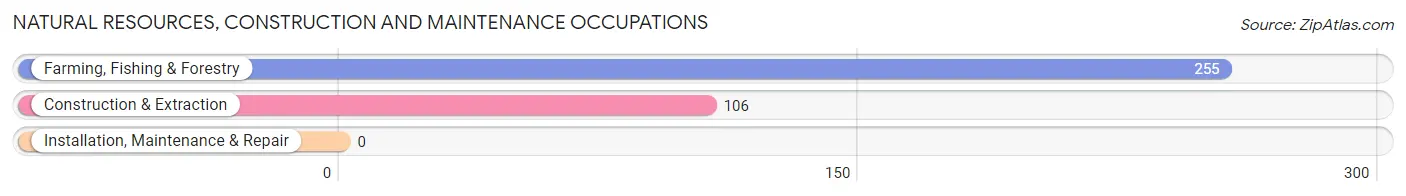
Natural Resources, Construction and Maintenance Occupations
The most common Natural Resources, Construction and Maintenance occupations in South Taft are Farming, Fishing & Forestry (255 | 31.8%), and Construction & Extraction (106 | 13.2%).
Natural Resources, Construction and Maintenance Occupations by Sex
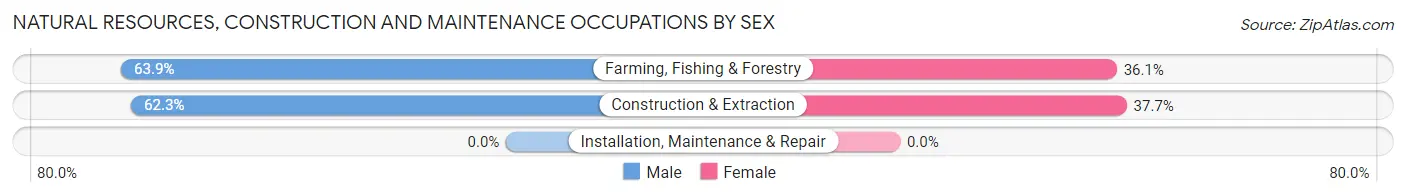
| Occupation | Male | Female |
| Farming, Fishing & Forestry | 163 (63.9%) | 92 (36.1%) |
| Construction & Extraction | 66 (62.3%) | 40 (37.7%) |
| Installation, Maintenance & Repair | 0 (0.0%) | 0 (0.0%) |
| Total (Category) | 229 (63.4%) | 132 (36.6%) |
| Total (Overall) | 401 (50.1%) | 400 (49.9%) |
Production, Transportation and Moving Occupations
The most common Production, Transportation and Moving occupations in South Taft are Production (27 | 3.4%), and Material Moving (27 | 3.4%).
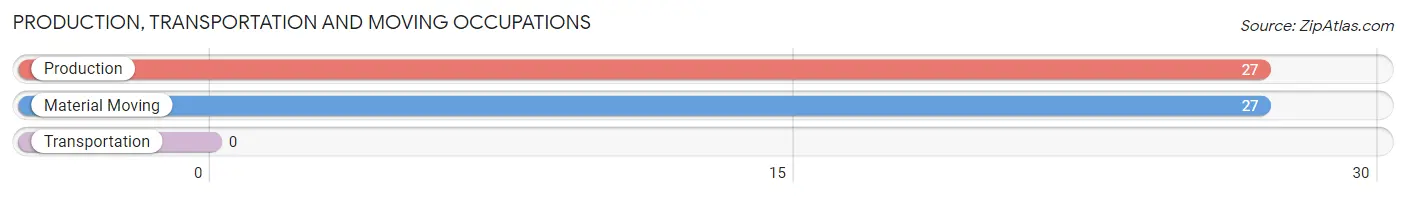
Production, Transportation and Moving Occupations by Sex
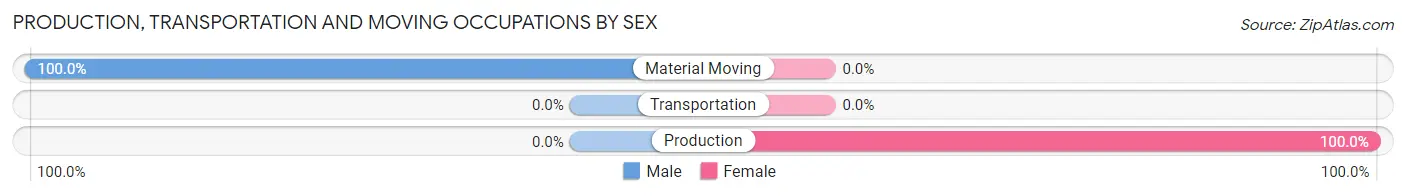
| Occupation | Male | Female |
| Production | 0 (0.0%) | 27 (100.0%) |
| Transportation | 0 (0.0%) | 0 (0.0%) |
| Material Moving | 27 (100.0%) | 0 (0.0%) |
| Total (Category) | 27 (50.0%) | 27 (50.0%) |
| Total (Overall) | 401 (50.1%) | 400 (49.9%) |
Employment Industries by Sex in South Taft
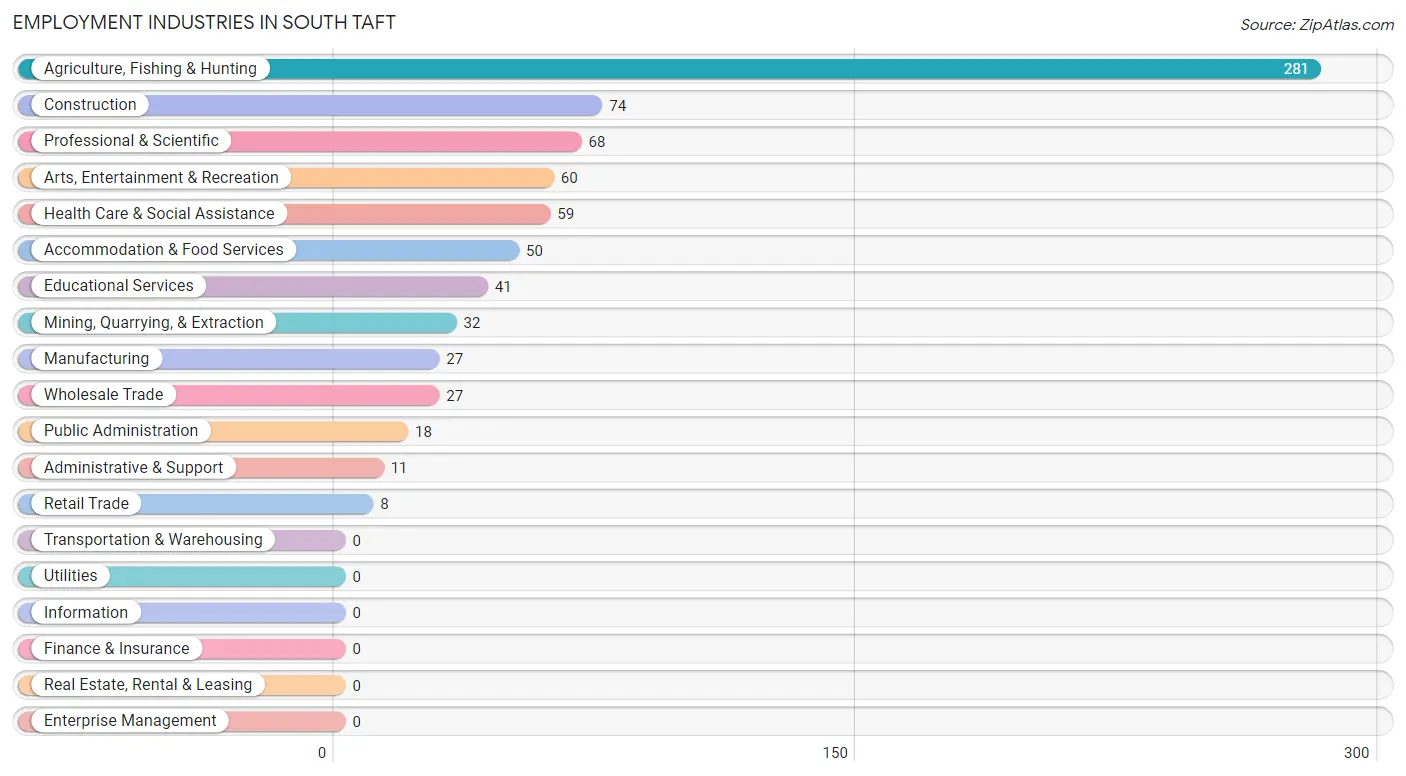
Employment Industries in South Taft
The major employment industries in South Taft include Agriculture, Fishing & Hunting (281 | 35.1%), Construction (74 | 9.2%), Professional & Scientific (68 | 8.5%), Arts, Entertainment & Recreation (60 | 7.5%), and Health Care & Social Assistance (59 | 7.4%).
Employment Industries by Sex in South Taft
The South Taft industries that see more men than women are Mining, Quarrying, & Extraction (100.0%), Wholesale Trade (100.0%), and Administrative & Support (100.0%), whereas the industries that tend to have a higher number of women are Manufacturing (100.0%), Retail Trade (100.0%), and Professional & Scientific (100.0%).
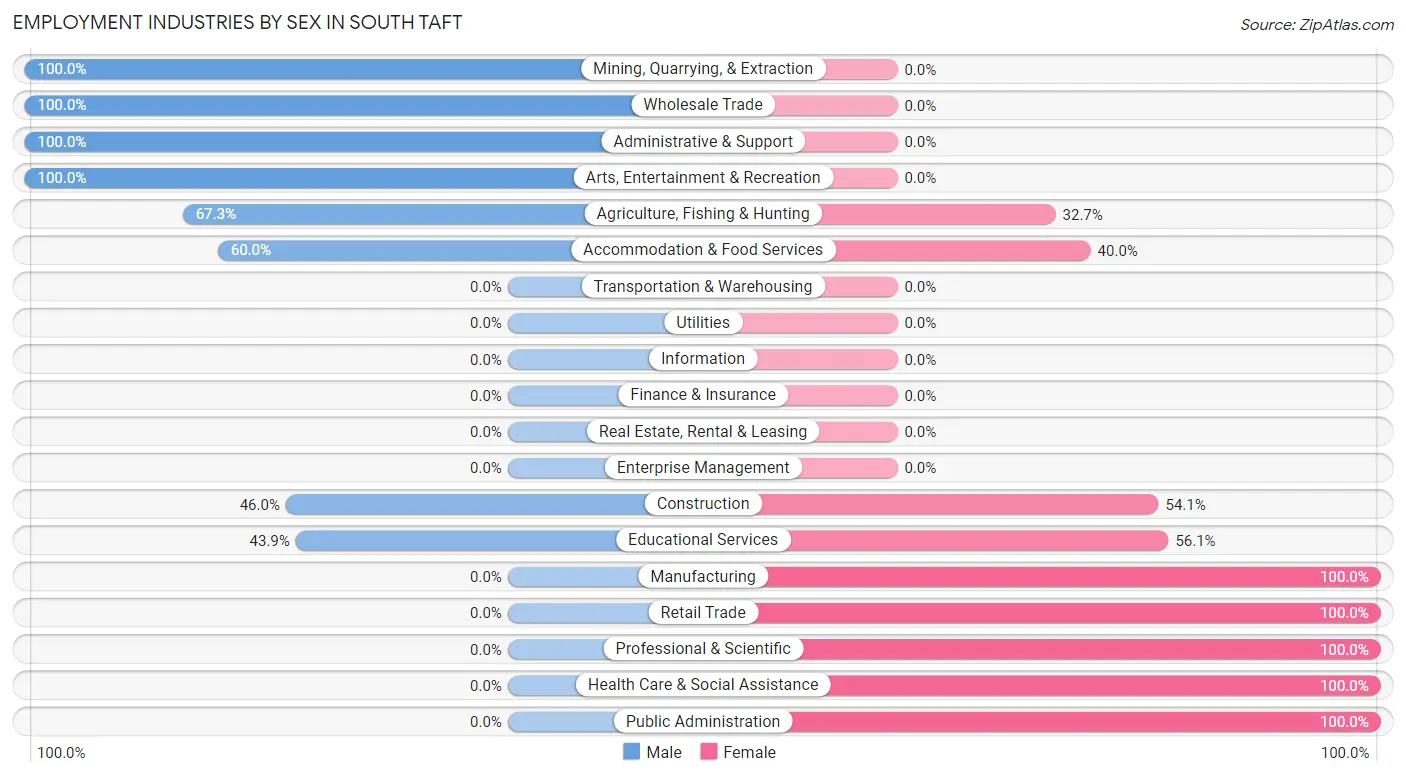
| Industry | Male | Female |
| Agriculture, Fishing & Hunting | 189 (67.3%) | 92 (32.7%) |
| Mining, Quarrying, & Extraction | 32 (100.0%) | 0 (0.0%) |
| Construction | 34 (46.0%) | 40 (54.0%) |
| Manufacturing | 0 (0.0%) | 27 (100.0%) |
| Wholesale Trade | 27 (100.0%) | 0 (0.0%) |
| Retail Trade | 0 (0.0%) | 8 (100.0%) |
| Transportation & Warehousing | 0 (0.0%) | 0 (0.0%) |
| Utilities | 0 (0.0%) | 0 (0.0%) |
| Information | 0 (0.0%) | 0 (0.0%) |
| Finance & Insurance | 0 (0.0%) | 0 (0.0%) |
| Real Estate, Rental & Leasing | 0 (0.0%) | 0 (0.0%) |
| Professional & Scientific | 0 (0.0%) | 68 (100.0%) |
| Enterprise Management | 0 (0.0%) | 0 (0.0%) |
| Administrative & Support | 11 (100.0%) | 0 (0.0%) |
| Educational Services | 18 (43.9%) | 23 (56.1%) |
| Health Care & Social Assistance | 0 (0.0%) | 59 (100.0%) |
| Arts, Entertainment & Recreation | 60 (100.0%) | 0 (0.0%) |
| Accommodation & Food Services | 30 (60.0%) | 20 (40.0%) |
| Public Administration | 0 (0.0%) | 18 (100.0%) |
| Total | 401 (50.1%) | 400 (49.9%) |
Education in South Taft
School Enrollment in South Taft
The most common levels of schooling among the 660 students in South Taft are high school (174 | 26.4%), middle school (165 | 25.0%), and kindergarten (127 | 19.2%).
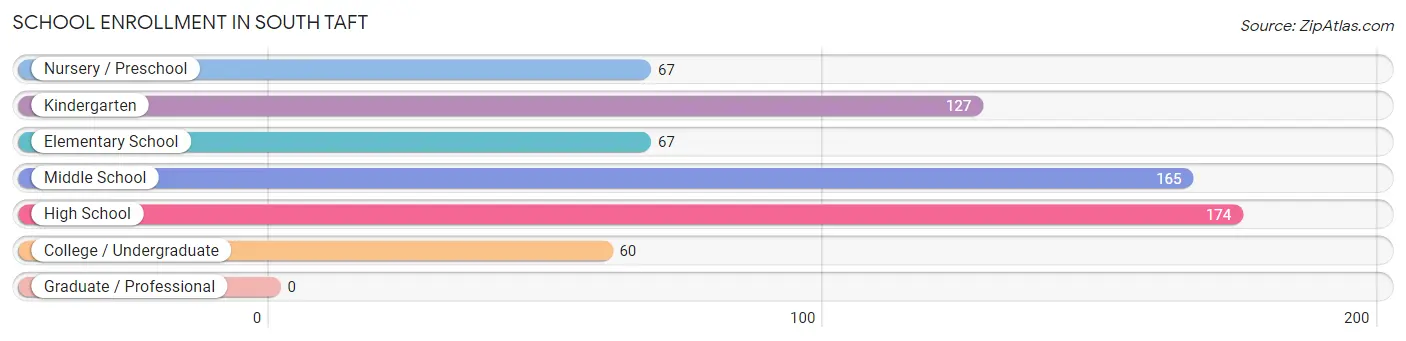
| School Level | # Students | % Students |
| Nursery / Preschool | 67 | 10.2% |
| Kindergarten | 127 | 19.2% |
| Elementary School | 67 | 10.2% |
| Middle School | 165 | 25.0% |
| High School | 174 | 26.4% |
| College / Undergraduate | 60 | 9.1% |
| Graduate / Professional | 0 | 0.0% |
| Total | 660 | 100.0% |
School Enrollment by Age by Funding Source in South Taft
Out of a total of 660 students who are enrolled in schools in South Taft, 17 (2.6%) attend a private institution, while the remaining 643 (97.4%) are enrolled in public schools. The age group of 18 to 19 year olds has the highest likelihood of being enrolled in private schools, with 17 (17.3% in the age bracket) enrolled. Conversely, the age group of 3 to 4 year olds has the lowest likelihood of being enrolled in a private school, with 67 (100.0% in the age bracket) attending a public institution.
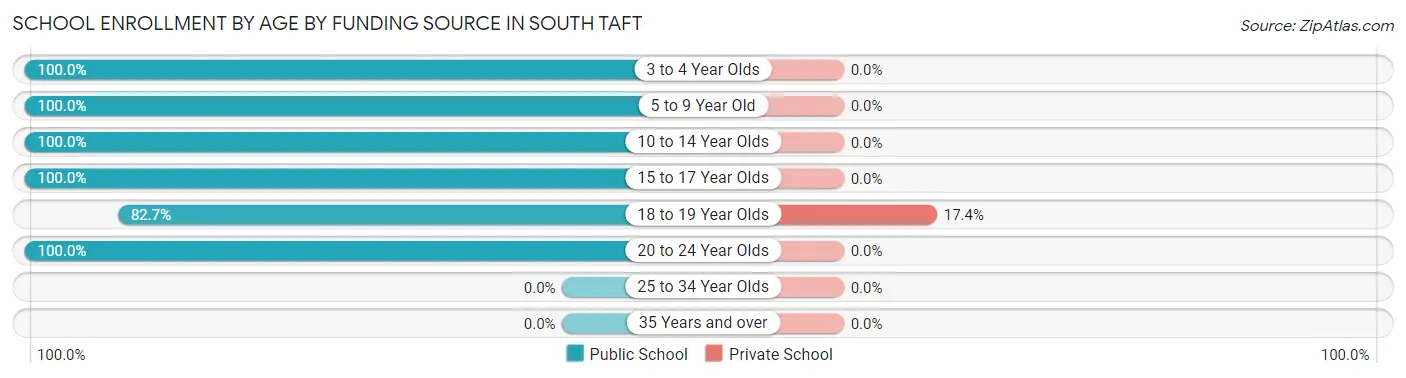
| Age Bracket | Public School | Private School |
| 3 to 4 Year Olds | 67 (100.0%) | 0 (0.0%) |
| 5 to 9 Year Old | 167 (100.0%) | 0 (0.0%) |
| 10 to 14 Year Olds | 192 (100.0%) | 0 (0.0%) |
| 15 to 17 Year Olds | 93 (100.0%) | 0 (0.0%) |
| 18 to 19 Year Olds | 81 (82.7%) | 17 (17.3%) |
| 20 to 24 Year Olds | 43 (100.0%) | 0 (0.0%) |
| 25 to 34 Year Olds | 0 (0.0%) | 0 (0.0%) |
| 35 Years and over | 0 (0.0%) | 0 (0.0%) |
| Total | 643 (97.4%) | 17 (2.6%) |
Educational Attainment by Field of Study in South Taft
Visual & performing arts (35 | 36.8%), psychology (30 | 31.6%), social sciences (11 | 11.6%), science & technology (11 | 11.6%), and liberal arts & history (8 | 8.4%) are the most common fields of study among 95 individuals in South Taft who have obtained a bachelor's degree or higher.
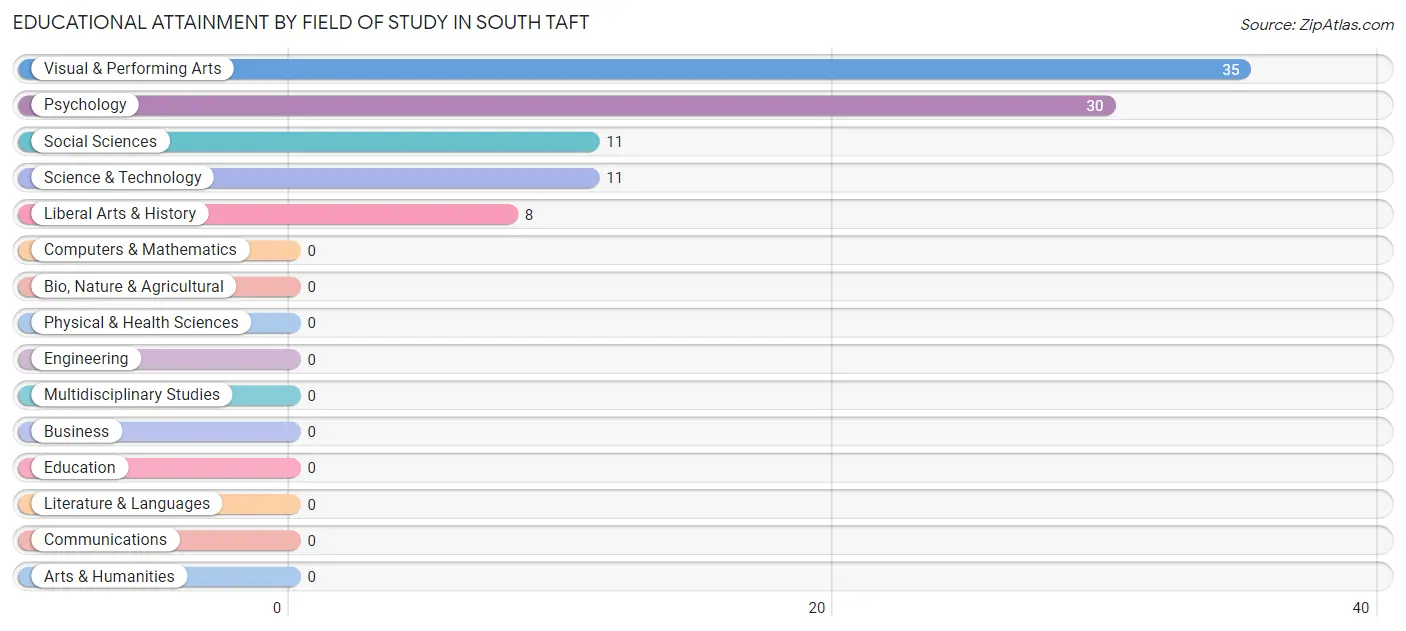
| Field of Study | # Graduates | % Graduates |
| Computers & Mathematics | 0 | 0.0% |
| Bio, Nature & Agricultural | 0 | 0.0% |
| Physical & Health Sciences | 0 | 0.0% |
| Psychology | 30 | 31.6% |
| Social Sciences | 11 | 11.6% |
| Engineering | 0 | 0.0% |
| Multidisciplinary Studies | 0 | 0.0% |
| Science & Technology | 11 | 11.6% |
| Business | 0 | 0.0% |
| Education | 0 | 0.0% |
| Literature & Languages | 0 | 0.0% |
| Liberal Arts & History | 8 | 8.4% |
| Visual & Performing Arts | 35 | 36.8% |
| Communications | 0 | 0.0% |
| Arts & Humanities | 0 | 0.0% |
| Total | 95 | 100.0% |
Transportation & Commute in South Taft
Vehicle Availability by Sex in South Taft
The most prevalent vehicle ownership categories in South Taft are males with 1 vehicle (186, accounting for 50.1%) and females with 1 vehicle (132, making up 49.9%).
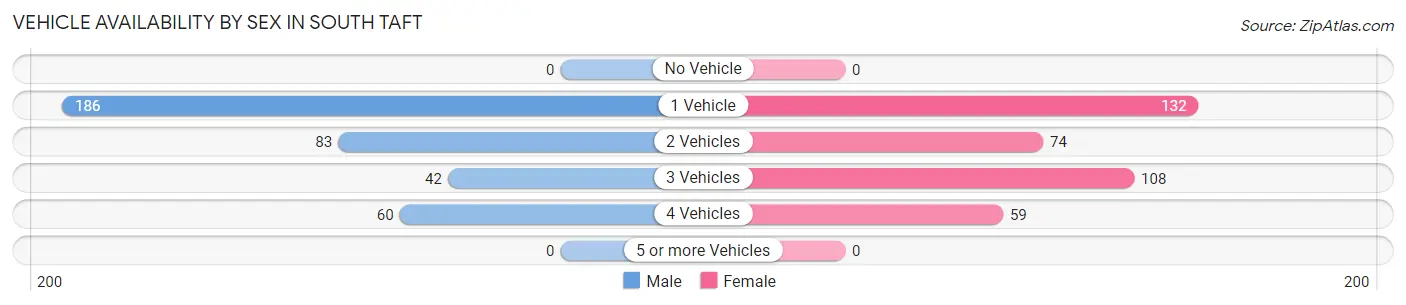
| Vehicles Available | Male | Female |
| No Vehicle | 0 (0.0%) | 0 (0.0%) |
| 1 Vehicle | 186 (50.1%) | 132 (35.4%) |
| 2 Vehicles | 83 (22.4%) | 74 (19.8%) |
| 3 Vehicles | 42 (11.3%) | 108 (28.9%) |
| 4 Vehicles | 60 (16.2%) | 59 (15.8%) |
| 5 or more Vehicles | 0 (0.0%) | 0 (0.0%) |
| Total | 371 (100.0%) | 373 (100.0%) |
Commute Time in South Taft
The most frequently occuring commute durations in South Taft are 45 to 59 minutes (166 commuters, 23.1%), 15 to 19 minutes (118 commuters, 16.4%), and 90 or more minutes (77 commuters, 10.7%).
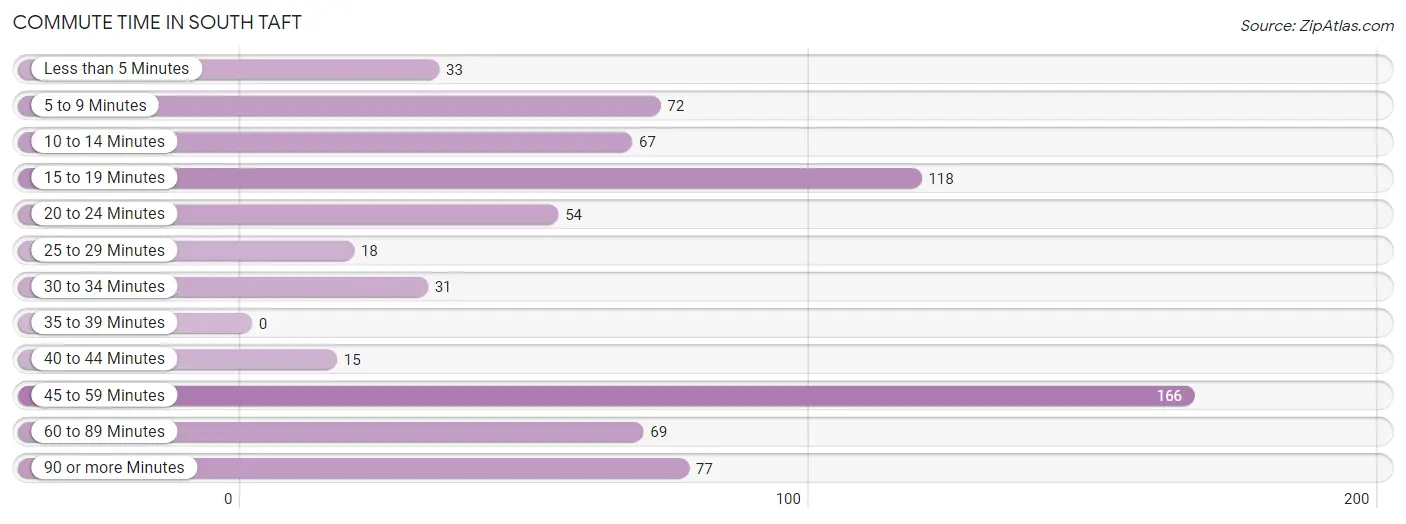
| Commute Time | # Commuters | % Commuters |
| Less than 5 Minutes | 33 | 4.6% |
| 5 to 9 Minutes | 72 | 10.0% |
| 10 to 14 Minutes | 67 | 9.3% |
| 15 to 19 Minutes | 118 | 16.4% |
| 20 to 24 Minutes | 54 | 7.5% |
| 25 to 29 Minutes | 18 | 2.5% |
| 30 to 34 Minutes | 31 | 4.3% |
| 35 to 39 Minutes | 0 | 0.0% |
| 40 to 44 Minutes | 15 | 2.1% |
| 45 to 59 Minutes | 166 | 23.1% |
| 60 to 89 Minutes | 69 | 9.6% |
| 90 or more Minutes | 77 | 10.7% |
Commute Time by Sex in South Taft
The most common commute times in South Taft are 15 to 19 minutes (90 commuters, 24.3%) for males and 45 to 59 minutes (103 commuters, 29.5%) for females.
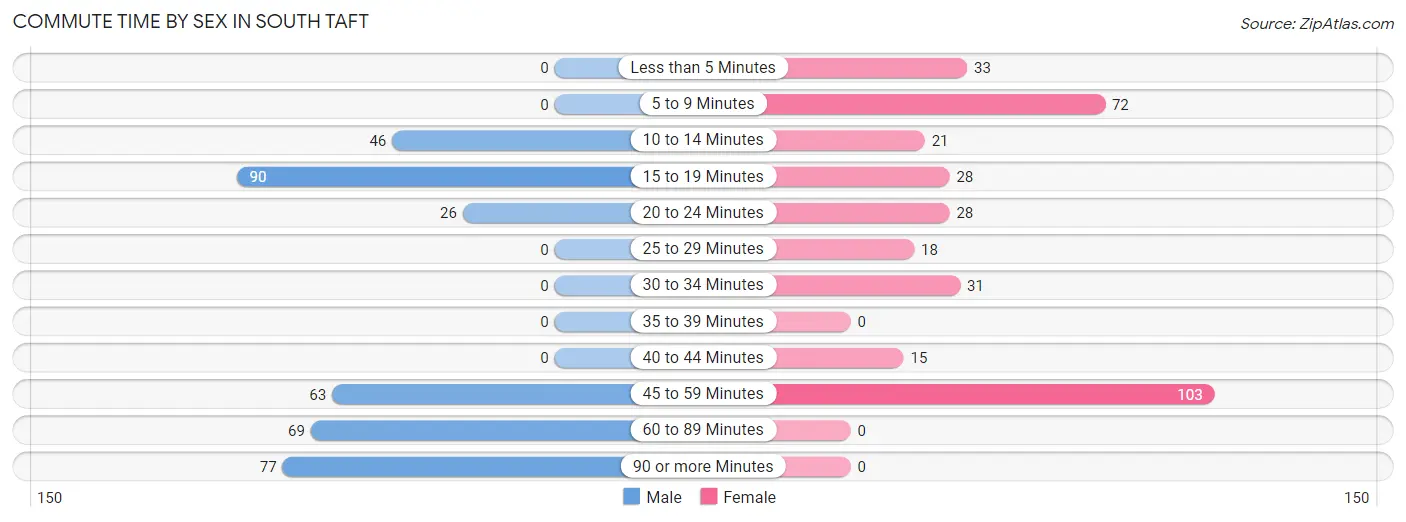
| Commute Time | Male | Female |
| Less than 5 Minutes | 0 (0.0%) | 33 (9.5%) |
| 5 to 9 Minutes | 0 (0.0%) | 72 (20.6%) |
| 10 to 14 Minutes | 46 (12.4%) | 21 (6.0%) |
| 15 to 19 Minutes | 90 (24.3%) | 28 (8.0%) |
| 20 to 24 Minutes | 26 (7.0%) | 28 (8.0%) |
| 25 to 29 Minutes | 0 (0.0%) | 18 (5.2%) |
| 30 to 34 Minutes | 0 (0.0%) | 31 (8.9%) |
| 35 to 39 Minutes | 0 (0.0%) | 0 (0.0%) |
| 40 to 44 Minutes | 0 (0.0%) | 15 (4.3%) |
| 45 to 59 Minutes | 63 (17.0%) | 103 (29.5%) |
| 60 to 89 Minutes | 69 (18.6%) | 0 (0.0%) |
| 90 or more Minutes | 77 (20.7%) | 0 (0.0%) |
Time of Departure to Work by Sex in South Taft
The most frequent times of departure to work in South Taft are 6:00 AM to 6:29 AM (258, 69.5%) for males and 6:00 AM to 6:29 AM (92, 26.4%) for females.
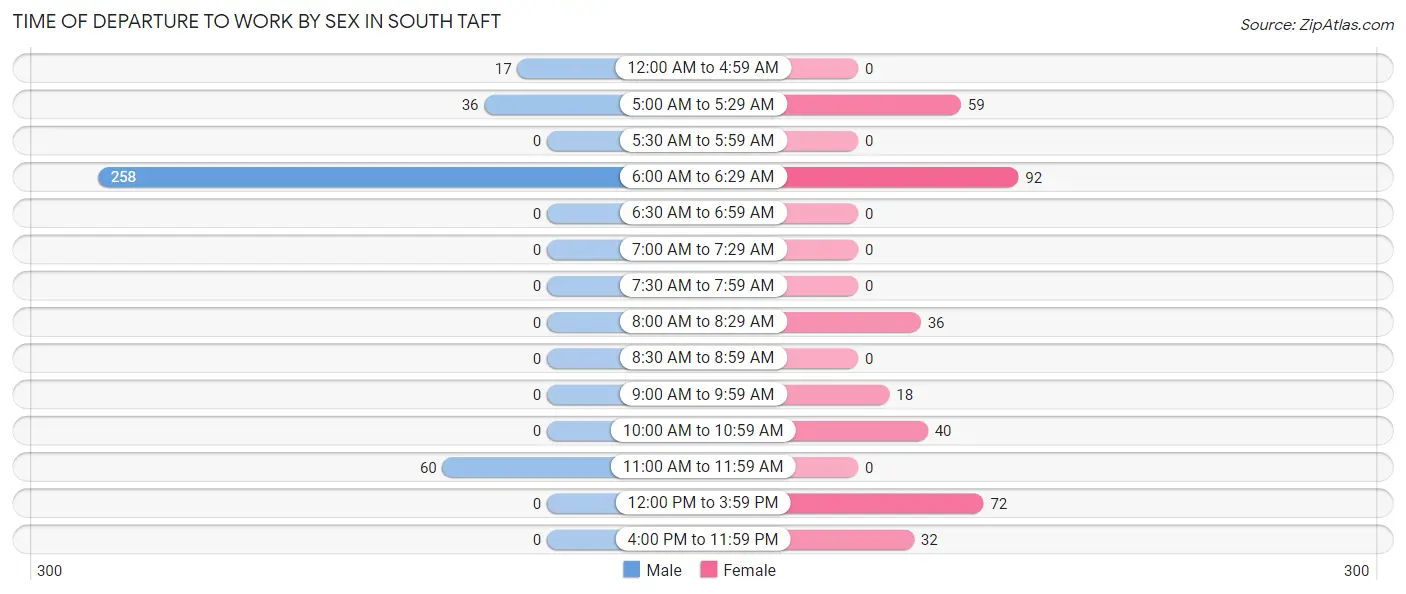
| Time of Departure | Male | Female |
| 12:00 AM to 4:59 AM | 17 (4.6%) | 0 (0.0%) |
| 5:00 AM to 5:29 AM | 36 (9.7%) | 59 (16.9%) |
| 5:30 AM to 5:59 AM | 0 (0.0%) | 0 (0.0%) |
| 6:00 AM to 6:29 AM | 258 (69.5%) | 92 (26.4%) |
| 6:30 AM to 6:59 AM | 0 (0.0%) | 0 (0.0%) |
| 7:00 AM to 7:29 AM | 0 (0.0%) | 0 (0.0%) |
| 7:30 AM to 7:59 AM | 0 (0.0%) | 0 (0.0%) |
| 8:00 AM to 8:29 AM | 0 (0.0%) | 36 (10.3%) |
| 8:30 AM to 8:59 AM | 0 (0.0%) | 0 (0.0%) |
| 9:00 AM to 9:59 AM | 0 (0.0%) | 18 (5.2%) |
| 10:00 AM to 10:59 AM | 0 (0.0%) | 40 (11.5%) |
| 11:00 AM to 11:59 AM | 60 (16.2%) | 0 (0.0%) |
| 12:00 PM to 3:59 PM | 0 (0.0%) | 72 (20.6%) |
| 4:00 PM to 11:59 PM | 0 (0.0%) | 32 (9.2%) |
| Total | 371 (100.0%) | 349 (100.0%) |
Housing Occupancy in South Taft
Occupancy by Ownership in South Taft
Of the total 672 dwellings in South Taft, owner-occupied units account for 237 (35.3%), while renter-occupied units make up 435 (64.7%).
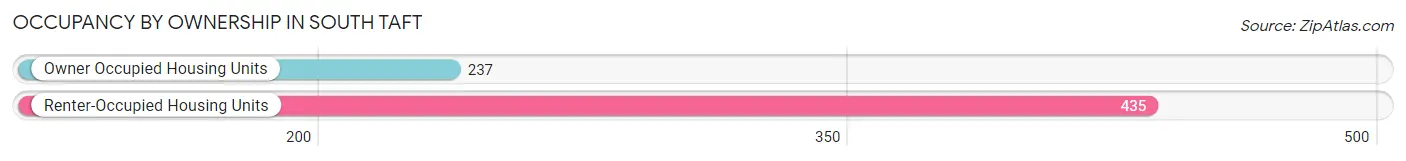
| Occupancy | # Housing Units | % Housing Units |
| Owner Occupied Housing Units | 237 | 35.3% |
| Renter-Occupied Housing Units | 435 | 64.7% |
| Total Occupied Housing Units | 672 | 100.0% |
Occupancy by Household Size in South Taft
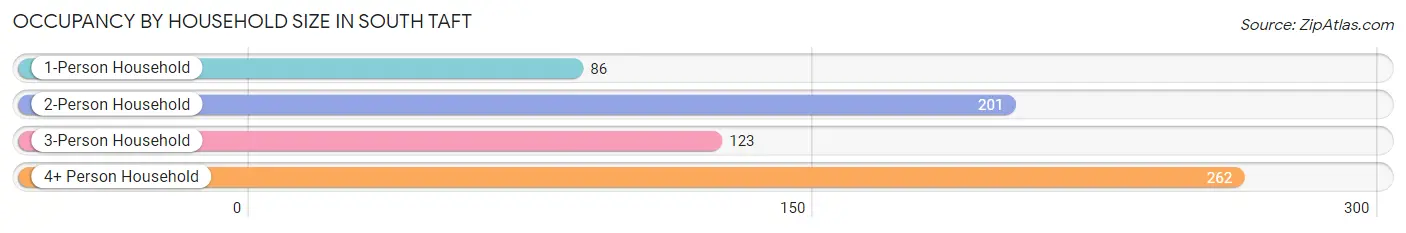
| Household Size | # Housing Units | % Housing Units |
| 1-Person Household | 86 | 12.8% |
| 2-Person Household | 201 | 29.9% |
| 3-Person Household | 123 | 18.3% |
| 4+ Person Household | 262 | 39.0% |
| Total Housing Units | 672 | 100.0% |
Occupancy by Ownership by Household Size in South Taft
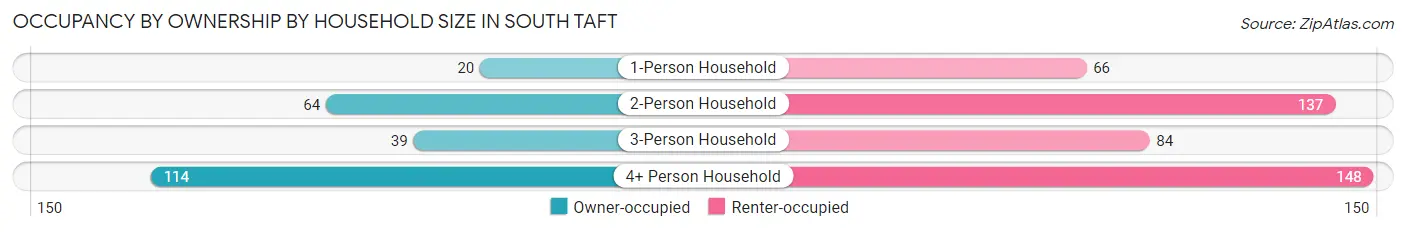
| Household Size | Owner-occupied | Renter-occupied |
| 1-Person Household | 20 (23.3%) | 66 (76.7%) |
| 2-Person Household | 64 (31.8%) | 137 (68.2%) |
| 3-Person Household | 39 (31.7%) | 84 (68.3%) |
| 4+ Person Household | 114 (43.5%) | 148 (56.5%) |
| Total Housing Units | 237 (35.3%) | 435 (64.7%) |
Occupancy by Educational Attainment in South Taft
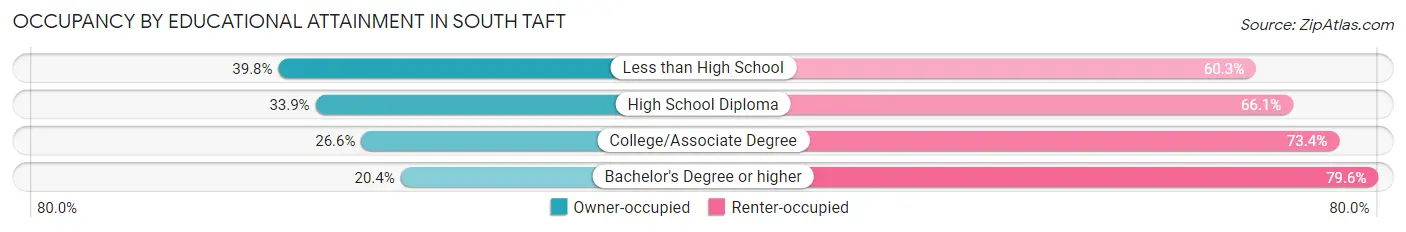
| Household Size | Owner-occupied | Renter-occupied |
| Less than High School | 159 (39.8%) | 241 (60.3%) |
| High School Diploma | 42 (33.9%) | 82 (66.1%) |
| College/Associate Degree | 25 (26.6%) | 69 (73.4%) |
| Bachelor's Degree or higher | 11 (20.4%) | 43 (79.6%) |
Occupancy by Age of Householder in South Taft
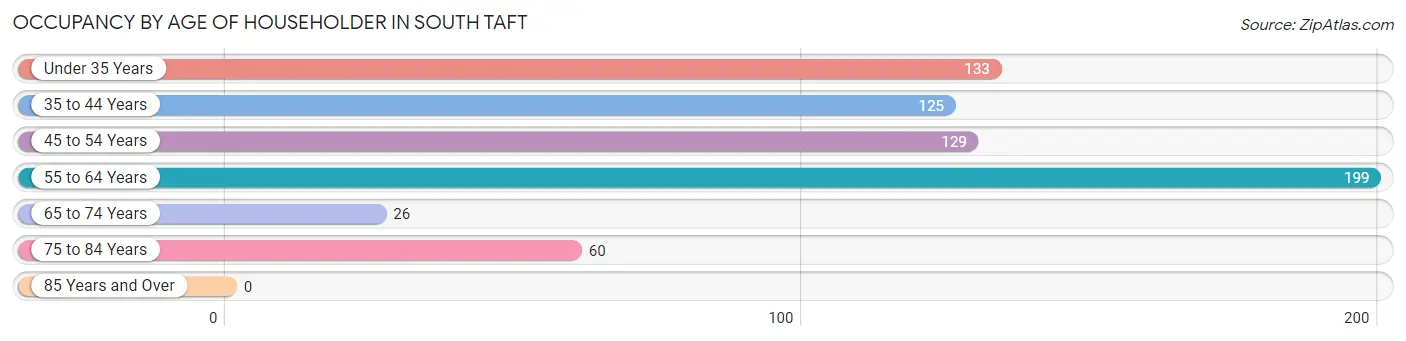
| Age Bracket | # Households | % Households |
| Under 35 Years | 133 | 19.8% |
| 35 to 44 Years | 125 | 18.6% |
| 45 to 54 Years | 129 | 19.2% |
| 55 to 64 Years | 199 | 29.6% |
| 65 to 74 Years | 26 | 3.9% |
| 75 to 84 Years | 60 | 8.9% |
| 85 Years and Over | 0 | 0.0% |
| Total | 672 | 100.0% |
Housing Finances in South Taft
Median Income by Occupancy in South Taft
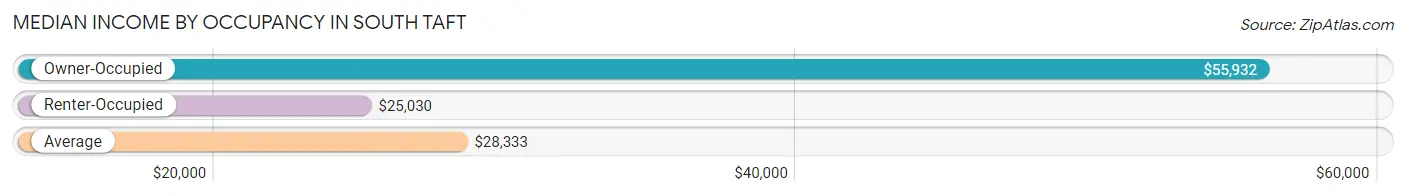
| Occupancy Type | # Households | Median Income |
| Owner-Occupied | 237 (35.3%) | $55,932 |
| Renter-Occupied | 435 (64.7%) | $25,030 |
| Average | 672 (100.0%) | $28,333 |
Occupancy by Householder Income Bracket in South Taft
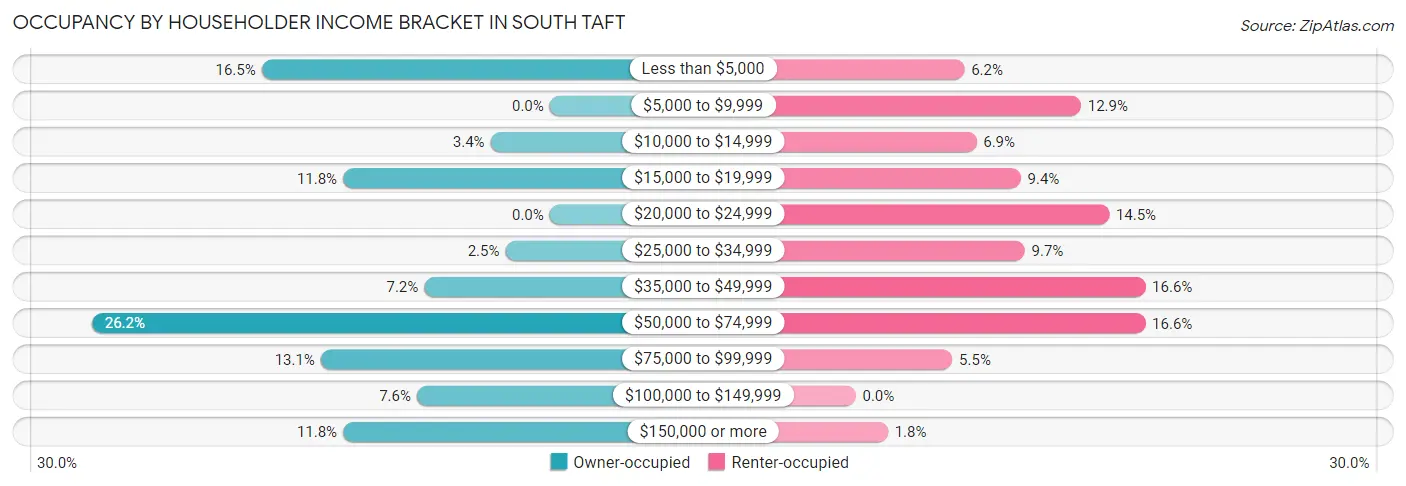
| Income Bracket | Owner-occupied | Renter-occupied |
| Less than $5,000 | 39 (16.5%) | 27 (6.2%) |
| $5,000 to $9,999 | 0 (0.0%) | 56 (12.9%) |
| $10,000 to $14,999 | 8 (3.4%) | 30 (6.9%) |
| $15,000 to $19,999 | 28 (11.8%) | 41 (9.4%) |
| $20,000 to $24,999 | 0 (0.0%) | 63 (14.5%) |
| $25,000 to $34,999 | 6 (2.5%) | 42 (9.7%) |
| $35,000 to $49,999 | 17 (7.2%) | 72 (16.6%) |
| $50,000 to $74,999 | 62 (26.2%) | 72 (16.6%) |
| $75,000 to $99,999 | 31 (13.1%) | 24 (5.5%) |
| $100,000 to $149,999 | 18 (7.6%) | 0 (0.0%) |
| $150,000 or more | 28 (11.8%) | 8 (1.8%) |
| Total | 237 (100.0%) | 435 (100.0%) |
Monthly Housing Cost Tiers in South Taft
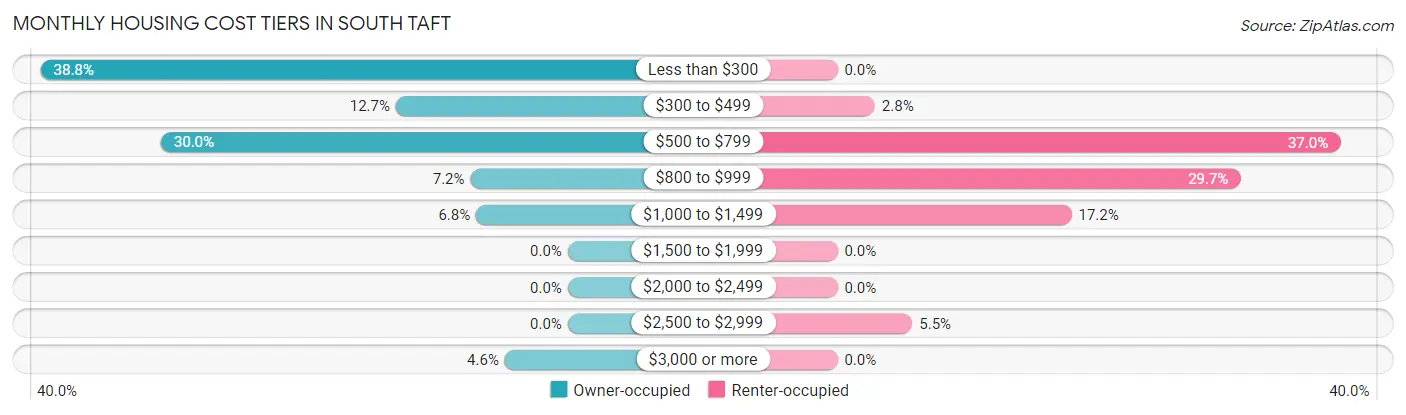
| Monthly Cost | Owner-occupied | Renter-occupied |
| Less than $300 | 92 (38.8%) | 0 (0.0%) |
| $300 to $499 | 30 (12.7%) | 12 (2.8%) |
| $500 to $799 | 71 (30.0%) | 161 (37.0%) |
| $800 to $999 | 17 (7.2%) | 129 (29.7%) |
| $1,000 to $1,499 | 16 (6.8%) | 75 (17.2%) |
| $1,500 to $1,999 | 0 (0.0%) | 0 (0.0%) |
| $2,000 to $2,499 | 0 (0.0%) | 0 (0.0%) |
| $2,500 to $2,999 | 0 (0.0%) | 24 (5.5%) |
| $3,000 or more | 11 (4.6%) | 0 (0.0%) |
| Total | 237 (100.0%) | 435 (100.0%) |
Physical Housing Characteristics in South Taft
Housing Structures in South Taft
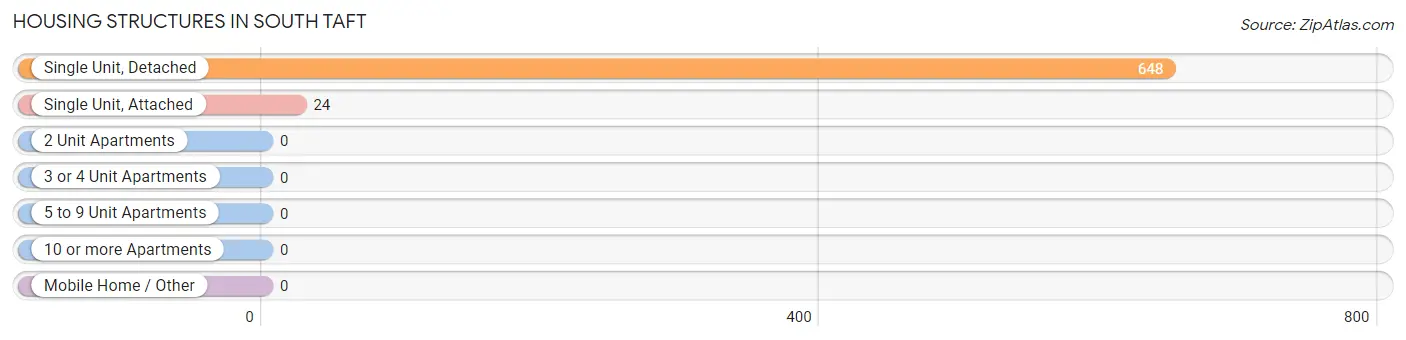
| Structure Type | # Housing Units | % Housing Units |
| Single Unit, Detached | 648 | 96.4% |
| Single Unit, Attached | 24 | 3.6% |
| 2 Unit Apartments | 0 | 0.0% |
| 3 or 4 Unit Apartments | 0 | 0.0% |
| 5 to 9 Unit Apartments | 0 | 0.0% |
| 10 or more Apartments | 0 | 0.0% |
| Mobile Home / Other | 0 | 0.0% |
| Total | 672 | 100.0% |
Housing Structures by Occupancy in South Taft
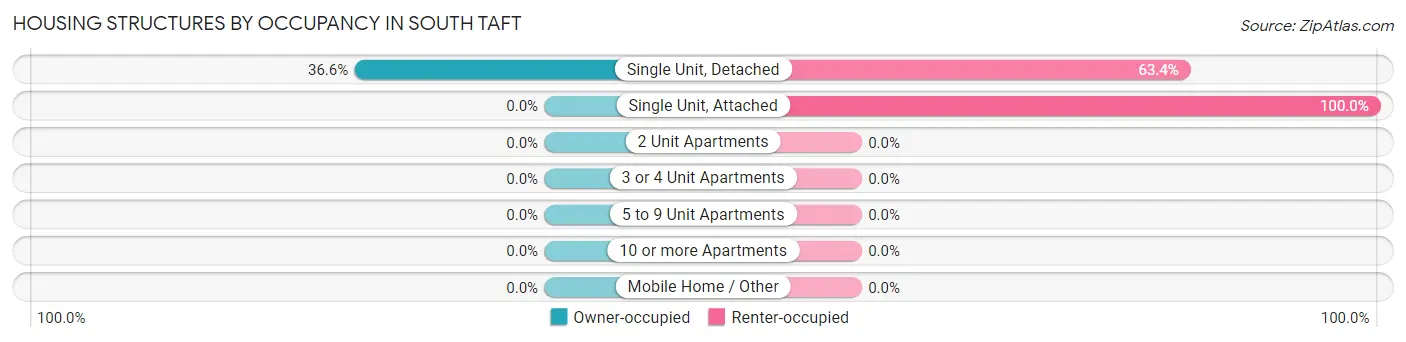
| Structure Type | Owner-occupied | Renter-occupied |
| Single Unit, Detached | 237 (36.6%) | 411 (63.4%) |
| Single Unit, Attached | 0 (0.0%) | 24 (100.0%) |
| 2 Unit Apartments | 0 (0.0%) | 0 (0.0%) |
| 3 or 4 Unit Apartments | 0 (0.0%) | 0 (0.0%) |
| 5 to 9 Unit Apartments | 0 (0.0%) | 0 (0.0%) |
| 10 or more Apartments | 0 (0.0%) | 0 (0.0%) |
| Mobile Home / Other | 0 (0.0%) | 0 (0.0%) |
| Total | 237 (35.3%) | 435 (64.7%) |
Housing Structures by Number of Rooms in South Taft
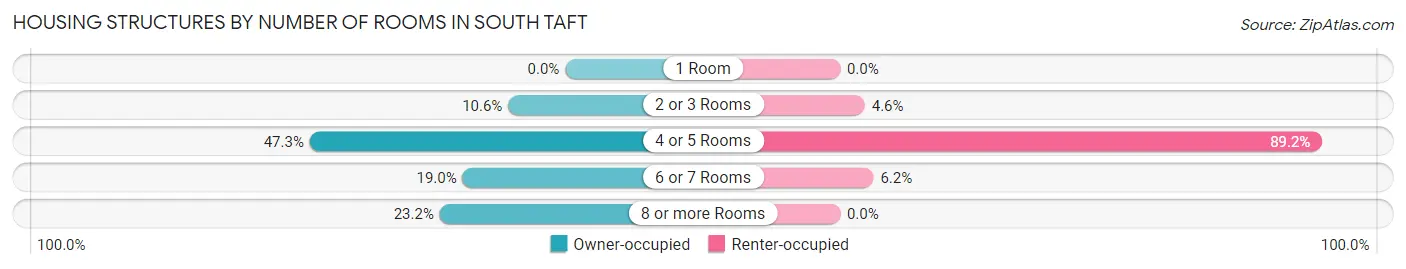
| Number of Rooms | Owner-occupied | Renter-occupied |
| 1 Room | 0 (0.0%) | 0 (0.0%) |
| 2 or 3 Rooms | 25 (10.5%) | 20 (4.6%) |
| 4 or 5 Rooms | 112 (47.3%) | 388 (89.2%) |
| 6 or 7 Rooms | 45 (19.0%) | 27 (6.2%) |
| 8 or more Rooms | 55 (23.2%) | 0 (0.0%) |
| Total | 237 (100.0%) | 435 (100.0%) |
Housing Structure by Heating Type in South Taft
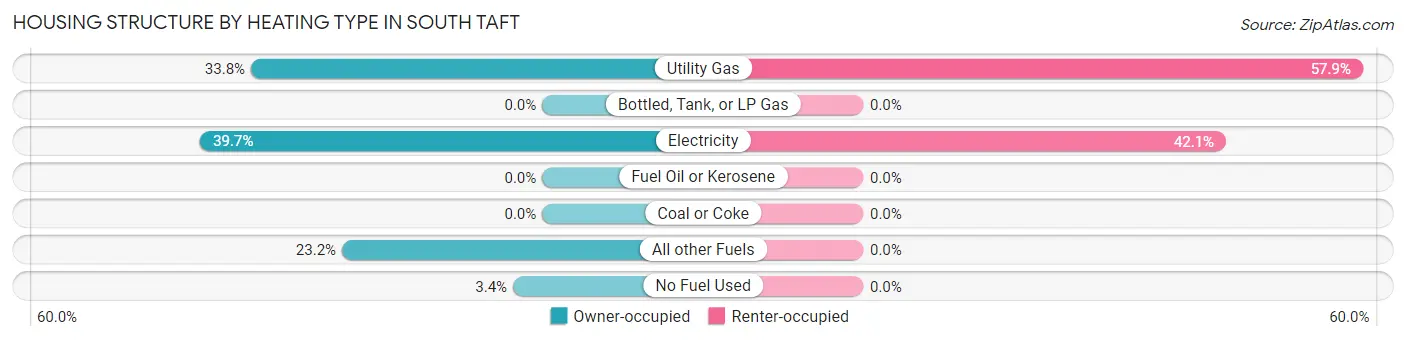
| Heating Type | Owner-occupied | Renter-occupied |
| Utility Gas | 80 (33.8%) | 252 (57.9%) |
| Bottled, Tank, or LP Gas | 0 (0.0%) | 0 (0.0%) |
| Electricity | 94 (39.7%) | 183 (42.1%) |
| Fuel Oil or Kerosene | 0 (0.0%) | 0 (0.0%) |
| Coal or Coke | 0 (0.0%) | 0 (0.0%) |
| All other Fuels | 55 (23.2%) | 0 (0.0%) |
| No Fuel Used | 8 (3.4%) | 0 (0.0%) |
| Total | 237 (100.0%) | 435 (100.0%) |
Household Vehicle Usage in South Taft

| Vehicles per Household | Owner-occupied | Renter-occupied |
| No Vehicle | 0 (0.0%) | 12 (2.8%) |
| 1 Vehicle | 51 (21.5%) | 331 (76.1%) |
| 2 Vehicles | 89 (37.6%) | 62 (14.2%) |
| 3 or more Vehicles | 97 (40.9%) | 30 (6.9%) |
| Total | 237 (100.0%) | 435 (100.0%) |
Real Estate & Mortgages in South Taft
Real Estate and Mortgage Overview in South Taft
| Characteristic | Without Mortgage | With Mortgage |
| Housing Units | 210 | 27 |
| Median Property Value | $103,300 | $0 |
| Median Household Income | $56,045 | $11 |
| Monthly Housing Costs | $426 | $11 |
| Real Estate Taxes | $1,307 | $0 |
Property Value by Mortgage Status in South Taft
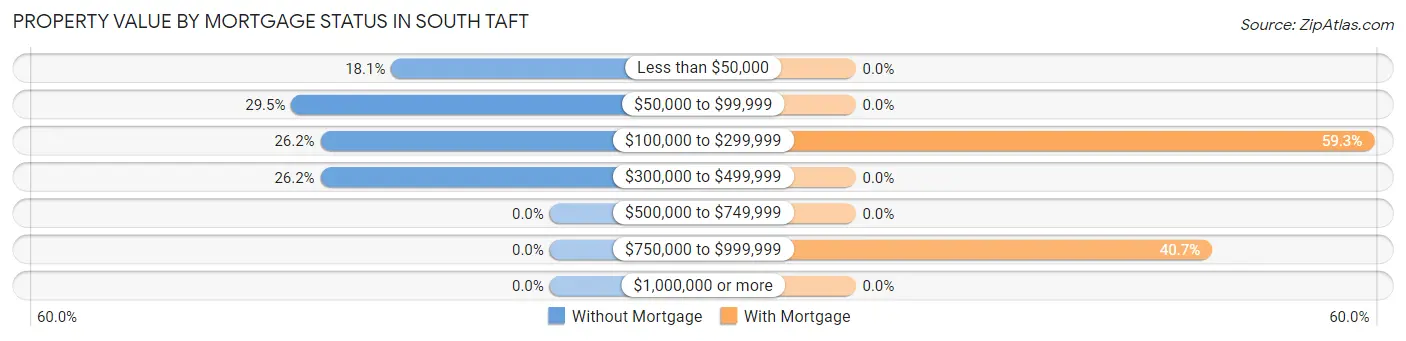
| Property Value | Without Mortgage | With Mortgage |
| Less than $50,000 | 38 (18.1%) | 0 (0.0%) |
| $50,000 to $99,999 | 62 (29.5%) | 0 (0.0%) |
| $100,000 to $299,999 | 55 (26.2%) | 16 (59.3%) |
| $300,000 to $499,999 | 55 (26.2%) | 0 (0.0%) |
| $500,000 to $749,999 | 0 (0.0%) | 0 (0.0%) |
| $750,000 to $999,999 | 0 (0.0%) | 11 (40.7%) |
| $1,000,000 or more | 0 (0.0%) | 0 (0.0%) |
| Total | 210 (100.0%) | 27 (100.0%) |
Household Income by Mortgage Status in South Taft
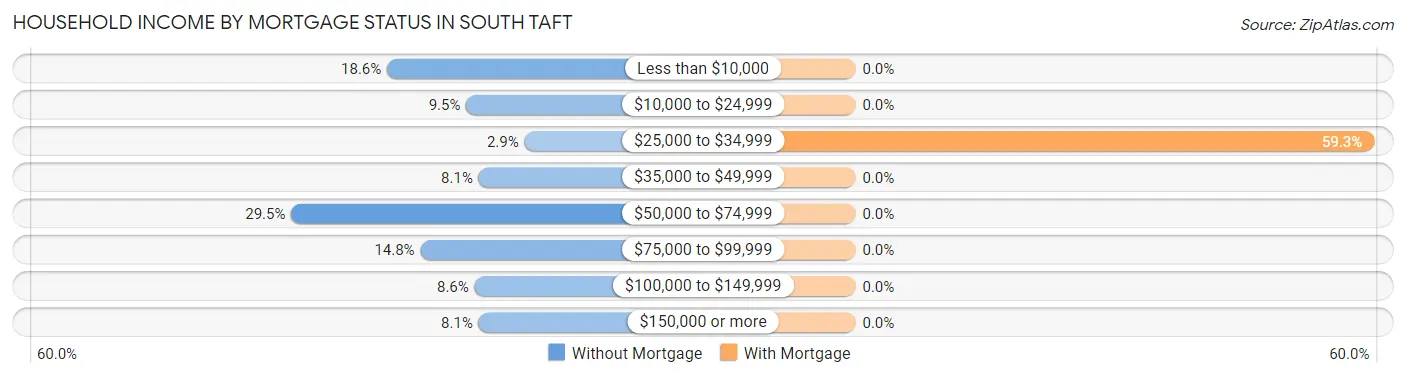
| Household Income | Without Mortgage | With Mortgage |
| Less than $10,000 | 39 (18.6%) | 0 (0.0%) |
| $10,000 to $24,999 | 20 (9.5%) | 0 (0.0%) |
| $25,000 to $34,999 | 6 (2.9%) | 16 (59.3%) |
| $35,000 to $49,999 | 17 (8.1%) | 0 (0.0%) |
| $50,000 to $74,999 | 62 (29.5%) | 0 (0.0%) |
| $75,000 to $99,999 | 31 (14.8%) | 0 (0.0%) |
| $100,000 to $149,999 | 18 (8.6%) | 0 (0.0%) |
| $150,000 or more | 17 (8.1%) | 0 (0.0%) |
| Total | 210 (100.0%) | 27 (100.0%) |
Property Value to Household Income Ratio in South Taft
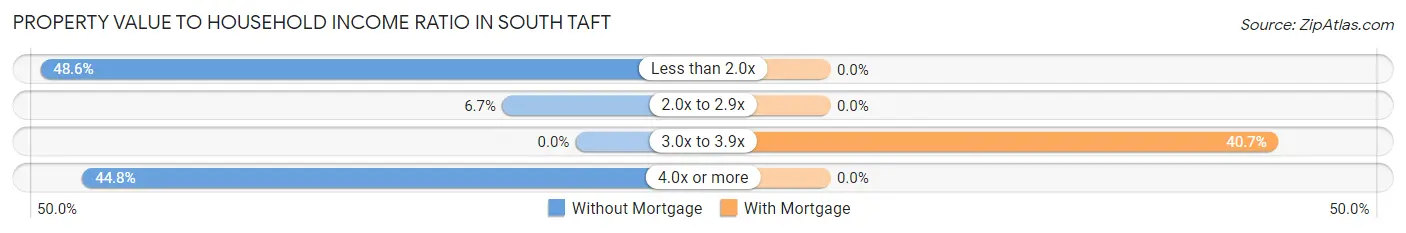
| Value-to-Income Ratio | Without Mortgage | With Mortgage |
| Less than 2.0x | 102 (48.6%) | 0 (0.0%) |
| 2.0x to 2.9x | 14 (6.7%) | 0 (0.0%) |
| 3.0x to 3.9x | 0 (0.0%) | 11 (40.7%) |
| 4.0x or more | 94 (44.8%) | 0 (0.0%) |
| Total | 210 (100.0%) | 27 (100.0%) |
Real Estate Taxes by Mortgage Status in South Taft
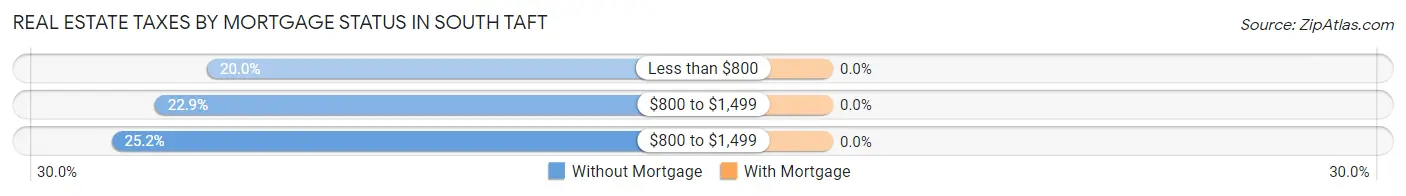
| Property Taxes | Without Mortgage | With Mortgage |
| Less than $800 | 42 (20.0%) | 0 (0.0%) |
| $800 to $1,499 | 48 (22.9%) | 0 (0.0%) |
| $800 to $1,499 | 53 (25.2%) | 0 (0.0%) |
| Total | 210 (100.0%) | 27 (100.0%) |
Health & Disability in South Taft
Health Insurance Coverage by Age in South Taft
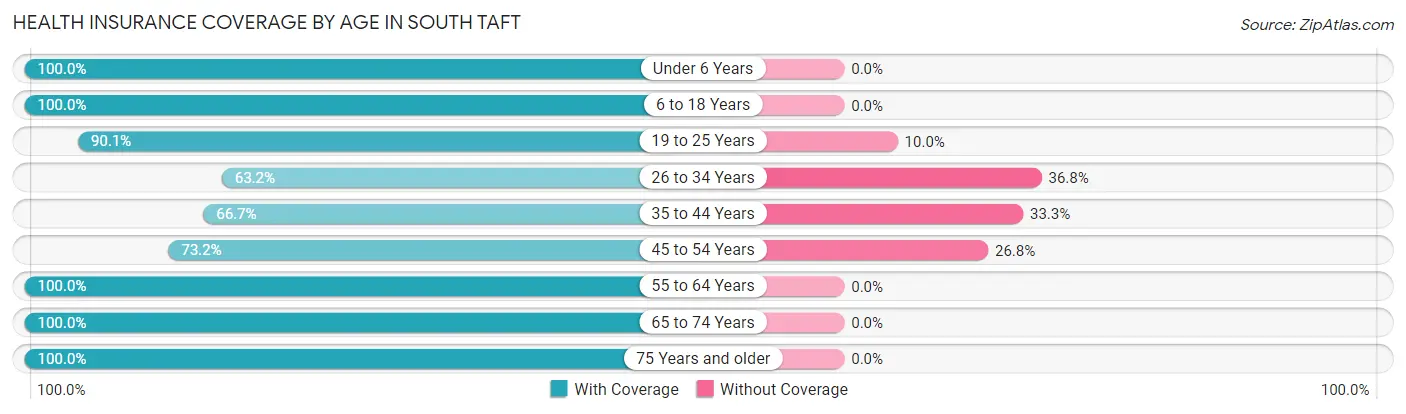
| Age Bracket | With Coverage | Without Coverage |
| Under 6 Years | 344 (100.0%) | 0 (0.0%) |
| 6 to 18 Years | 465 (100.0%) | 0 (0.0%) |
| 19 to 25 Years | 335 (90.0%) | 37 (10.0%) |
| 26 to 34 Years | 153 (63.2%) | 89 (36.8%) |
| 35 to 44 Years | 170 (66.7%) | 85 (33.3%) |
| 45 to 54 Years | 183 (73.2%) | 67 (26.8%) |
| 55 to 64 Years | 329 (100.0%) | 0 (0.0%) |
| 65 to 74 Years | 46 (100.0%) | 0 (0.0%) |
| 75 Years and older | 67 (100.0%) | 0 (0.0%) |
| Total | 2,092 (88.3%) | 278 (11.7%) |
Health Insurance Coverage by Citizenship Status in South Taft
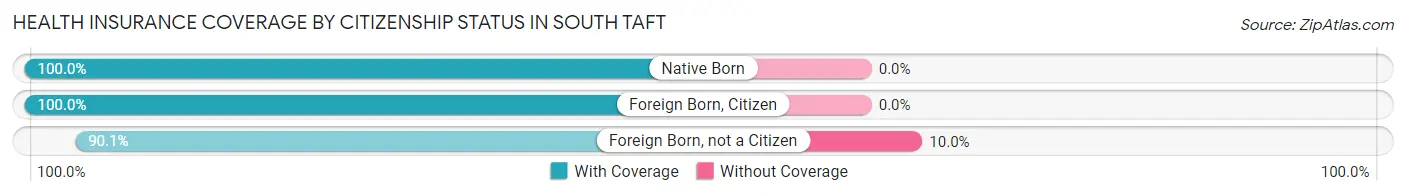
| Citizenship Status | With Coverage | Without Coverage |
| Native Born | 344 (100.0%) | 0 (0.0%) |
| Foreign Born, Citizen | 465 (100.0%) | 0 (0.0%) |
| Foreign Born, not a Citizen | 335 (90.0%) | 37 (10.0%) |
Health Insurance Coverage by Household Income in South Taft
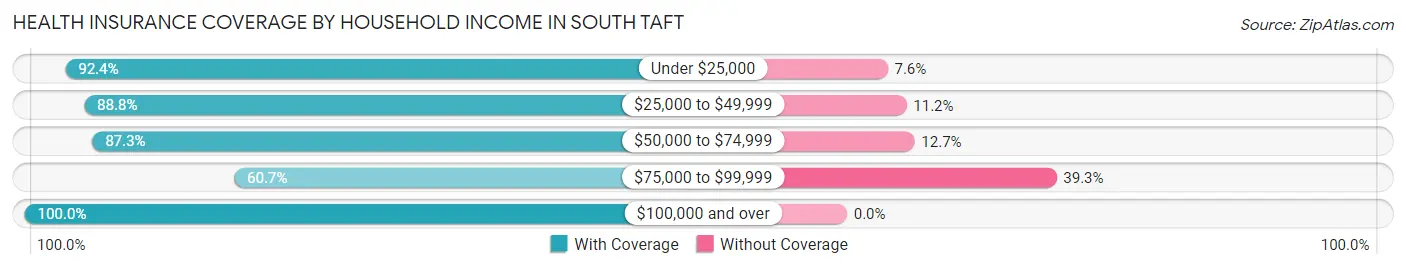
| Household Income | With Coverage | Without Coverage |
| Under $25,000 | 775 (92.4%) | 64 (7.6%) |
| $25,000 to $49,999 | 414 (88.8%) | 52 (11.2%) |
| $50,000 to $74,999 | 462 (87.3%) | 67 (12.7%) |
| $75,000 to $99,999 | 147 (60.7%) | 95 (39.3%) |
| $100,000 and over | 294 (100.0%) | 0 (0.0%) |
Public vs Private Health Insurance Coverage by Age in South Taft
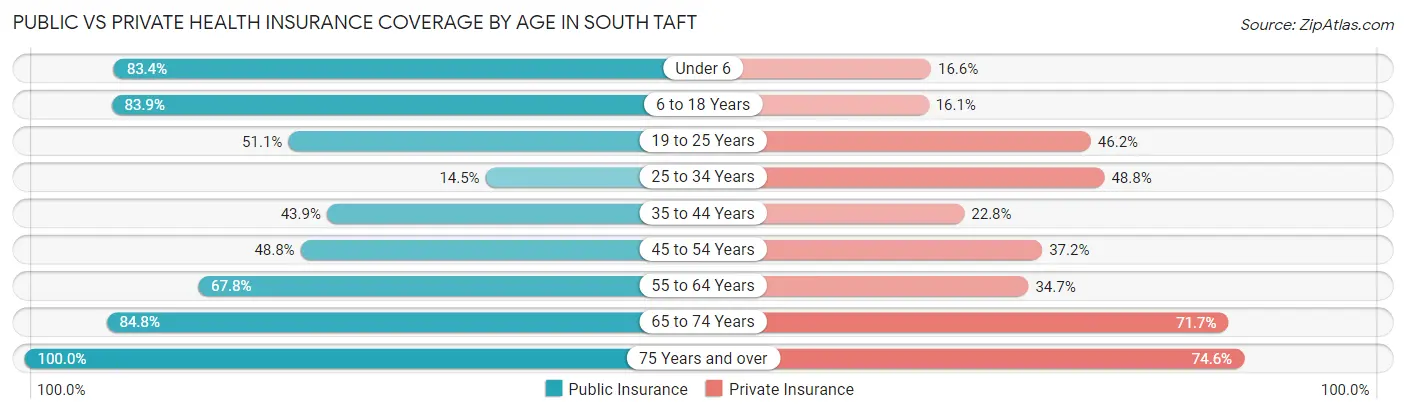
| Age Bracket | Public Insurance | Private Insurance |
| Under 6 | 287 (83.4%) | 57 (16.6%) |
| 6 to 18 Years | 390 (83.9%) | 75 (16.1%) |
| 19 to 25 Years | 190 (51.1%) | 172 (46.2%) |
| 25 to 34 Years | 35 (14.5%) | 118 (48.8%) |
| 35 to 44 Years | 112 (43.9%) | 58 (22.8%) |
| 45 to 54 Years | 122 (48.8%) | 93 (37.2%) |
| 55 to 64 Years | 223 (67.8%) | 114 (34.6%) |
| 65 to 74 Years | 39 (84.8%) | 33 (71.7%) |
| 75 Years and over | 67 (100.0%) | 50 (74.6%) |
| Total | 1,465 (61.8%) | 770 (32.5%) |
Disability Status by Sex by Age in South Taft
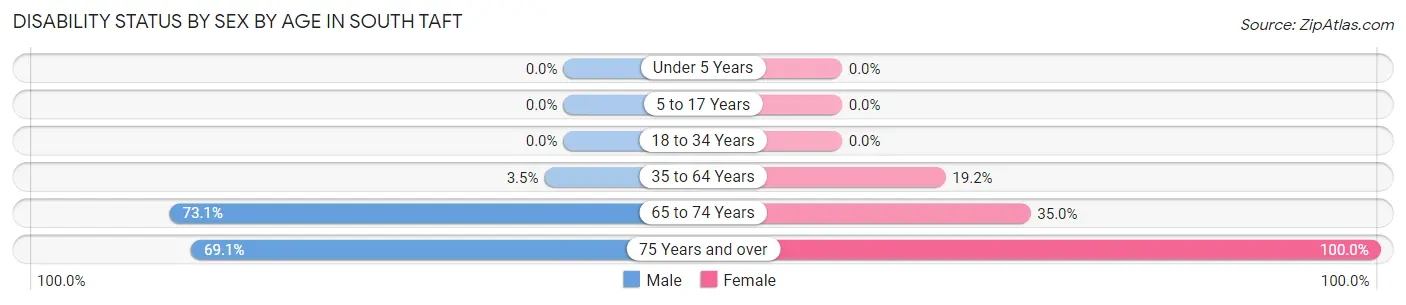
| Age Bracket | Male | Female |
| Under 5 Years | 0 (0.0%) | 0 (0.0%) |
| 5 to 17 Years | 0 (0.0%) | 0 (0.0%) |
| 18 to 34 Years | 0 (0.0%) | 0 (0.0%) |
| 35 to 64 Years | 12 (3.5%) | 95 (19.2%) |
| 65 to 74 Years | 19 (73.1%) | 7 (35.0%) |
| 75 Years and over | 38 (69.1%) | 12 (100.0%) |
Disability Class by Sex by Age in South Taft
Disability Class: Hearing Difficulty
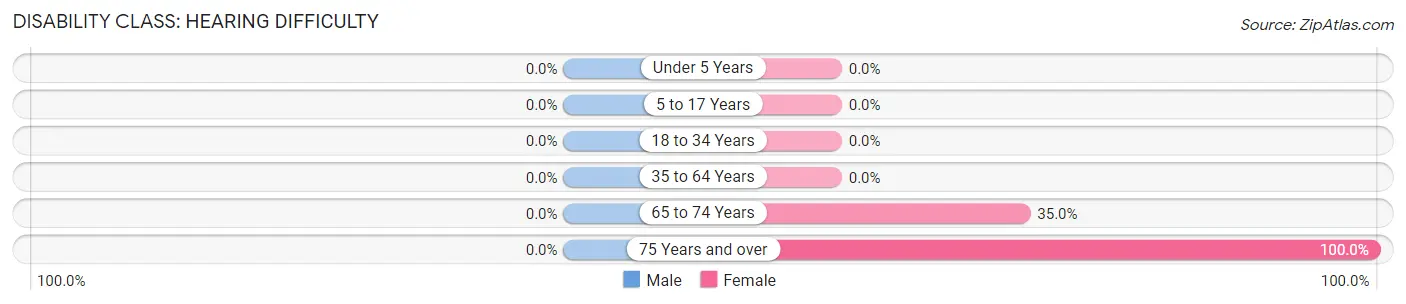
| Age Bracket | Male | Female |
| Under 5 Years | 0 (0.0%) | 0 (0.0%) |
| 5 to 17 Years | 0 (0.0%) | 0 (0.0%) |
| 18 to 34 Years | 0 (0.0%) | 0 (0.0%) |
| 35 to 64 Years | 0 (0.0%) | 0 (0.0%) |
| 65 to 74 Years | 0 (0.0%) | 7 (35.0%) |
| 75 Years and over | 0 (0.0%) | 12 (100.0%) |
Disability Class: Vision Difficulty
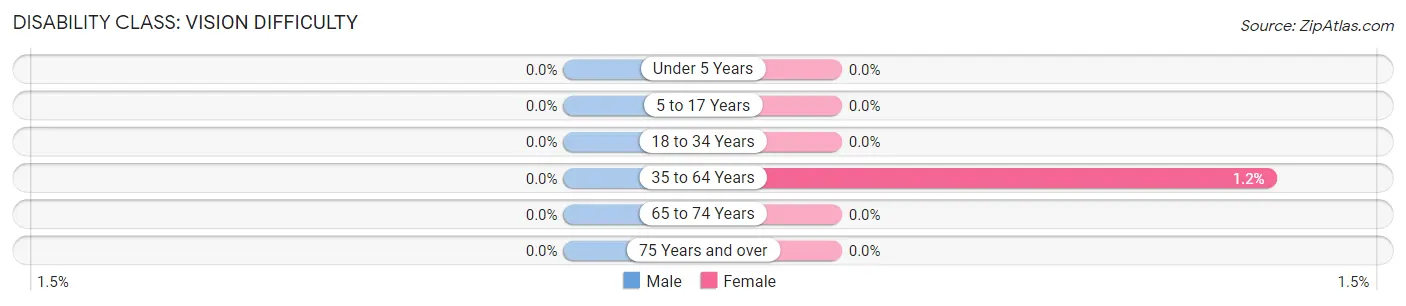
| Age Bracket | Male | Female |
| Under 5 Years | 0 (0.0%) | 0 (0.0%) |
| 5 to 17 Years | 0 (0.0%) | 0 (0.0%) |
| 18 to 34 Years | 0 (0.0%) | 0 (0.0%) |
| 35 to 64 Years | 0 (0.0%) | 6 (1.2%) |
| 65 to 74 Years | 0 (0.0%) | 0 (0.0%) |
| 75 Years and over | 0 (0.0%) | 0 (0.0%) |
Disability Class: Cognitive Difficulty
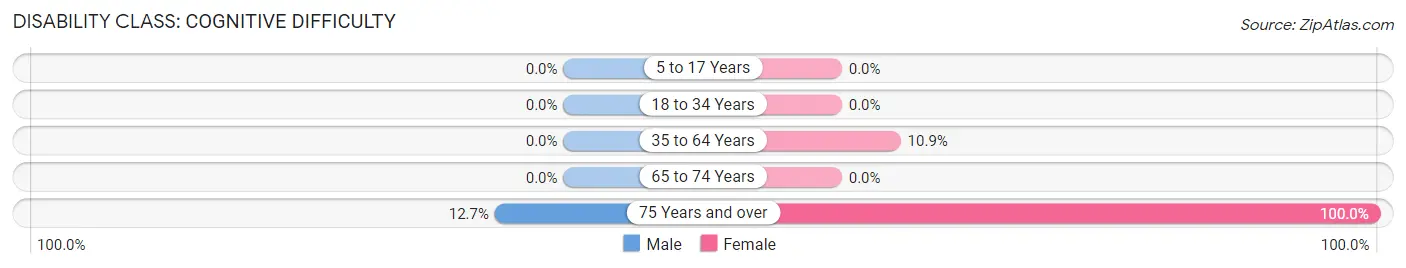
| Age Bracket | Male | Female |
| 5 to 17 Years | 0 (0.0%) | 0 (0.0%) |
| 18 to 34 Years | 0 (0.0%) | 0 (0.0%) |
| 35 to 64 Years | 0 (0.0%) | 54 (10.9%) |
| 65 to 74 Years | 0 (0.0%) | 0 (0.0%) |
| 75 Years and over | 7 (12.7%) | 12 (100.0%) |
Disability Class: Ambulatory Difficulty
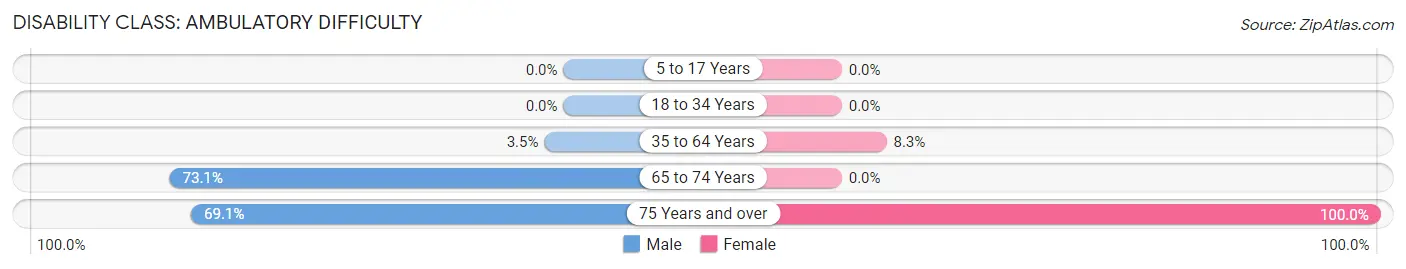
| Age Bracket | Male | Female |
| 5 to 17 Years | 0 (0.0%) | 0 (0.0%) |
| 18 to 34 Years | 0 (0.0%) | 0 (0.0%) |
| 35 to 64 Years | 12 (3.5%) | 41 (8.3%) |
| 65 to 74 Years | 19 (73.1%) | 0 (0.0%) |
| 75 Years and over | 38 (69.1%) | 12 (100.0%) |
Disability Class: Self-Care Difficulty
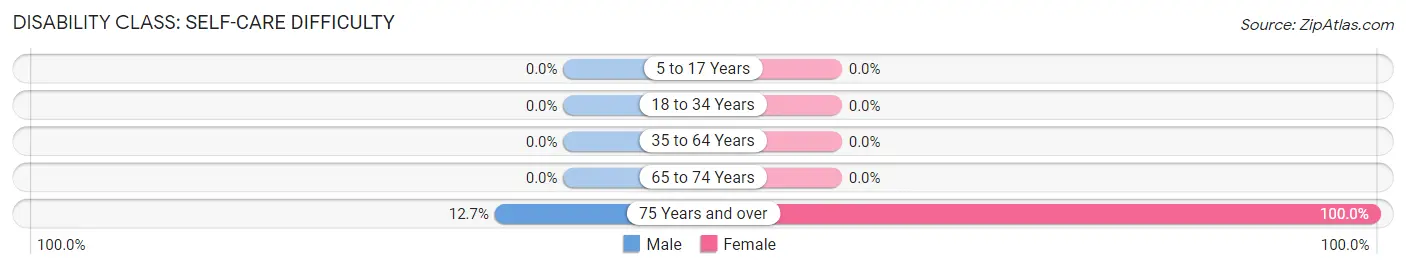
| Age Bracket | Male | Female |
| 5 to 17 Years | 0 (0.0%) | 0 (0.0%) |
| 18 to 34 Years | 0 (0.0%) | 0 (0.0%) |
| 35 to 64 Years | 0 (0.0%) | 0 (0.0%) |
| 65 to 74 Years | 0 (0.0%) | 0 (0.0%) |
| 75 Years and over | 7 (12.7%) | 12 (100.0%) |
Technology Access in South Taft
Computing Device Access in South Taft
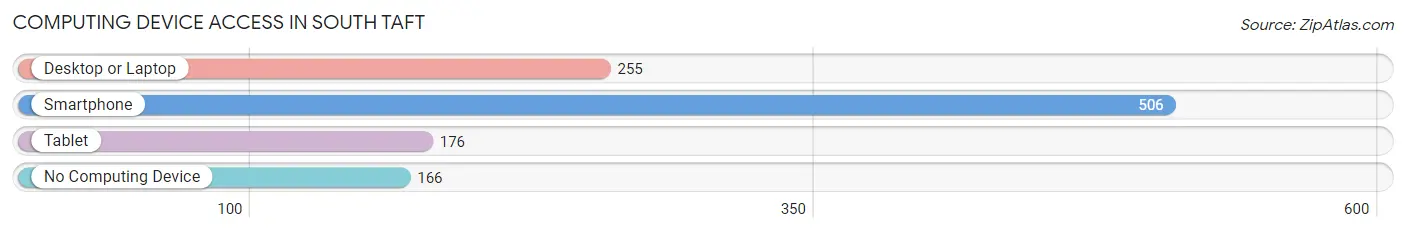
| Device Type | # Households | % Households |
| Desktop or Laptop | 255 | 38.0% |
| Smartphone | 506 | 75.3% |
| Tablet | 176 | 26.2% |
| No Computing Device | 166 | 24.7% |
| Total | 672 | 100.0% |
Internet Access in South Taft
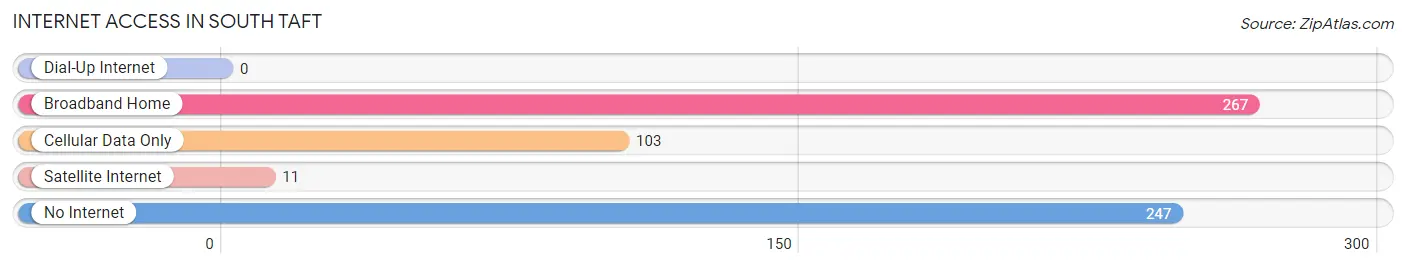
| Internet Type | # Households | % Households |
| Dial-Up Internet | 0 | 0.0% |
| Broadband Home | 267 | 39.7% |
| Cellular Data Only | 103 | 15.3% |
| Satellite Internet | 11 | 1.6% |
| No Internet | 247 | 36.8% |
| Total | 672 | 100.0% |
South Taft Summary
History
South Taft is a small unincorporated community located in the western part of Kern County, California. It is situated in the foothills of the Sierra Nevada Mountains, approximately 30 miles southwest of Bakersfield. The area was first settled in the late 1800s by ranchers and farmers, and the town was officially established in 1910.
The town was named after William Howard Taft, the 27th President of the United States. The town was originally known as “Taft Junction”, but the name was changed to South Taft in the 1920s.
The town was a major oil-producing area in the early 20th century, and the oil industry was the main source of employment for the residents. The town was also home to a large number of oil refineries, which provided jobs for many of the town’s residents.
In the 1950s, the town began to decline as the oil industry moved away from the area. The town’s population decreased significantly, and many of the businesses closed.
In the late 1970s, the town began to experience a resurgence as the oil industry returned to the area. The town’s population began to increase, and new businesses opened.
Geography
South Taft is located in the western part of Kern County, California. It is situated in the foothills of the Sierra Nevada Mountains, approximately 30 miles southwest of Bakersfield. The town is located at an elevation of 1,845 feet above sea level.
The town is surrounded by agricultural land, and the nearby towns of Maricopa and McKittrick are also located in the area. The town is located near the Kern River, which provides a source of water for the area.
Economy
The economy of South Taft is largely based on the oil industry. The town is home to several oil refineries, which provide jobs for many of the town’s residents. The town is also home to several agricultural businesses, which provide jobs for many of the town’s residents.
The town is also home to several small businesses, including restaurants, convenience stores, and other retail stores. The town is also home to a few small manufacturing businesses.
Demographics
As of the 2010 census, the population of South Taft was 2,845. The town has a population that is predominantly Hispanic, with a large percentage of the population being of Mexican descent. The town also has a small percentage of African American and Asian residents.
The median household income in South Taft is $37,917, and the median age is 33. The town has a poverty rate of 22.3%, which is higher than the national average.
Conclusion
South Taft is a small unincorporated community located in the western part of Kern County, California. It is situated in the foothills of the Sierra Nevada Mountains, approximately 30 miles southwest of Bakersfield. The town was originally established in 1910, and it was named after William Howard Taft, the 27th President of the United States. The town was a major oil-producing area in the early 20th century, and the oil industry was the main source of employment for the residents. In the 1950s, the town began to decline as the oil industry moved away from the area. In the late 1970s, the town began to experience a resurgence as the oil industry returned to the area. The town’s population is predominantly Hispanic, with a large percentage of the population being of Mexican descent. The town’s economy is largely based on the oil industry, and it is also home to several agricultural businesses and small businesses. The median household income in South Taft is $37,917, and the median age is 33.
Common Questions
What is Per Capita Income in South Taft?
Per Capita income in South Taft is $14,887.
What is the Median Family Income in South Taft?
Median Family Income in South Taft is $31,354.
What is the Median Household income in South Taft?
Median Household Income in South Taft is $28,333.
What is Income or Wage Gap in South Taft?
Income or Wage Gap in South Taft is 30.3%.
Women in South Taft earn 69.7 cents for every dollar earned by a man.
What is Inequality or Gini Index in South Taft?
Inequality or Gini Index in South Taft is 0.53.
What is the Total Population of South Taft?
Total Population of South Taft is 2,370.
What is the Total Male Population of South Taft?
Total Male Population of South Taft is 1,082.
What is the Total Female Population of South Taft?
Total Female Population of South Taft is 1,288.
What is the Ratio of Males per 100 Females in South Taft?
There are 84.01 Males per 100 Females in South Taft.
What is the Ratio of Females per 100 Males in South Taft?
There are 119.04 Females per 100 Males in South Taft.
What is the Median Population Age in South Taft?
Median Population Age in South Taft is 26.1 Years.
What is the Average Family Size in South Taft
Average Family Size in South Taft is 3.6 People.
What is the Average Household Size in South Taft
Average Household Size in South Taft is 3.5 People.
How Large is the Labor Force in South Taft?
There are 967 People in the Labor Forcein in South Taft.
What is the Percentage of People in the Labor Force in South Taft?
56.7% of People are in the Labor Force in South Taft.
What is the Unemployment Rate in South Taft?
Unemployment Rate in South Taft is 17.2%.