Cities with the Highest Unemployment Rate Amomg Youth Under the Age of 25 in Virginia
RELATED REPORTS & OPTIONS
Highest Unemployment | Youth < 25
Virginia
Compare Cities
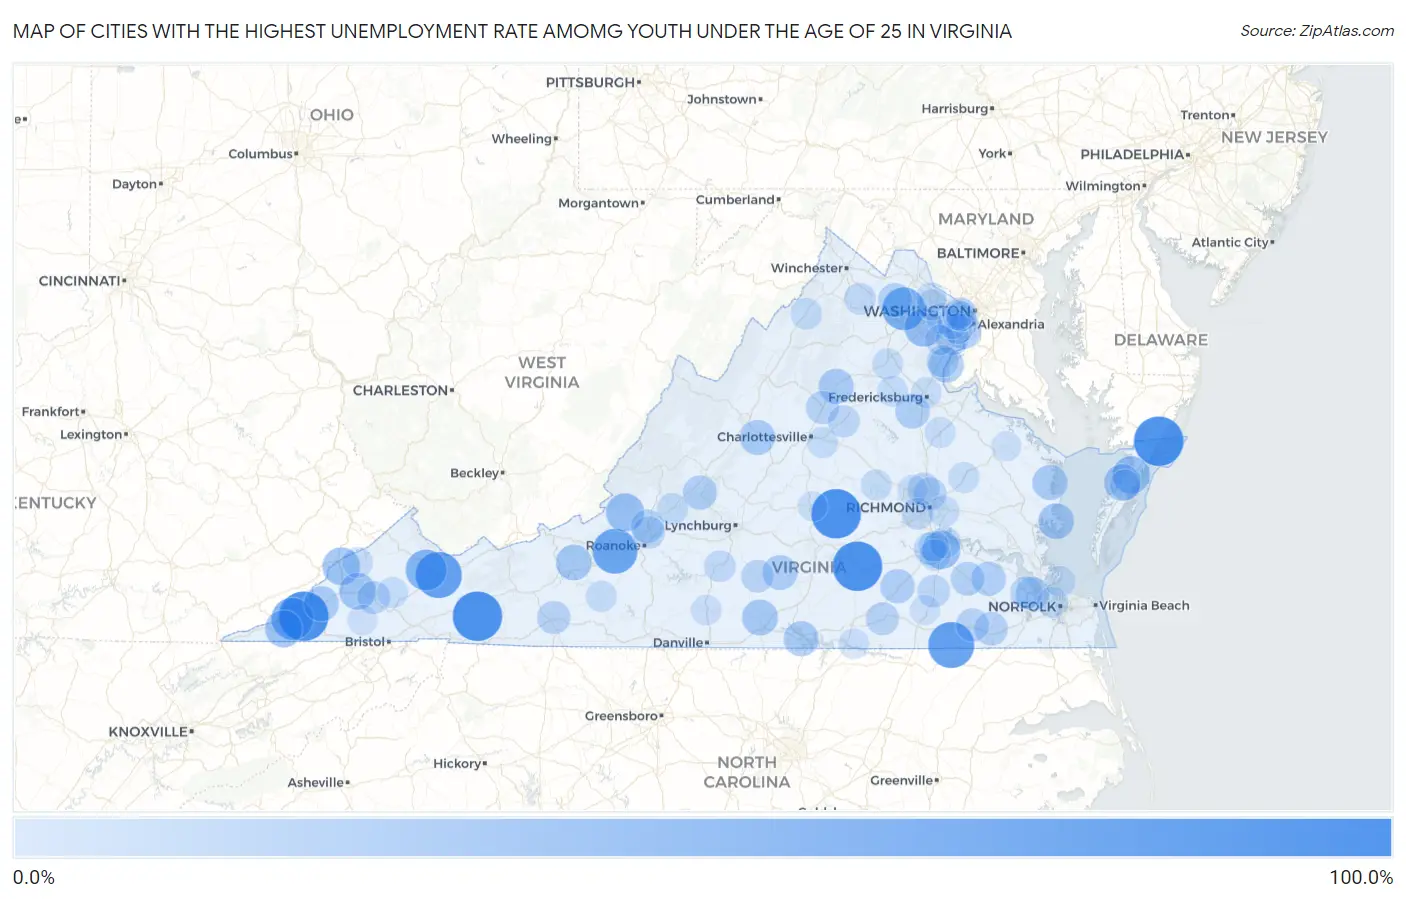
Map of Cities with the Highest Unemployment Rate Amomg Youth Under the Age of 25 in Virginia
0.0%
100.0%
Cities with the Highest Unemployment Rate Amomg Youth Under the Age of 25 in Virginia
| City | Youth Unemployment | vs State | vs National | |
| 1. | Captains Cove | 100.0% | 10.6%(+89.4)#1 | 10.9%(+89.1)#54 |
| 2. | Dryden | 100.0% | 10.6%(+89.4)#2 | 10.9%(+89.1)#82 |
| 3. | Cumberland | 100.0% | 10.6%(+89.4)#3 | 10.9%(+89.1)#135 |
| 4. | Aldie | 100.0% | 10.6%(+89.4)#4 | 10.9%(+89.1)#185 |
| 5. | Nottoway Court House | 100.0% | 10.6%(+89.4)#5 | 10.9%(+89.1)#263 |
| 6. | Osaka | 100.0% | 10.6%(+89.4)#6 | 10.9%(+89.1)#264 |
| 7. | Sugar Grove | 99.9% | 10.6%(+89.3)#7 | 10.9%(+89.0)#339 |
| 8. | Claypool Hill | 85.2% | 10.6%(+74.6)#8 | 10.9%(+74.3)#427 |
| 9. | Branchville | 84.5% | 10.6%(+73.9)#9 | 10.9%(+73.6)#431 |
| 10. | Lafayette | 79.0% | 10.6%(+68.4)#10 | 10.9%(+68.1)#470 |
| 11. | Innovation | 71.6% | 10.6%(+61.0)#11 | 10.9%(+60.7)#556 |
| 12. | Bull Run Mountain Estates | 70.1% | 10.6%(+59.5)#12 | 10.9%(+59.2)#582 |
| 13. | Pennington Gap | 67.0% | 10.6%(+56.4)#13 | 10.9%(+56.1)#626 |
| 14. | Raven | 62.7% | 10.6%(+52.1)#14 | 10.9%(+51.8)#715 |
| 15. | Loch Lomond | 51.9% | 10.6%(+41.3)#15 | 10.9%(+41.0)#1,023 |
| 16. | Fort Lee | 50.7% | 10.6%(+40.1)#16 | 10.9%(+39.8)#1,063 |
| 17. | New Castle | 50.0% | 10.6%(+39.4)#17 | 10.9%(+39.1)#1,118 |
| 18. | Chase Crossing | 49.1% | 10.6%(+38.5)#18 | 10.9%(+38.2)#1,206 |
| 19. | Pound | 47.7% | 10.6%(+37.1)#19 | 10.9%(+36.8)#1,250 |
| 20. | Jonesville | 46.5% | 10.6%(+35.9)#20 | 10.9%(+35.6)#1,289 |
| 21. | Meadowview | 44.9% | 10.6%(+34.3)#21 | 10.9%(+34.0)#1,370 |
| 22. | Coeburn | 44.4% | 10.6%(+33.8)#22 | 10.9%(+33.5)#1,389 |
| 23. | Onancock | 44.2% | 10.6%(+33.6)#23 | 10.9%(+33.3)#1,408 |
| 24. | Halifax | 41.0% | 10.6%(+30.4)#24 | 10.9%(+30.1)#1,645 |
| 25. | Mathews | 40.3% | 10.6%(+29.7)#25 | 10.9%(+29.4)#1,674 |
| 26. | Fairlawn | 40.0% | 10.6%(+29.4)#26 | 10.9%(+29.1)#1,687 |
| 27. | Hayfield | 38.0% | 10.6%(+27.4)#27 | 10.9%(+27.1)#1,847 |
| 28. | Big Stone Gap | 37.9% | 10.6%(+27.3)#28 | 10.9%(+27.0)#1,856 |
| 29. | Quantico | 37.8% | 10.6%(+27.2)#29 | 10.9%(+26.9)#1,868 |
| 30. | Kilmarnock | 37.7% | 10.6%(+27.1)#30 | 10.9%(+26.8)#1,873 |
| 31. | Lyndhurst | 37.4% | 10.6%(+26.8)#31 | 10.9%(+26.5)#1,907 |
| 32. | Clarksville | 37.4% | 10.6%(+26.8)#32 | 10.9%(+26.5)#1,908 |
| 33. | Madison | 37.4% | 10.6%(+26.8)#33 | 10.9%(+26.5)#1,910 |
| 34. | Phenix | 36.8% | 10.6%(+26.2)#34 | 10.9%(+25.9)#1,953 |
| 35. | Spotsylvania Courthouse | 35.5% | 10.6%(+24.9)#35 | 10.9%(+24.6)#2,051 |
| 36. | Allison Gap | 34.7% | 10.6%(+24.1)#36 | 10.9%(+23.8)#2,134 |
| 37. | Mckenney | 34.2% | 10.6%(+23.6)#37 | 10.9%(+23.3)#2,183 |
| 38. | Glasgow | 33.3% | 10.6%(+22.7)#38 | 10.9%(+22.4)#2,251 |
| 39. | Dendron | 33.3% | 10.6%(+22.7)#39 | 10.9%(+22.4)#2,307 |
| 40. | Middleburg | 32.8% | 10.6%(+22.2)#40 | 10.9%(+21.9)#2,374 |
| 41. | Carrollton | 32.2% | 10.6%(+21.6)#41 | 10.9%(+21.3)#2,424 |
| 42. | Waverly | 31.5% | 10.6%(+20.9)#42 | 10.9%(+20.6)#2,500 |
| 43. | Camptown | 30.8% | 10.6%(+20.2)#43 | 10.9%(+19.9)#2,587 |
| 44. | Daleville | 30.4% | 10.6%(+19.8)#44 | 10.9%(+19.5)#2,630 |
| 45. | Hillsville | 29.6% | 10.6%(+19.0)#45 | 10.9%(+18.7)#2,734 |
| 46. | Courtland | 29.6% | 10.6%(+19.0)#46 | 10.9%(+18.7)#2,735 |
| 47. | Ruckersville | 29.4% | 10.6%(+18.8)#47 | 10.9%(+18.5)#2,764 |
| 48. | Laurel Hill | 29.0% | 10.6%(+18.4)#48 | 10.9%(+18.1)#2,814 |
| 49. | Lawrenceville | 28.8% | 10.6%(+18.2)#49 | 10.9%(+17.9)#2,839 |
| 50. | St Paul | 27.8% | 10.6%(+17.2)#50 | 10.9%(+16.9)#2,992 |
| 51. | Chamberlayne | 27.7% | 10.6%(+17.1)#51 | 10.9%(+16.8)#3,000 |
| 52. | Brookneal | 27.4% | 10.6%(+16.8)#52 | 10.9%(+16.5)#3,050 |
| 53. | Cloverdale | 27.0% | 10.6%(+16.4)#53 | 10.9%(+16.1)#3,116 |
| 54. | Stony Creek | 26.6% | 10.6%(+16.0)#54 | 10.9%(+15.7)#3,186 |
| 55. | Benns Church | 26.5% | 10.6%(+15.9)#55 | 10.9%(+15.6)#3,209 |
| 56. | Ettrick | 26.3% | 10.6%(+15.7)#56 | 10.9%(+15.4)#3,234 |
| 57. | Great Falls Crossing | 26.2% | 10.6%(+15.6)#57 | 10.9%(+15.3)#3,271 |
| 58. | Glen Allen | 25.9% | 10.6%(+15.3)#58 | 10.9%(+15.0)#3,315 |
| 59. | Gordonsville | 25.0% | 10.6%(+14.4)#59 | 10.9%(+14.1)#3,462 |
| 60. | Triangle | 24.8% | 10.6%(+14.2)#60 | 10.9%(+13.9)#3,550 |
| 61. | Shenandoah Farms | 23.6% | 10.6%(+13.0)#61 | 10.9%(+12.7)#3,787 |
| 62. | Altavista | 23.4% | 10.6%(+12.8)#62 | 10.9%(+12.5)#3,833 |
| 63. | Manchester | 23.3% | 10.6%(+12.7)#63 | 10.9%(+12.4)#3,845 |
| 64. | Hopewell | 23.1% | 10.6%(+12.5)#64 | 10.9%(+12.2)#3,892 |
| 65. | Petersburg | 22.7% | 10.6%(+12.1)#65 | 10.9%(+11.8)#3,996 |
| 66. | Woodstock | 22.4% | 10.6%(+11.8)#66 | 10.9%(+11.5)#4,065 |
| 67. | Seven Corners | 22.2% | 10.6%(+11.6)#67 | 10.9%(+11.3)#4,114 |
| 68. | Buchanan | 22.2% | 10.6%(+11.6)#68 | 10.9%(+11.3)#4,135 |
| 69. | George Mason | 21.4% | 10.6%(+10.8)#69 | 10.9%(+10.5)#4,322 |
| 70. | Sandston | 21.4% | 10.6%(+10.8)#70 | 10.9%(+10.5)#4,324 |
| 71. | Floris | 21.3% | 10.6%(+10.7)#71 | 10.9%(+10.4)#4,361 |
| 72. | Floyd | 21.2% | 10.6%(+10.6)#72 | 10.9%(+10.3)#4,395 |
| 73. | Leesylvania | 21.1% | 10.6%(+10.5)#73 | 10.9%(+10.2)#4,401 |
| 74. | Cleveland | 21.0% | 10.6%(+10.4)#74 | 10.9%(+10.1)#4,458 |
| 75. | Rivanna | 20.8% | 10.6%(+10.2)#75 | 10.9%(+9.90)#4,501 |
| 76. | Goochland | 20.8% | 10.6%(+10.2)#76 | 10.9%(+9.90)#4,506 |
| 77. | Remington | 20.8% | 10.6%(+10.2)#77 | 10.9%(+9.90)#4,508 |
| 78. | Lake Of The Woods | 20.6% | 10.6%(+10.0)#78 | 10.9%(+9.70)#4,539 |
| 79. | Central Garage | 20.6% | 10.6%(+10.0)#79 | 10.9%(+9.70)#4,547 |
| 80. | Portsmouth | 20.5% | 10.6%(+9.90)#80 | 10.9%(+9.60)#4,559 |
| 81. | Bowling Green | 20.3% | 10.6%(+9.70)#81 | 10.9%(+9.40)#4,628 |
| 82. | Onley | 19.9% | 10.6%(+9.30)#82 | 10.9%(+9.00)#4,782 |
| 83. | Clintwood | 19.5% | 10.6%(+8.90)#83 | 10.9%(+8.60)#4,879 |
| 84. | Hampton | 19.3% | 10.6%(+8.70)#84 | 10.9%(+8.40)#4,919 |
| 85. | Falmouth | 19.2% | 10.6%(+8.60)#85 | 10.9%(+8.30)#4,962 |
| 86. | Springfield | 18.9% | 10.6%(+8.30)#86 | 10.9%(+8.00)#5,059 |
| 87. | County Center | 18.8% | 10.6%(+8.20)#87 | 10.9%(+7.90)#5,112 |
| 88. | Chatham | 18.8% | 10.6%(+8.20)#88 | 10.9%(+7.90)#5,114 |
| 89. | Colonial Heights | 18.7% | 10.6%(+8.10)#89 | 10.9%(+7.80)#5,125 |
| 90. | Falls Church | 18.7% | 10.6%(+8.10)#90 | 10.9%(+7.80)#5,127 |
| 91. | Bracey | 18.5% | 10.6%(+7.90)#91 | 10.9%(+7.60)#5,210 |
| 92. | Kings Park | 18.3% | 10.6%(+7.70)#92 | 10.9%(+7.40)#5,260 |
| 93. | Innsbrook | 17.9% | 10.6%(+7.30)#93 | 10.9%(+7.00)#5,413 |
| 94. | West Falls Church | 17.5% | 10.6%(+6.90)#94 | 10.9%(+6.60)#5,592 |
| 95. | Dillwyn | 17.5% | 10.6%(+6.90)#95 | 10.9%(+6.60)#5,626 |
| 96. | Oak Grove | 17.2% | 10.6%(+6.60)#96 | 10.9%(+6.30)#5,734 |
| 97. | Nickelsville | 17.2% | 10.6%(+6.60)#97 | 10.9%(+6.30)#5,751 |
| 98. | Lake Barcroft | 17.1% | 10.6%(+6.50)#98 | 10.9%(+6.20)#5,762 |
| 99. | Jarratt | 17.1% | 10.6%(+6.50)#99 | 10.9%(+6.20)#5,784 |
| 100. | Warsaw | 16.9% | 10.6%(+6.30)#100 | 10.9%(+6.00)#5,837 |
Common Questions
What are the Top 10 Cities with the Highest Unemployment Rate Amomg Youth Under the Age of 25 in Virginia?
Top 10 Cities with the Highest Unemployment Rate Amomg Youth Under the Age of 25 in Virginia are:
#1
100.0%
#2
100.0%
#3
100.0%
#4
100.0%
#5
99.9%
#6
85.2%
#7
84.5%
#8
79.0%
#9
70.1%
#10
67.0%
What city has the Highest Unemployment Rate Amomg Youth Under the Age of 25 in Virginia?
Captains Cove has the Highest Unemployment Rate Amomg Youth Under the Age of 25 in Virginia with 100.0%.
What is the Unemployment Rate Amomg Youth Under the Age of 25 in the State of Virginia?
Unemployment Rate Amomg Youth Under the Age of 25 in Virginia is 10.6%.
What is the Unemployment Rate Amomg Youth Under the Age of 25 in the United States?
Unemployment Rate Amomg Youth Under the Age of 25 in the United States is 10.9%.