Montara, CA Map & Demographics
Montara Map
Montara Overview
$99,498
PER CAPITA INCOME
$245,596
AVG FAMILY INCOME
$184,692
AVG HOUSEHOLD INCOME
13.6%
WAGE / INCOME GAP [ % ]
86.4¢/ $1
WAGE / INCOME GAP [ $ ]
0.38
INEQUALITY / GINI INDEX
2,649
TOTAL POPULATION
1,384
MALE POPULATION
1,265
FEMALE POPULATION
109.41
MALES / 100 FEMALES
91.40
FEMALES / 100 MALES
59.1
MEDIAN AGE
3.2
AVG FAMILY SIZE
2.5
AVG HOUSEHOLD SIZE
1,651
LABOR FORCE [ PEOPLE ]
66.0%
PERCENT IN LABOR FORCE
10.4%
UNEMPLOYMENT RATE
Montara Zip Codes
Income in Montara
Income Overview in Montara
Per Capita Income in Montara is $99,498, while median incomes of families and households are $245,596 and $184,692 respectively.
| Characteristic | Number | Measure |
| Per Capita Income | 2,649 | $99,498 |
| Median Family Income | 671 | $245,596 |
| Mean Family Income | 671 | $310,845 |
| Median Household Income | 1,033 | $184,692 |
| Mean Household Income | 1,033 | $256,598 |
| Income Deficit | 671 | $0 |
| Wage / Income Gap (%) | 2,649 | 13.56% |
| Wage / Income Gap ($) | 2,649 | 86.44¢ per $1 |
| Gini / Inequality Index | 2,649 | 0.38 |
Earnings by Sex in Montara
Average Earnings in Montara are $82,727, $91,262 for men and $78,890 for women, a difference of 13.6%.
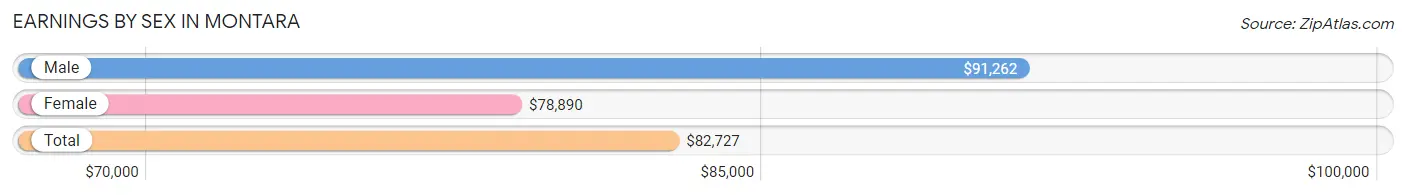
| Sex | Number | Average Earnings |
| Male | 763 (48.7%) | $91,262 |
| Female | 805 (51.3%) | $78,890 |
| Total | 1,568 (100.0%) | $82,727 |
Earnings by Sex by Income Bracket in Montara
The most common earnings brackets in Montara are $100,000+ for men (318 | 41.7%) and $100,000+ for women (246 | 30.6%).
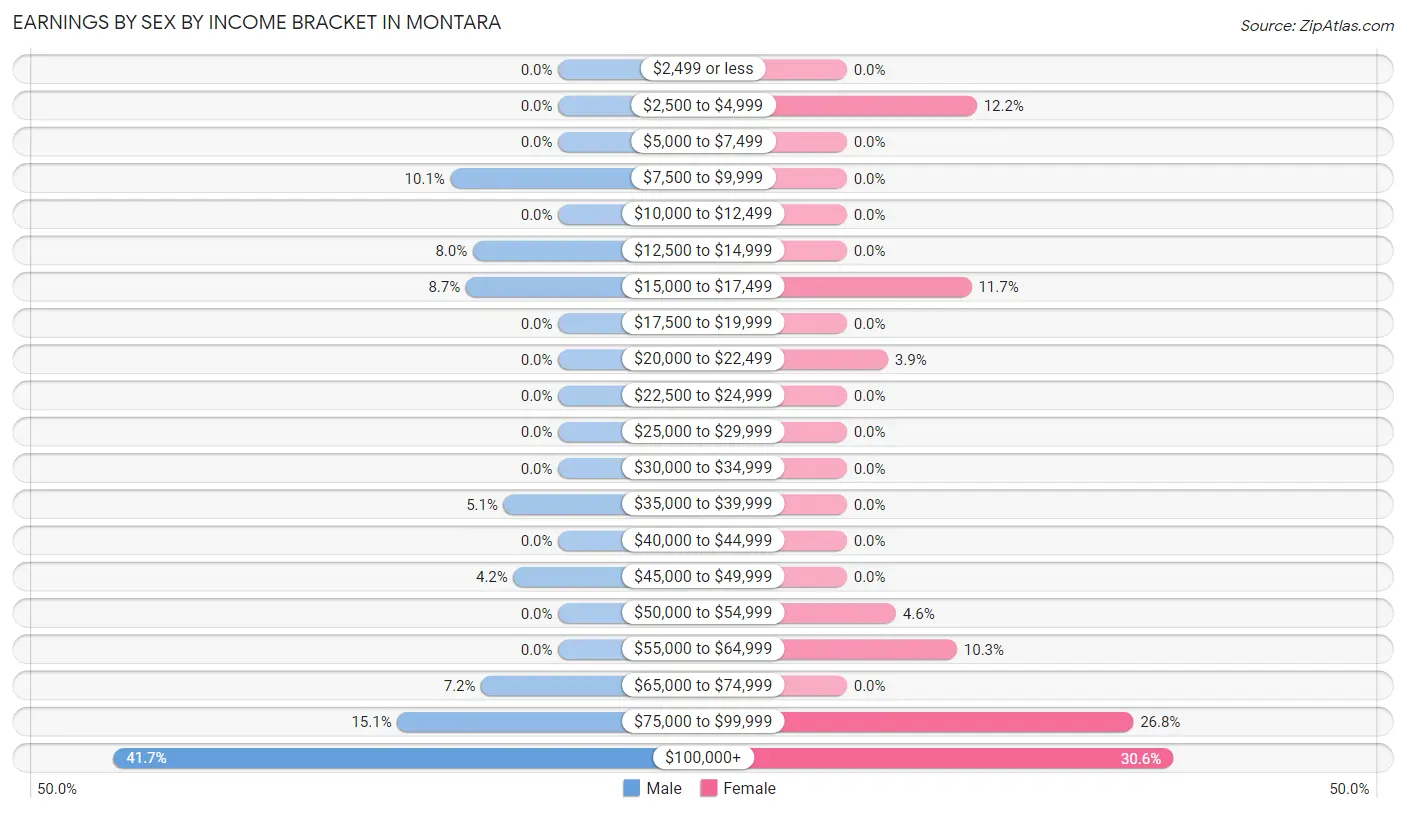
| Income | Male | Female |
| $2,499 or less | 0 (0.0%) | 0 (0.0%) |
| $2,500 to $4,999 | 0 (0.0%) | 98 (12.2%) |
| $5,000 to $7,499 | 0 (0.0%) | 0 (0.0%) |
| $7,500 to $9,999 | 77 (10.1%) | 0 (0.0%) |
| $10,000 to $12,499 | 0 (0.0%) | 0 (0.0%) |
| $12,500 to $14,999 | 61 (8.0%) | 0 (0.0%) |
| $15,000 to $17,499 | 66 (8.6%) | 94 (11.7%) |
| $17,500 to $19,999 | 0 (0.0%) | 0 (0.0%) |
| $20,000 to $22,499 | 0 (0.0%) | 31 (3.8%) |
| $22,500 to $24,999 | 0 (0.0%) | 0 (0.0%) |
| $25,000 to $29,999 | 0 (0.0%) | 0 (0.0%) |
| $30,000 to $34,999 | 0 (0.0%) | 0 (0.0%) |
| $35,000 to $39,999 | 39 (5.1%) | 0 (0.0%) |
| $40,000 to $44,999 | 0 (0.0%) | 0 (0.0%) |
| $45,000 to $49,999 | 32 (4.2%) | 0 (0.0%) |
| $50,000 to $54,999 | 0 (0.0%) | 37 (4.6%) |
| $55,000 to $64,999 | 0 (0.0%) | 83 (10.3%) |
| $65,000 to $74,999 | 55 (7.2%) | 0 (0.0%) |
| $75,000 to $99,999 | 115 (15.1%) | 216 (26.8%) |
| $100,000+ | 318 (41.7%) | 246 (30.6%) |
| Total | 763 (100.0%) | 805 (100.0%) |
Earnings by Sex by Educational Attainment in Montara
Average earnings in Montara are $92,010 for men and $79,766 for women, a difference of 13.3%. Men with an educational attainment of graduate degree enjoy the highest average annual earnings of $91,458, while those with graduate degree education earn the least with $91,458. Women with an educational attainment of graduate degree earn the most with the average annual earnings of $125,078, while those with college or associate's degree education have the smallest earnings of $17,154.
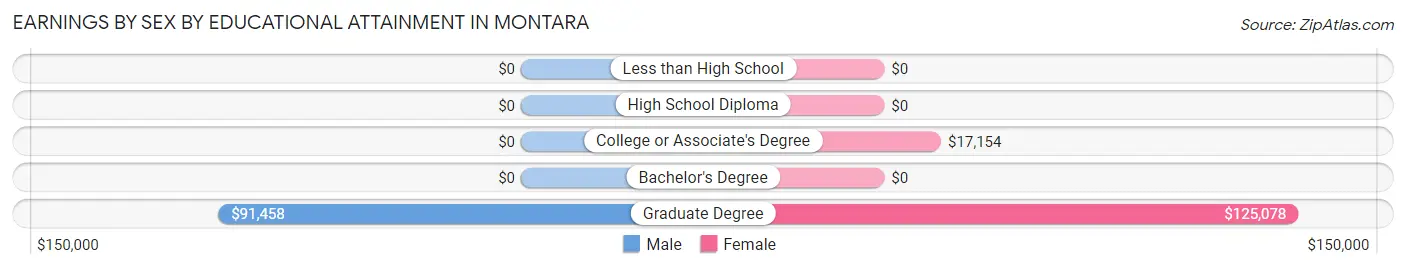
| Educational Attainment | Male Income | Female Income |
| Less than High School | - | - |
| High School Diploma | - | - |
| College or Associate's Degree | - | - |
| Bachelor's Degree | - | - |
| Graduate Degree | $91,458 | $125,078 |
| Total | $92,010 | $79,766 |
Family Income in Montara
Family Income Brackets in Montara
According to the Montara family income data, there are 351 families falling into the $200,000+ income range, which is the most common income bracket and makes up 52.3% of all families.
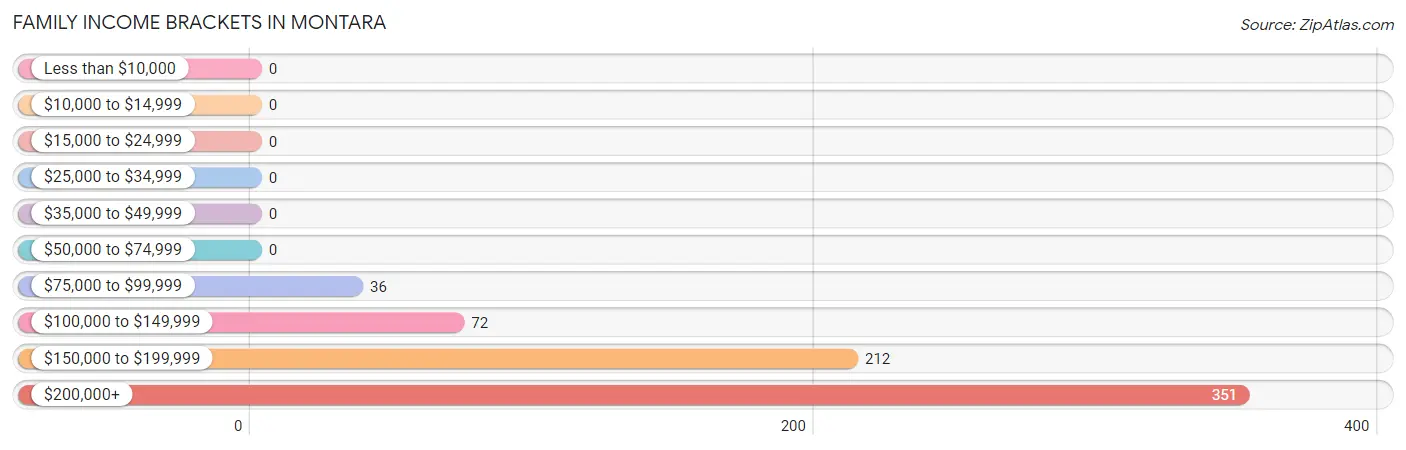
| Income Bracket | # Families | % Families |
| Less than $10,000 | 0 | 0.0% |
| $10,000 to $14,999 | 0 | 0.0% |
| $15,000 to $24,999 | 0 | 0.0% |
| $25,000 to $34,999 | 0 | 0.0% |
| $35,000 to $49,999 | 0 | 0.0% |
| $50,000 to $74,999 | 0 | 0.0% |
| $75,000 to $99,999 | 36 | 5.4% |
| $100,000 to $149,999 | 72 | 10.7% |
| $150,000 to $199,999 | 212 | 31.6% |
| $200,000+ | 351 | 52.3% |
Family Income by Famaliy Size in Montara
2-person families (257 | 38.3%) account for the highest median family income in Montara with $250,001 per family, while 2-person families (257 | 38.3%) have the highest median income of $125,000 per family member.
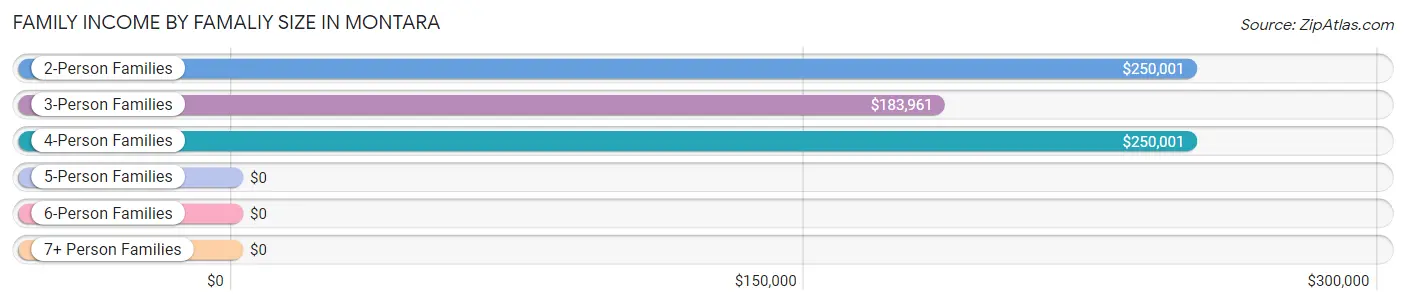
| Income Bracket | # Families | Median Income |
| 2-Person Families | 257 (38.3%) | $250,001 |
| 3-Person Families | 194 (28.9%) | $183,961 |
| 4-Person Families | 220 (32.8%) | $250,001 |
| 5-Person Families | 0 (0.0%) | $0 |
| 6-Person Families | 0 (0.0%) | $0 |
| 7+ Person Families | 0 (0.0%) | $0 |
| Total | 671 (100.0%) | $245,596 |
Family Income by Number of Earners in Montara
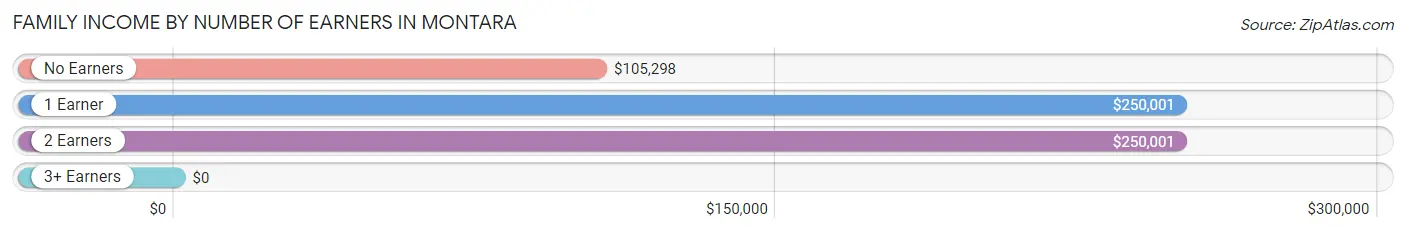
| Number of Earners | # Families | Median Income |
| No Earners | 77 (11.5%) | $105,298 |
| 1 Earner | 154 (23.0%) | $250,001 |
| 2 Earners | 323 (48.1%) | $250,001 |
| 3+ Earners | 117 (17.4%) | $0 |
| Total | 671 (100.0%) | $245,596 |
Household Income in Montara
Household Income Brackets in Montara
With 476 households falling in the category, the $200,000+ income range is the most frequent in Montara, accounting for 46.1% of all households.
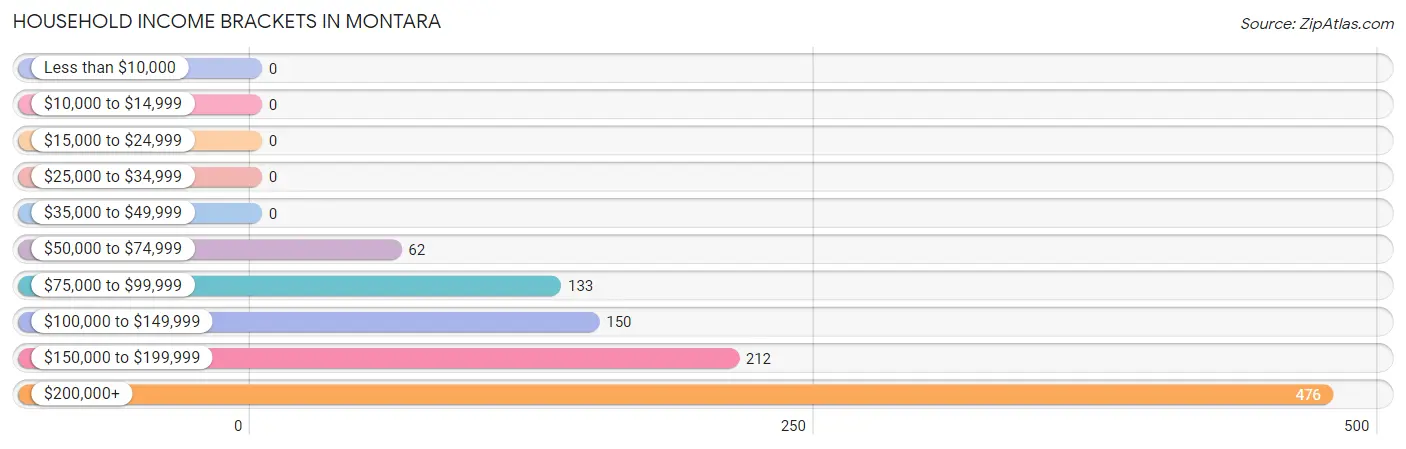
| Income Bracket | # Households | % Households |
| Less than $10,000 | 0 | 0.0% |
| $10,000 to $14,999 | 0 | 0.0% |
| $15,000 to $24,999 | 0 | 0.0% |
| $25,000 to $34,999 | 0 | 0.0% |
| $35,000 to $49,999 | 0 | 0.0% |
| $50,000 to $74,999 | 62 | 6.0% |
| $75,000 to $99,999 | 133 | 12.9% |
| $100,000 to $149,999 | 150 | 14.5% |
| $150,000 to $199,999 | 212 | 20.5% |
| $200,000+ | 476 | 46.1% |
Household Income by Householder Age in Montara
The median household income in Montara is $184,692, with the highest median household income of $245,404 found in the 45 to 64 years age bracket for the primary householder. A total of 493 households (47.7%) fall into this category.
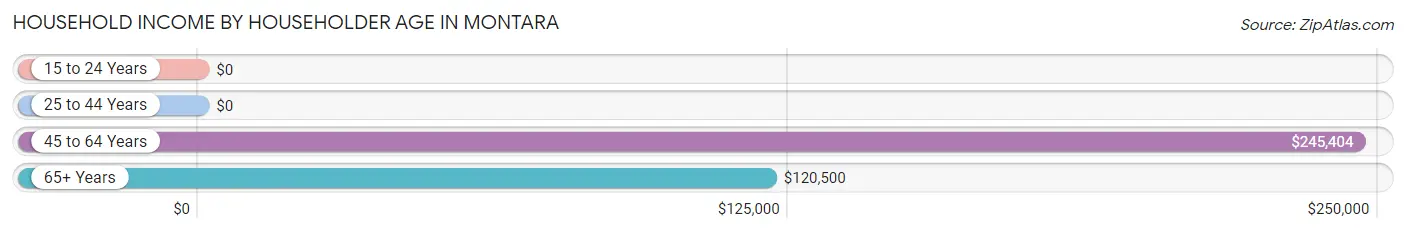
| Income Bracket | # Households | Median Income |
| 15 to 24 Years | 0 (0.0%) | $0 |
| 25 to 44 Years | 102 (9.9%) | $0 |
| 45 to 64 Years | 493 (47.7%) | $245,404 |
| 65+ Years | 438 (42.4%) | $120,500 |
| Total | 1,033 (100.0%) | $184,692 |
Poverty in Montara
Income Below Poverty by Sex and Age in Montara
With 5.6% poverty level for males and 2.3% for females among the residents of Montara, 16 and 17 year old males and 75 year old and over females are the most vulnerable to poverty, with 6 males (100.0%) and 6 females (16.7%) in their respective age groups living below the poverty level.
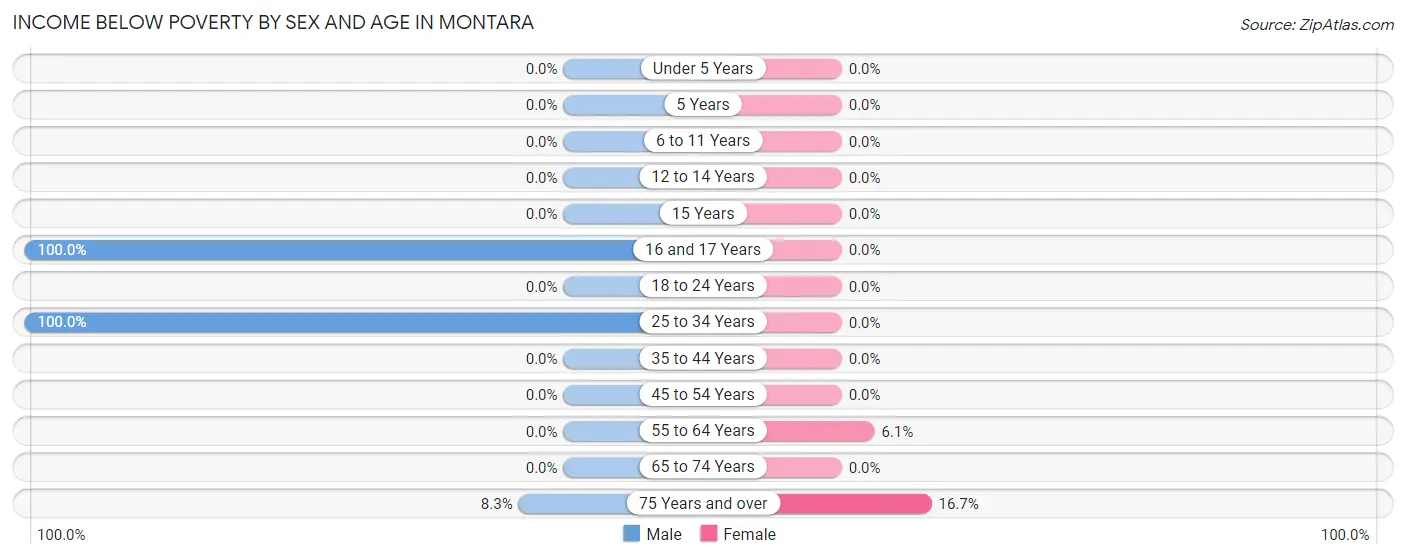
| Age Bracket | Male | Female |
| Under 5 Years | 0 (0.0%) | 0 (0.0%) |
| 5 Years | 0 (0.0%) | 0 (0.0%) |
| 6 to 11 Years | 0 (0.0%) | 0 (0.0%) |
| 12 to 14 Years | 0 (0.0%) | 0 (0.0%) |
| 15 Years | 0 (0.0%) | 0 (0.0%) |
| 16 and 17 Years | 6 (100.0%) | 0 (0.0%) |
| 18 to 24 Years | 0 (0.0%) | 0 (0.0%) |
| 25 to 34 Years | 66 (100.0%) | 0 (0.0%) |
| 35 to 44 Years | 0 (0.0%) | 0 (0.0%) |
| 45 to 54 Years | 0 (0.0%) | 0 (0.0%) |
| 55 to 64 Years | 0 (0.0%) | 23 (6.1%) |
| 65 to 74 Years | 0 (0.0%) | 0 (0.0%) |
| 75 Years and over | 6 (8.3%) | 6 (16.7%) |
| Total | 78 (5.6%) | 29 (2.3%) |
Income Above Poverty by Sex and Age in Montara
According to the poverty statistics in Montara, males aged 6 to 11 years and females aged under 5 years are the age groups that are most secure financially, with 100.0% of males and 100.0% of females in these age groups living above the poverty line.
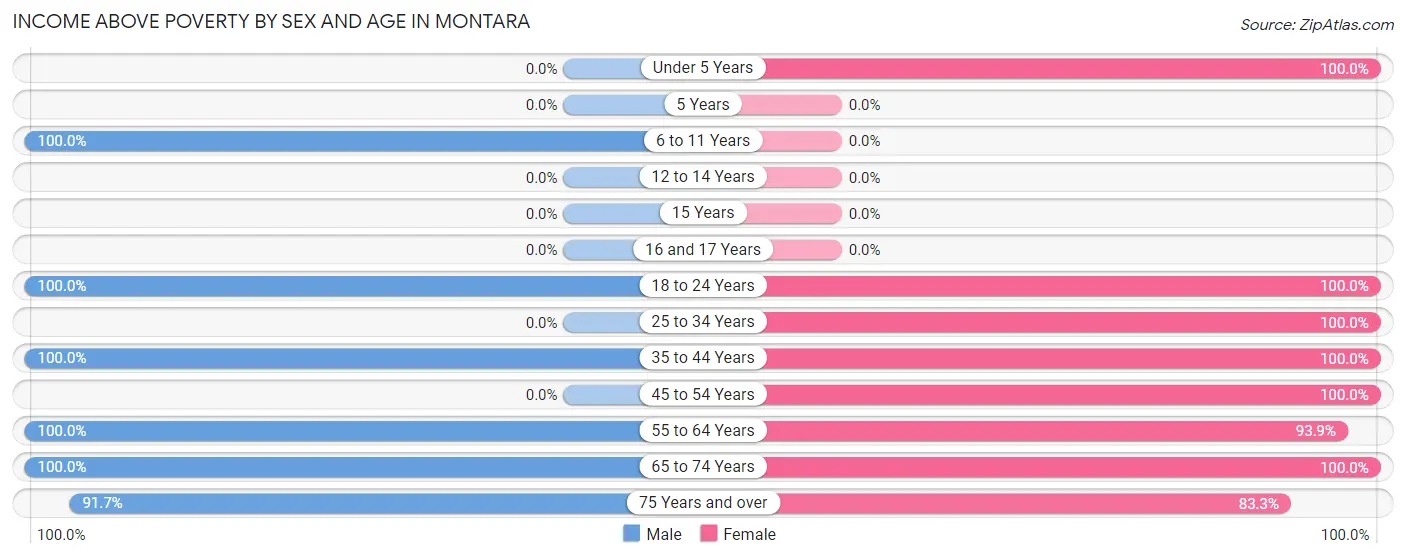
| Age Bracket | Male | Female |
| Under 5 Years | 0 (0.0%) | 116 (100.0%) |
| 5 Years | 0 (0.0%) | 0 (0.0%) |
| 6 to 11 Years | 32 (100.0%) | 0 (0.0%) |
| 12 to 14 Years | 0 (0.0%) | 0 (0.0%) |
| 15 Years | 0 (0.0%) | 0 (0.0%) |
| 16 and 17 Years | 0 (0.0%) | 0 (0.0%) |
| 18 to 24 Years | 421 (100.0%) | 75 (100.0%) |
| 25 to 34 Years | 0 (0.0%) | 43 (100.0%) |
| 35 to 44 Years | 106 (100.0%) | 200 (100.0%) |
| 45 to 54 Years | 0 (0.0%) | 33 (100.0%) |
| 55 to 64 Years | 258 (100.0%) | 356 (93.9%) |
| 65 to 74 Years | 423 (100.0%) | 383 (100.0%) |
| 75 Years and over | 66 (91.7%) | 30 (83.3%) |
| Total | 1,306 (94.4%) | 1,236 (97.7%) |
Income Below Poverty Among Married-Couple Families in Montara
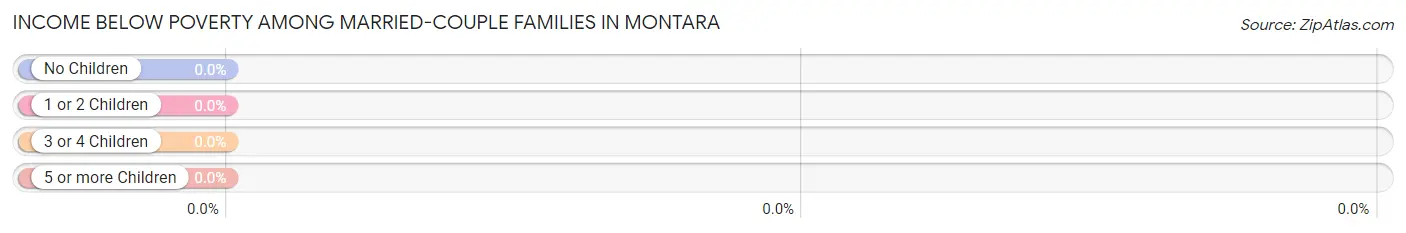
| Children | Above Poverty | Below Poverty |
| No Children | 538 (100.0%) | 0 (0.0%) |
| 1 or 2 Children | 102 (100.0%) | 0 (0.0%) |
| 3 or 4 Children | 0 (0.0%) | 0 (0.0%) |
| 5 or more Children | 0 (0.0%) | 0 (0.0%) |
| Total | 640 (100.0%) | 0 (0.0%) |
Income Below Poverty Among Single-Parent Households in Montara
| Children | Single Father | Single Mother |
| No Children | 0 (0.0%) | 0 (0.0%) |
| 1 or 2 Children | 0 (0.0%) | 0 (0.0%) |
| 3 or 4 Children | 0 (0.0%) | 0 (0.0%) |
| 5 or more Children | 0 (0.0%) | 0 (0.0%) |
| Total | 0 (0.0%) | 0 (0.0%) |
Income Below Poverty Among Married-Couple vs Single-Parent Households in Montara
| Children | Married-Couple Families | Single-Parent Households |
| No Children | 0 (0.0%) | 0 (0.0%) |
| 1 or 2 Children | 0 (0.0%) | 0 (0.0%) |
| 3 or 4 Children | 0 (0.0%) | 0 (0.0%) |
| 5 or more Children | 0 (0.0%) | 0 (0.0%) |
| Total | 0 (0.0%) | 0 (0.0%) |
Race in Montara
The most populous races in Montara are White / Caucasian (2,222 | 83.9%), Hispanic or Latino (386 | 14.6%), and Two or more Races (380 | 14.3%).
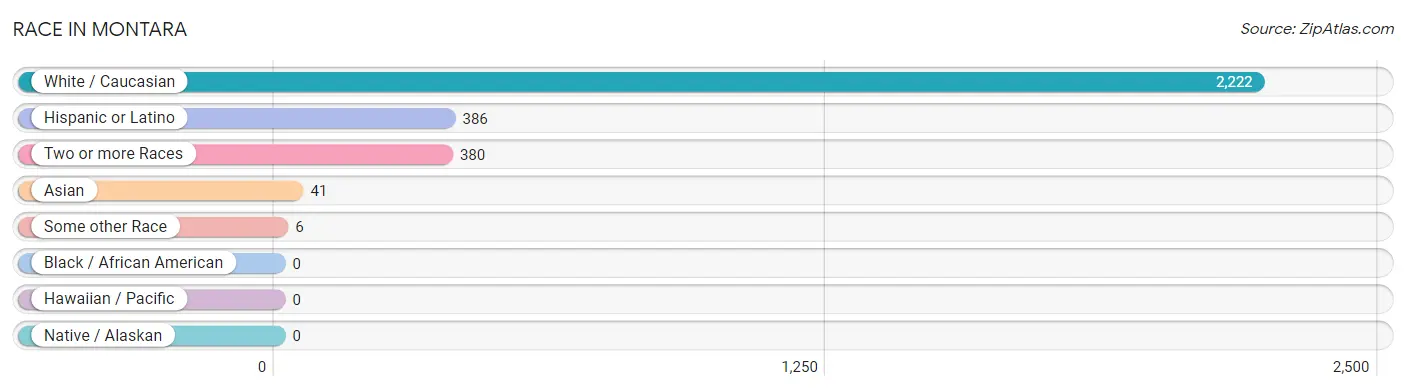
| Race | # Population | % Population |
| Asian | 41 | 1.5% |
| Black / African American | 0 | 0.0% |
| Hawaiian / Pacific | 0 | 0.0% |
| Hispanic or Latino | 386 | 14.6% |
| Native / Alaskan | 0 | 0.0% |
| White / Caucasian | 2,222 | 83.9% |
| Two or more Races | 380 | 14.3% |
| Some other Race | 6 | 0.2% |
| Total | 2,649 | 100.0% |
Ancestry in Montara
The most populous ancestries reported in Montara are English (782 | 29.5%), German (709 | 26.8%), British (238 | 9.0%), Mexican (218 | 8.2%), and Irish (210 | 7.9%), together accounting for 81.4% of all Montara residents.
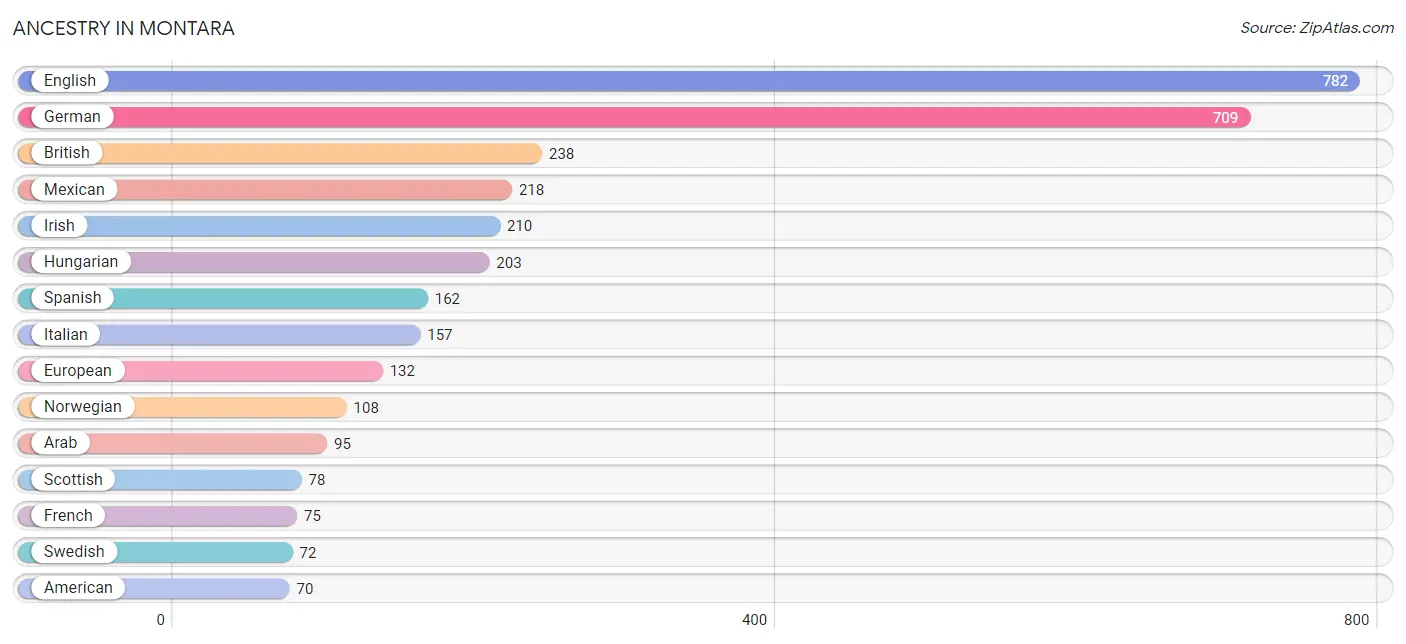
| Ancestry | # Population | % Population |
| American | 70 | 2.6% |
| Arab | 95 | 3.6% |
| British | 238 | 9.0% |
| Central American | 6 | 0.2% |
| Czech | 14 | 0.5% |
| Dutch | 35 | 1.3% |
| English | 782 | 29.5% |
| European | 132 | 5.0% |
| French | 75 | 2.8% |
| German | 709 | 26.8% |
| Guatemalan | 6 | 0.2% |
| Hungarian | 203 | 7.7% |
| Indian (Asian) | 41 | 1.5% |
| Iraqi | 66 | 2.5% |
| Irish | 210 | 7.9% |
| Italian | 157 | 5.9% |
| Mexican | 218 | 8.2% |
| Norwegian | 108 | 4.1% |
| Scotch-Irish | 51 | 1.9% |
| Scottish | 78 | 2.9% |
| Spanish | 162 | 6.1% |
| Swedish | 72 | 2.7% |
| Swiss | 37 | 1.4% |
| Syrian | 29 | 1.1% | View All 24 Rows |
Immigrants in Montara
The most numerous immigrant groups reported in Montara came from Europe (238 | 9.0%), Northern Europe (171 | 6.5%), Asia (89 | 3.4%), Germany (67 | 2.5%), and Western Europe (67 | 2.5%), together accounting for 23.9% of all Montara residents.
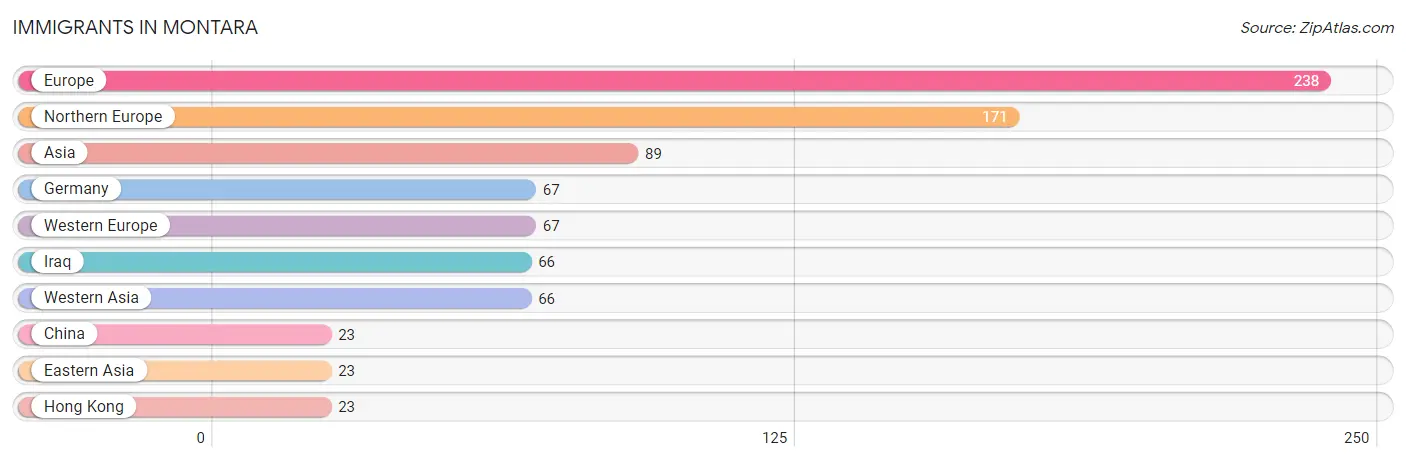
| Immigration Origin | # Population | % Population |
| Asia | 89 | 3.4% |
| China | 23 | 0.9% |
| Eastern Asia | 23 | 0.9% |
| Europe | 238 | 9.0% |
| Germany | 67 | 2.5% |
| Hong Kong | 23 | 0.9% |
| Iraq | 66 | 2.5% |
| Northern Europe | 171 | 6.5% |
| Western Asia | 66 | 2.5% |
| Western Europe | 67 | 2.5% | View All 10 Rows |
Sex and Age in Montara
Sex and Age in Montara
The most populous age groups in Montara are 20 to 24 Years (360 | 26.0%) for men and 55 to 59 Years (270 | 21.3%) for women.
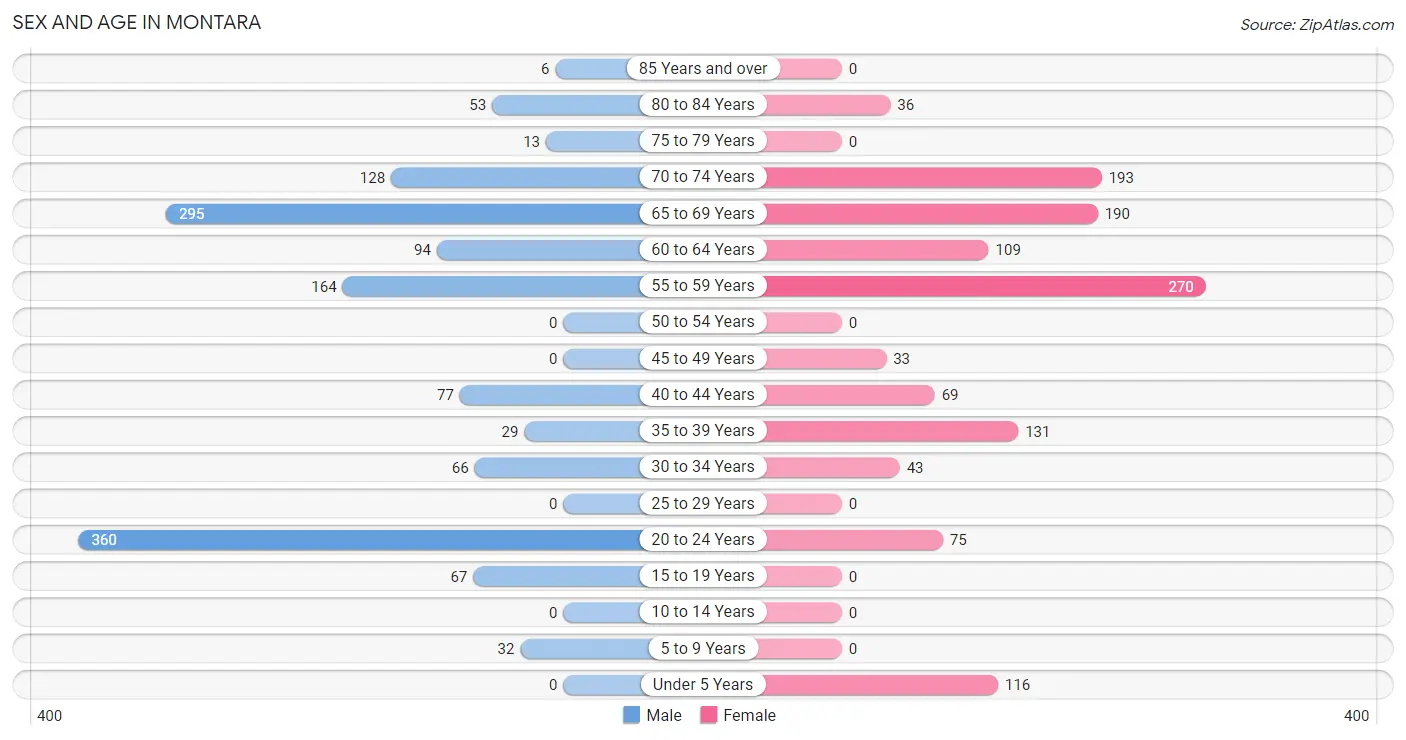
| Age Bracket | Male | Female |
| Under 5 Years | 0 (0.0%) | 116 (9.2%) |
| 5 to 9 Years | 32 (2.3%) | 0 (0.0%) |
| 10 to 14 Years | 0 (0.0%) | 0 (0.0%) |
| 15 to 19 Years | 67 (4.8%) | 0 (0.0%) |
| 20 to 24 Years | 360 (26.0%) | 75 (5.9%) |
| 25 to 29 Years | 0 (0.0%) | 0 (0.0%) |
| 30 to 34 Years | 66 (4.8%) | 43 (3.4%) |
| 35 to 39 Years | 29 (2.1%) | 131 (10.4%) |
| 40 to 44 Years | 77 (5.6%) | 69 (5.4%) |
| 45 to 49 Years | 0 (0.0%) | 33 (2.6%) |
| 50 to 54 Years | 0 (0.0%) | 0 (0.0%) |
| 55 to 59 Years | 164 (11.8%) | 270 (21.3%) |
| 60 to 64 Years | 94 (6.8%) | 109 (8.6%) |
| 65 to 69 Years | 295 (21.3%) | 190 (15.0%) |
| 70 to 74 Years | 128 (9.2%) | 193 (15.3%) |
| 75 to 79 Years | 13 (0.9%) | 0 (0.0%) |
| 80 to 84 Years | 53 (3.8%) | 36 (2.9%) |
| 85 Years and over | 6 (0.4%) | 0 (0.0%) |
| Total | 1,384 (100.0%) | 1,265 (100.0%) |
Families and Households in Montara
Median Family Size in Montara
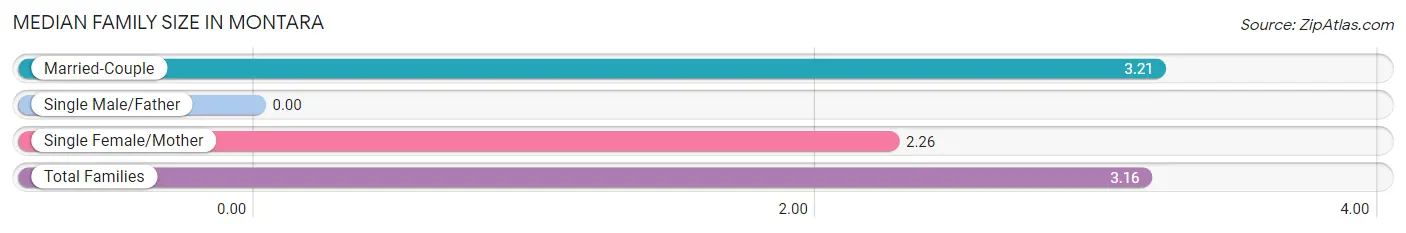
| Family Type | # Families | Family Size |
| Married-Couple | 640 (95.4%) | 3.21 |
| Single Male/Father | 0 (0.0%) | - |
| Single Female/Mother | 31 (4.6%) | 2.26 |
| Total Families | 671 (100.0%) | 3.16 |
Median Household Size in Montara
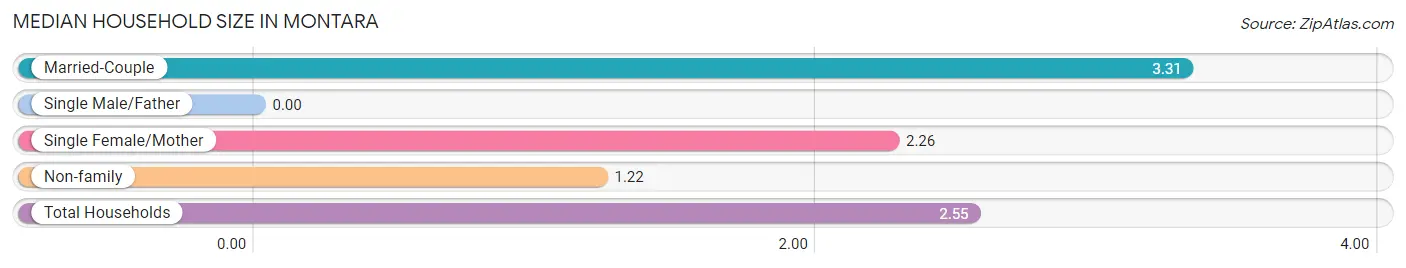
| Household Type | # Households | Household Size |
| Married-Couple | 640 (62.0%) | 3.31 |
| Single Male/Father | 0 (0.0%) | - |
| Single Female/Mother | 31 (3.0%) | 2.26 |
| Non-family | 362 (35.0%) | 1.22 |
| Total Households | 1,033 (100.0%) | 2.55 |
Household Size by Marriage Status in Montara
Out of a total of 1,033 households in Montara, 671 (65.0%) are family households, while 362 (35.0%) are nonfamily households. The most numerous type of family households are 3-person households, comprising 249, and the most common type of nonfamily households are 1-person households, comprising 288.
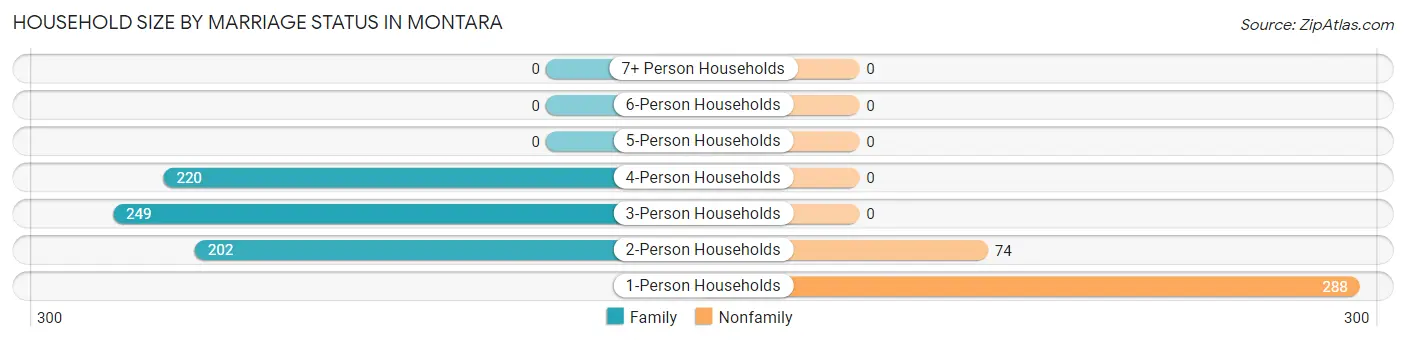
| Household Size | Family Households | Nonfamily Households |
| 1-Person Households | - | 288 (27.9%) |
| 2-Person Households | 202 (19.6%) | 74 (7.2%) |
| 3-Person Households | 249 (24.1%) | 0 (0.0%) |
| 4-Person Households | 220 (21.3%) | 0 (0.0%) |
| 5-Person Households | 0 (0.0%) | 0 (0.0%) |
| 6-Person Households | 0 (0.0%) | 0 (0.0%) |
| 7+ Person Households | 0 (0.0%) | 0 (0.0%) |
| Total | 671 (65.0%) | 362 (35.0%) |
Female Fertility in Montara
Fertility by Age in Montara
| Age Bracket | Women with Births | Births / 1,000 Women |
| 15 to 19 years | 0 (0.0%) | 0.0 |
| 20 to 34 years | 0 (0.0%) | 0.0 |
| 35 to 50 years | 0 (0.0%) | 0.0 |
| Total | 0 (0.0%) | 0.0 |
Fertility by Age by Marriage Status in Montara
| Age Bracket | Married | Unmarried |
| 15 to 19 years | 0 (0.0%) | 0 (0.0%) |
| 20 to 34 years | 0 (0.0%) | 0 (0.0%) |
| 35 to 50 years | 0 (0.0%) | 0 (0.0%) |
| Total | 0 (0.0%) | 0 (0.0%) |
Fertility by Education in Montara
| Educational Attainment | Women with Births | Births / 1,000 Women |
| Less than High School | 0 (0.0%) | 0.0 |
| High School Diploma | 0 (0.0%) | 0.0 |
| College or Associate's Degree | 0 (0.0%) | 0.0 |
| Bachelor's Degree | 0 (0.0%) | 0.0 |
| Graduate Degree | 0 (0.0%) | 0.0 |
| Total | 0 (0.0%) | 0.0 |
Fertility by Education by Marriage Status in Montara
| Educational Attainment | Married | Unmarried |
| Less than High School | 0 (0.0%) | 0 (0.0%) |
| High School Diploma | 0 (0.0%) | 0 (0.0%) |
| College or Associate's Degree | 0 (0.0%) | 0 (0.0%) |
| Bachelor's Degree | 0 (0.0%) | 0 (0.0%) |
| Graduate Degree | 0 (0.0%) | 0 (0.0%) |
| Total | 0 (0.0%) | 0 (0.0%) |
Employment Characteristics in Montara
Employment by Class of Employer in Montara
Among the 1,392 employed individuals in Montara, private company employees (711 | 51.1%), self-employed (incorporated) (209 | 15.0%), and local government employees (148 | 10.6%) make up the most common classes of employment.
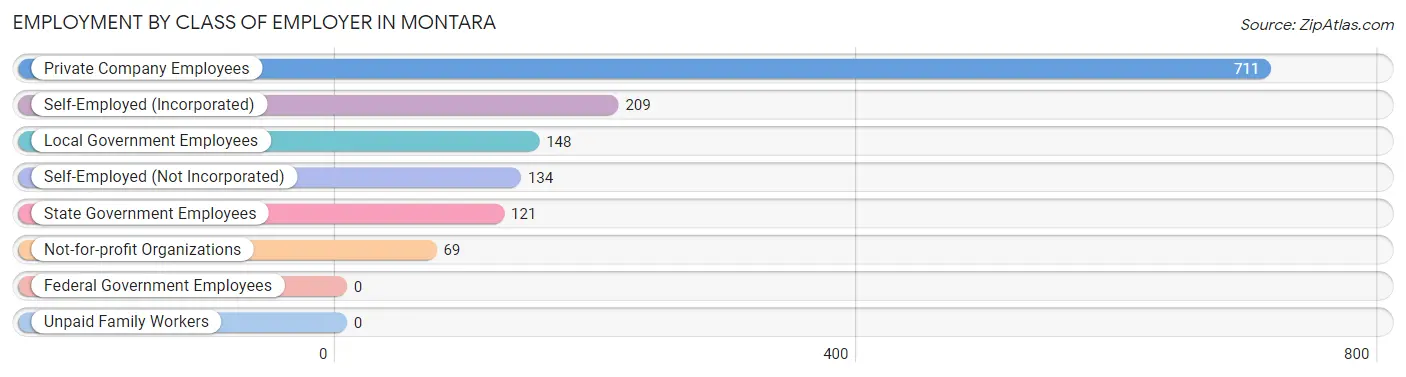
| Employer Class | # Employees | % Employees |
| Private Company Employees | 711 | 51.1% |
| Self-Employed (Incorporated) | 209 | 15.0% |
| Self-Employed (Not Incorporated) | 134 | 9.6% |
| Not-for-profit Organizations | 69 | 5.0% |
| Local Government Employees | 148 | 10.6% |
| State Government Employees | 121 | 8.7% |
| Federal Government Employees | 0 | 0.0% |
| Unpaid Family Workers | 0 | 0.0% |
| Total | 1,392 | 100.0% |
Employment Status by Age in Montara
According to the labor force statistics for Montara, out of the total population over 16 years of age (2,501), 66.0% or 1,651 individuals are in the labor force, with 10.4% or 172 of them unemployed. The age group with the highest labor force participation rate is 45 to 54 years, with 100.0% or 33 individuals in the labor force. Within the labor force, the 20 to 24 years age range has the highest percentage of unemployed individuals, with 55.8% or 172 of them being unemployed.
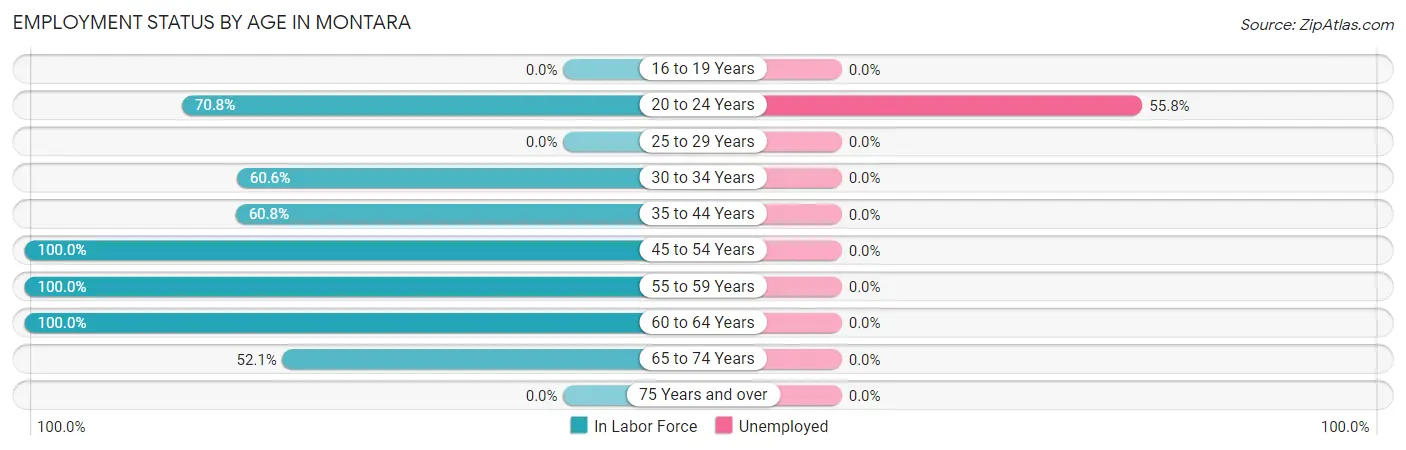
| Age Bracket | In Labor Force | Unemployed |
| 16 to 19 Years | 0 (0.0%) | 0 (0.0%) |
| 20 to 24 Years | 308 (70.8%) | 172 (55.8%) |
| 25 to 29 Years | 0 (0.0%) | 0 (0.0%) |
| 30 to 34 Years | 66 (60.6%) | 0 (0.0%) |
| 35 to 44 Years | 186 (60.8%) | 0 (0.0%) |
| 45 to 54 Years | 33 (100.0%) | 0 (0.0%) |
| 55 to 59 Years | 434 (100.0%) | 0 (0.0%) |
| 60 to 64 Years | 203 (100.0%) | 0 (0.0%) |
| 65 to 74 Years | 420 (52.1%) | 0 (0.0%) |
| 75 Years and over | 0 (0.0%) | 0 (0.0%) |
| Total | 1,651 (66.0%) | 172 (10.4%) |
Employment Status by Educational Attainment in Montara
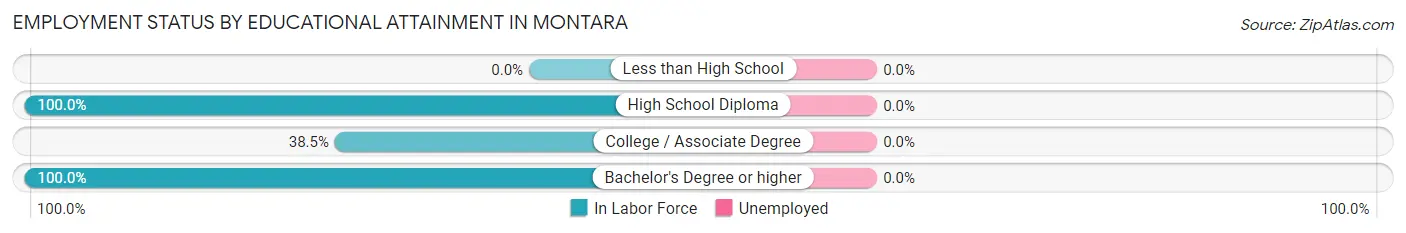
| Educational Attainment | In Labor Force | Unemployed |
| Less than High School | 0 (0.0%) | 0 (0.0%) |
| High School Diploma | 102 (100.0%) | 0 (0.0%) |
| College / Associate Degree | 102 (38.5%) | 0 (0.0%) |
| Bachelor's Degree or higher | 718 (100.0%) | 0 (0.0%) |
| Total | 922 (85.0%) | 0 (0.0%) |
Employment Occupations by Sex in Montara
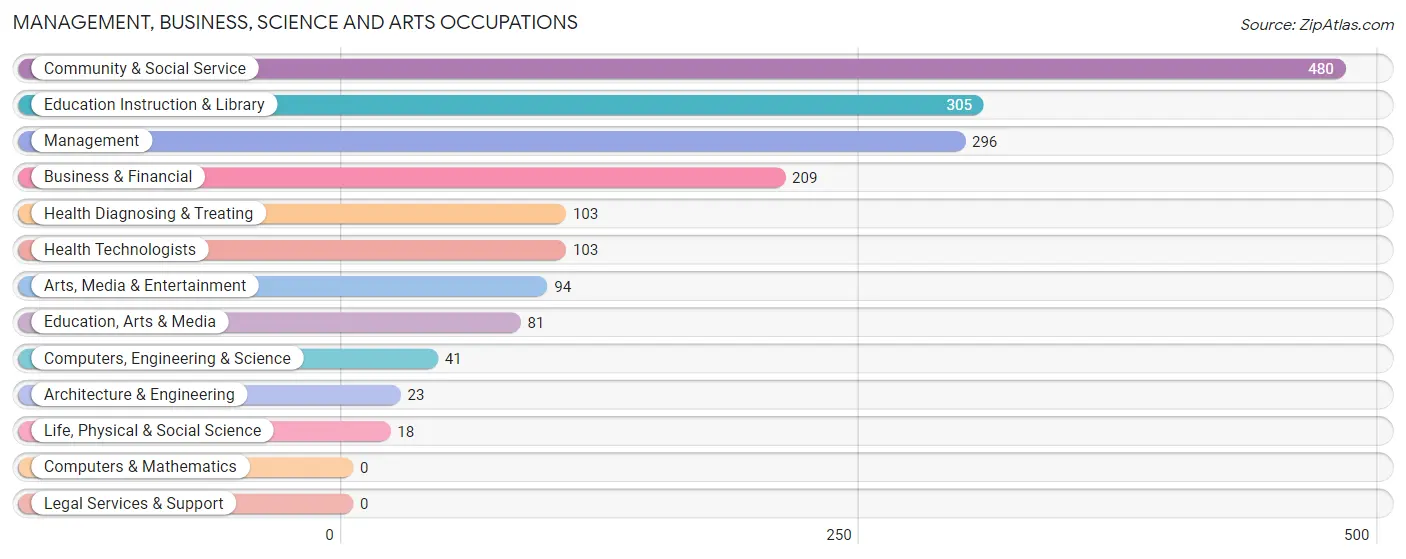
Management, Business, Science and Arts Occupations
The most common Management, Business, Science and Arts occupations in Montara are Community & Social Service (480 | 32.5%), Education Instruction & Library (305 | 20.6%), Management (296 | 20.0%), Business & Financial (209 | 14.1%), and Health Diagnosing & Treating (103 | 7.0%).
Management, Business, Science and Arts Occupations by Sex
Within the Management, Business, Science and Arts occupations in Montara, the most male-oriented occupations are Life, Physical & Social Science (100.0%), Arts, Media & Entertainment (100.0%), and Health Diagnosing & Treating (50.5%), while the most female-oriented occupations are Architecture & Engineering (100.0%), Education, Arts & Media (100.0%), and Management (77.0%).
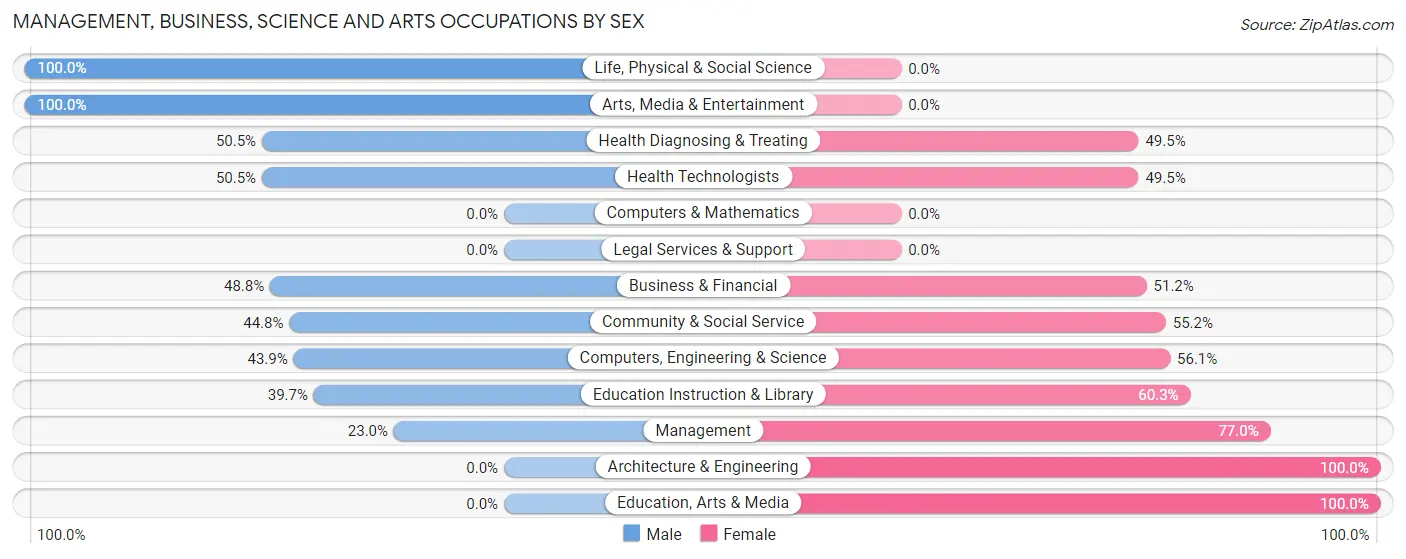
| Occupation | Male | Female |
| Management | 68 (23.0%) | 228 (77.0%) |
| Business & Financial | 102 (48.8%) | 107 (51.2%) |
| Computers, Engineering & Science | 18 (43.9%) | 23 (56.1%) |
| Computers & Mathematics | 0 (0.0%) | 0 (0.0%) |
| Architecture & Engineering | 0 (0.0%) | 23 (100.0%) |
| Life, Physical & Social Science | 18 (100.0%) | 0 (0.0%) |
| Community & Social Service | 215 (44.8%) | 265 (55.2%) |
| Education, Arts & Media | 0 (0.0%) | 81 (100.0%) |
| Legal Services & Support | 0 (0.0%) | 0 (0.0%) |
| Education Instruction & Library | 121 (39.7%) | 184 (60.3%) |
| Arts, Media & Entertainment | 94 (100.0%) | 0 (0.0%) |
| Health Diagnosing & Treating | 52 (50.5%) | 51 (49.5%) |
| Health Technologists | 52 (50.5%) | 51 (49.5%) |
| Total (Category) | 455 (40.3%) | 674 (59.7%) |
| Total (Overall) | 673 (45.5%) | 805 (54.5%) |
Services Occupations
Services Occupations by Sex
| Occupation | Male | Female |
| Healthcare Support | 0 (0.0%) | 0 (0.0%) |
| Security & Protection | 0 (0.0%) | 0 (0.0%) |
| Firefighting & Prevention | 0 (0.0%) | 0 (0.0%) |
| Law Enforcement | 0 (0.0%) | 0 (0.0%) |
| Food Preparation & Serving | 0 (0.0%) | 0 (0.0%) |
| Cleaning & Maintenance | 0 (0.0%) | 0 (0.0%) |
| Personal Care & Service | 0 (0.0%) | 0 (0.0%) |
| Total (Category) | 0 (0.0%) | 0 (0.0%) |
| Total (Overall) | 673 (45.5%) | 805 (54.5%) |
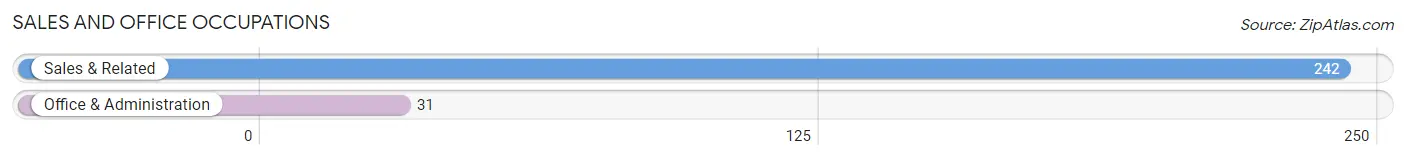
Sales and Office Occupations
The most common Sales and Office occupations in Montara are Sales & Related (242 | 16.4%), and Office & Administration (31 | 2.1%).
Sales and Office Occupations by Sex
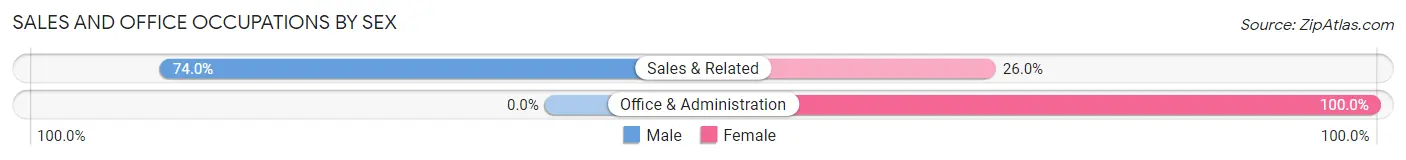
| Occupation | Male | Female |
| Sales & Related | 179 (74.0%) | 63 (26.0%) |
| Office & Administration | 0 (0.0%) | 31 (100.0%) |
| Total (Category) | 179 (65.6%) | 94 (34.4%) |
| Total (Overall) | 673 (45.5%) | 805 (54.5%) |
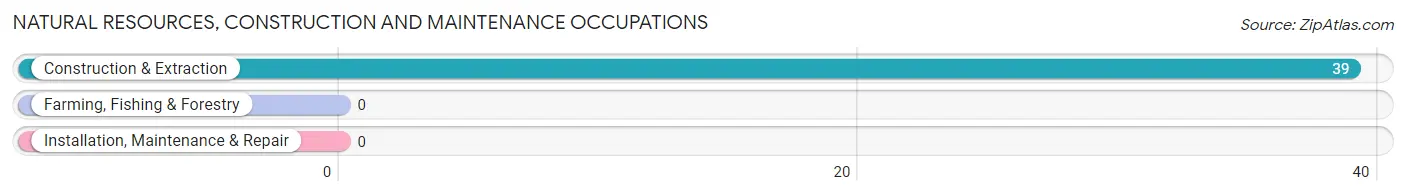
Natural Resources, Construction and Maintenance Occupations
The most common Natural Resources, Construction and Maintenance occupations in Montara are , and Construction & Extraction (39 | 2.6%).
Natural Resources, Construction and Maintenance Occupations by Sex
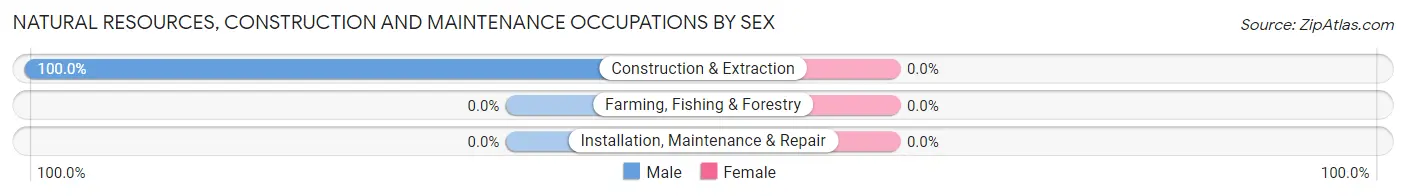
| Occupation | Male | Female |
| Farming, Fishing & Forestry | 0 (0.0%) | 0 (0.0%) |
| Construction & Extraction | 39 (100.0%) | 0 (0.0%) |
| Installation, Maintenance & Repair | 0 (0.0%) | 0 (0.0%) |
| Total (Category) | 39 (100.0%) | 0 (0.0%) |
| Total (Overall) | 673 (45.5%) | 805 (54.5%) |
Production, Transportation and Moving Occupations
The most common Production, Transportation and Moving occupations in Montara are , and Transportation (37 | 2.5%).
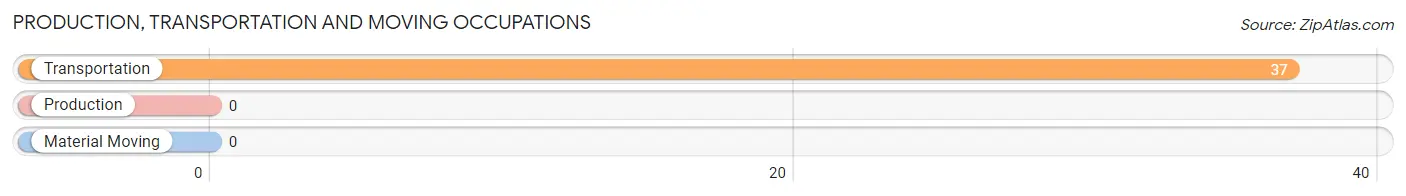
Production, Transportation and Moving Occupations by Sex
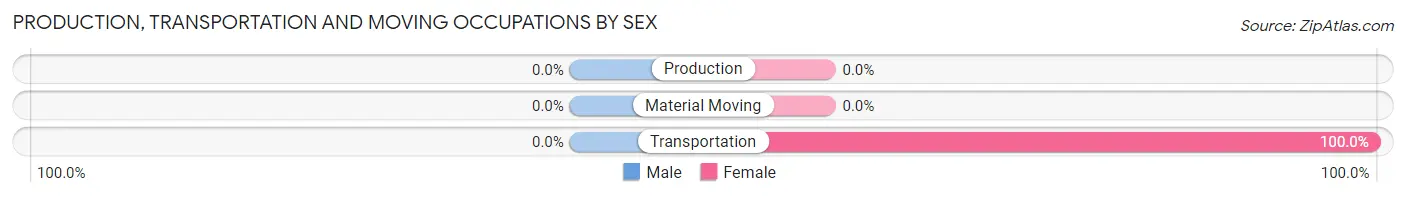
| Occupation | Male | Female |
| Production | 0 (0.0%) | 0 (0.0%) |
| Transportation | 0 (0.0%) | 37 (100.0%) |
| Material Moving | 0 (0.0%) | 0 (0.0%) |
| Total (Category) | 0 (0.0%) | 37 (100.0%) |
| Total (Overall) | 673 (45.5%) | 805 (54.5%) |
Employment Industries by Sex in Montara
Employment Industries in Montara
The major employment industries in Montara include Professional & Scientific (389 | 26.3%), Educational Services (344 | 23.3%), Retail Trade (258 | 17.5%), Health Care & Social Assistance (202 | 13.7%), and Manufacturing (122 | 8.3%).
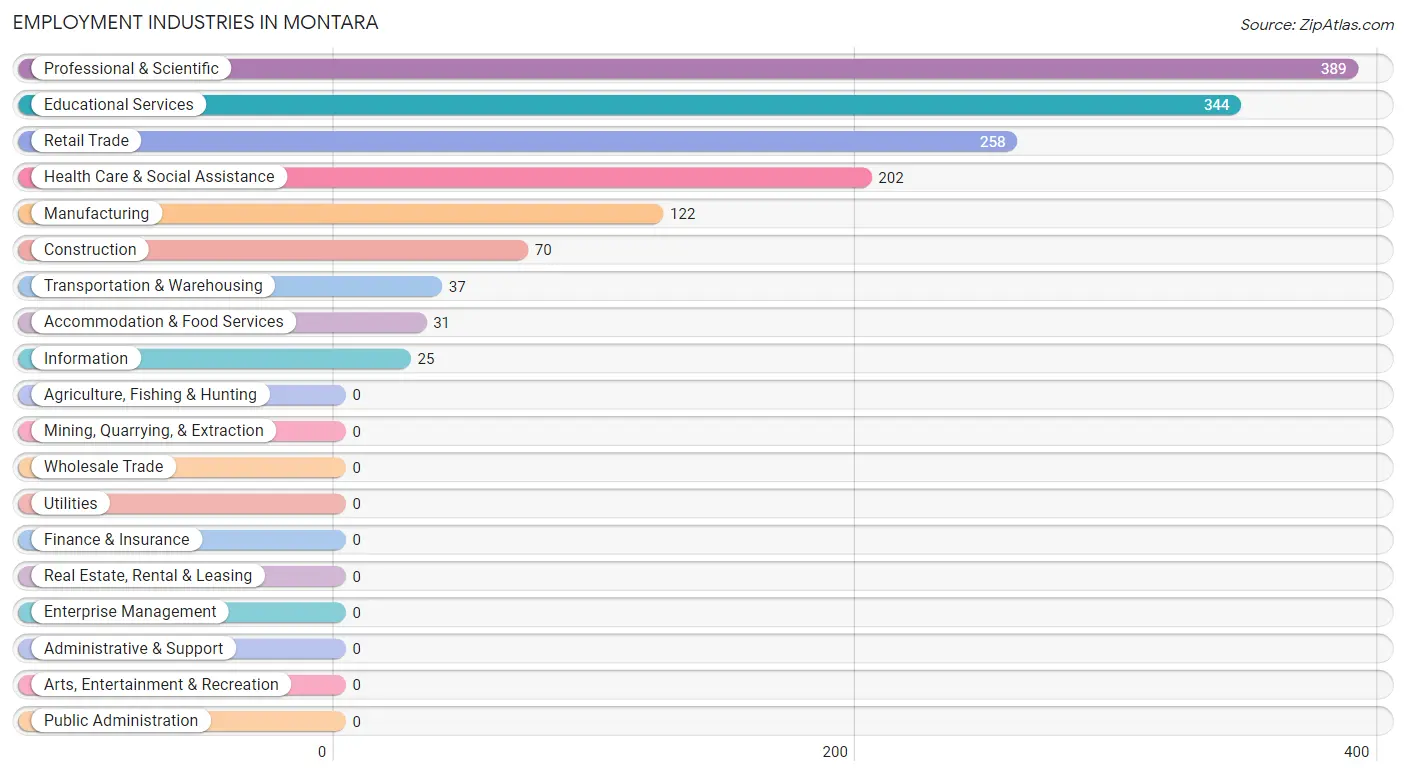
Employment Industries by Sex in Montara
The Montara industries that see more men than women are Professional & Scientific (66.6%), Retail Trade (56.2%), and Construction (55.7%), whereas the industries that tend to have a higher number of women are Transportation & Warehousing (100.0%), Information (100.0%), and Accommodation & Food Services (100.0%).
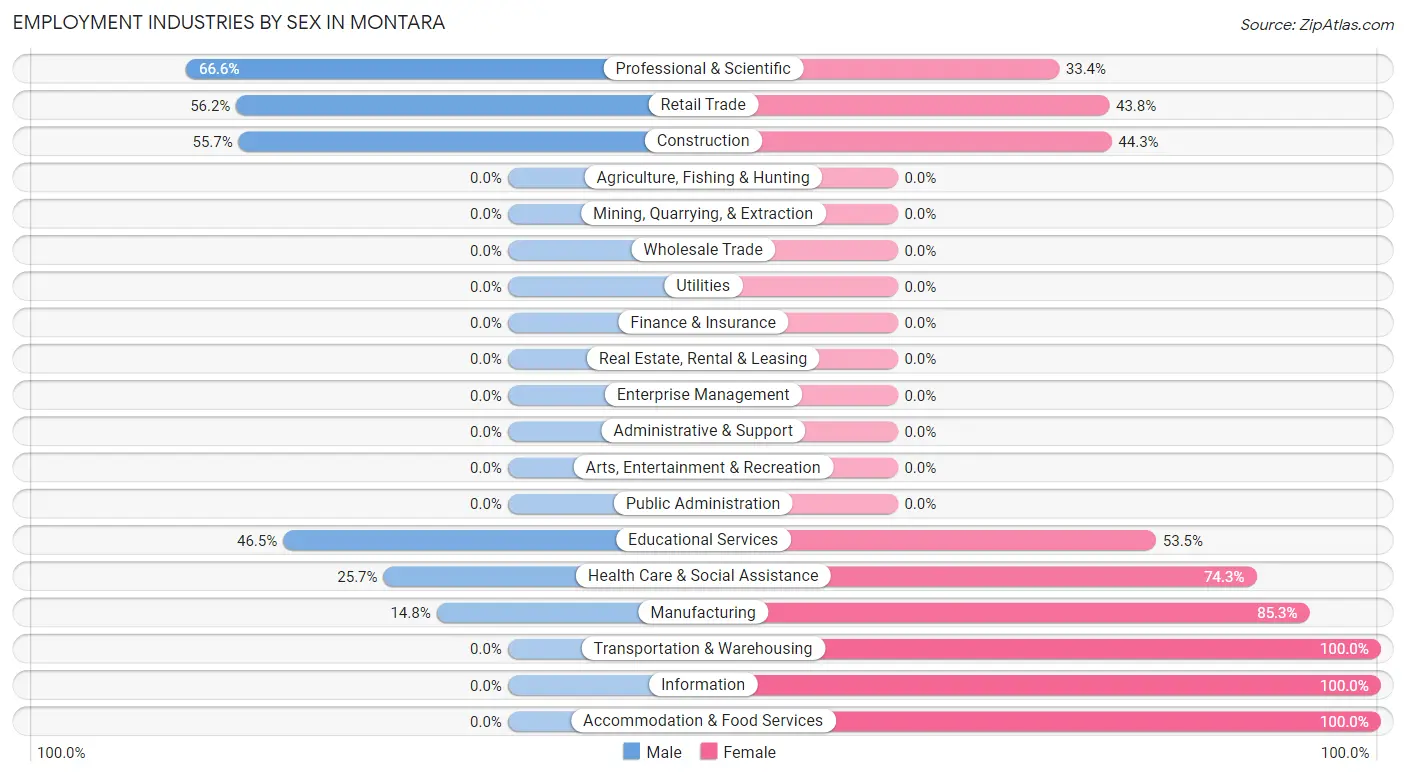
| Industry | Male | Female |
| Agriculture, Fishing & Hunting | 0 (0.0%) | 0 (0.0%) |
| Mining, Quarrying, & Extraction | 0 (0.0%) | 0 (0.0%) |
| Construction | 39 (55.7%) | 31 (44.3%) |
| Manufacturing | 18 (14.7%) | 104 (85.3%) |
| Wholesale Trade | 0 (0.0%) | 0 (0.0%) |
| Retail Trade | 145 (56.2%) | 113 (43.8%) |
| Transportation & Warehousing | 0 (0.0%) | 37 (100.0%) |
| Utilities | 0 (0.0%) | 0 (0.0%) |
| Information | 0 (0.0%) | 25 (100.0%) |
| Finance & Insurance | 0 (0.0%) | 0 (0.0%) |
| Real Estate, Rental & Leasing | 0 (0.0%) | 0 (0.0%) |
| Professional & Scientific | 259 (66.6%) | 130 (33.4%) |
| Enterprise Management | 0 (0.0%) | 0 (0.0%) |
| Administrative & Support | 0 (0.0%) | 0 (0.0%) |
| Educational Services | 160 (46.5%) | 184 (53.5%) |
| Health Care & Social Assistance | 52 (25.7%) | 150 (74.3%) |
| Arts, Entertainment & Recreation | 0 (0.0%) | 0 (0.0%) |
| Accommodation & Food Services | 0 (0.0%) | 31 (100.0%) |
| Public Administration | 0 (0.0%) | 0 (0.0%) |
| Total | 673 (45.5%) | 805 (54.5%) |
Education in Montara
School Enrollment in Montara
The most common levels of schooling among the 550 students in Montara are college / undergraduate (326 | 59.3%), graduate / professional (155 | 28.2%), and kindergarten (32 | 5.8%).
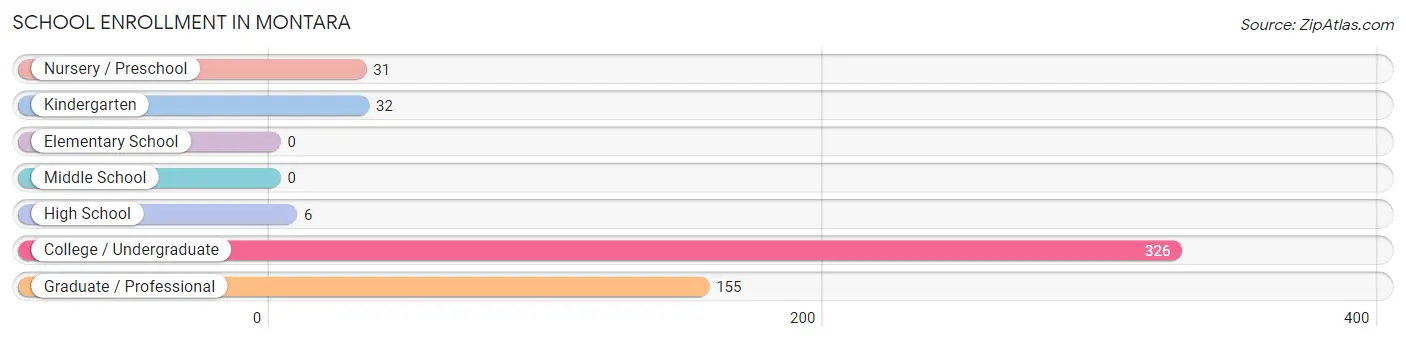
| School Level | # Students | % Students |
| Nursery / Preschool | 31 | 5.6% |
| Kindergarten | 32 | 5.8% |
| Elementary School | 0 | 0.0% |
| Middle School | 0 | 0.0% |
| High School | 6 | 1.1% |
| College / Undergraduate | 326 | 59.3% |
| Graduate / Professional | 155 | 28.2% |
| Total | 550 | 100.0% |
School Enrollment by Age by Funding Source in Montara
Out of a total of 550 students who are enrolled in schools in Montara, 14 (2.5%) attend a private institution, while the remaining 536 (97.5%) are enrolled in public schools. The age group of 35 years and over has the highest likelihood of being enrolled in private schools, with 14 (15.4% in the age bracket) enrolled. Conversely, the age group of 3 to 4 year olds has the lowest likelihood of being enrolled in a private school, with 31 (100.0% in the age bracket) attending a public institution.
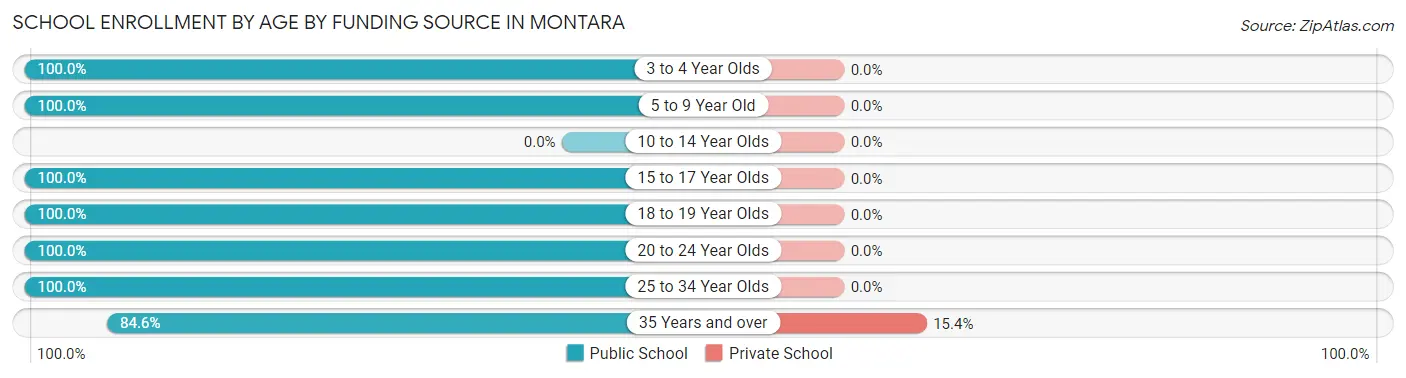
| Age Bracket | Public School | Private School |
| 3 to 4 Year Olds | 31 (100.0%) | 0 (0.0%) |
| 5 to 9 Year Old | 32 (100.0%) | 0 (0.0%) |
| 10 to 14 Year Olds | 0 (0.0%) | 0 (0.0%) |
| 15 to 17 Year Olds | 6 (100.0%) | 0 (0.0%) |
| 18 to 19 Year Olds | 61 (100.0%) | 0 (0.0%) |
| 20 to 24 Year Olds | 263 (100.0%) | 0 (0.0%) |
| 25 to 34 Year Olds | 66 (100.0%) | 0 (0.0%) |
| 35 Years and over | 77 (84.6%) | 14 (15.4%) |
| Total | 536 (97.5%) | 14 (2.5%) |
Educational Attainment by Field of Study in Montara
Liberal arts & history (210 | 14.1%), physical & health sciences (177 | 11.9%), engineering (162 | 10.9%), computers & mathematics (146 | 9.8%), and social sciences (121 | 8.1%) are the most common fields of study among 1,488 individuals in Montara who have obtained a bachelor's degree or higher.
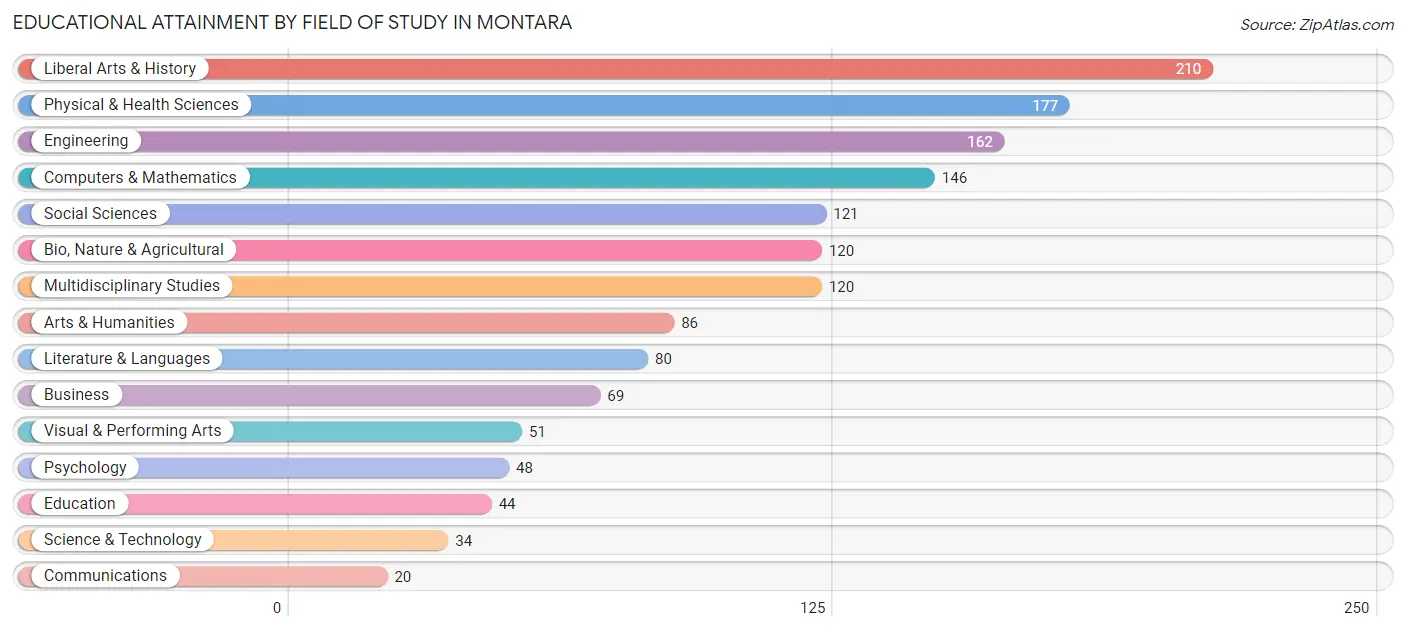
| Field of Study | # Graduates | % Graduates |
| Computers & Mathematics | 146 | 9.8% |
| Bio, Nature & Agricultural | 120 | 8.1% |
| Physical & Health Sciences | 177 | 11.9% |
| Psychology | 48 | 3.2% |
| Social Sciences | 121 | 8.1% |
| Engineering | 162 | 10.9% |
| Multidisciplinary Studies | 120 | 8.1% |
| Science & Technology | 34 | 2.3% |
| Business | 69 | 4.6% |
| Education | 44 | 3.0% |
| Literature & Languages | 80 | 5.4% |
| Liberal Arts & History | 210 | 14.1% |
| Visual & Performing Arts | 51 | 3.4% |
| Communications | 20 | 1.3% |
| Arts & Humanities | 86 | 5.8% |
| Total | 1,488 | 100.0% |
Transportation & Commute in Montara
Vehicle Availability by Sex in Montara
The most prevalent vehicle ownership categories in Montara are males with 2 vehicles (330, accounting for 49.0%) and females with 2 vehicles (414, making up 45.9%).
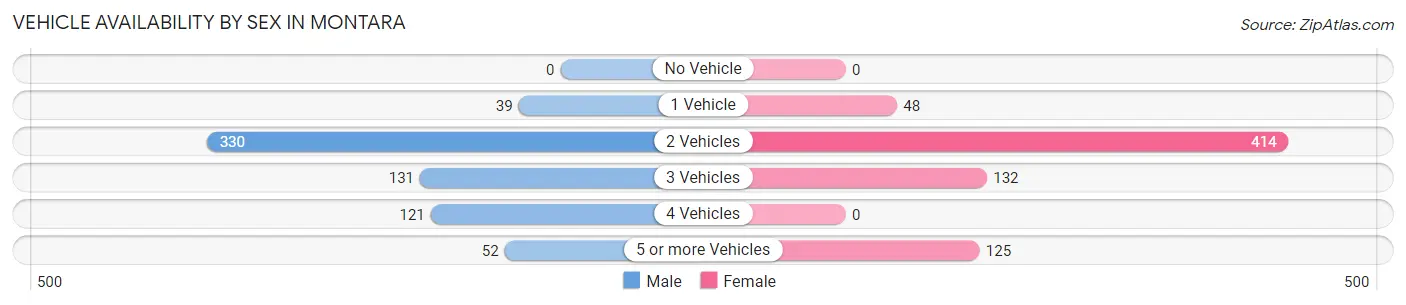
| Vehicles Available | Male | Female |
| No Vehicle | 0 (0.0%) | 0 (0.0%) |
| 1 Vehicle | 39 (5.8%) | 48 (6.7%) |
| 2 Vehicles | 330 (49.0%) | 414 (57.6%) |
| 3 Vehicles | 131 (19.5%) | 132 (18.4%) |
| 4 Vehicles | 121 (18.0%) | 0 (0.0%) |
| 5 or more Vehicles | 52 (7.7%) | 125 (17.4%) |
| Total | 673 (100.0%) | 719 (100.0%) |
Commute Time in Montara
The most frequently occuring commute durations in Montara are 45 to 59 minutes (237 commuters, 25.8%), 30 to 34 minutes (222 commuters, 24.2%), and 15 to 19 minutes (199 commuters, 21.7%).
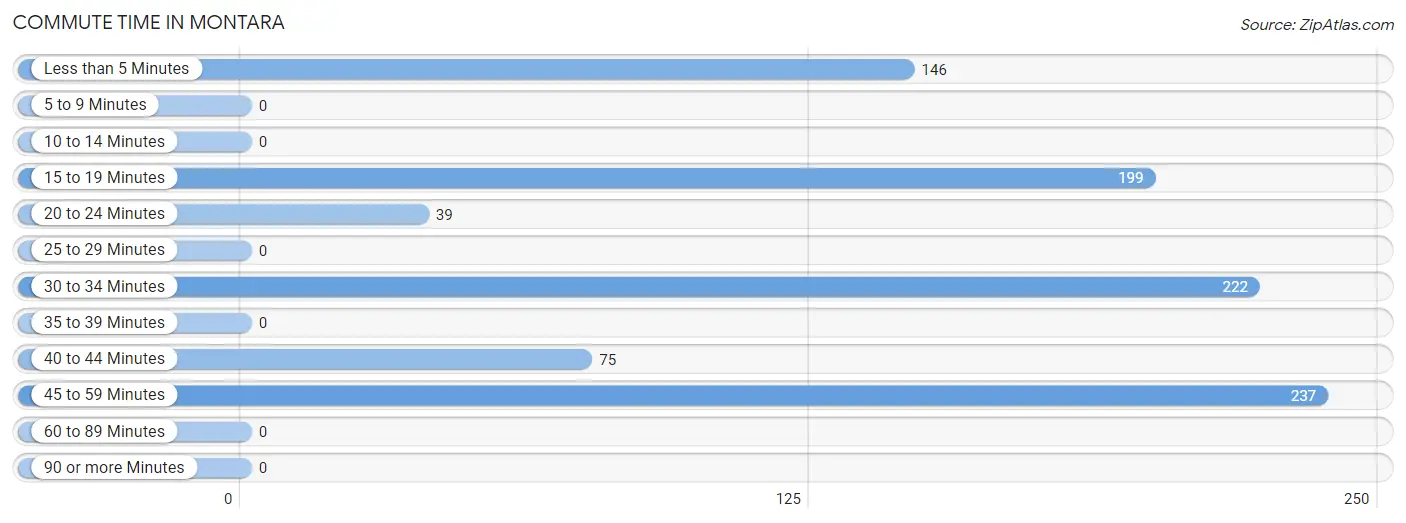
| Commute Time | # Commuters | % Commuters |
| Less than 5 Minutes | 146 | 15.9% |
| 5 to 9 Minutes | 0 | 0.0% |
| 10 to 14 Minutes | 0 | 0.0% |
| 15 to 19 Minutes | 199 | 21.7% |
| 20 to 24 Minutes | 39 | 4.3% |
| 25 to 29 Minutes | 0 | 0.0% |
| 30 to 34 Minutes | 222 | 24.2% |
| 35 to 39 Minutes | 0 | 0.0% |
| 40 to 44 Minutes | 75 | 8.2% |
| 45 to 59 Minutes | 237 | 25.8% |
| 60 to 89 Minutes | 0 | 0.0% |
| 90 or more Minutes | 0 | 0.0% |
Commute Time by Sex in Montara
The most common commute times in Montara are 45 to 59 minutes (168 commuters, 33.9%) for males and 30 to 34 minutes (154 commuters, 36.4%) for females.
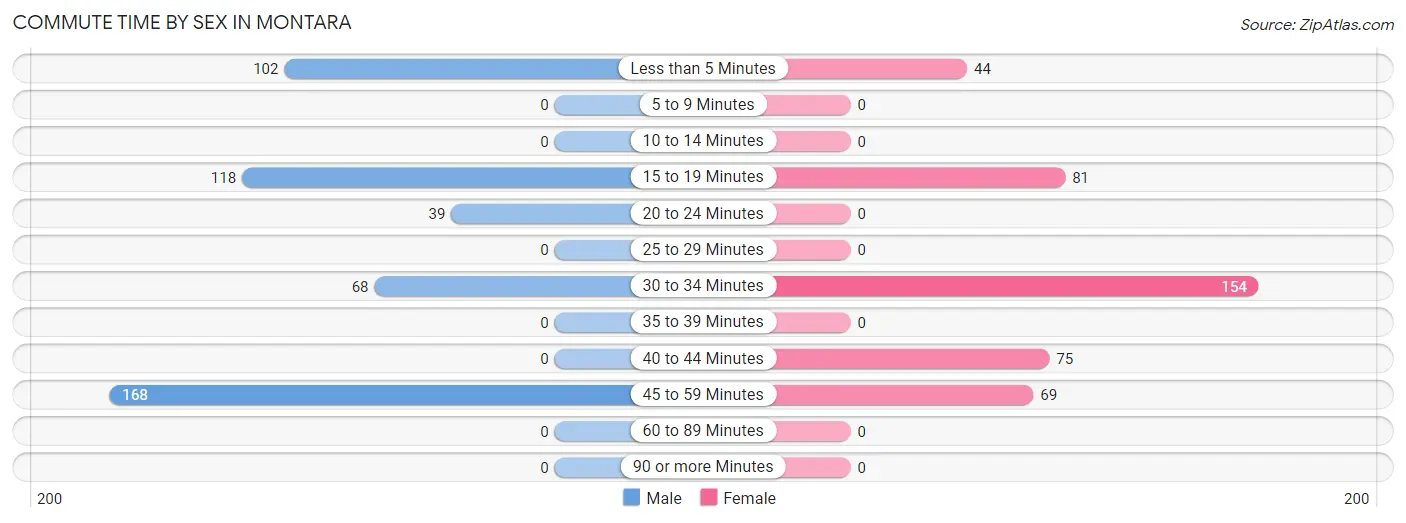
| Commute Time | Male | Female |
| Less than 5 Minutes | 102 (20.6%) | 44 (10.4%) |
| 5 to 9 Minutes | 0 (0.0%) | 0 (0.0%) |
| 10 to 14 Minutes | 0 (0.0%) | 0 (0.0%) |
| 15 to 19 Minutes | 118 (23.8%) | 81 (19.2%) |
| 20 to 24 Minutes | 39 (7.9%) | 0 (0.0%) |
| 25 to 29 Minutes | 0 (0.0%) | 0 (0.0%) |
| 30 to 34 Minutes | 68 (13.7%) | 154 (36.4%) |
| 35 to 39 Minutes | 0 (0.0%) | 0 (0.0%) |
| 40 to 44 Minutes | 0 (0.0%) | 75 (17.7%) |
| 45 to 59 Minutes | 168 (33.9%) | 69 (16.3%) |
| 60 to 89 Minutes | 0 (0.0%) | 0 (0.0%) |
| 90 or more Minutes | 0 (0.0%) | 0 (0.0%) |
Time of Departure to Work by Sex in Montara
The most frequent times of departure to work in Montara are 6:30 AM to 6:59 AM (113, 22.8%) for males and 10:00 AM to 10:59 AM (167, 39.5%) for females.
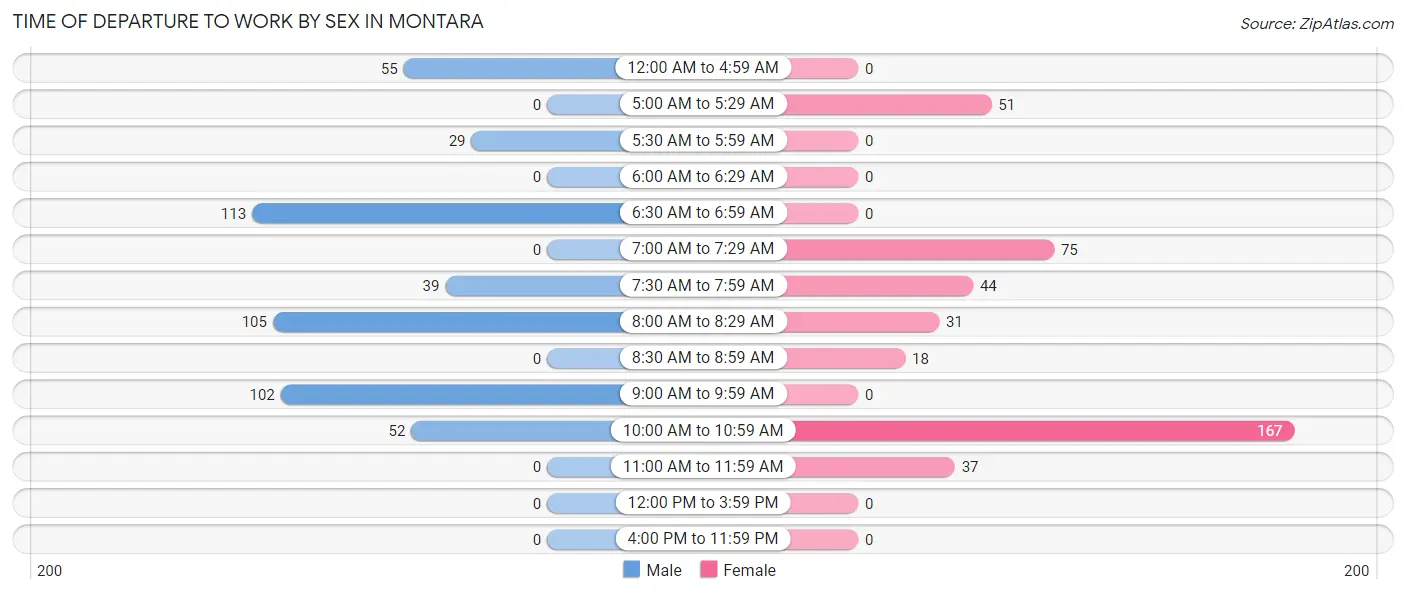
| Time of Departure | Male | Female |
| 12:00 AM to 4:59 AM | 55 (11.1%) | 0 (0.0%) |
| 5:00 AM to 5:29 AM | 0 (0.0%) | 51 (12.1%) |
| 5:30 AM to 5:59 AM | 29 (5.9%) | 0 (0.0%) |
| 6:00 AM to 6:29 AM | 0 (0.0%) | 0 (0.0%) |
| 6:30 AM to 6:59 AM | 113 (22.8%) | 0 (0.0%) |
| 7:00 AM to 7:29 AM | 0 (0.0%) | 75 (17.7%) |
| 7:30 AM to 7:59 AM | 39 (7.9%) | 44 (10.4%) |
| 8:00 AM to 8:29 AM | 105 (21.2%) | 31 (7.3%) |
| 8:30 AM to 8:59 AM | 0 (0.0%) | 18 (4.3%) |
| 9:00 AM to 9:59 AM | 102 (20.6%) | 0 (0.0%) |
| 10:00 AM to 10:59 AM | 52 (10.5%) | 167 (39.5%) |
| 11:00 AM to 11:59 AM | 0 (0.0%) | 37 (8.7%) |
| 12:00 PM to 3:59 PM | 0 (0.0%) | 0 (0.0%) |
| 4:00 PM to 11:59 PM | 0 (0.0%) | 0 (0.0%) |
| Total | 495 (100.0%) | 423 (100.0%) |
Housing Occupancy in Montara
Occupancy by Ownership in Montara
Of the total 1,033 dwellings in Montara, owner-occupied units account for 929 (89.9%), while renter-occupied units make up 104 (10.1%).
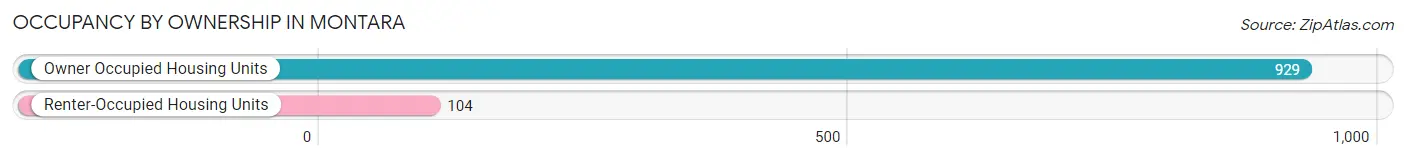
| Occupancy | # Housing Units | % Housing Units |
| Owner Occupied Housing Units | 929 | 89.9% |
| Renter-Occupied Housing Units | 104 | 10.1% |
| Total Occupied Housing Units | 1,033 | 100.0% |
Occupancy by Household Size in Montara
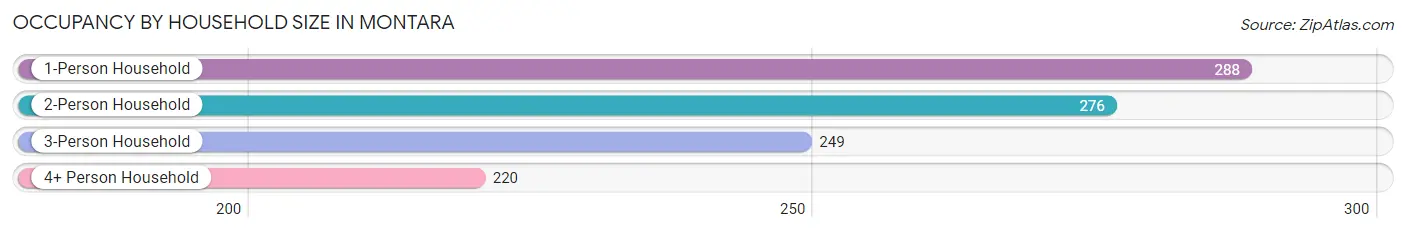
| Household Size | # Housing Units | % Housing Units |
| 1-Person Household | 288 | 27.9% |
| 2-Person Household | 276 | 26.7% |
| 3-Person Household | 249 | 24.1% |
| 4+ Person Household | 220 | 21.3% |
| Total Housing Units | 1,033 | 100.0% |
Occupancy by Ownership by Household Size in Montara
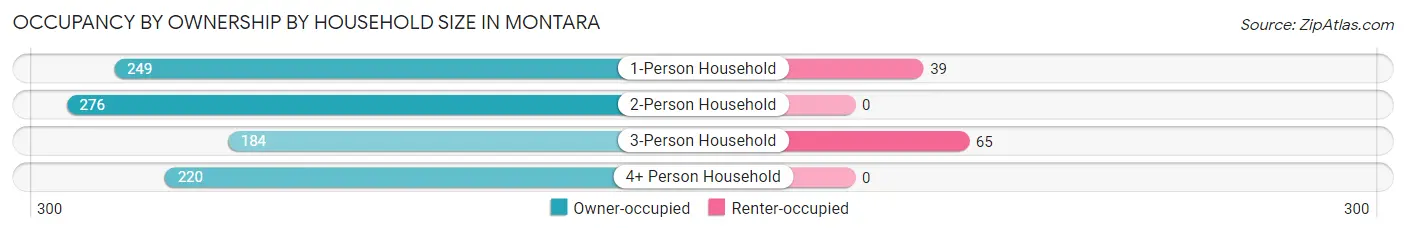
| Household Size | Owner-occupied | Renter-occupied |
| 1-Person Household | 249 (86.5%) | 39 (13.5%) |
| 2-Person Household | 276 (100.0%) | 0 (0.0%) |
| 3-Person Household | 184 (73.9%) | 65 (26.1%) |
| 4+ Person Household | 220 (100.0%) | 0 (0.0%) |
| Total Housing Units | 929 (89.9%) | 104 (10.1%) |
Occupancy by Educational Attainment in Montara
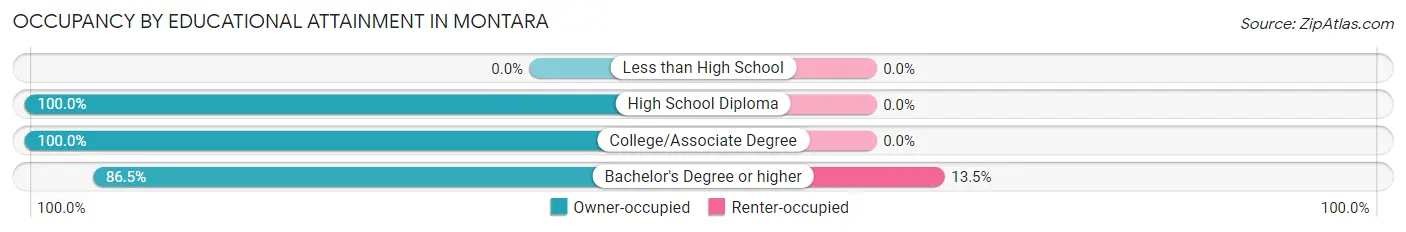
| Household Size | Owner-occupied | Renter-occupied |
| Less than High School | 0 (0.0%) | 0 (0.0%) |
| High School Diploma | 52 (100.0%) | 0 (0.0%) |
| College/Associate Degree | 212 (100.0%) | 0 (0.0%) |
| Bachelor's Degree or higher | 665 (86.5%) | 104 (13.5%) |
Occupancy by Age of Householder in Montara
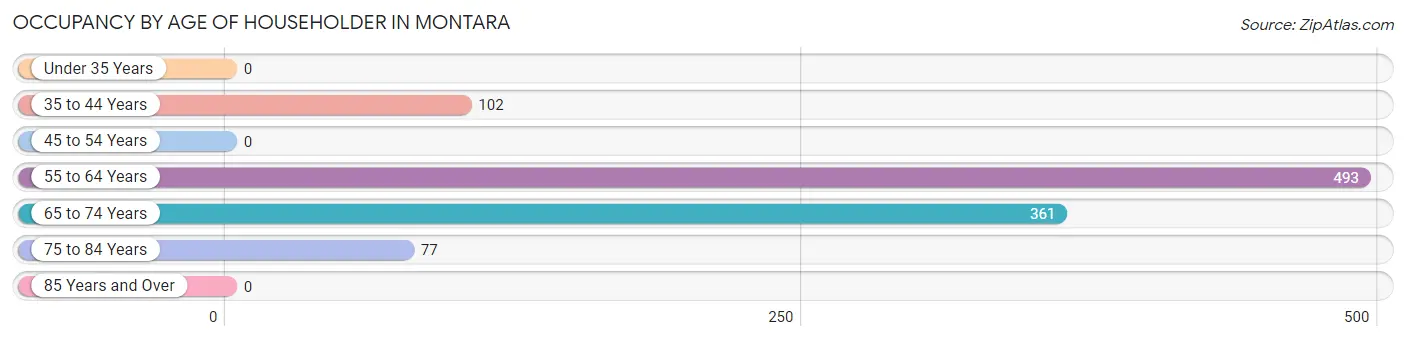
| Age Bracket | # Households | % Households |
| Under 35 Years | 0 | 0.0% |
| 35 to 44 Years | 102 | 9.9% |
| 45 to 54 Years | 0 | 0.0% |
| 55 to 64 Years | 493 | 47.7% |
| 65 to 74 Years | 361 | 34.9% |
| 75 to 84 Years | 77 | 7.4% |
| 85 Years and Over | 0 | 0.0% |
| Total | 1,033 | 100.0% |
Housing Finances in Montara
Median Income by Occupancy in Montara

| Occupancy Type | # Households | Median Income |
| Owner-Occupied | 929 (89.9%) | $183,003 |
| Renter-Occupied | 104 (10.1%) | $0 |
| Average | 1,033 (100.0%) | $184,692 |
Occupancy by Householder Income Bracket in Montara
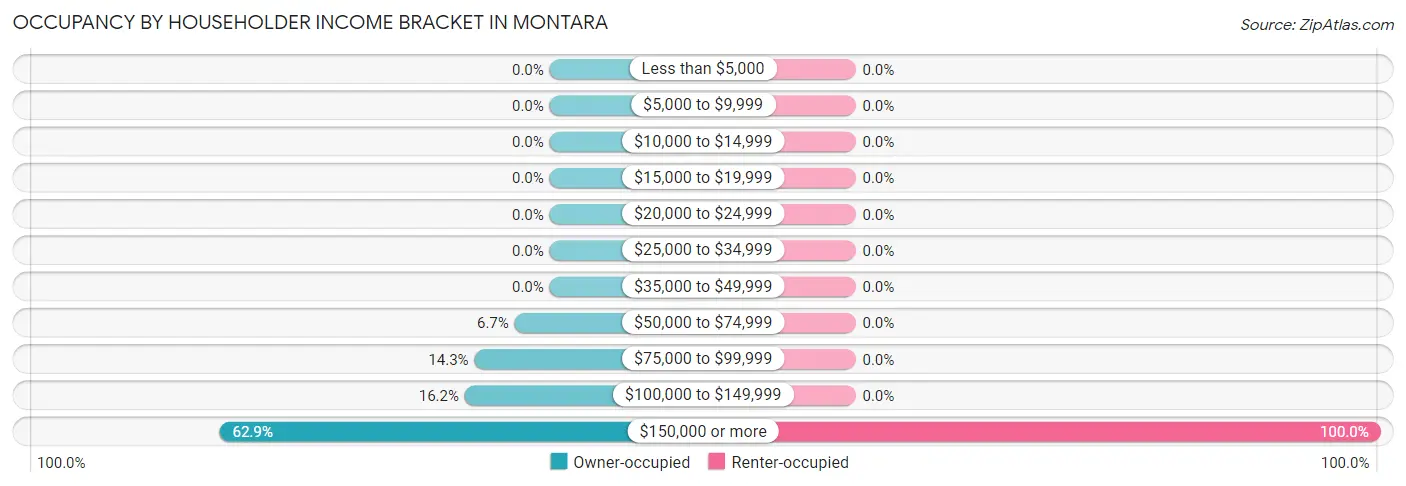
| Income Bracket | Owner-occupied | Renter-occupied |
| Less than $5,000 | 0 (0.0%) | 0 (0.0%) |
| $5,000 to $9,999 | 0 (0.0%) | 0 (0.0%) |
| $10,000 to $14,999 | 0 (0.0%) | 0 (0.0%) |
| $15,000 to $19,999 | 0 (0.0%) | 0 (0.0%) |
| $20,000 to $24,999 | 0 (0.0%) | 0 (0.0%) |
| $25,000 to $34,999 | 0 (0.0%) | 0 (0.0%) |
| $35,000 to $49,999 | 0 (0.0%) | 0 (0.0%) |
| $50,000 to $74,999 | 62 (6.7%) | 0 (0.0%) |
| $75,000 to $99,999 | 133 (14.3%) | 0 (0.0%) |
| $100,000 to $149,999 | 150 (16.2%) | 0 (0.0%) |
| $150,000 or more | 584 (62.9%) | 104 (100.0%) |
| Total | 929 (100.0%) | 104 (100.0%) |
Monthly Housing Cost Tiers in Montara
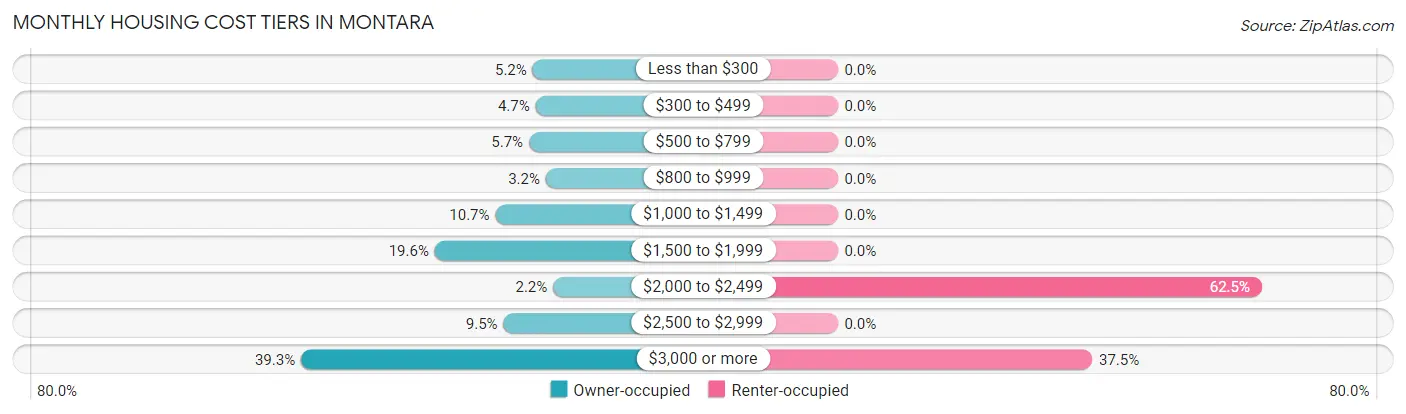
| Monthly Cost | Owner-occupied | Renter-occupied |
| Less than $300 | 48 (5.2%) | 0 (0.0%) |
| $300 to $499 | 44 (4.7%) | 0 (0.0%) |
| $500 to $799 | 53 (5.7%) | 0 (0.0%) |
| $800 to $999 | 30 (3.2%) | 0 (0.0%) |
| $1,000 to $1,499 | 99 (10.7%) | 0 (0.0%) |
| $1,500 to $1,999 | 182 (19.6%) | 0 (0.0%) |
| $2,000 to $2,499 | 20 (2.1%) | 65 (62.5%) |
| $2,500 to $2,999 | 88 (9.5%) | 0 (0.0%) |
| $3,000 or more | 365 (39.3%) | 39 (37.5%) |
| Total | 929 (100.0%) | 104 (100.0%) |
Physical Housing Characteristics in Montara
Housing Structures in Montara
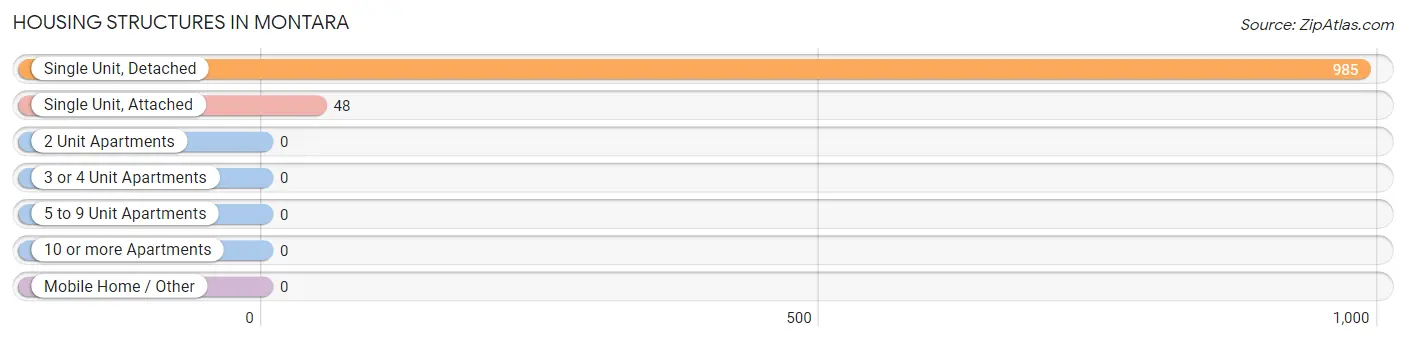
| Structure Type | # Housing Units | % Housing Units |
| Single Unit, Detached | 985 | 95.4% |
| Single Unit, Attached | 48 | 4.6% |
| 2 Unit Apartments | 0 | 0.0% |
| 3 or 4 Unit Apartments | 0 | 0.0% |
| 5 to 9 Unit Apartments | 0 | 0.0% |
| 10 or more Apartments | 0 | 0.0% |
| Mobile Home / Other | 0 | 0.0% |
| Total | 1,033 | 100.0% |
Housing Structures by Occupancy in Montara
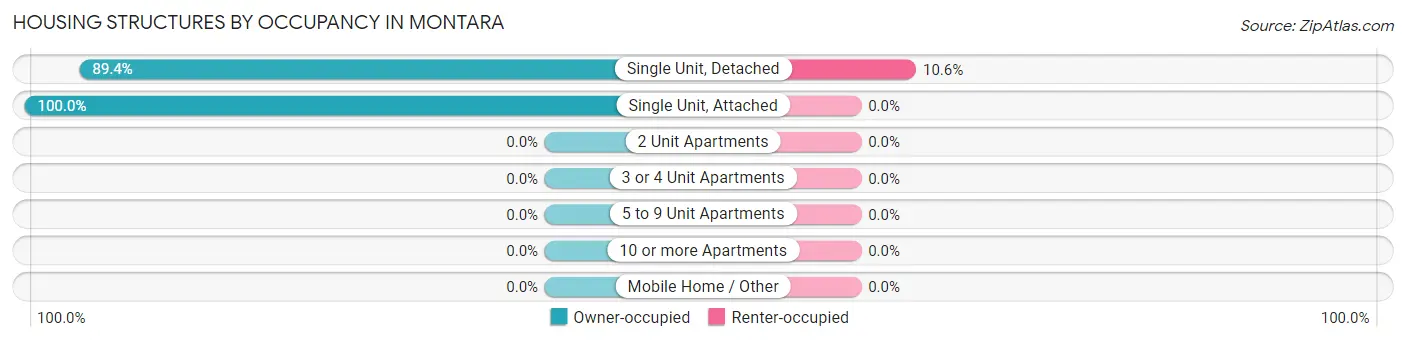
| Structure Type | Owner-occupied | Renter-occupied |
| Single Unit, Detached | 881 (89.4%) | 104 (10.6%) |
| Single Unit, Attached | 48 (100.0%) | 0 (0.0%) |
| 2 Unit Apartments | 0 (0.0%) | 0 (0.0%) |
| 3 or 4 Unit Apartments | 0 (0.0%) | 0 (0.0%) |
| 5 to 9 Unit Apartments | 0 (0.0%) | 0 (0.0%) |
| 10 or more Apartments | 0 (0.0%) | 0 (0.0%) |
| Mobile Home / Other | 0 (0.0%) | 0 (0.0%) |
| Total | 929 (89.9%) | 104 (10.1%) |
Housing Structures by Number of Rooms in Montara
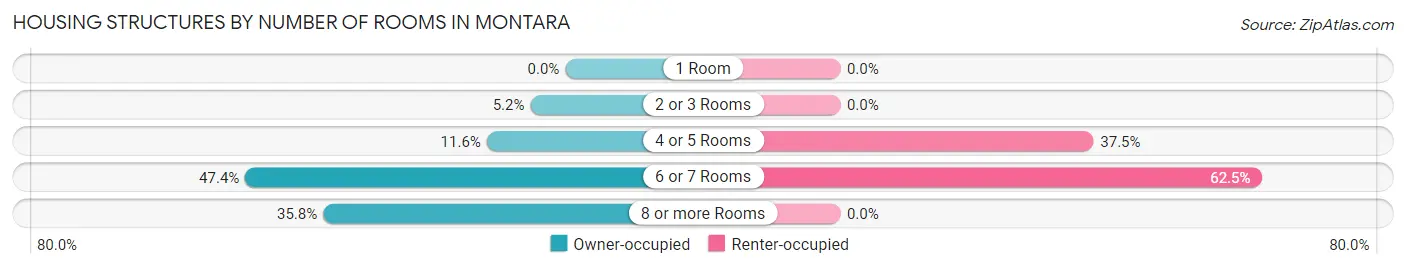
| Number of Rooms | Owner-occupied | Renter-occupied |
| 1 Room | 0 (0.0%) | 0 (0.0%) |
| 2 or 3 Rooms | 48 (5.2%) | 0 (0.0%) |
| 4 or 5 Rooms | 108 (11.6%) | 39 (37.5%) |
| 6 or 7 Rooms | 440 (47.4%) | 65 (62.5%) |
| 8 or more Rooms | 333 (35.8%) | 0 (0.0%) |
| Total | 929 (100.0%) | 104 (100.0%) |
Housing Structure by Heating Type in Montara
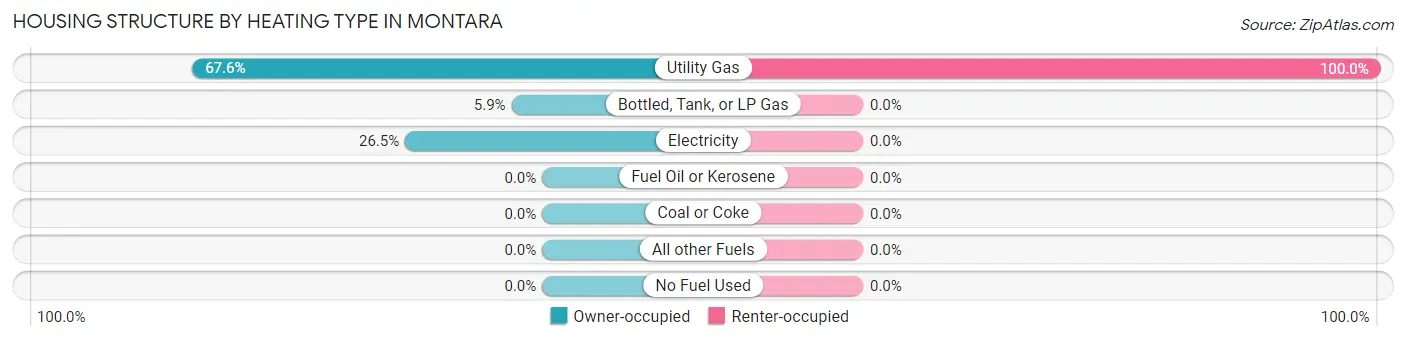
| Heating Type | Owner-occupied | Renter-occupied |
| Utility Gas | 628 (67.6%) | 104 (100.0%) |
| Bottled, Tank, or LP Gas | 55 (5.9%) | 0 (0.0%) |
| Electricity | 246 (26.5%) | 0 (0.0%) |
| Fuel Oil or Kerosene | 0 (0.0%) | 0 (0.0%) |
| Coal or Coke | 0 (0.0%) | 0 (0.0%) |
| All other Fuels | 0 (0.0%) | 0 (0.0%) |
| No Fuel Used | 0 (0.0%) | 0 (0.0%) |
| Total | 929 (100.0%) | 104 (100.0%) |
Household Vehicle Usage in Montara
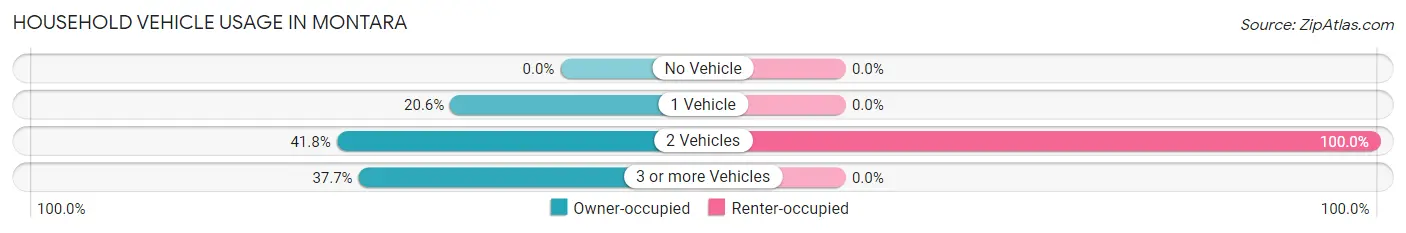
| Vehicles per Household | Owner-occupied | Renter-occupied |
| No Vehicle | 0 (0.0%) | 0 (0.0%) |
| 1 Vehicle | 191 (20.6%) | 0 (0.0%) |
| 2 Vehicles | 388 (41.8%) | 104 (100.0%) |
| 3 or more Vehicles | 350 (37.7%) | 0 (0.0%) |
| Total | 929 (100.0%) | 104 (100.0%) |
Real Estate & Mortgages in Montara
Real Estate and Mortgage Overview in Montara
| Characteristic | Without Mortgage | With Mortgage |
| Housing Units | 309 | 620 |
| Median Property Value | $1,430,700 | $1,390,900 |
| Median Household Income | $126,432 | $450 |
| Monthly Housing Costs | $1,010 | $365 |
| Real Estate Taxes | $4,644 | $0 |
Property Value by Mortgage Status in Montara
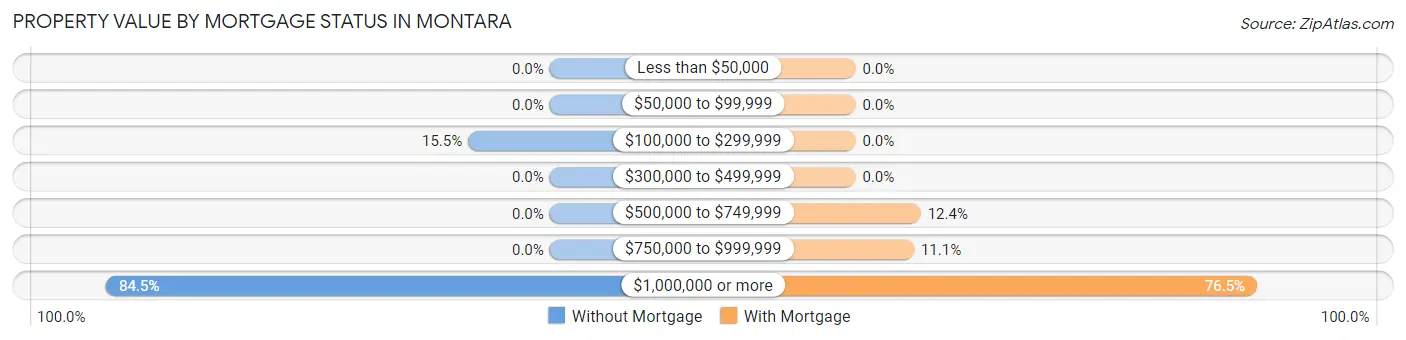
| Property Value | Without Mortgage | With Mortgage |
| Less than $50,000 | 0 (0.0%) | 0 (0.0%) |
| $50,000 to $99,999 | 0 (0.0%) | 0 (0.0%) |
| $100,000 to $299,999 | 48 (15.5%) | 0 (0.0%) |
| $300,000 to $499,999 | 0 (0.0%) | 0 (0.0%) |
| $500,000 to $749,999 | 0 (0.0%) | 77 (12.4%) |
| $750,000 to $999,999 | 0 (0.0%) | 69 (11.1%) |
| $1,000,000 or more | 261 (84.5%) | 474 (76.4%) |
| Total | 309 (100.0%) | 620 (100.0%) |
Household Income by Mortgage Status in Montara
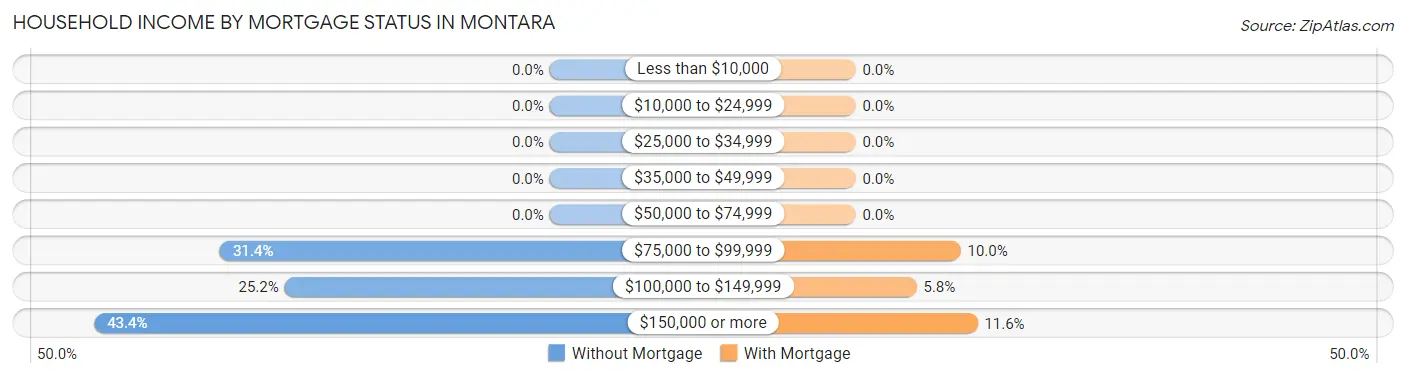
| Household Income | Without Mortgage | With Mortgage |
| Less than $10,000 | 0 (0.0%) | 0 (0.0%) |
| $10,000 to $24,999 | 0 (0.0%) | 0 (0.0%) |
| $25,000 to $34,999 | 0 (0.0%) | 0 (0.0%) |
| $35,000 to $49,999 | 0 (0.0%) | 0 (0.0%) |
| $50,000 to $74,999 | 0 (0.0%) | 0 (0.0%) |
| $75,000 to $99,999 | 97 (31.4%) | 62 (10.0%) |
| $100,000 to $149,999 | 78 (25.2%) | 36 (5.8%) |
| $150,000 or more | 134 (43.4%) | 72 (11.6%) |
| Total | 309 (100.0%) | 620 (100.0%) |
Property Value to Household Income Ratio in Montara
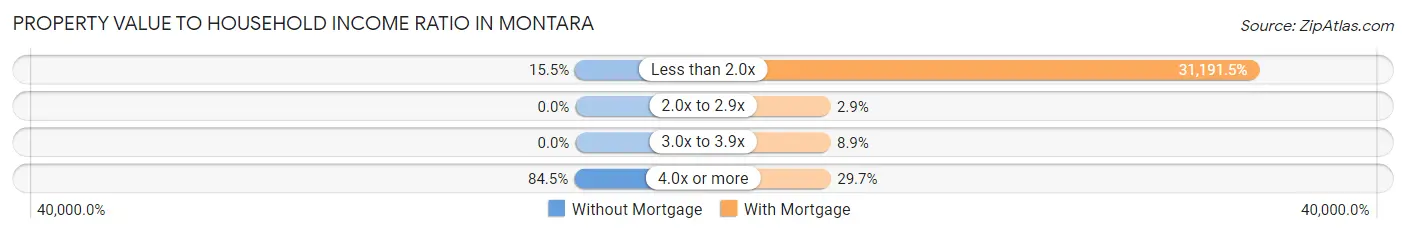
| Value-to-Income Ratio | Without Mortgage | With Mortgage |
| Less than 2.0x | 48 (15.5%) | 193,387 (31,191.4%) |
| 2.0x to 2.9x | 0 (0.0%) | 18 (2.9%) |
| 3.0x to 3.9x | 0 (0.0%) | 55 (8.9%) |
| 4.0x or more | 261 (84.5%) | 184 (29.7%) |
| Total | 309 (100.0%) | 620 (100.0%) |
Real Estate Taxes by Mortgage Status in Montara
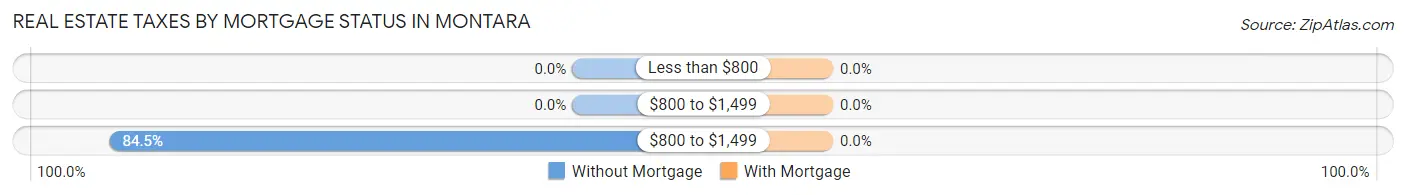
| Property Taxes | Without Mortgage | With Mortgage |
| Less than $800 | 0 (0.0%) | 0 (0.0%) |
| $800 to $1,499 | 0 (0.0%) | 0 (0.0%) |
| $800 to $1,499 | 261 (84.5%) | 0 (0.0%) |
| Total | 309 (100.0%) | 620 (100.0%) |
Health & Disability in Montara
Health Insurance Coverage by Age in Montara
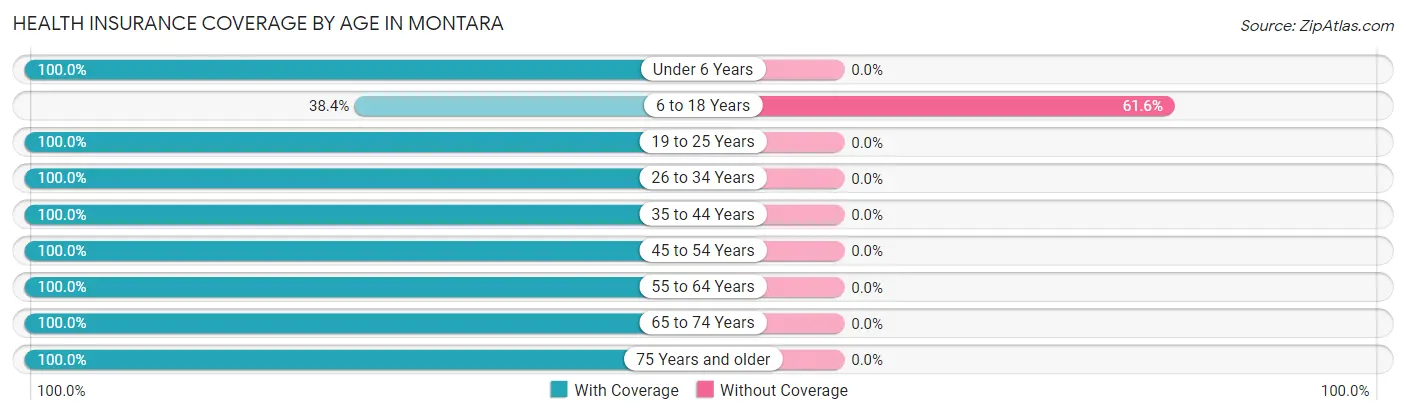
| Age Bracket | With Coverage | Without Coverage |
| Under 6 Years | 116 (100.0%) | 0 (0.0%) |
| 6 to 18 Years | 38 (38.4%) | 61 (61.6%) |
| 19 to 25 Years | 435 (100.0%) | 0 (0.0%) |
| 26 to 34 Years | 109 (100.0%) | 0 (0.0%) |
| 35 to 44 Years | 306 (100.0%) | 0 (0.0%) |
| 45 to 54 Years | 33 (100.0%) | 0 (0.0%) |
| 55 to 64 Years | 637 (100.0%) | 0 (0.0%) |
| 65 to 74 Years | 806 (100.0%) | 0 (0.0%) |
| 75 Years and older | 108 (100.0%) | 0 (0.0%) |
| Total | 2,588 (97.7%) | 61 (2.3%) |
Health Insurance Coverage by Citizenship Status in Montara
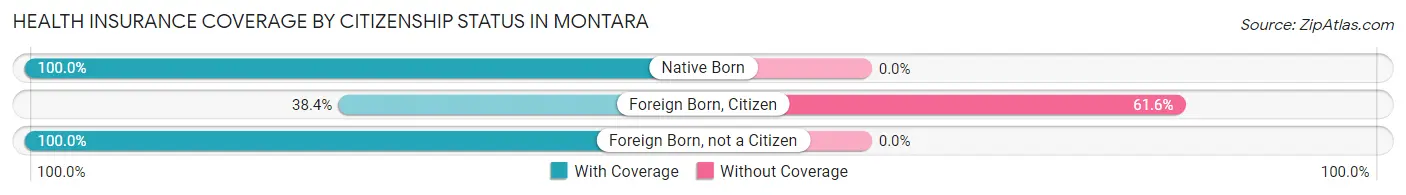
| Citizenship Status | With Coverage | Without Coverage |
| Native Born | 116 (100.0%) | 0 (0.0%) |
| Foreign Born, Citizen | 38 (38.4%) | 61 (61.6%) |
| Foreign Born, not a Citizen | 435 (100.0%) | 0 (0.0%) |
Health Insurance Coverage by Household Income in Montara
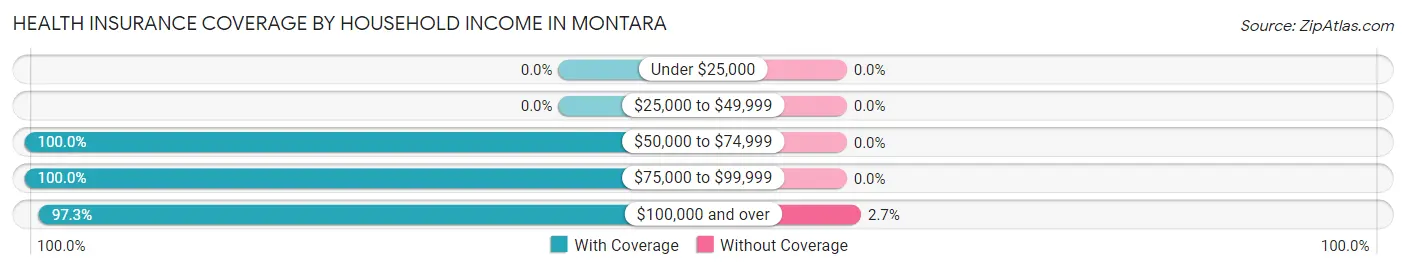
| Household Income | With Coverage | Without Coverage |
| Under $25,000 | 0 (0.0%) | 0 (0.0%) |
| $25,000 to $49,999 | 0 (0.0%) | 0 (0.0%) |
| $50,000 to $74,999 | 88 (100.0%) | 0 (0.0%) |
| $75,000 to $99,999 | 255 (100.0%) | 0 (0.0%) |
| $100,000 and over | 2,227 (97.3%) | 61 (2.7%) |
Public vs Private Health Insurance Coverage by Age in Montara
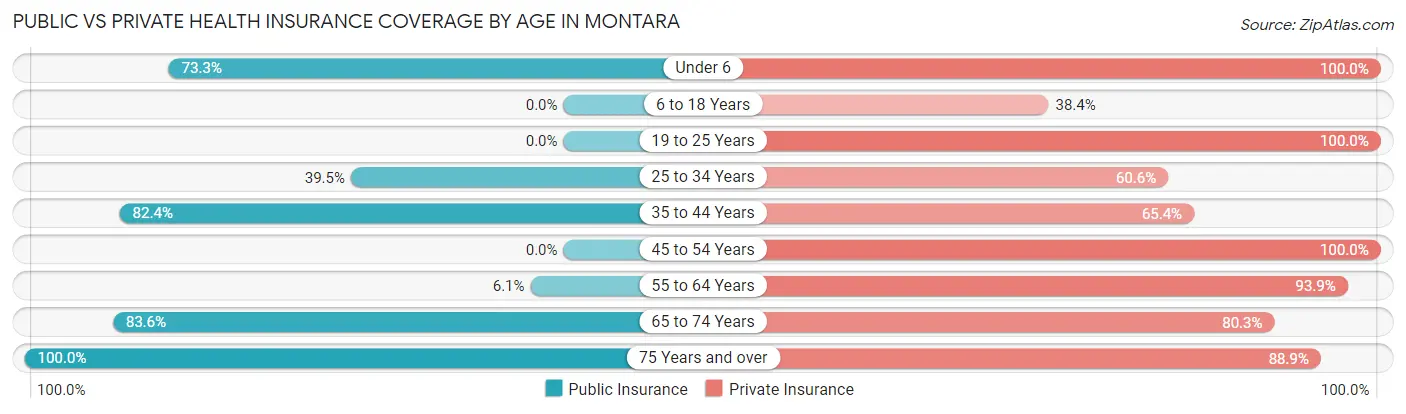
| Age Bracket | Public Insurance | Private Insurance |
| Under 6 | 85 (73.3%) | 116 (100.0%) |
| 6 to 18 Years | 0 (0.0%) | 38 (38.4%) |
| 19 to 25 Years | 0 (0.0%) | 435 (100.0%) |
| 25 to 34 Years | 43 (39.5%) | 66 (60.6%) |
| 35 to 44 Years | 252 (82.4%) | 200 (65.4%) |
| 45 to 54 Years | 0 (0.0%) | 33 (100.0%) |
| 55 to 64 Years | 39 (6.1%) | 598 (93.9%) |
| 65 to 74 Years | 674 (83.6%) | 647 (80.3%) |
| 75 Years and over | 108 (100.0%) | 96 (88.9%) |
| Total | 1,201 (45.3%) | 2,229 (84.1%) |
Disability Status by Sex by Age in Montara
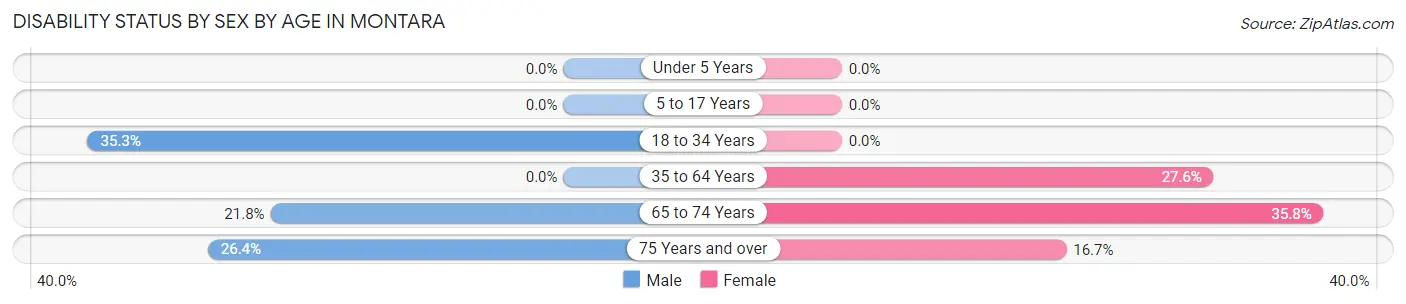
| Age Bracket | Male | Female |
| Under 5 Years | 0 (0.0%) | 0 (0.0%) |
| 5 to 17 Years | 0 (0.0%) | 0 (0.0%) |
| 18 to 34 Years | 172 (35.3%) | 0 (0.0%) |
| 35 to 64 Years | 0 (0.0%) | 169 (27.6%) |
| 65 to 74 Years | 92 (21.7%) | 137 (35.8%) |
| 75 Years and over | 19 (26.4%) | 6 (16.7%) |
Disability Class by Sex by Age in Montara
Disability Class: Hearing Difficulty
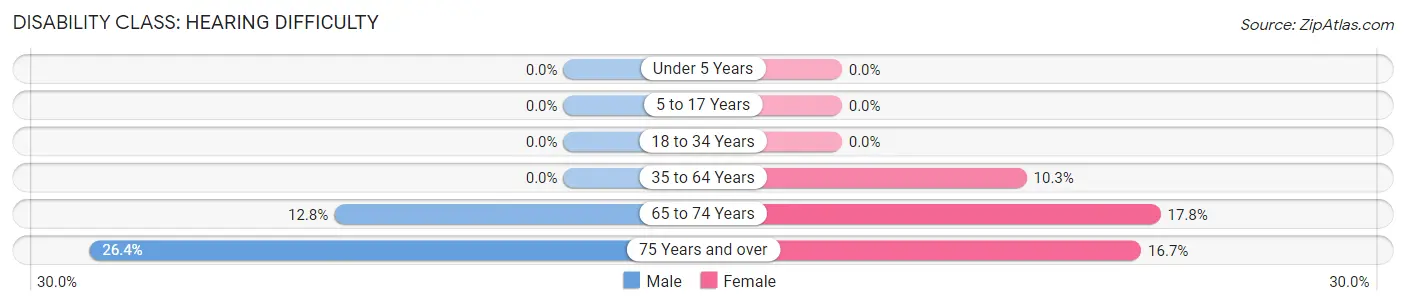
| Age Bracket | Male | Female |
| Under 5 Years | 0 (0.0%) | 0 (0.0%) |
| 5 to 17 Years | 0 (0.0%) | 0 (0.0%) |
| 18 to 34 Years | 0 (0.0%) | 0 (0.0%) |
| 35 to 64 Years | 0 (0.0%) | 63 (10.3%) |
| 65 to 74 Years | 54 (12.8%) | 68 (17.7%) |
| 75 Years and over | 19 (26.4%) | 6 (16.7%) |
Disability Class: Vision Difficulty
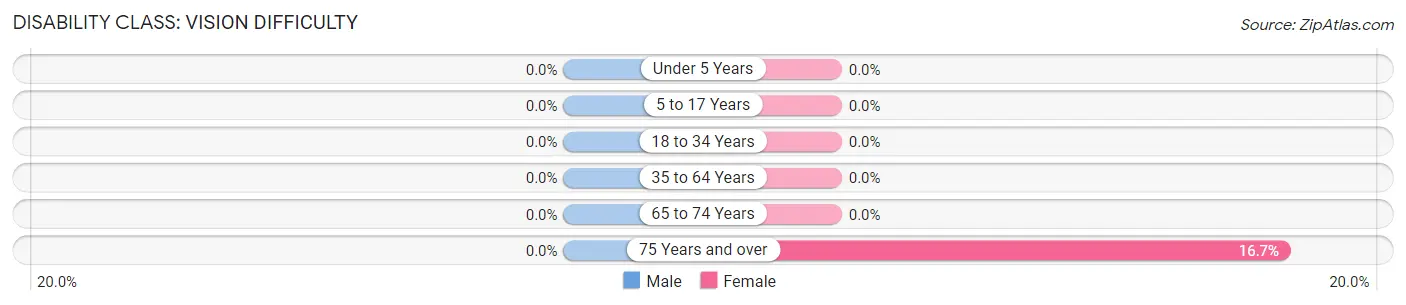
| Age Bracket | Male | Female |
| Under 5 Years | 0 (0.0%) | 0 (0.0%) |
| 5 to 17 Years | 0 (0.0%) | 0 (0.0%) |
| 18 to 34 Years | 0 (0.0%) | 0 (0.0%) |
| 35 to 64 Years | 0 (0.0%) | 0 (0.0%) |
| 65 to 74 Years | 0 (0.0%) | 0 (0.0%) |
| 75 Years and over | 0 (0.0%) | 6 (16.7%) |
Disability Class: Cognitive Difficulty
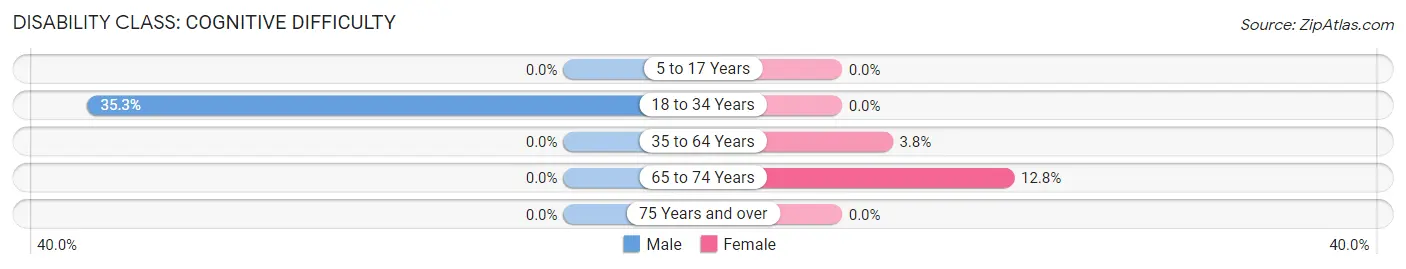
| Age Bracket | Male | Female |
| 5 to 17 Years | 0 (0.0%) | 0 (0.0%) |
| 18 to 34 Years | 172 (35.3%) | 0 (0.0%) |
| 35 to 64 Years | 0 (0.0%) | 23 (3.8%) |
| 65 to 74 Years | 0 (0.0%) | 49 (12.8%) |
| 75 Years and over | 0 (0.0%) | 0 (0.0%) |
Disability Class: Ambulatory Difficulty
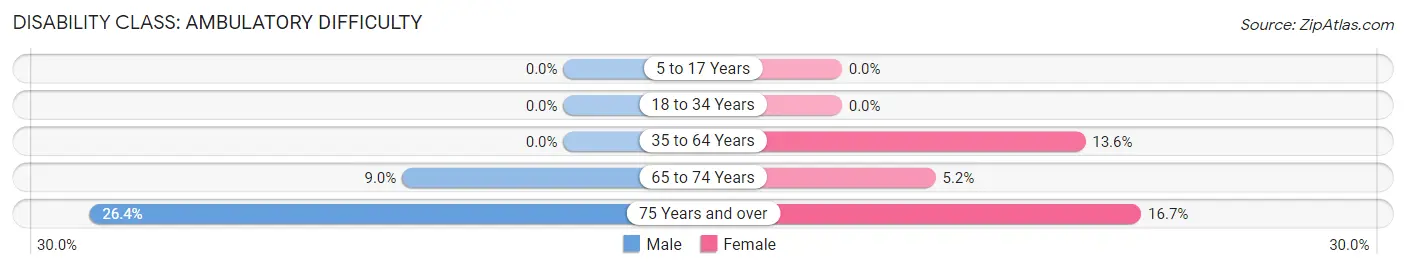
| Age Bracket | Male | Female |
| 5 to 17 Years | 0 (0.0%) | 0 (0.0%) |
| 18 to 34 Years | 0 (0.0%) | 0 (0.0%) |
| 35 to 64 Years | 0 (0.0%) | 83 (13.6%) |
| 65 to 74 Years | 38 (9.0%) | 20 (5.2%) |
| 75 Years and over | 19 (26.4%) | 6 (16.7%) |
Disability Class: Self-Care Difficulty
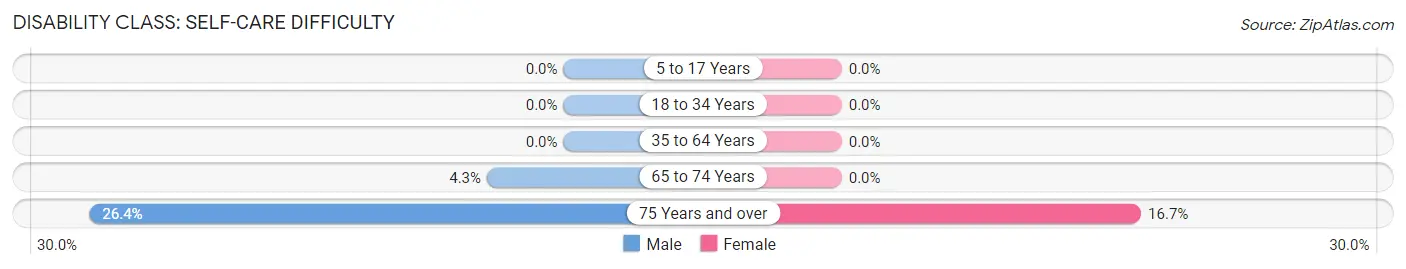
| Age Bracket | Male | Female |
| 5 to 17 Years | 0 (0.0%) | 0 (0.0%) |
| 18 to 34 Years | 0 (0.0%) | 0 (0.0%) |
| 35 to 64 Years | 0 (0.0%) | 0 (0.0%) |
| 65 to 74 Years | 18 (4.3%) | 0 (0.0%) |
| 75 Years and over | 19 (26.4%) | 6 (16.7%) |
Technology Access in Montara
Computing Device Access in Montara
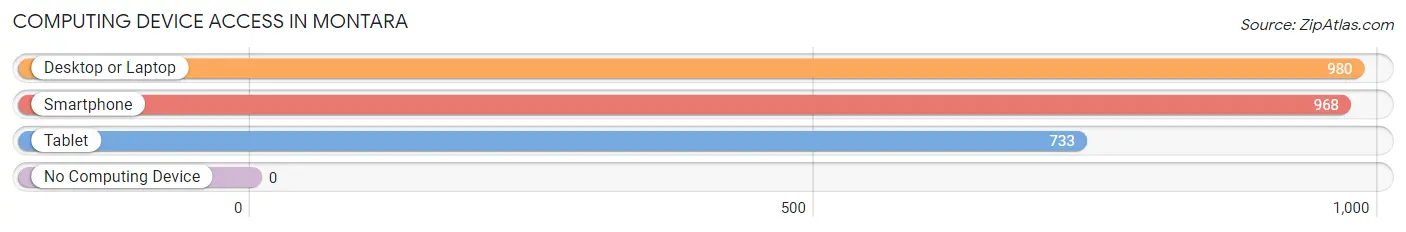
| Device Type | # Households | % Households |
| Desktop or Laptop | 980 | 94.9% |
| Smartphone | 968 | 93.7% |
| Tablet | 733 | 71.0% |
| No Computing Device | 0 | 0.0% |
| Total | 1,033 | 100.0% |
Internet Access in Montara
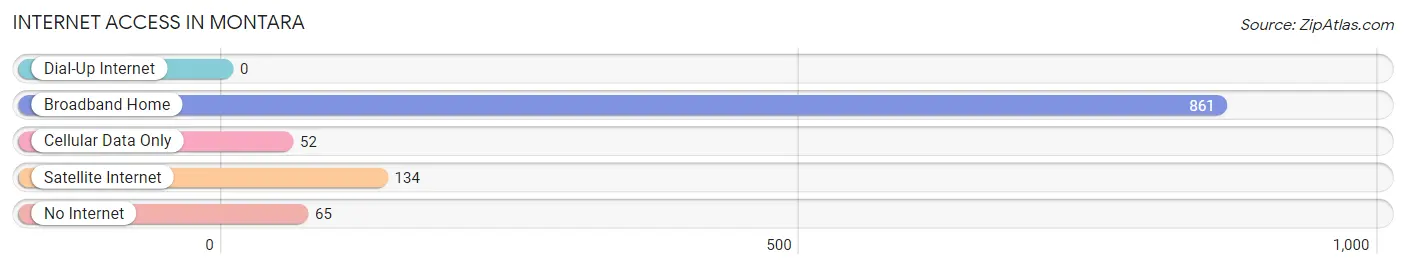
| Internet Type | # Households | % Households |
| Dial-Up Internet | 0 | 0.0% |
| Broadband Home | 861 | 83.4% |
| Cellular Data Only | 52 | 5.0% |
| Satellite Internet | 134 | 13.0% |
| No Internet | 65 | 6.3% |
| Total | 1,033 | 100.0% |
Montara Summary
Montara is a small unincorporated community located in San Mateo County, California. It is situated on the coast of the Pacific Ocean, about 20 miles south of San Francisco. The population of Montara was 2,909 at the 2010 census.
History
Montara was originally inhabited by the Ohlone people, who lived in the area for thousands of years before the arrival of Europeans. The first Europeans to settle in the area were Spanish missionaries, who established a mission in nearby San Francisco in 1776. The area was later part of the Rancho Corral de Tierra, a Mexican land grant given to the Arguello family in 1839.
In the late 19th century, the area was developed as a resort destination, with the construction of a hotel and a railroad line connecting Montara to San Francisco. The area was also home to a number of dairy farms, which supplied milk to San Francisco.
In the early 20th century, the area was developed as a residential community, with the construction of a number of homes. The area was incorporated as the Town of Montara in 1947, but was later dissolved in 1957.
Geography
Montara is located at 37°30'N 122°30'W, about 20 miles south of San Francisco. It is situated on the coast of the Pacific Ocean, with the Montara State Marine Reserve and Pillar Point Harbor to the north and the Montara State Beach to the south. The area is characterized by rolling hills and is home to a number of parks, including the Montara Mountain Open Space Preserve and the Montara State Marine Reserve.
Economy
The economy of Montara is largely based on tourism and recreation. The area is home to a number of hotels and resorts, as well as a number of restaurants and shops. The area is also home to a number of technology companies, including Oracle, Google, and Microsoft.
Demographics
As of the 2010 census, the population of Montara was 2,909. The racial makeup of the town was 73.3% White, 0.7% African American, 0.3% Native American, 15.2% Asian, 0.2% Pacific Islander, 5.2% from other races, and 5.2% from two or more races. Hispanic or Latino of any race were 15.2% of the population.
The median household income in Montara was $90,945, and the median family income was $103,945. The per capita income for the town was $45,945. About 5.2% of families and 7.3% of the population were below the poverty line, including 8.2% of those under age 18 and 4.2% of those age 65 or over.
Common Questions
What is Per Capita Income in Montara?
Per Capita income in Montara is $99,498.
What is the Median Family Income in Montara?
Median Family Income in Montara is $245,596.
What is the Median Household income in Montara?
Median Household Income in Montara is $184,692.
What is Income or Wage Gap in Montara?
Income or Wage Gap in Montara is 13.6%.
Women in Montara earn 86.4 cents for every dollar earned by a man.
What is Inequality or Gini Index in Montara?
Inequality or Gini Index in Montara is 0.38.
What is the Total Population of Montara?
Total Population of Montara is 2,649.
What is the Total Male Population of Montara?
Total Male Population of Montara is 1,384.
What is the Total Female Population of Montara?
Total Female Population of Montara is 1,265.
What is the Ratio of Males per 100 Females in Montara?
There are 109.41 Males per 100 Females in Montara.
What is the Ratio of Females per 100 Males in Montara?
There are 91.40 Females per 100 Males in Montara.
What is the Median Population Age in Montara?
Median Population Age in Montara is 59.1 Years.
What is the Average Family Size in Montara
Average Family Size in Montara is 3.2 People.
What is the Average Household Size in Montara
Average Household Size in Montara is 2.5 People.
How Large is the Labor Force in Montara?
There are 1,651 People in the Labor Forcein in Montara.
What is the Percentage of People in the Labor Force in Montara?
66.0% of People are in the Labor Force in Montara.
What is the Unemployment Rate in Montara?
Unemployment Rate in Montara is 10.4%.