Dos Palos Y, CA Map & Demographics
Dos Palos Y Map
Dos Palos Y Overview
$20,094
PER CAPITA INCOME
$28,542
AVG FAMILY INCOME
$37,857
AVG HOUSEHOLD INCOME
0.27
INEQUALITY / GINI INDEX
185
TOTAL POPULATION
136
MALE POPULATION
49
FEMALE POPULATION
277.55
MALES / 100 FEMALES
36.03
FEMALES / 100 MALES
55.5
MEDIAN AGE
2.2
AVG FAMILY SIZE
1.9
AVG HOUSEHOLD SIZE
93
LABOR FORCE [ PEOPLE ]
54.4%
PERCENT IN LABOR FORCE
32.3%
UNEMPLOYMENT RATE
Income in Dos Palos Y
Income Overview in Dos Palos Y
Per Capita Income in Dos Palos Y is $20,094, while median incomes of families and households are $28,542 and $37,857 respectively.
| Characteristic | Number | Measure |
| Per Capita Income | 185 | $20,094 |
| Median Family Income | 67 | $28,542 |
| Mean Family Income | 67 | $33,106 |
| Median Household Income | 98 | $37,857 |
| Mean Household Income | 98 | $35,555 |
| Income Deficit | 67 | $0 |
| Wage / Income Gap (%) | 185 | 0.00% |
| Wage / Income Gap ($) | 185 | 100.00¢ per $1 |
| Gini / Inequality Index | 185 | 0.27 |
Earnings by Sex in Dos Palos Y
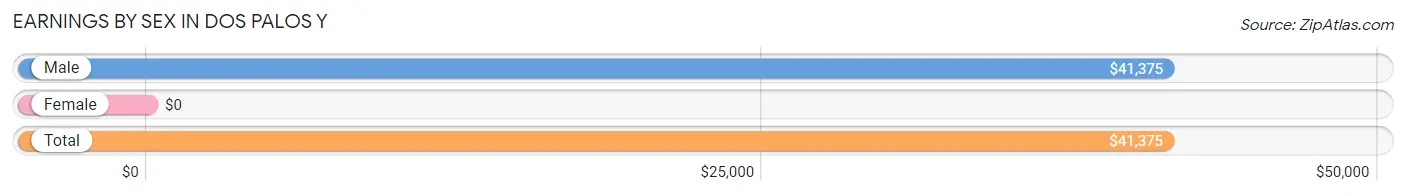
| Sex | Number | Average Earnings |
| Male | 63 (100.0%) | $41,375 |
| Female | 0 (0.0%) | $0 |
| Total | 63 (100.0%) | $41,375 |
Earnings by Sex by Income Bracket in Dos Palos Y
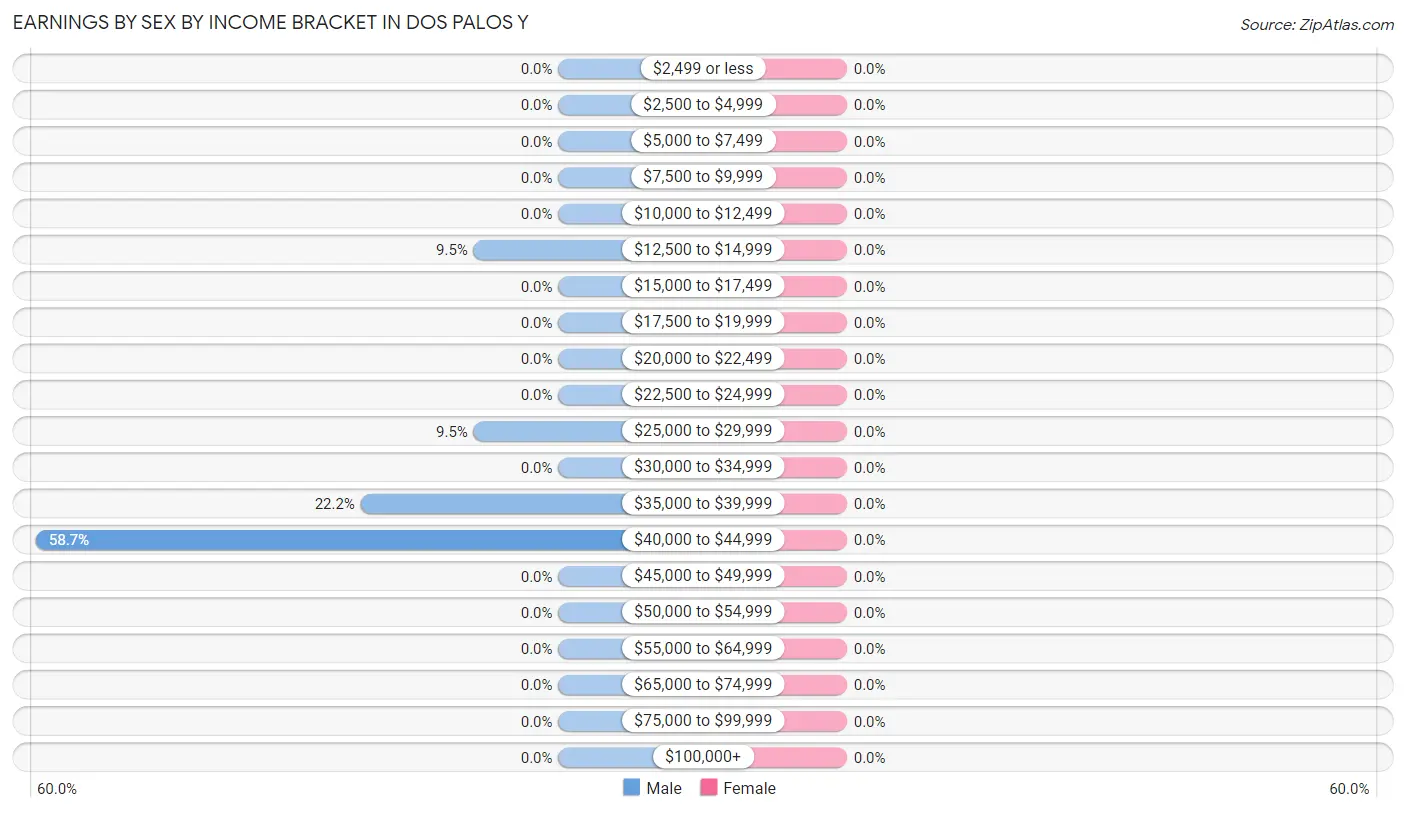
| Income | Male | Female |
| $2,499 or less | 0 (0.0%) | 0 (0.0%) |
| $2,500 to $4,999 | 0 (0.0%) | 0 (0.0%) |
| $5,000 to $7,499 | 0 (0.0%) | 0 (0.0%) |
| $7,500 to $9,999 | 0 (0.0%) | 0 (0.0%) |
| $10,000 to $12,499 | 0 (0.0%) | 0 (0.0%) |
| $12,500 to $14,999 | 6 (9.5%) | 0 (0.0%) |
| $15,000 to $17,499 | 0 (0.0%) | 0 (0.0%) |
| $17,500 to $19,999 | 0 (0.0%) | 0 (0.0%) |
| $20,000 to $22,499 | 0 (0.0%) | 0 (0.0%) |
| $22,500 to $24,999 | 0 (0.0%) | 0 (0.0%) |
| $25,000 to $29,999 | 6 (9.5%) | 0 (0.0%) |
| $30,000 to $34,999 | 0 (0.0%) | 0 (0.0%) |
| $35,000 to $39,999 | 14 (22.2%) | 0 (0.0%) |
| $40,000 to $44,999 | 37 (58.7%) | 0 (0.0%) |
| $45,000 to $49,999 | 0 (0.0%) | 0 (0.0%) |
| $50,000 to $54,999 | 0 (0.0%) | 0 (0.0%) |
| $55,000 to $64,999 | 0 (0.0%) | 0 (0.0%) |
| $65,000 to $74,999 | 0 (0.0%) | 0 (0.0%) |
| $75,000 to $99,999 | 0 (0.0%) | 0 (0.0%) |
| $100,000+ | 0 (0.0%) | 0 (0.0%) |
| Total | 63 (100.0%) | 0 (0.0%) |
Earnings by Sex by Educational Attainment in Dos Palos Y
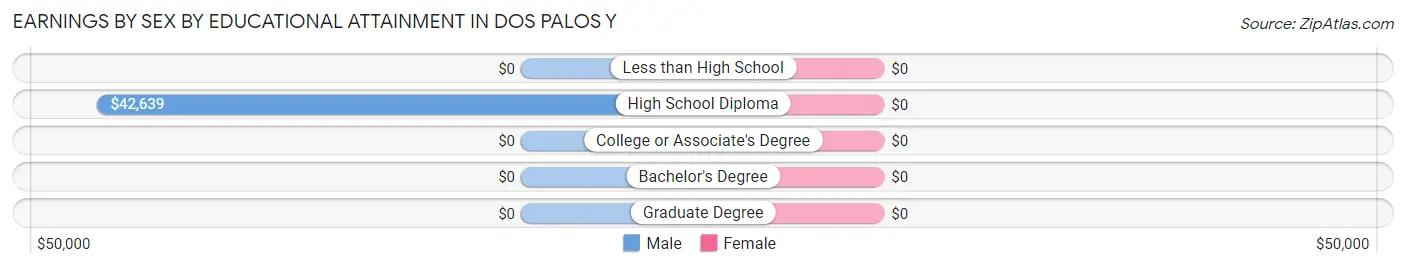
| Educational Attainment | Male Income | Female Income |
| Less than High School | - | - |
| High School Diploma | $42,639 | $0 |
| College or Associate's Degree | - | - |
| Bachelor's Degree | - | - |
| Graduate Degree | - | - |
| Total | $42,125 | $0 |
Family Income in Dos Palos Y
Family Income Brackets in Dos Palos Y
According to the Dos Palos Y family income data, there are 18 families falling into the $25,000 to $34,999 income range, which is the most common income bracket and makes up 26.9% of all families.
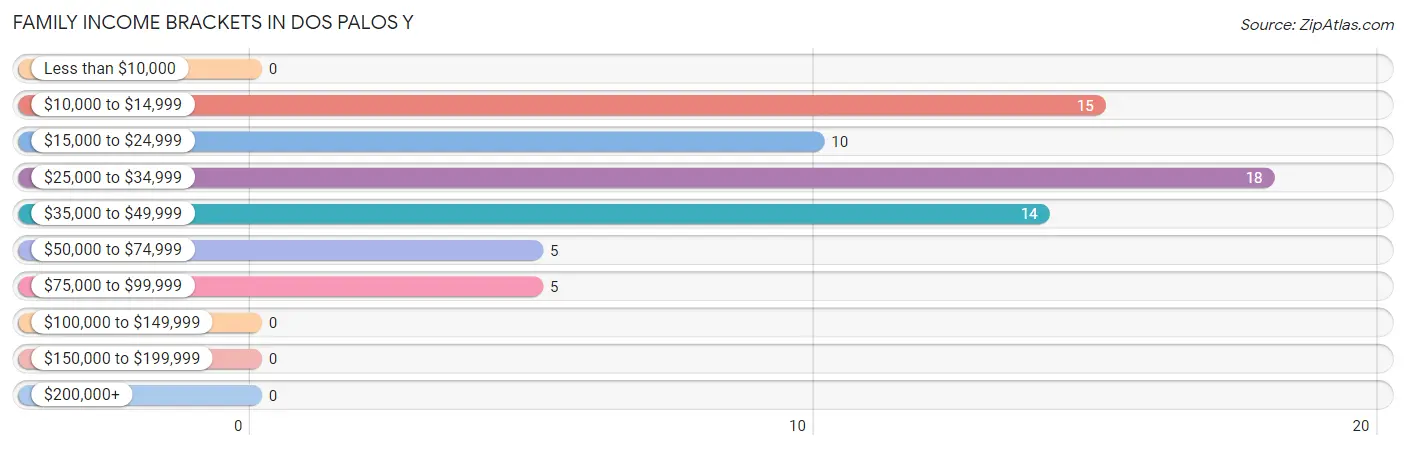
| Income Bracket | # Families | % Families |
| Less than $10,000 | 0 | 0.0% |
| $10,000 to $14,999 | 15 | 22.4% |
| $15,000 to $24,999 | 10 | 14.9% |
| $25,000 to $34,999 | 18 | 26.9% |
| $35,000 to $49,999 | 14 | 20.9% |
| $50,000 to $74,999 | 5 | 7.5% |
| $75,000 to $99,999 | 5 | 7.5% |
| $100,000 to $149,999 | 0 | 0.0% |
| $150,000 to $199,999 | 0 | 0.0% |
| $200,000+ | 0 | 0.0% |
Family Income by Famaliy Size in Dos Palos Y
2-person families (62 | 92.5%) account for the highest median family income in Dos Palos Y with $27,500 per family, while 2-person families (62 | 92.5%) have the highest median income of $13,750 per family member.
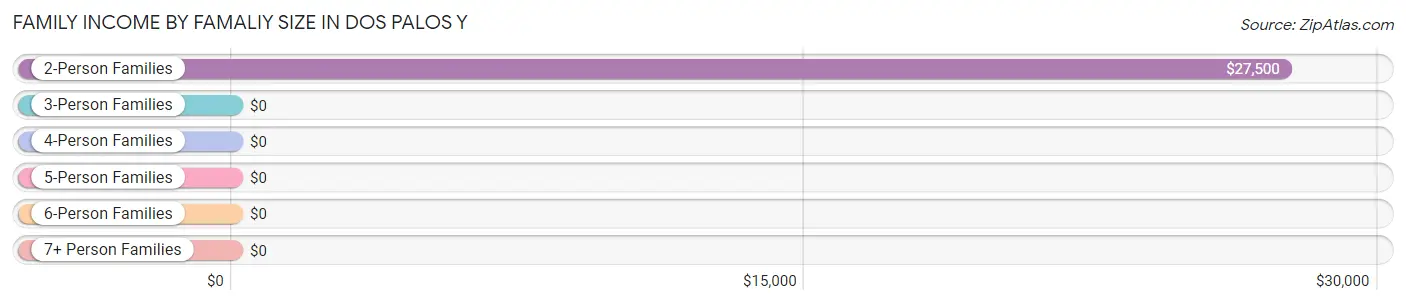
| Income Bracket | # Families | Median Income |
| 2-Person Families | 62 (92.5%) | $27,500 |
| 3-Person Families | 5 (7.5%) | $0 |
| 4-Person Families | 0 (0.0%) | $0 |
| 5-Person Families | 0 (0.0%) | $0 |
| 6-Person Families | 0 (0.0%) | $0 |
| 7+ Person Families | 0 (0.0%) | $0 |
| Total | 67 (100.0%) | $28,542 |
Family Income by Number of Earners in Dos Palos Y
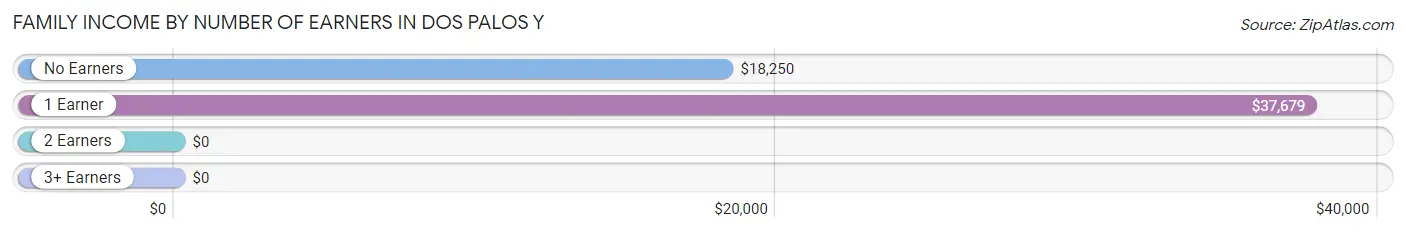
| Number of Earners | # Families | Median Income |
| No Earners | 36 (53.7%) | $18,250 |
| 1 Earner | 26 (38.8%) | $37,679 |
| 2 Earners | 5 (7.5%) | $0 |
| 3+ Earners | 0 (0.0%) | $0 |
| Total | 67 (100.0%) | $28,542 |
Household Income in Dos Palos Y
Household Income Brackets in Dos Palos Y
With 41 households falling in the category, the $35,000 to $49,999 income range is the most frequent in Dos Palos Y, accounting for 41.8% of all households.
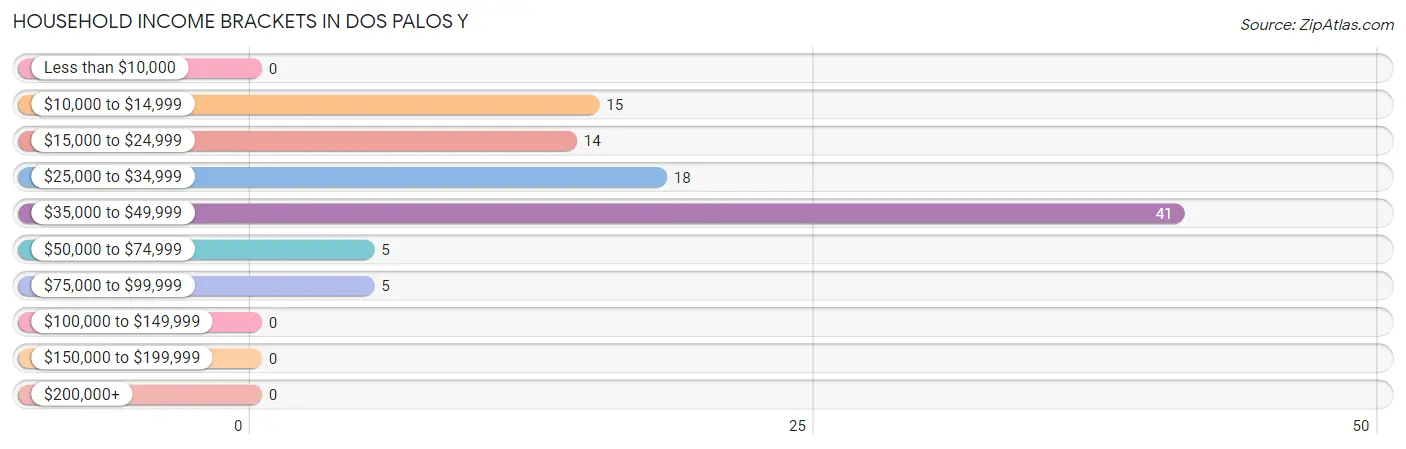
| Income Bracket | # Households | % Households |
| Less than $10,000 | 0 | 0.0% |
| $10,000 to $14,999 | 15 | 15.3% |
| $15,000 to $24,999 | 14 | 14.3% |
| $25,000 to $34,999 | 18 | 18.4% |
| $35,000 to $49,999 | 41 | 41.8% |
| $50,000 to $74,999 | 5 | 5.1% |
| $75,000 to $99,999 | 5 | 5.1% |
| $100,000 to $149,999 | 0 | 0.0% |
| $150,000 to $199,999 | 0 | 0.0% |
| $200,000+ | 0 | 0.0% |
Household Income by Householder Age in Dos Palos Y
The median household income in Dos Palos Y is $37,857, with the highest median household income of $32,708 found in the 65+ years age bracket for the primary householder. A total of 21 households (21.4%) fall into this category. Meanwhile, the 15 to 24 years age bracket for the primary householder has the lowest median household income of $0, with 16 households (16.3%) in this group.
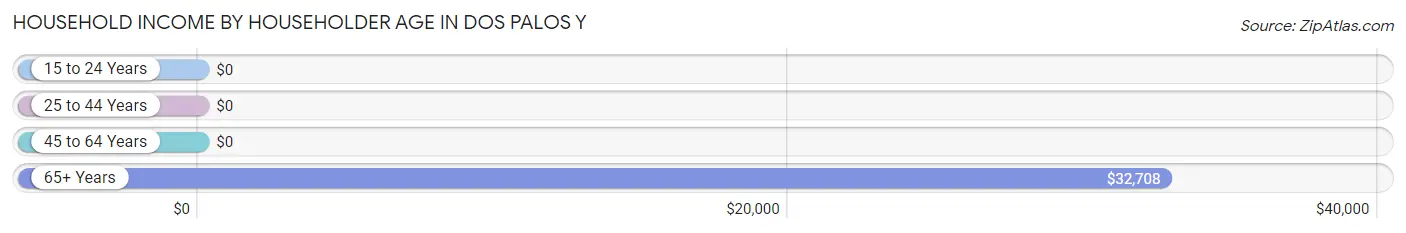
| Income Bracket | # Households | Median Income |
| 15 to 24 Years | 16 (16.3%) | $0 |
| 25 to 44 Years | 27 (27.6%) | $0 |
| 45 to 64 Years | 34 (34.7%) | $0 |
| 65+ Years | 21 (21.4%) | $32,708 |
| Total | 98 (100.0%) | $37,857 |
Poverty in Dos Palos Y
Income Below Poverty by Sex and Age in Dos Palos Y
With 30.9% poverty level for males and 32.7% for females among the residents of Dos Palos Y, 18 to 24 year old males and 18 to 24 year old females are the most vulnerable to poverty, with 10 males (62.5%) and 5 females (100.0%) in their respective age groups living below the poverty level.
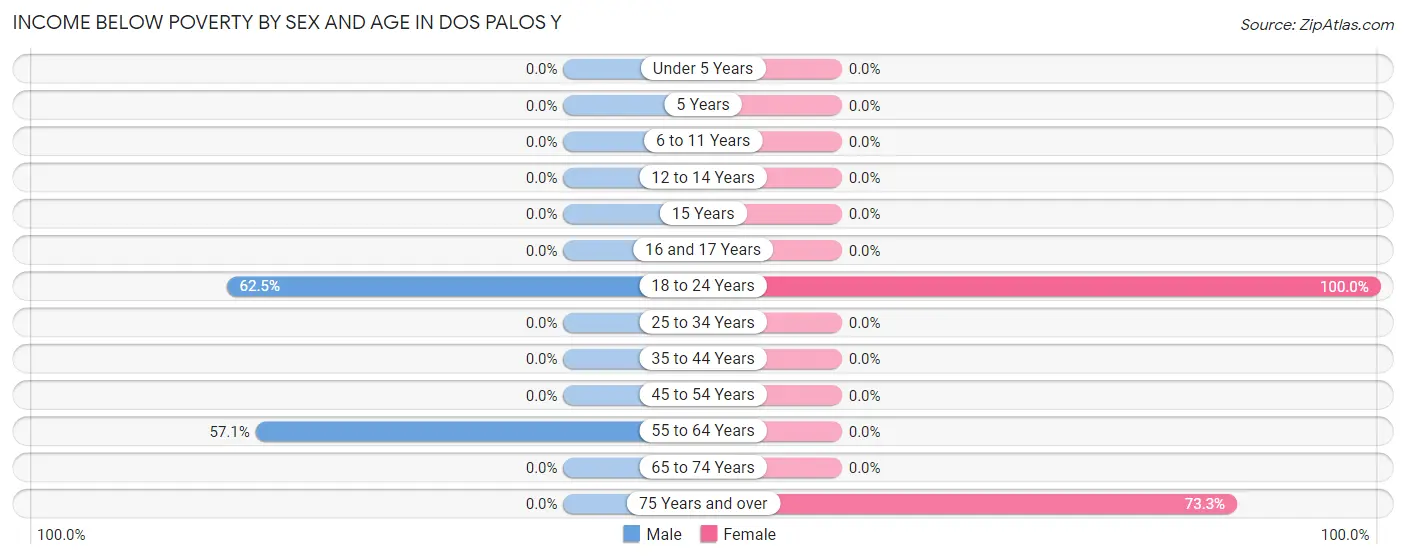
| Age Bracket | Male | Female |
| Under 5 Years | 0 (0.0%) | 0 (0.0%) |
| 5 Years | 0 (0.0%) | 0 (0.0%) |
| 6 to 11 Years | 0 (0.0%) | 0 (0.0%) |
| 12 to 14 Years | 0 (0.0%) | 0 (0.0%) |
| 15 Years | 0 (0.0%) | 0 (0.0%) |
| 16 and 17 Years | 0 (0.0%) | 0 (0.0%) |
| 18 to 24 Years | 10 (62.5%) | 5 (100.0%) |
| 25 to 34 Years | 0 (0.0%) | 0 (0.0%) |
| 35 to 44 Years | 0 (0.0%) | 0 (0.0%) |
| 45 to 54 Years | 0 (0.0%) | 0 (0.0%) |
| 55 to 64 Years | 32 (57.1%) | 0 (0.0%) |
| 65 to 74 Years | 0 (0.0%) | 0 (0.0%) |
| 75 Years and over | 0 (0.0%) | 11 (73.3%) |
| Total | 42 (30.9%) | 16 (32.7%) |
Income Above Poverty by Sex and Age in Dos Palos Y
According to the poverty statistics in Dos Palos Y, males aged under 5 years and females aged 55 to 64 years are the age groups that are most secure financially, with 100.0% of males and 100.0% of females in these age groups living above the poverty line.
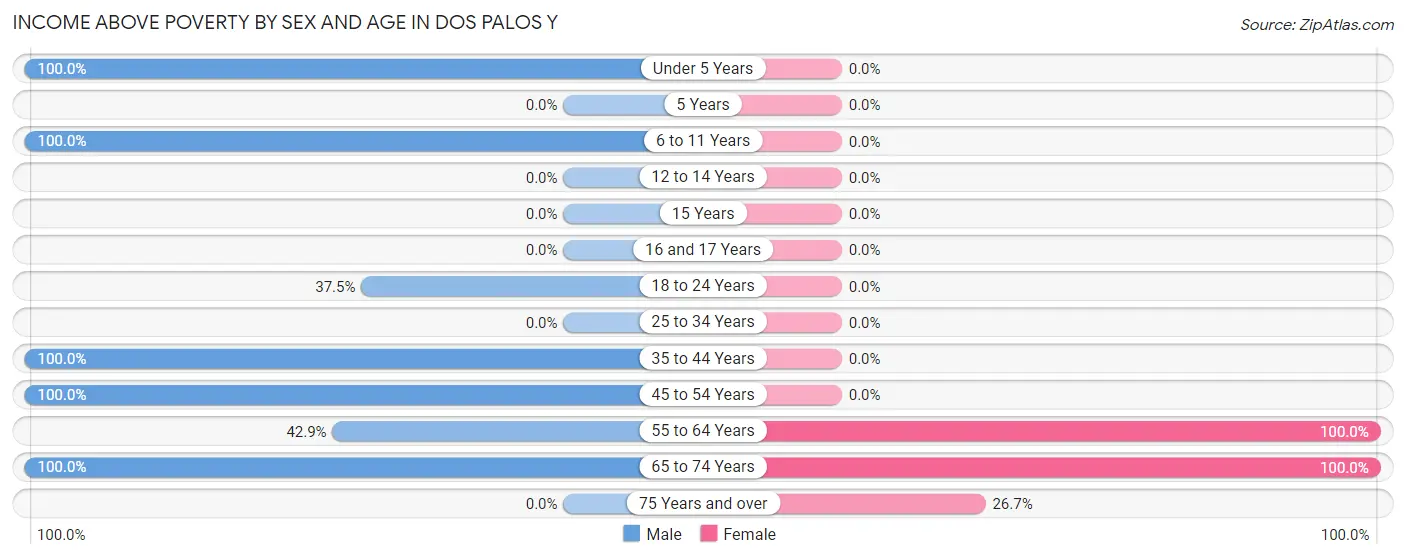
| Age Bracket | Male | Female |
| Under 5 Years | 7 (100.0%) | 0 (0.0%) |
| 5 Years | 0 (0.0%) | 0 (0.0%) |
| 6 to 11 Years | 7 (100.0%) | 0 (0.0%) |
| 12 to 14 Years | 0 (0.0%) | 0 (0.0%) |
| 15 Years | 0 (0.0%) | 0 (0.0%) |
| 16 and 17 Years | 0 (0.0%) | 0 (0.0%) |
| 18 to 24 Years | 6 (37.5%) | 0 (0.0%) |
| 25 to 34 Years | 0 (0.0%) | 0 (0.0%) |
| 35 to 44 Years | 27 (100.0%) | 0 (0.0%) |
| 45 to 54 Years | 17 (100.0%) | 0 (0.0%) |
| 55 to 64 Years | 24 (42.9%) | 12 (100.0%) |
| 65 to 74 Years | 6 (100.0%) | 17 (100.0%) |
| 75 Years and over | 0 (0.0%) | 4 (26.7%) |
| Total | 94 (69.1%) | 33 (67.3%) |
Income Below Poverty Among Married-Couple Families in Dos Palos Y
The poverty statistics for married-couple families in Dos Palos Y show that 42.9% or 15 of the total 35 families live below the poverty line. Families with no children have the highest poverty rate of 42.9%, comprising of 15 families. On the other hand, families with no children have the lowest poverty rate of 42.9%, which includes 15 families.
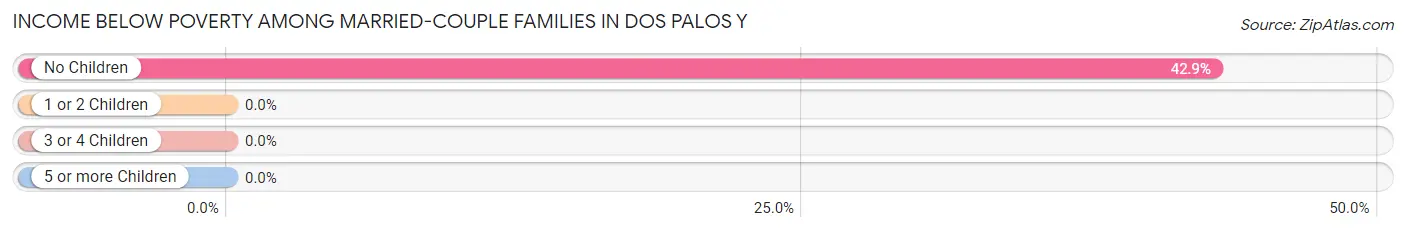
| Children | Above Poverty | Below Poverty |
| No Children | 20 (57.1%) | 15 (42.9%) |
| 1 or 2 Children | 0 (0.0%) | 0 (0.0%) |
| 3 or 4 Children | 0 (0.0%) | 0 (0.0%) |
| 5 or more Children | 0 (0.0%) | 0 (0.0%) |
| Total | 20 (57.1%) | 15 (42.9%) |
Income Below Poverty Among Single-Parent Households in Dos Palos Y
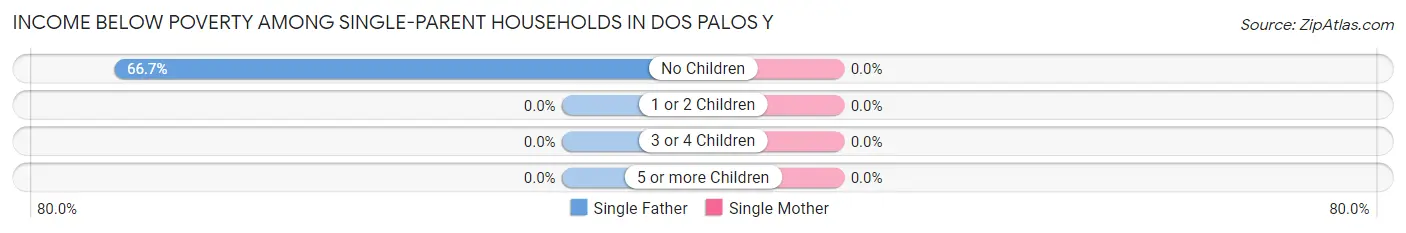
| Children | Single Father | Single Mother |
| No Children | 10 (66.7%) | 0 (0.0%) |
| 1 or 2 Children | 0 (0.0%) | 0 (0.0%) |
| 3 or 4 Children | 0 (0.0%) | 0 (0.0%) |
| 5 or more Children | 0 (0.0%) | 0 (0.0%) |
| Total | 10 (47.6%) | 0 (0.0%) |
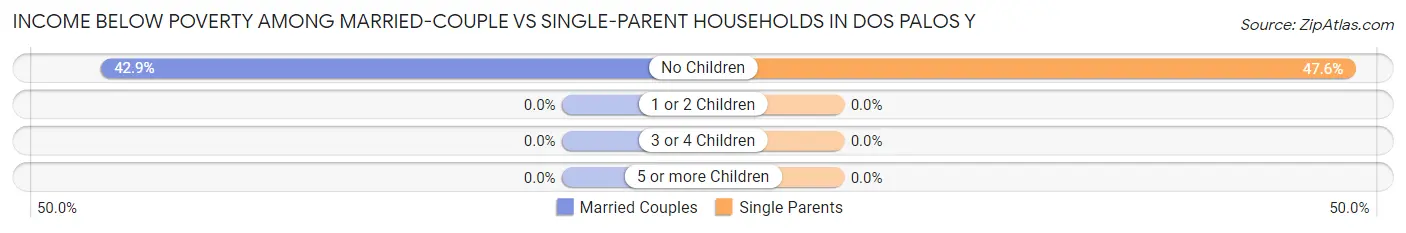
Income Below Poverty Among Married-Couple vs Single-Parent Households in Dos Palos Y
The poverty data for Dos Palos Y shows that 15 of the married-couple family households (42.9%) and 10 of the single-parent households (31.2%) are living below the poverty level. Within the married-couple family households, those with no children have the highest poverty rate, with 15 households (42.9%) falling below the poverty line. Among the single-parent households, those with no children have the highest poverty rate, with 10 household (47.6%) living below poverty.
| Children | Married-Couple Families | Single-Parent Households |
| No Children | 15 (42.9%) | 10 (47.6%) |
| 1 or 2 Children | 0 (0.0%) | 0 (0.0%) |
| 3 or 4 Children | 0 (0.0%) | 0 (0.0%) |
| 5 or more Children | 0 (0.0%) | 0 (0.0%) |
| Total | 15 (42.9%) | 10 (31.2%) |
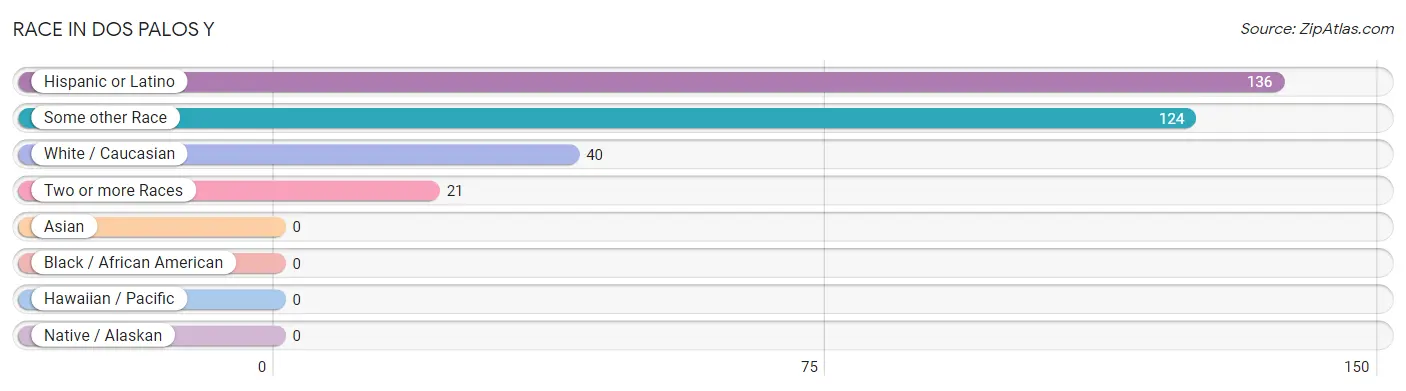
Race in Dos Palos Y
The most populous races in Dos Palos Y are Hispanic or Latino (136 | 73.5%), Some other Race (124 | 67.0%), and White / Caucasian (40 | 21.6%).
| Race | # Population | % Population |
| Asian | 0 | 0.0% |
| Black / African American | 0 | 0.0% |
| Hawaiian / Pacific | 0 | 0.0% |
| Hispanic or Latino | 136 | 73.5% |
| Native / Alaskan | 0 | 0.0% |
| White / Caucasian | 40 | 21.6% |
| Two or more Races | 21 | 11.4% |
| Some other Race | 124 | 67.0% |
| Total | 185 | 100.0% |
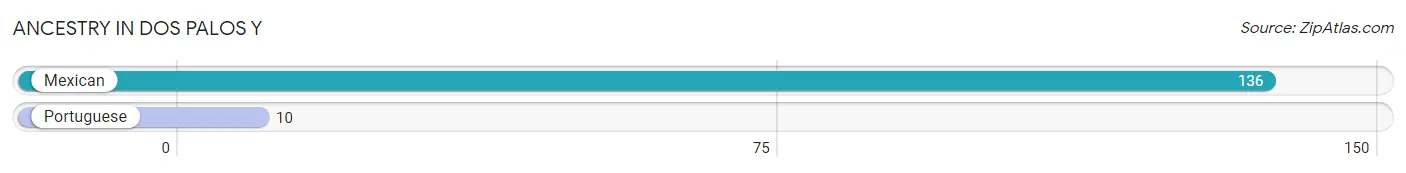
Ancestry in Dos Palos Y
The most populous ancestries reported in Dos Palos Y are Mexican (136 | 73.5%), and Portuguese (10 | 5.4%), together accounting for 78.9% of all Dos Palos Y residents.
| Ancestry | # Population | % Population |
| Mexican | 136 | 73.5% |
| Portuguese | 10 | 5.4% | View All 2 Rows |
Immigrants in Dos Palos Y
The most numerous immigrant groups reported in Dos Palos Y came from Central America (108 | 58.4%), Latin America (108 | 58.4%), Mexico (108 | 58.4%), and Canada (6 | 3.2%), together accounting for 178.4% of all Dos Palos Y residents.
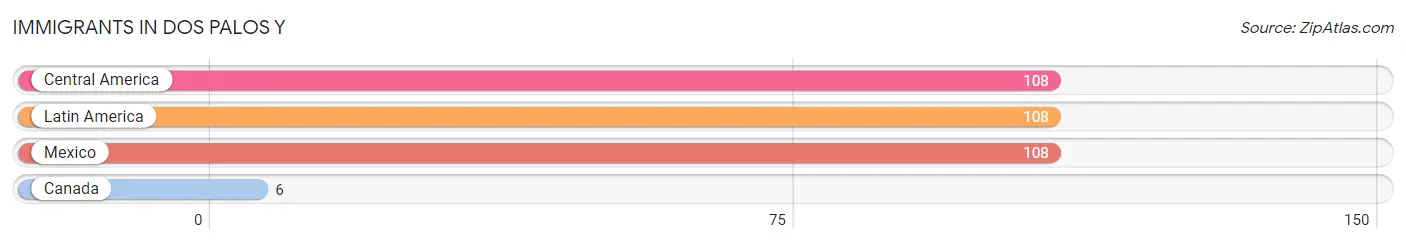
| Immigration Origin | # Population | % Population |
| Canada | 6 | 3.2% |
| Central America | 108 | 58.4% |
| Latin America | 108 | 58.4% |
| Mexico | 108 | 58.4% | View All 4 Rows |
Sex and Age in Dos Palos Y
Sex and Age in Dos Palos Y
The most populous age groups in Dos Palos Y are 55 to 59 Years (31 | 22.8%) for men and 55 to 59 Years (12 | 24.5%) for women.
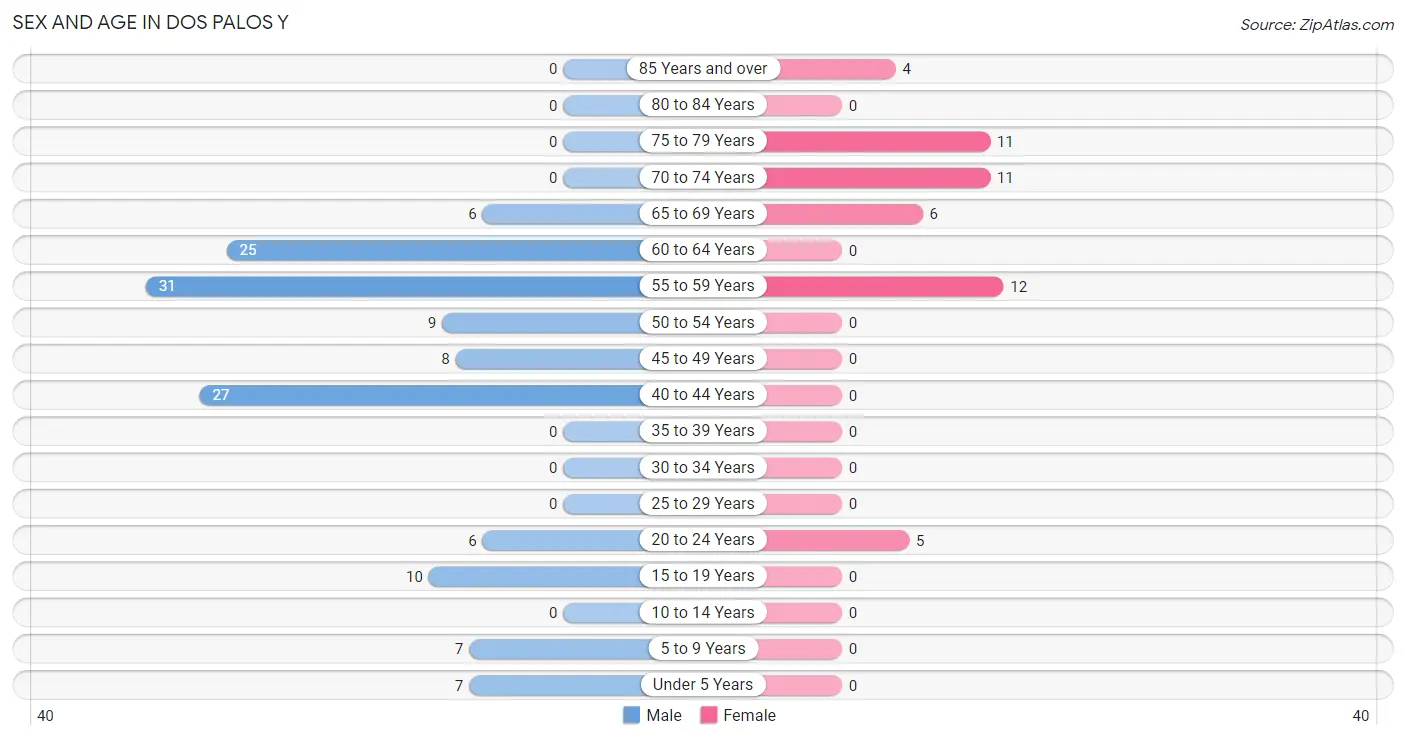
| Age Bracket | Male | Female |
| Under 5 Years | 7 (5.1%) | 0 (0.0%) |
| 5 to 9 Years | 7 (5.1%) | 0 (0.0%) |
| 10 to 14 Years | 0 (0.0%) | 0 (0.0%) |
| 15 to 19 Years | 10 (7.3%) | 0 (0.0%) |
| 20 to 24 Years | 6 (4.4%) | 5 (10.2%) |
| 25 to 29 Years | 0 (0.0%) | 0 (0.0%) |
| 30 to 34 Years | 0 (0.0%) | 0 (0.0%) |
| 35 to 39 Years | 0 (0.0%) | 0 (0.0%) |
| 40 to 44 Years | 27 (19.9%) | 0 (0.0%) |
| 45 to 49 Years | 8 (5.9%) | 0 (0.0%) |
| 50 to 54 Years | 9 (6.6%) | 0 (0.0%) |
| 55 to 59 Years | 31 (22.8%) | 12 (24.5%) |
| 60 to 64 Years | 25 (18.4%) | 0 (0.0%) |
| 65 to 69 Years | 6 (4.4%) | 6 (12.2%) |
| 70 to 74 Years | 0 (0.0%) | 11 (22.5%) |
| 75 to 79 Years | 0 (0.0%) | 11 (22.5%) |
| 80 to 84 Years | 0 (0.0%) | 0 (0.0%) |
| 85 Years and over | 0 (0.0%) | 4 (8.2%) |
| Total | 136 (100.0%) | 49 (100.0%) |
Families and Households in Dos Palos Y
Median Family Size in Dos Palos Y
The median family size in Dos Palos Y is 2.22 persons per family, with single female/mother families (11 | 16.4%) accounting for the largest median family size of 3.18 persons per family. On the other hand, married-couple families (35 | 52.2%) represent the smallest median family size with 1.83 persons per family.
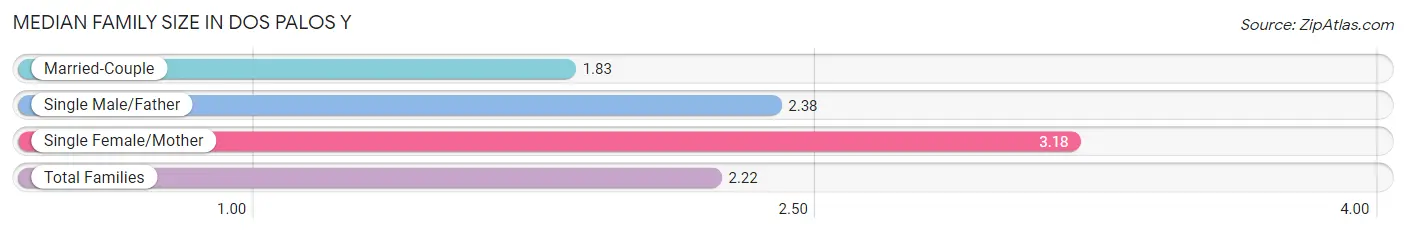
| Family Type | # Families | Family Size |
| Married-Couple | 35 (52.2%) | 1.83 |
| Single Male/Father | 21 (31.3%) | 2.38 |
| Single Female/Mother | 11 (16.4%) | 3.18 |
| Total Families | 67 (100.0%) | 2.22 |
Median Household Size in Dos Palos Y
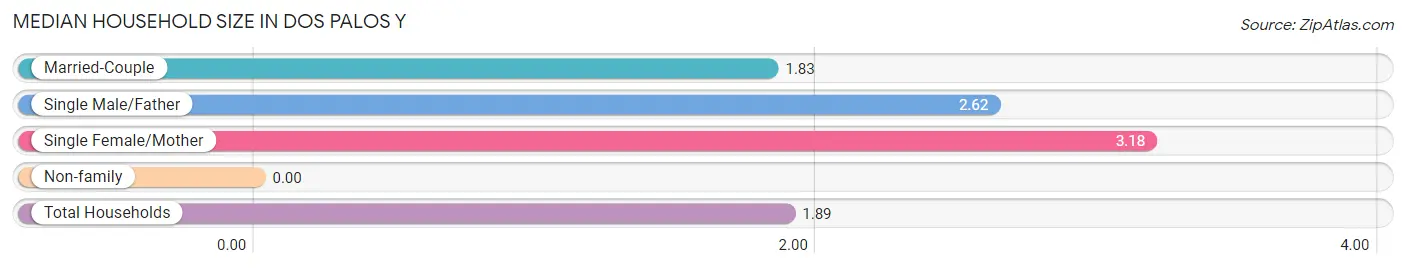
| Household Type | # Households | Household Size |
| Married-Couple | 35 (35.7%) | 1.83 |
| Single Male/Father | 21 (21.4%) | 2.62 |
| Single Female/Mother | 11 (11.2%) | 3.18 |
| Non-family | 31 (31.6%) | - |
| Total Households | 98 (100.0%) | 1.89 |
Household Size by Marriage Status in Dos Palos Y
Out of a total of 98 households in Dos Palos Y, 67 (68.4%) are family households, while 31 (31.6%) are nonfamily households. The most numerous type of family households are 2-person households, comprising 56, and the most common type of nonfamily households are 1-person households, comprising 31.
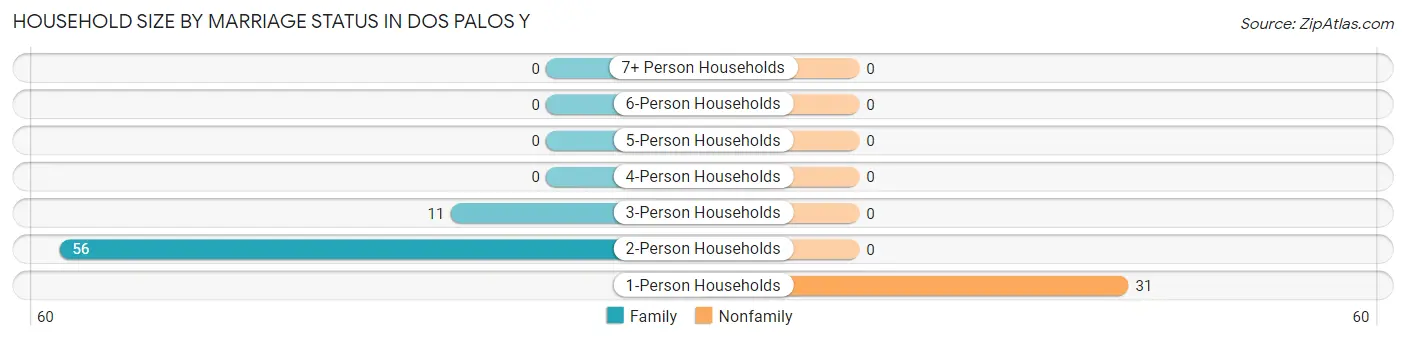
| Household Size | Family Households | Nonfamily Households |
| 1-Person Households | - | 31 (31.6%) |
| 2-Person Households | 56 (57.1%) | 0 (0.0%) |
| 3-Person Households | 11 (11.2%) | 0 (0.0%) |
| 4-Person Households | 0 (0.0%) | 0 (0.0%) |
| 5-Person Households | 0 (0.0%) | 0 (0.0%) |
| 6-Person Households | 0 (0.0%) | 0 (0.0%) |
| 7+ Person Households | 0 (0.0%) | 0 (0.0%) |
| Total | 67 (68.4%) | 31 (31.6%) |
Female Fertility in Dos Palos Y
Fertility by Age in Dos Palos Y
Average fertility rate in Dos Palos Y is 1,000.0 births per 1,000 women. Women in the age bracket of 20 to 34 years have the highest fertility rate with 1,000.0 births per 1,000 women. Women in the age bracket of 20 to 34 years acount for 100.0% of all women with births.
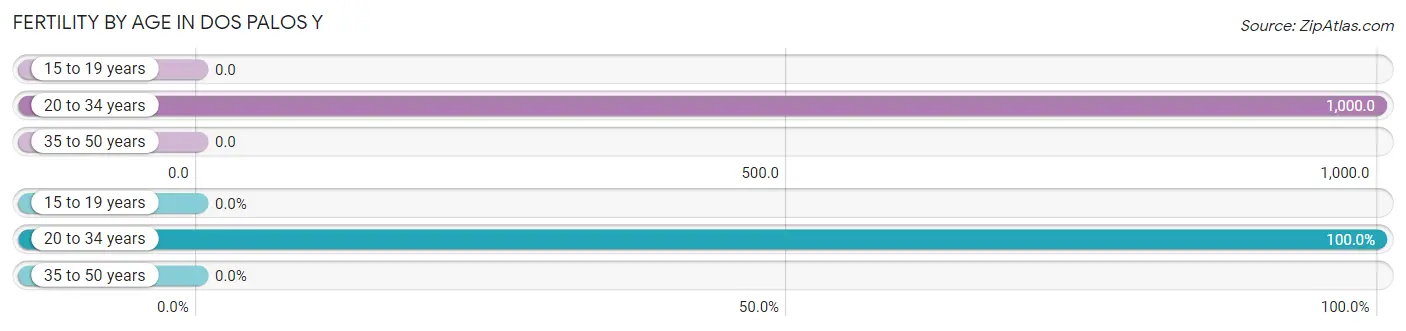
| Age Bracket | Women with Births | Births / 1,000 Women |
| 15 to 19 years | 0 (0.0%) | 0.0 |
| 20 to 34 years | 5 (100.0%) | 1,000.0 |
| 35 to 50 years | 0 (0.0%) | 0.0 |
| Total | 5 (100.0%) | 1,000.0 |
Fertility by Age by Marriage Status in Dos Palos Y
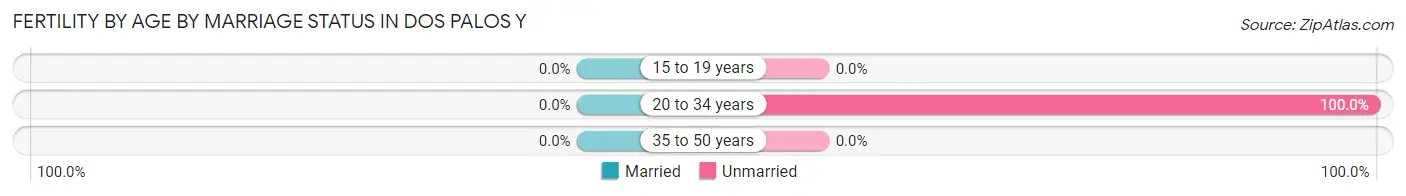
| Age Bracket | Married | Unmarried |
| 15 to 19 years | 0 (0.0%) | 0 (0.0%) |
| 20 to 34 years | 0 (0.0%) | 5 (100.0%) |
| 35 to 50 years | 0 (0.0%) | 0 (0.0%) |
| Total | 0 (0.0%) | 5 (100.0%) |
Fertility by Education in Dos Palos Y
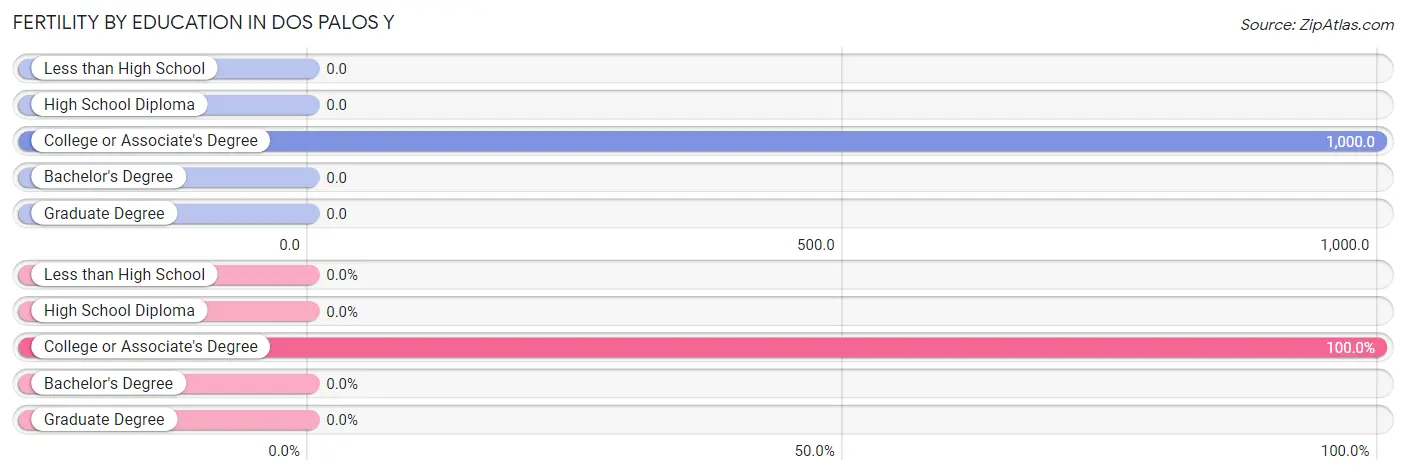
| Educational Attainment | Women with Births | Births / 1,000 Women |
| Less than High School | 0 (0.0%) | 0.0 |
| High School Diploma | 0 (0.0%) | 0.0 |
| College or Associate's Degree | 5 (100.0%) | 1,000.0 |
| Bachelor's Degree | 0 (0.0%) | 0.0 |
| Graduate Degree | 0 (0.0%) | 0.0 |
| Total | 5 (100.0%) | 1,000.0 |
Fertility by Education by Marriage Status in Dos Palos Y
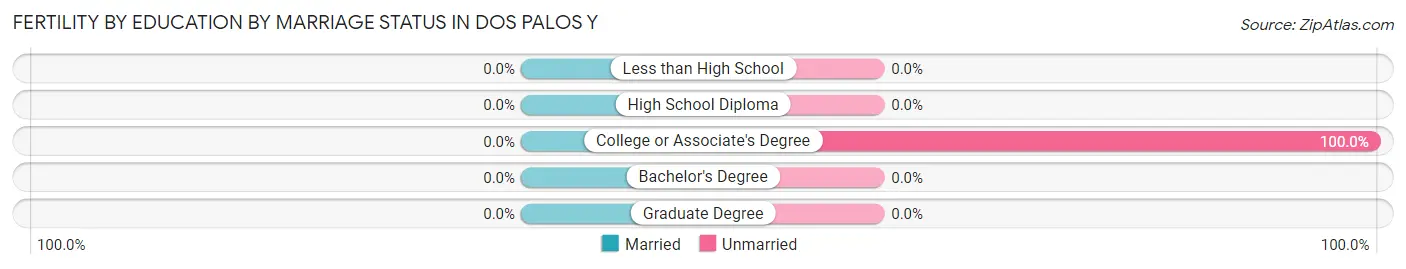
| Educational Attainment | Married | Unmarried |
| Less than High School | 0 (0.0%) | 0 (0.0%) |
| High School Diploma | 0 (0.0%) | 0 (0.0%) |
| College or Associate's Degree | 0 (0.0%) | 5 (100.0%) |
| Bachelor's Degree | 0 (0.0%) | 0 (0.0%) |
| Graduate Degree | 0 (0.0%) | 0 (0.0%) |
| Total | 0 (0.0%) | 5 (100.0%) |
Employment Characteristics in Dos Palos Y
Employment by Class of Employer in Dos Palos Y
Among the 63 employed individuals in Dos Palos Y, private company employees (58 | 92.1%), and self-employed (not incorporated) (5 | 7.9%) make up the most common classes of employment.
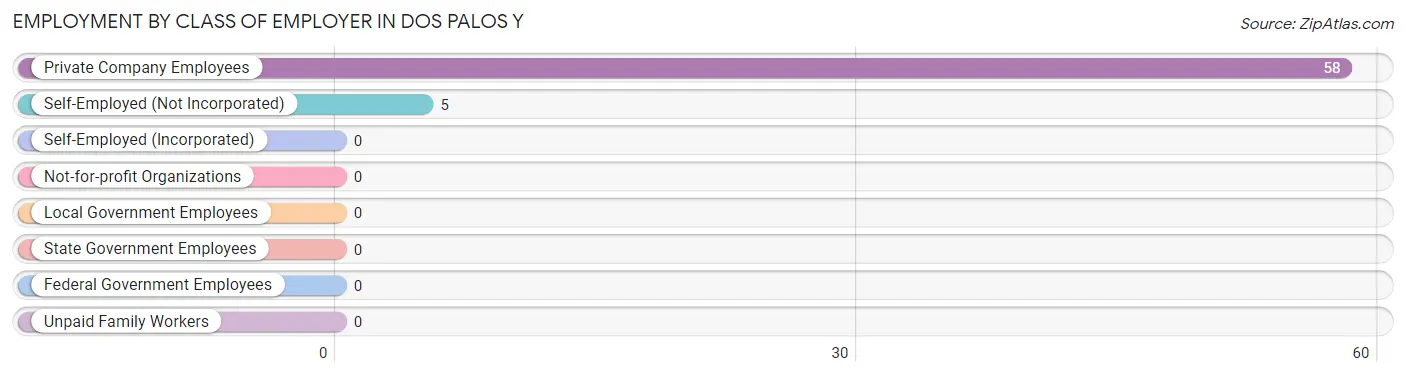
| Employer Class | # Employees | % Employees |
| Private Company Employees | 58 | 92.1% |
| Self-Employed (Incorporated) | 0 | 0.0% |
| Self-Employed (Not Incorporated) | 5 | 7.9% |
| Not-for-profit Organizations | 0 | 0.0% |
| Local Government Employees | 0 | 0.0% |
| State Government Employees | 0 | 0.0% |
| Federal Government Employees | 0 | 0.0% |
| Unpaid Family Workers | 0 | 0.0% |
| Total | 63 | 100.0% |
Employment Status by Age in Dos Palos Y
According to the labor force statistics for Dos Palos Y, out of the total population over 16 years of age (171), 54.4% or 93 individuals are in the labor force, with 32.3% or 30 of them unemployed. The age group with the highest labor force participation rate is 16 to 19 years, with 100.0% or 10 individuals in the labor force. Within the labor force, the 16 to 19 years age range has the highest percentage of unemployed individuals, with 100.0% or 10 of them being unemployed.
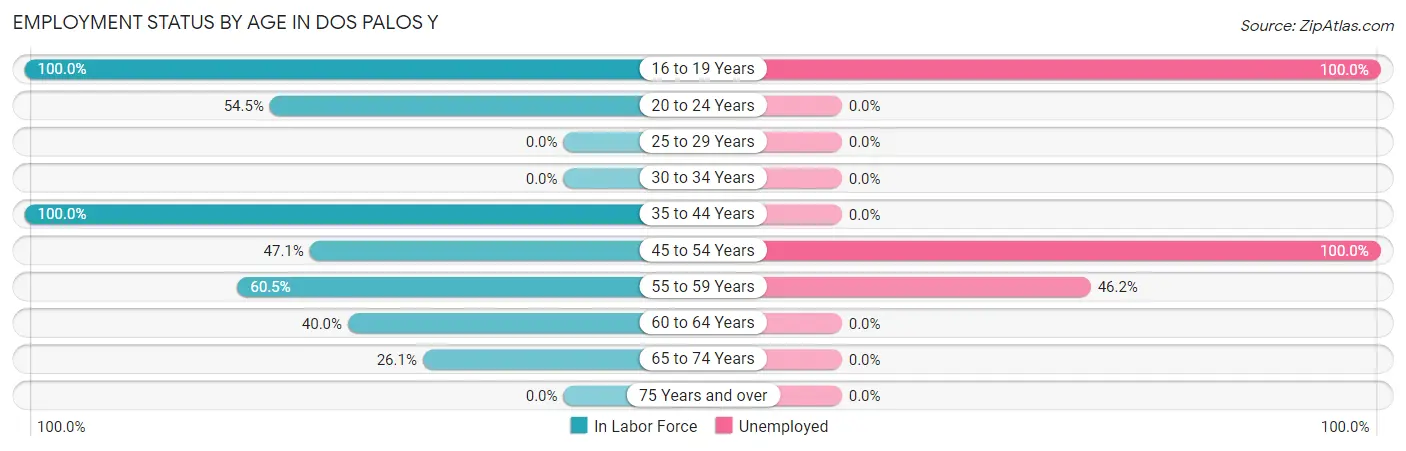
| Age Bracket | In Labor Force | Unemployed |
| 16 to 19 Years | 10 (100.0%) | 10 (100.0%) |
| 20 to 24 Years | 6 (54.5%) | 0 (0.0%) |
| 25 to 29 Years | 0 (0.0%) | 0 (0.0%) |
| 30 to 34 Years | 0 (0.0%) | 0 (0.0%) |
| 35 to 44 Years | 27 (100.0%) | 0 (0.0%) |
| 45 to 54 Years | 8 (47.1%) | 8 (100.0%) |
| 55 to 59 Years | 26 (60.5%) | 12 (46.2%) |
| 60 to 64 Years | 10 (40.0%) | 0 (0.0%) |
| 65 to 74 Years | 6 (26.1%) | 0 (0.0%) |
| 75 Years and over | 0 (0.0%) | 0 (0.0%) |
| Total | 93 (54.4%) | 30 (32.3%) |
Employment Status by Educational Attainment in Dos Palos Y
According to labor force statistics for Dos Palos Y, 63.4% of individuals (71) out of the total population between 25 and 64 years of age (112) are in the labor force, with 28.2% or 20 of them being unemployed. The group with the highest labor force participation rate are those with the educational attainment of high school diploma, with 100.0% or 51 individuals in the labor force. Within the labor force, individuals with bachelor's degree or higher education have the highest percentage of unemployment, with 100.0% or 20 of them being unemployed.
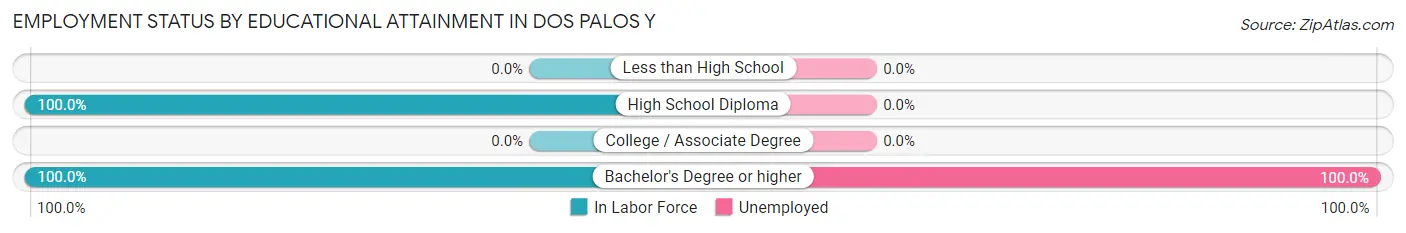
| Educational Attainment | In Labor Force | Unemployed |
| Less than High School | 0 (0.0%) | 0 (0.0%) |
| High School Diploma | 51 (100.0%) | 0 (0.0%) |
| College / Associate Degree | 0 (0.0%) | 0 (0.0%) |
| Bachelor's Degree or higher | 20 (100.0%) | 20 (100.0%) |
| Total | 71 (63.4%) | 32 (28.2%) |
Employment Occupations by Sex in Dos Palos Y
Management, Business, Science and Arts Occupations
The most common Management, Business, Science and Arts occupations in Dos Palos Y are , and Management (5 | 7.9%).
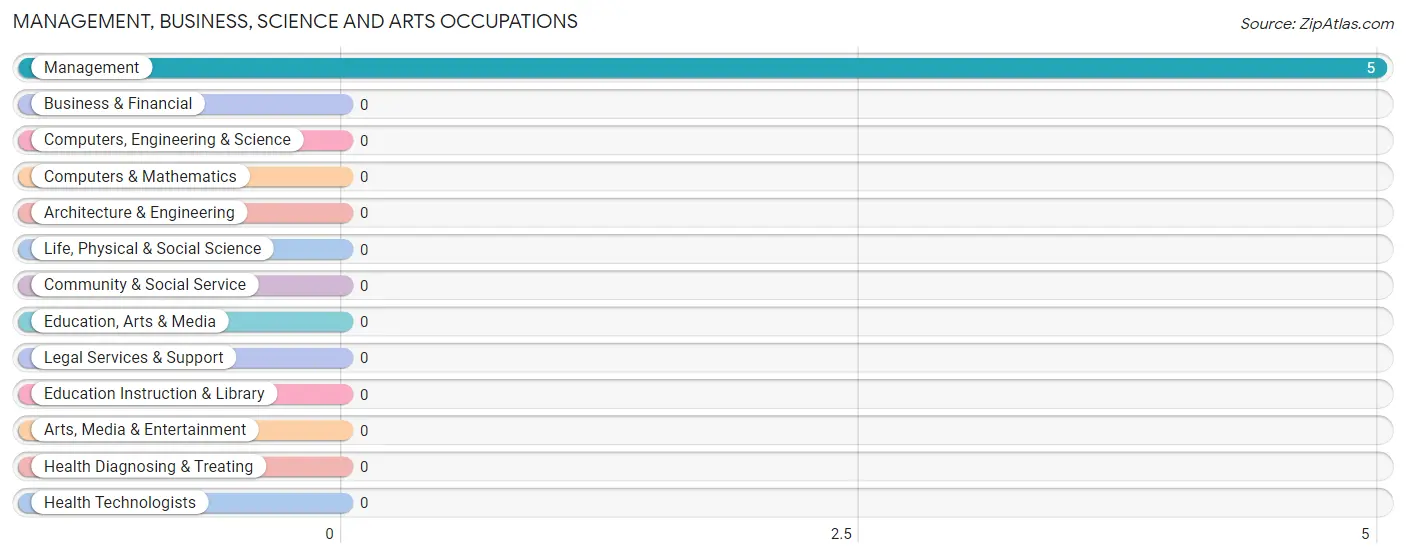
Management, Business, Science and Arts Occupations by Sex
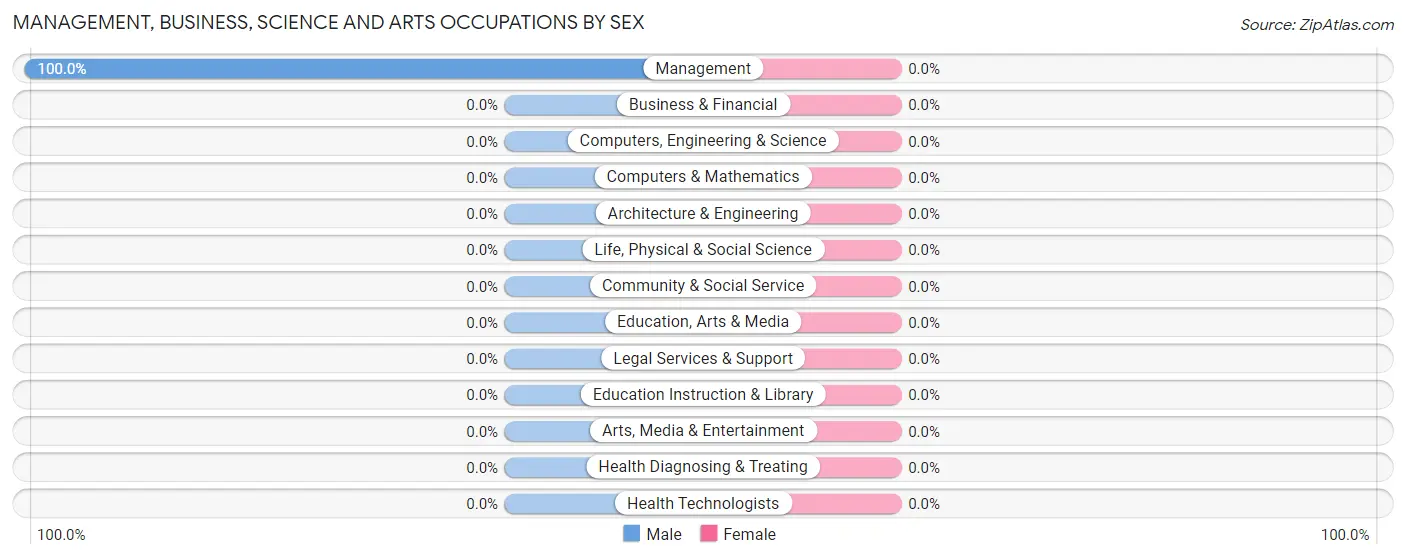
| Occupation | Male | Female |
| Management | 5 (100.0%) | 0 (0.0%) |
| Business & Financial | 0 (0.0%) | 0 (0.0%) |
| Computers, Engineering & Science | 0 (0.0%) | 0 (0.0%) |
| Computers & Mathematics | 0 (0.0%) | 0 (0.0%) |
| Architecture & Engineering | 0 (0.0%) | 0 (0.0%) |
| Life, Physical & Social Science | 0 (0.0%) | 0 (0.0%) |
| Community & Social Service | 0 (0.0%) | 0 (0.0%) |
| Education, Arts & Media | 0 (0.0%) | 0 (0.0%) |
| Legal Services & Support | 0 (0.0%) | 0 (0.0%) |
| Education Instruction & Library | 0 (0.0%) | 0 (0.0%) |
| Arts, Media & Entertainment | 0 (0.0%) | 0 (0.0%) |
| Health Diagnosing & Treating | 0 (0.0%) | 0 (0.0%) |
| Health Technologists | 0 (0.0%) | 0 (0.0%) |
| Total (Category) | 5 (100.0%) | 0 (0.0%) |
| Total (Overall) | 63 (100.0%) | 0 (0.0%) |
Services Occupations
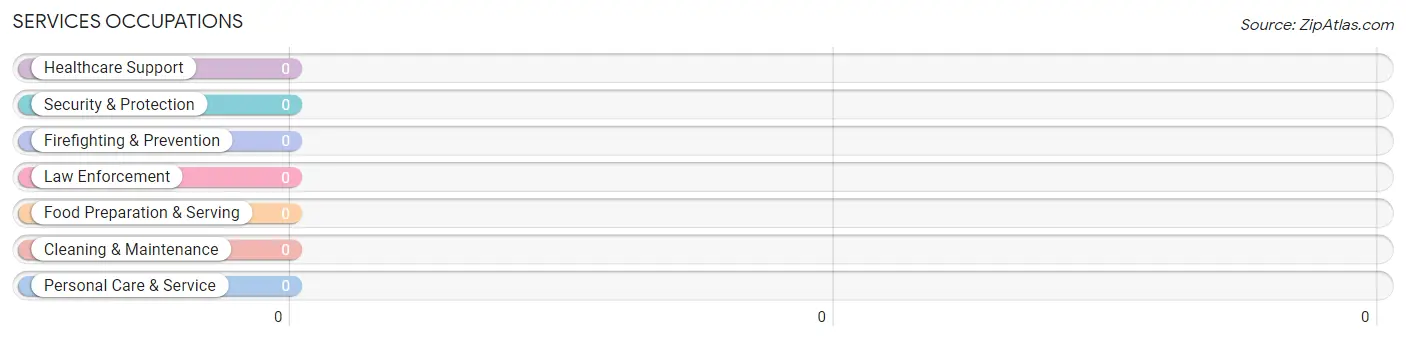
Services Occupations by Sex
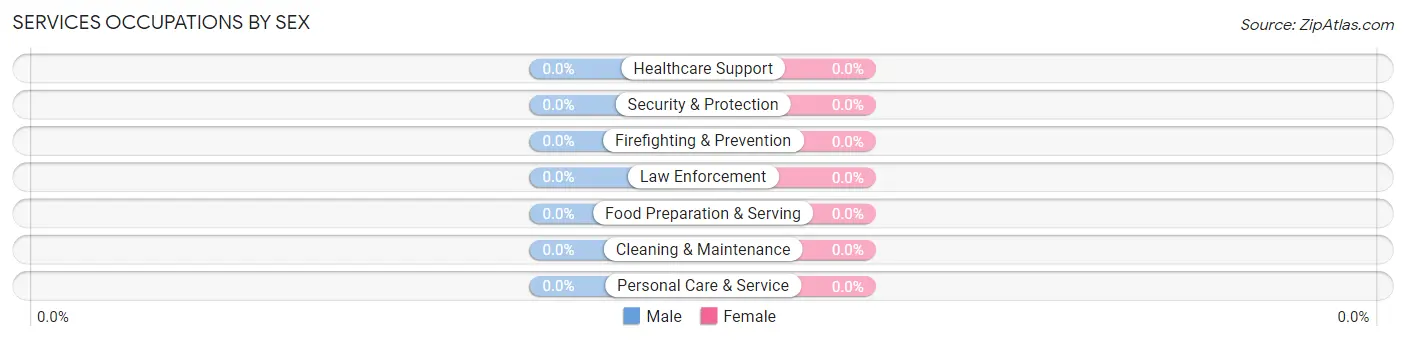
| Occupation | Male | Female |
| Healthcare Support | 0 (0.0%) | 0 (0.0%) |
| Security & Protection | 0 (0.0%) | 0 (0.0%) |
| Firefighting & Prevention | 0 (0.0%) | 0 (0.0%) |
| Law Enforcement | 0 (0.0%) | 0 (0.0%) |
| Food Preparation & Serving | 0 (0.0%) | 0 (0.0%) |
| Cleaning & Maintenance | 0 (0.0%) | 0 (0.0%) |
| Personal Care & Service | 0 (0.0%) | 0 (0.0%) |
| Total (Category) | 0 (0.0%) | 0 (0.0%) |
| Total (Overall) | 63 (100.0%) | 0 (0.0%) |
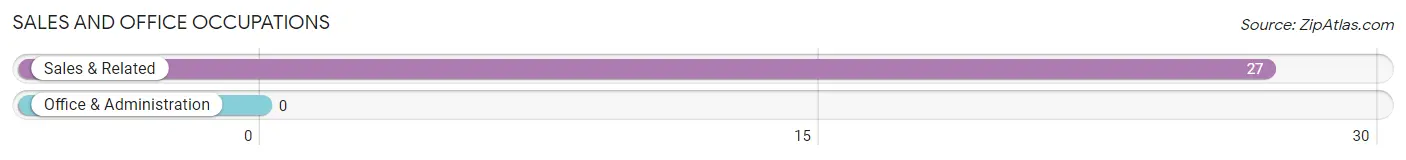
Sales and Office Occupations
The most common Sales and Office occupations in Dos Palos Y are , and Sales & Related (27 | 42.9%).
Sales and Office Occupations by Sex
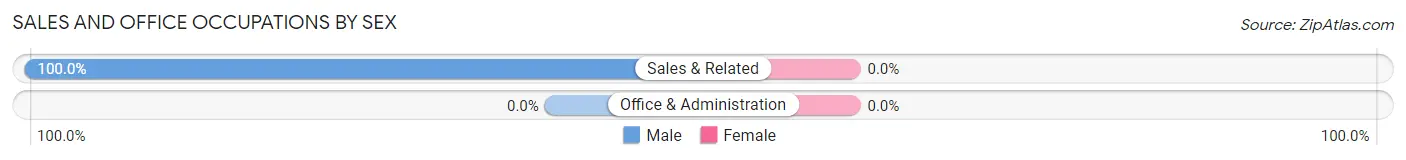
| Occupation | Male | Female |
| Sales & Related | 27 (100.0%) | 0 (0.0%) |
| Office & Administration | 0 (0.0%) | 0 (0.0%) |
| Total (Category) | 27 (100.0%) | 0 (0.0%) |
| Total (Overall) | 63 (100.0%) | 0 (0.0%) |
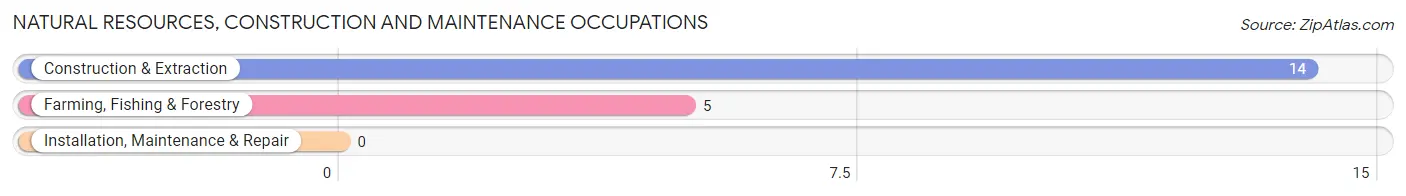
Natural Resources, Construction and Maintenance Occupations
The most common Natural Resources, Construction and Maintenance occupations in Dos Palos Y are Construction & Extraction (14 | 22.2%), and Farming, Fishing & Forestry (5 | 7.9%).
Natural Resources, Construction and Maintenance Occupations by Sex
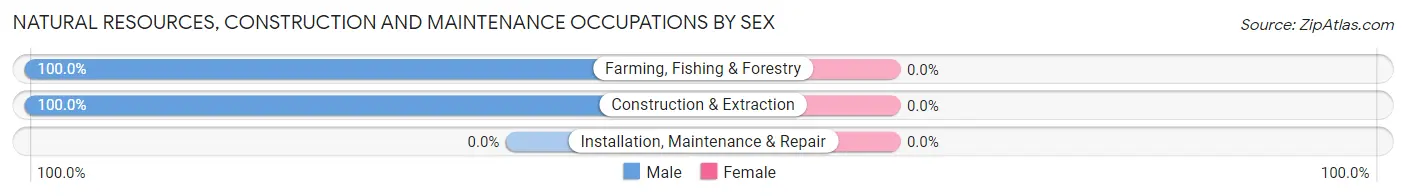
| Occupation | Male | Female |
| Farming, Fishing & Forestry | 5 (100.0%) | 0 (0.0%) |
| Construction & Extraction | 14 (100.0%) | 0 (0.0%) |
| Installation, Maintenance & Repair | 0 (0.0%) | 0 (0.0%) |
| Total (Category) | 19 (100.0%) | 0 (0.0%) |
| Total (Overall) | 63 (100.0%) | 0 (0.0%) |
Production, Transportation and Moving Occupations
The most common Production, Transportation and Moving occupations in Dos Palos Y are Production (6 | 9.5%), and Material Moving (6 | 9.5%).
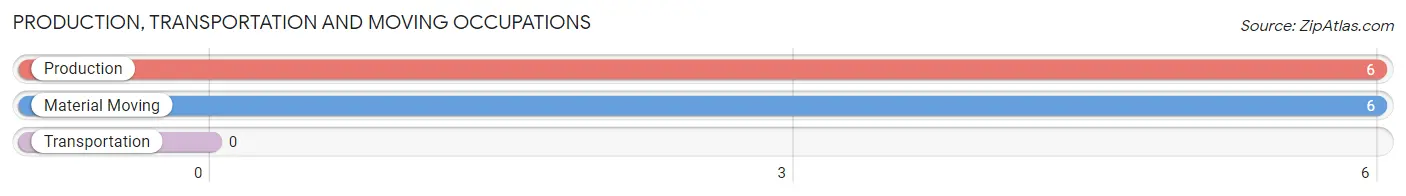
Production, Transportation and Moving Occupations by Sex
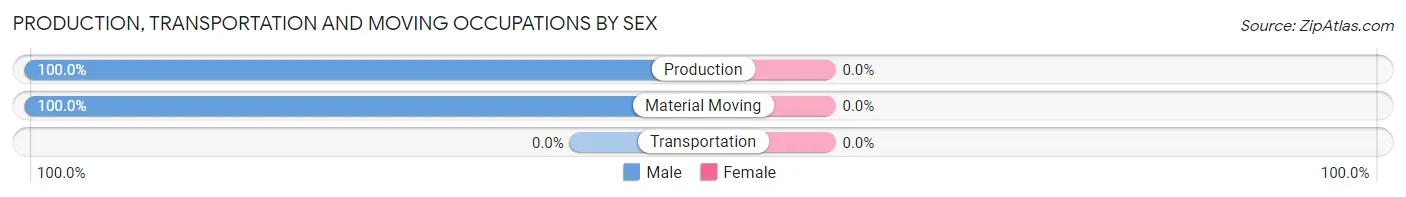
| Occupation | Male | Female |
| Production | 6 (100.0%) | 0 (0.0%) |
| Transportation | 0 (0.0%) | 0 (0.0%) |
| Material Moving | 6 (100.0%) | 0 (0.0%) |
| Total (Category) | 12 (100.0%) | 0 (0.0%) |
| Total (Overall) | 63 (100.0%) | 0 (0.0%) |
Employment Industries by Sex in Dos Palos Y
Employment Industries in Dos Palos Y
The major employment industries in Dos Palos Y include Manufacturing (27 | 42.9%), Construction (14 | 22.2%), Agriculture, Fishing & Hunting (10 | 15.9%), Transportation & Warehousing (6 | 9.5%), and Administrative & Support (6 | 9.5%).
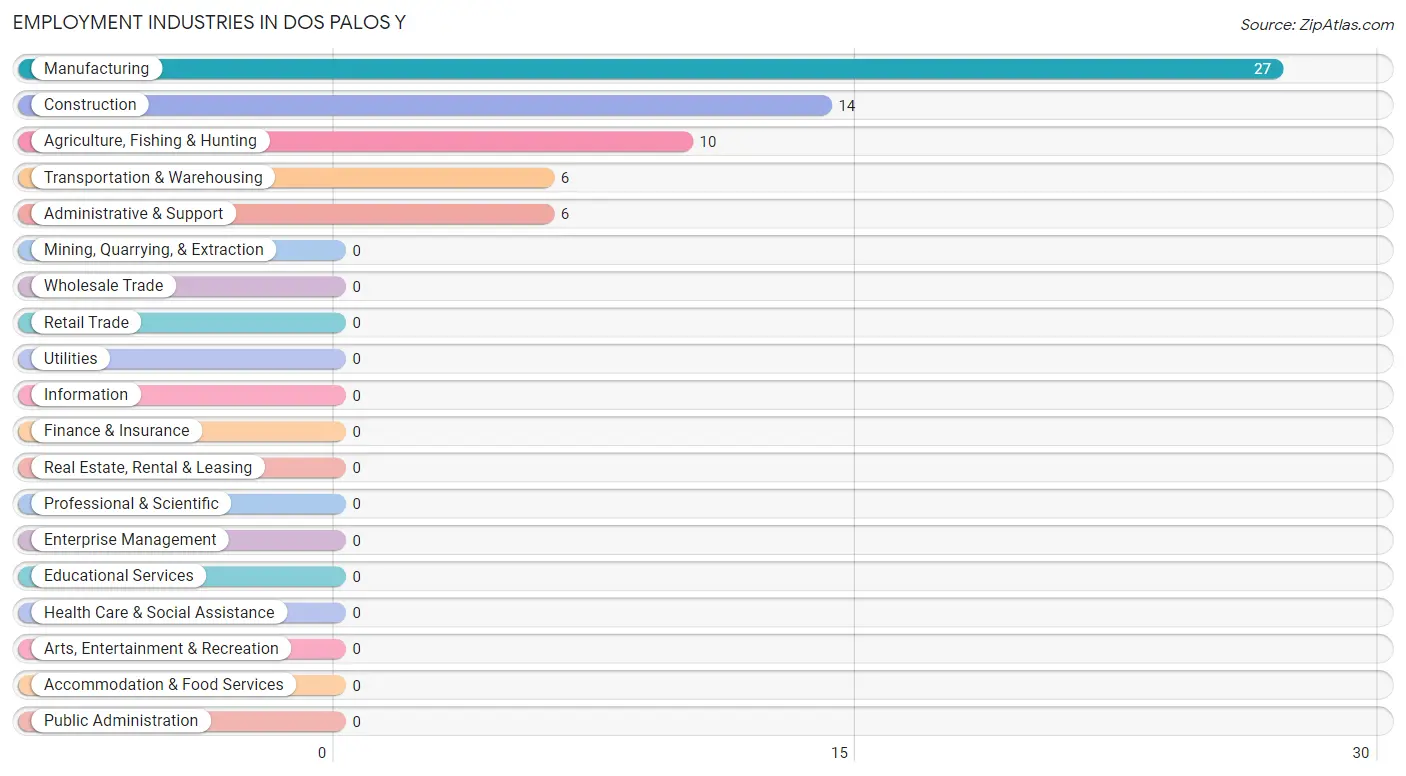
Employment Industries by Sex in Dos Palos Y
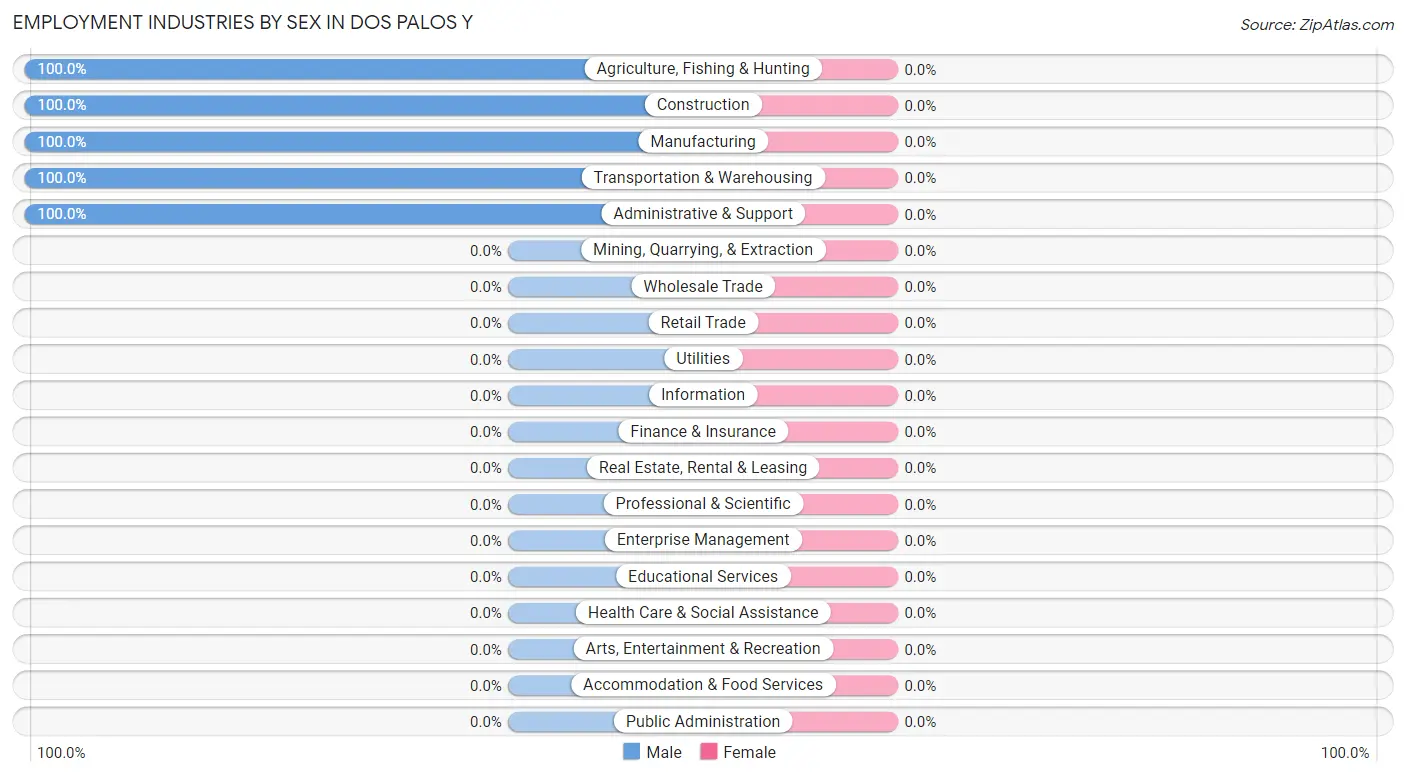
| Industry | Male | Female |
| Agriculture, Fishing & Hunting | 10 (100.0%) | 0 (0.0%) |
| Mining, Quarrying, & Extraction | 0 (0.0%) | 0 (0.0%) |
| Construction | 14 (100.0%) | 0 (0.0%) |
| Manufacturing | 27 (100.0%) | 0 (0.0%) |
| Wholesale Trade | 0 (0.0%) | 0 (0.0%) |
| Retail Trade | 0 (0.0%) | 0 (0.0%) |
| Transportation & Warehousing | 6 (100.0%) | 0 (0.0%) |
| Utilities | 0 (0.0%) | 0 (0.0%) |
| Information | 0 (0.0%) | 0 (0.0%) |
| Finance & Insurance | 0 (0.0%) | 0 (0.0%) |
| Real Estate, Rental & Leasing | 0 (0.0%) | 0 (0.0%) |
| Professional & Scientific | 0 (0.0%) | 0 (0.0%) |
| Enterprise Management | 0 (0.0%) | 0 (0.0%) |
| Administrative & Support | 6 (100.0%) | 0 (0.0%) |
| Educational Services | 0 (0.0%) | 0 (0.0%) |
| Health Care & Social Assistance | 0 (0.0%) | 0 (0.0%) |
| Arts, Entertainment & Recreation | 0 (0.0%) | 0 (0.0%) |
| Accommodation & Food Services | 0 (0.0%) | 0 (0.0%) |
| Public Administration | 0 (0.0%) | 0 (0.0%) |
| Total | 63 (100.0%) | 0 (0.0%) |
Education in Dos Palos Y
School Enrollment in Dos Palos Y
The most common levels of schooling among the 17 students in Dos Palos Y are high school (10 | 58.8%), and elementary school (7 | 41.2%).
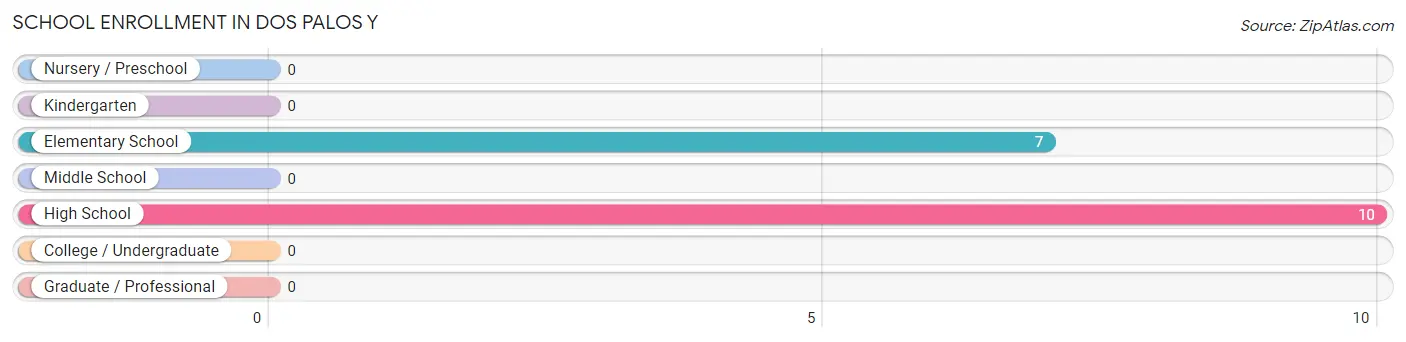
| School Level | # Students | % Students |
| Nursery / Preschool | 0 | 0.0% |
| Kindergarten | 0 | 0.0% |
| Elementary School | 7 | 41.2% |
| Middle School | 0 | 0.0% |
| High School | 10 | 58.8% |
| College / Undergraduate | 0 | 0.0% |
| Graduate / Professional | 0 | 0.0% |
| Total | 17 | 100.0% |
School Enrollment by Age by Funding Source in Dos Palos Y
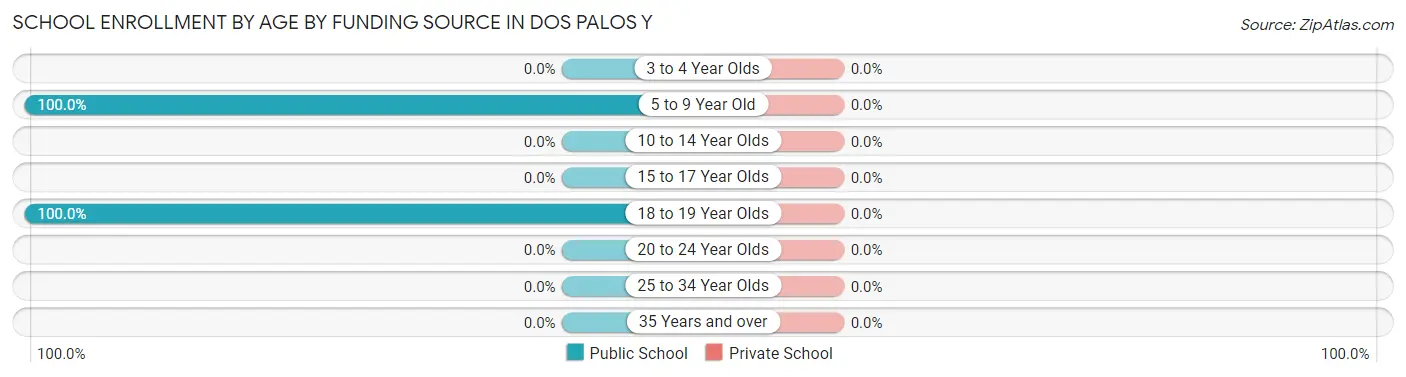
| Age Bracket | Public School | Private School |
| 3 to 4 Year Olds | 0 (0.0%) | 0 (0.0%) |
| 5 to 9 Year Old | 7 (100.0%) | 0 (0.0%) |
| 10 to 14 Year Olds | 0 (0.0%) | 0 (0.0%) |
| 15 to 17 Year Olds | 0 (0.0%) | 0 (0.0%) |
| 18 to 19 Year Olds | 10 (100.0%) | 0 (0.0%) |
| 20 to 24 Year Olds | 0 (0.0%) | 0 (0.0%) |
| 25 to 34 Year Olds | 0 (0.0%) | 0 (0.0%) |
| 35 Years and over | 0 (0.0%) | 0 (0.0%) |
| Total | 17 (100.0%) | 0 (0.0%) |
Educational Attainment by Field of Study in Dos Palos Y
Multidisciplinary studies (12 | 46.2%), liberal arts & history (8 | 30.8%), and education (6 | 23.1%) are the most common fields of study among 26 individuals in Dos Palos Y who have obtained a bachelor's degree or higher.
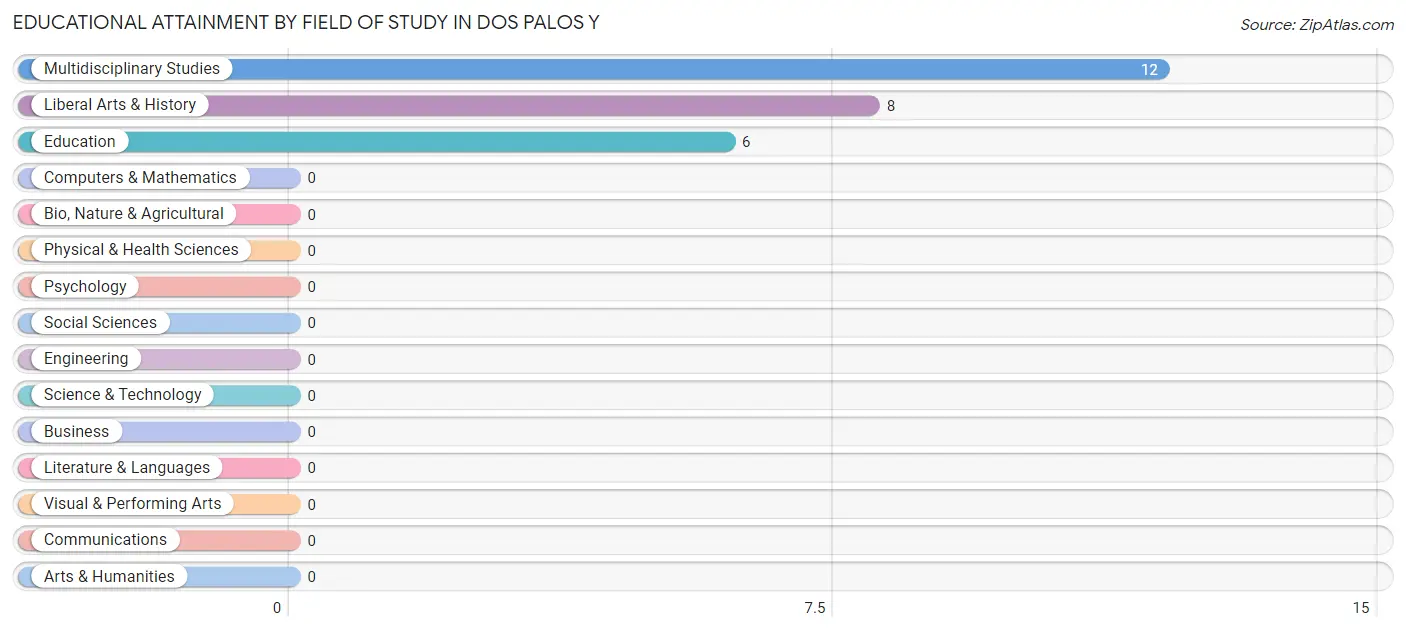
| Field of Study | # Graduates | % Graduates |
| Computers & Mathematics | 0 | 0.0% |
| Bio, Nature & Agricultural | 0 | 0.0% |
| Physical & Health Sciences | 0 | 0.0% |
| Psychology | 0 | 0.0% |
| Social Sciences | 0 | 0.0% |
| Engineering | 0 | 0.0% |
| Multidisciplinary Studies | 12 | 46.2% |
| Science & Technology | 0 | 0.0% |
| Business | 0 | 0.0% |
| Education | 6 | 23.1% |
| Literature & Languages | 0 | 0.0% |
| Liberal Arts & History | 8 | 30.8% |
| Visual & Performing Arts | 0 | 0.0% |
| Communications | 0 | 0.0% |
| Arts & Humanities | 0 | 0.0% |
| Total | 26 | 100.0% |
Transportation & Commute in Dos Palos Y
Vehicle Availability by Sex in Dos Palos Y
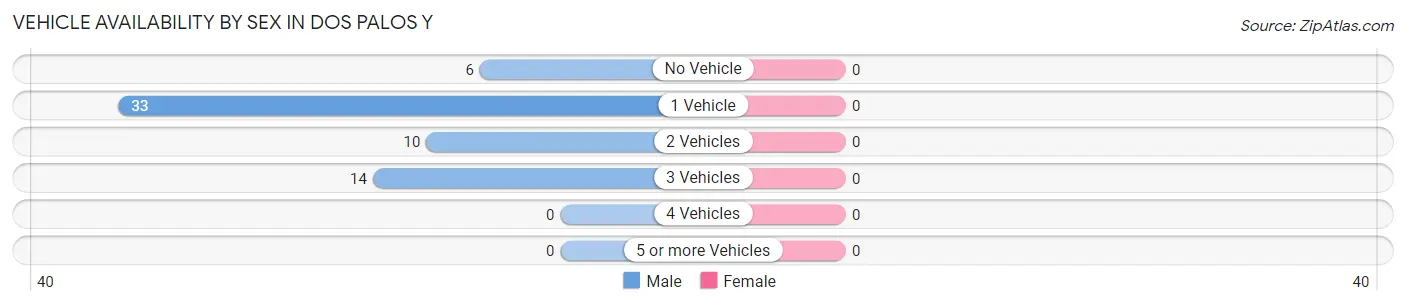
| Vehicles Available | Male | Female |
| No Vehicle | 6 (9.5%) | 0 (0.0%) |
| 1 Vehicle | 33 (52.4%) | 0 (0.0%) |
| 2 Vehicles | 10 (15.9%) | 0 (0.0%) |
| 3 Vehicles | 14 (22.2%) | 0 (0.0%) |
| 4 Vehicles | 0 (0.0%) | 0 (0.0%) |
| 5 or more Vehicles | 0 (0.0%) | 0 (0.0%) |
| Total | 63 (100.0%) | 0 (0.0%) |
Commute Time in Dos Palos Y
The most frequently occuring commute durations in Dos Palos Y are 20 to 24 minutes (33 commuters, 52.4%), 10 to 14 minutes (14 commuters, 22.2%), and 5 to 9 minutes (11 commuters, 17.5%).
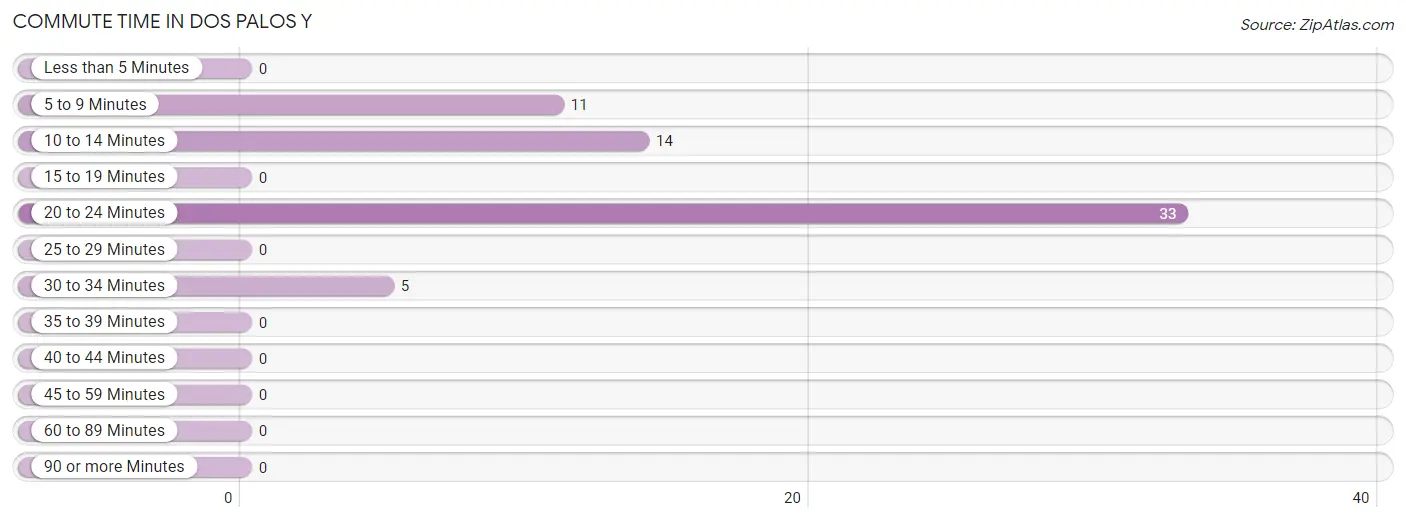
| Commute Time | # Commuters | % Commuters |
| Less than 5 Minutes | 0 | 0.0% |
| 5 to 9 Minutes | 11 | 17.5% |
| 10 to 14 Minutes | 14 | 22.2% |
| 15 to 19 Minutes | 0 | 0.0% |
| 20 to 24 Minutes | 33 | 52.4% |
| 25 to 29 Minutes | 0 | 0.0% |
| 30 to 34 Minutes | 5 | 7.9% |
| 35 to 39 Minutes | 0 | 0.0% |
| 40 to 44 Minutes | 0 | 0.0% |
| 45 to 59 Minutes | 0 | 0.0% |
| 60 to 89 Minutes | 0 | 0.0% |
| 90 or more Minutes | 0 | 0.0% |
Commute Time by Sex in Dos Palos Y
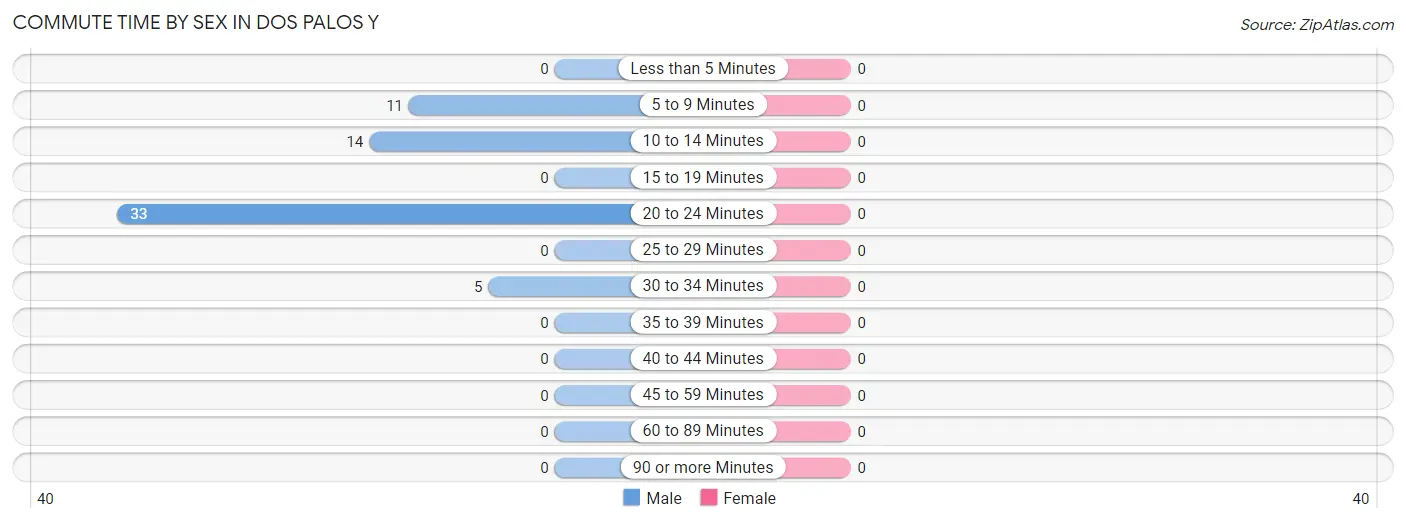
| Commute Time | Male | Female |
| Less than 5 Minutes | 0 (0.0%) | 0 (0.0%) |
| 5 to 9 Minutes | 11 (17.5%) | 0 (0.0%) |
| 10 to 14 Minutes | 14 (22.2%) | 0 (0.0%) |
| 15 to 19 Minutes | 0 (0.0%) | 0 (0.0%) |
| 20 to 24 Minutes | 33 (52.4%) | 0 (0.0%) |
| 25 to 29 Minutes | 0 (0.0%) | 0 (0.0%) |
| 30 to 34 Minutes | 5 (7.9%) | 0 (0.0%) |
| 35 to 39 Minutes | 0 (0.0%) | 0 (0.0%) |
| 40 to 44 Minutes | 0 (0.0%) | 0 (0.0%) |
| 45 to 59 Minutes | 0 (0.0%) | 0 (0.0%) |
| 60 to 89 Minutes | 0 (0.0%) | 0 (0.0%) |
| 90 or more Minutes | 0 (0.0%) | 0 (0.0%) |
Time of Departure to Work by Sex in Dos Palos Y
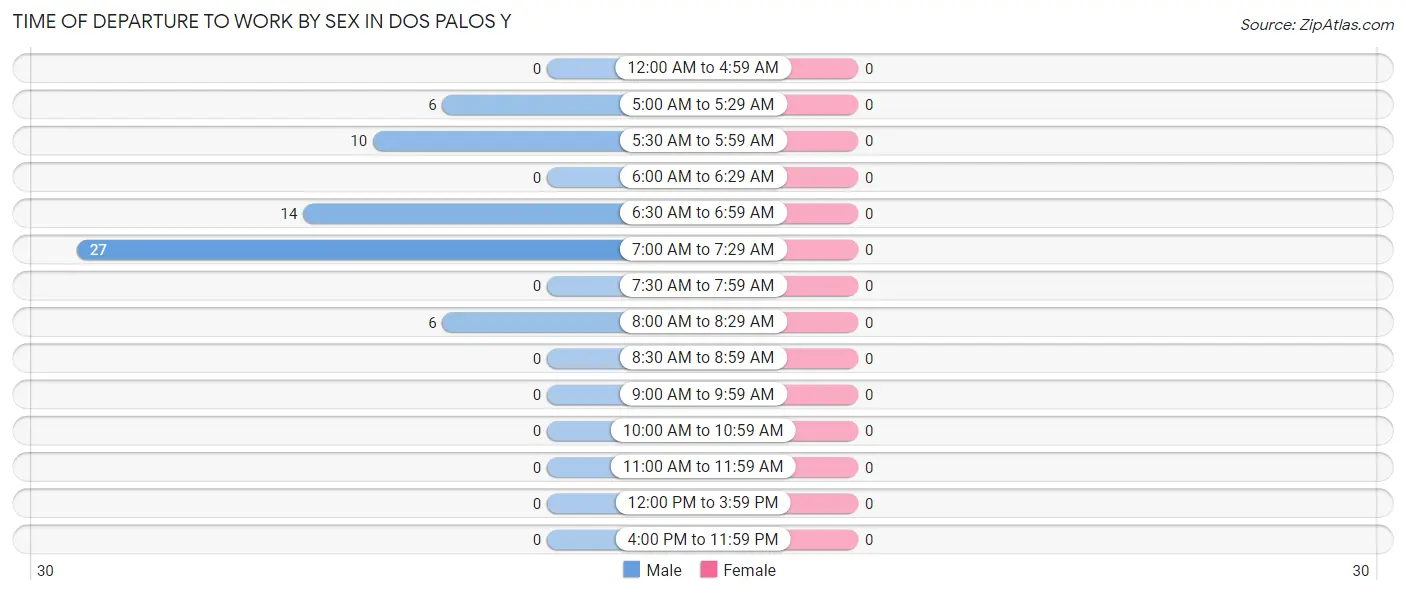
| Time of Departure | Male | Female |
| 12:00 AM to 4:59 AM | 0 (0.0%) | 0 (0.0%) |
| 5:00 AM to 5:29 AM | 6 (9.5%) | 0 (0.0%) |
| 5:30 AM to 5:59 AM | 10 (15.9%) | 0 (0.0%) |
| 6:00 AM to 6:29 AM | 0 (0.0%) | 0 (0.0%) |
| 6:30 AM to 6:59 AM | 14 (22.2%) | 0 (0.0%) |
| 7:00 AM to 7:29 AM | 27 (42.9%) | 0 (0.0%) |
| 7:30 AM to 7:59 AM | 0 (0.0%) | 0 (0.0%) |
| 8:00 AM to 8:29 AM | 6 (9.5%) | 0 (0.0%) |
| 8:30 AM to 8:59 AM | 0 (0.0%) | 0 (0.0%) |
| 9:00 AM to 9:59 AM | 0 (0.0%) | 0 (0.0%) |
| 10:00 AM to 10:59 AM | 0 (0.0%) | 0 (0.0%) |
| 11:00 AM to 11:59 AM | 0 (0.0%) | 0 (0.0%) |
| 12:00 PM to 3:59 PM | 0 (0.0%) | 0 (0.0%) |
| 4:00 PM to 11:59 PM | 0 (0.0%) | 0 (0.0%) |
| Total | 63 (100.0%) | 0 (0.0%) |
Housing Occupancy in Dos Palos Y
Occupancy by Ownership in Dos Palos Y
Of the total 98 dwellings in Dos Palos Y, owner-occupied units account for 28 (28.6%), while renter-occupied units make up 70 (71.4%).
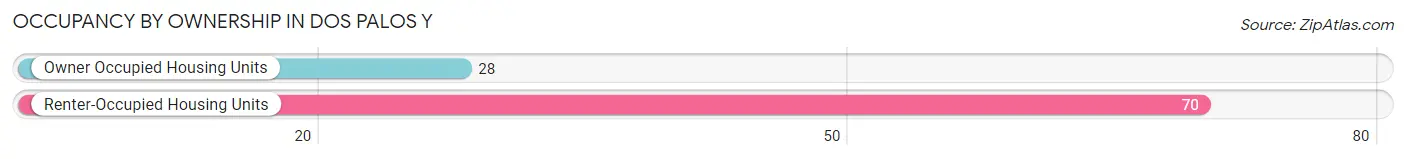
| Occupancy | # Housing Units | % Housing Units |
| Owner Occupied Housing Units | 28 | 28.6% |
| Renter-Occupied Housing Units | 70 | 71.4% |
| Total Occupied Housing Units | 98 | 100.0% |
Occupancy by Household Size in Dos Palos Y
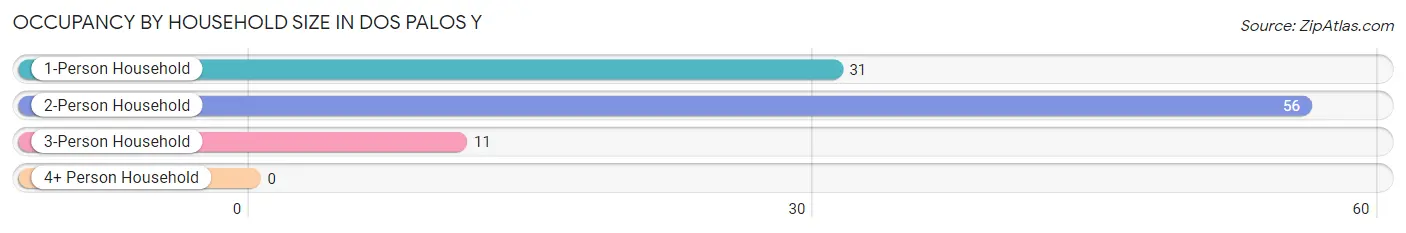
| Household Size | # Housing Units | % Housing Units |
| 1-Person Household | 31 | 31.6% |
| 2-Person Household | 56 | 57.1% |
| 3-Person Household | 11 | 11.2% |
| 4+ Person Household | 0 | 0.0% |
| Total Housing Units | 98 | 100.0% |
Occupancy by Ownership by Household Size in Dos Palos Y
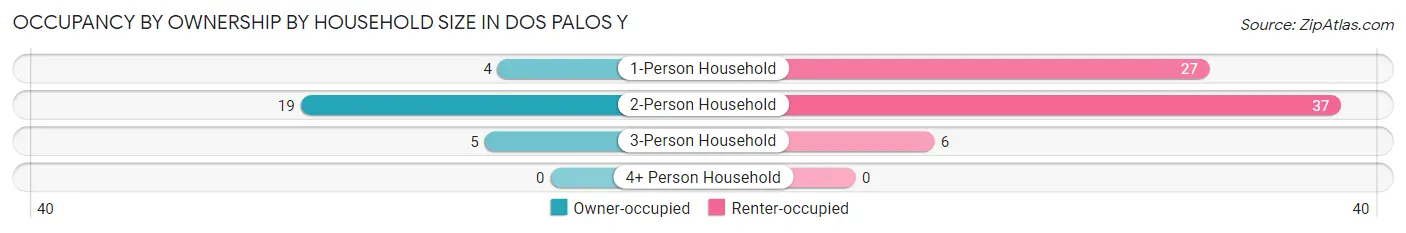
| Household Size | Owner-occupied | Renter-occupied |
| 1-Person Household | 4 (12.9%) | 27 (87.1%) |
| 2-Person Household | 19 (33.9%) | 37 (66.1%) |
| 3-Person Household | 5 (45.5%) | 6 (54.5%) |
| 4+ Person Household | 0 (0.0%) | 0 (0.0%) |
| Total Housing Units | 28 (28.6%) | 70 (71.4%) |
Occupancy by Educational Attainment in Dos Palos Y
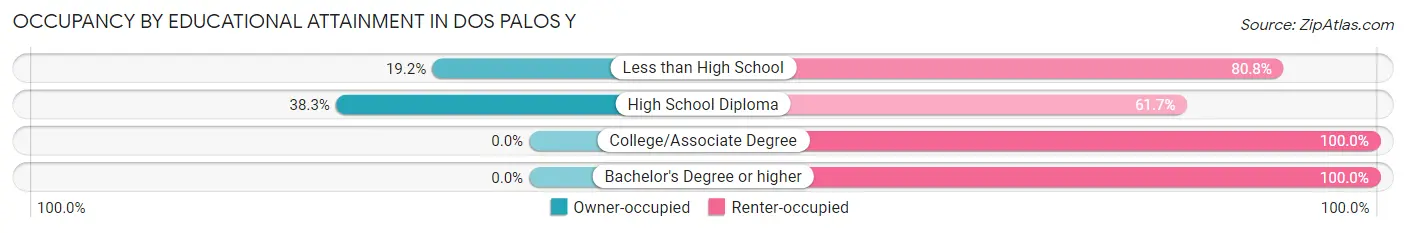
| Household Size | Owner-occupied | Renter-occupied |
| Less than High School | 5 (19.2%) | 21 (80.8%) |
| High School Diploma | 23 (38.3%) | 37 (61.7%) |
| College/Associate Degree | 0 (0.0%) | 6 (100.0%) |
| Bachelor's Degree or higher | 0 (0.0%) | 6 (100.0%) |
Occupancy by Age of Householder in Dos Palos Y
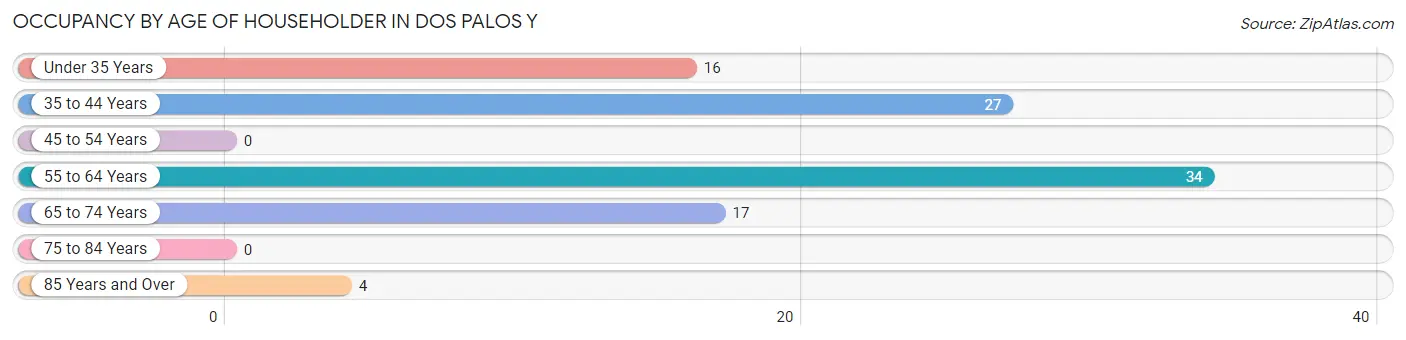
| Age Bracket | # Households | % Households |
| Under 35 Years | 16 | 16.3% |
| 35 to 44 Years | 27 | 27.6% |
| 45 to 54 Years | 0 | 0.0% |
| 55 to 64 Years | 34 | 34.7% |
| 65 to 74 Years | 17 | 17.3% |
| 75 to 84 Years | 0 | 0.0% |
| 85 Years and Over | 4 | 4.1% |
| Total | 98 | 100.0% |
Housing Finances in Dos Palos Y
Median Income by Occupancy in Dos Palos Y
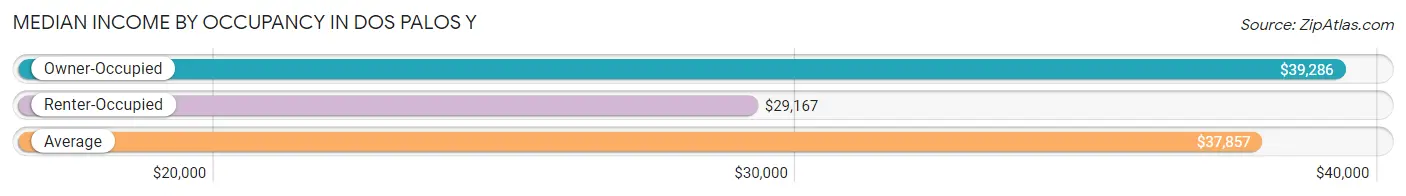
| Occupancy Type | # Households | Median Income |
| Owner-Occupied | 28 (28.6%) | $39,286 |
| Renter-Occupied | 70 (71.4%) | $29,167 |
| Average | 98 (100.0%) | $37,857 |
Occupancy by Householder Income Bracket in Dos Palos Y
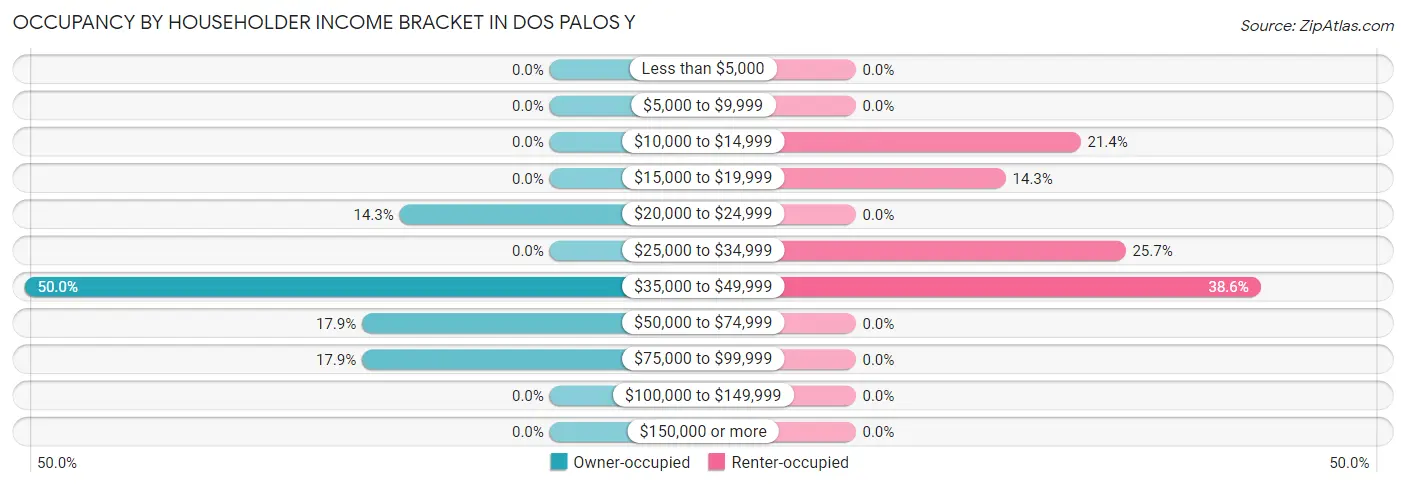
| Income Bracket | Owner-occupied | Renter-occupied |
| Less than $5,000 | 0 (0.0%) | 0 (0.0%) |
| $5,000 to $9,999 | 0 (0.0%) | 0 (0.0%) |
| $10,000 to $14,999 | 0 (0.0%) | 15 (21.4%) |
| $15,000 to $19,999 | 0 (0.0%) | 10 (14.3%) |
| $20,000 to $24,999 | 4 (14.3%) | 0 (0.0%) |
| $25,000 to $34,999 | 0 (0.0%) | 18 (25.7%) |
| $35,000 to $49,999 | 14 (50.0%) | 27 (38.6%) |
| $50,000 to $74,999 | 5 (17.9%) | 0 (0.0%) |
| $75,000 to $99,999 | 5 (17.9%) | 0 (0.0%) |
| $100,000 to $149,999 | 0 (0.0%) | 0 (0.0%) |
| $150,000 or more | 0 (0.0%) | 0 (0.0%) |
| Total | 28 (100.0%) | 70 (100.0%) |
Monthly Housing Cost Tiers in Dos Palos Y
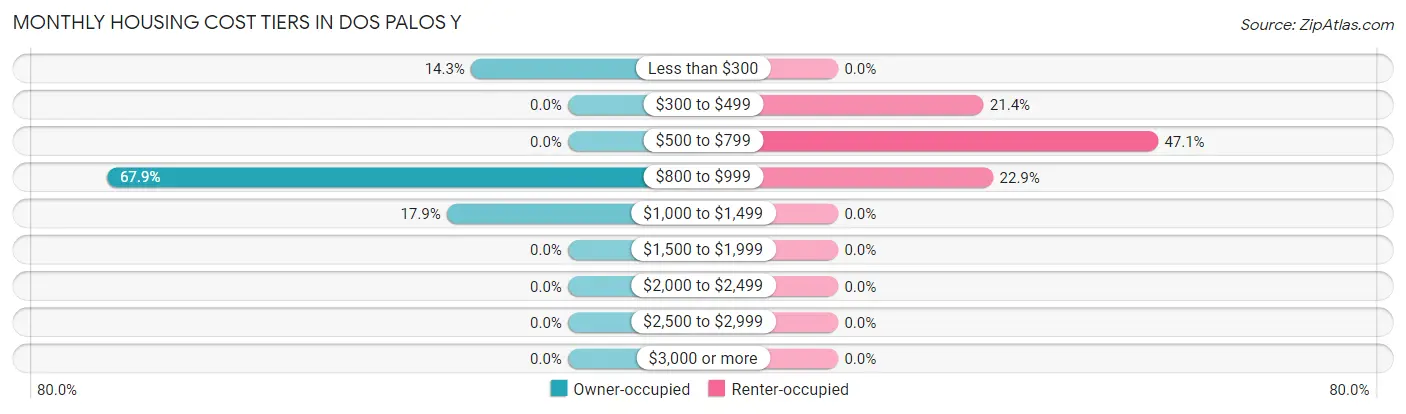
| Monthly Cost | Owner-occupied | Renter-occupied |
| Less than $300 | 4 (14.3%) | 0 (0.0%) |
| $300 to $499 | 0 (0.0%) | 15 (21.4%) |
| $500 to $799 | 0 (0.0%) | 33 (47.1%) |
| $800 to $999 | 19 (67.9%) | 16 (22.9%) |
| $1,000 to $1,499 | 5 (17.9%) | 0 (0.0%) |
| $1,500 to $1,999 | 0 (0.0%) | 0 (0.0%) |
| $2,000 to $2,499 | 0 (0.0%) | 0 (0.0%) |
| $2,500 to $2,999 | 0 (0.0%) | 0 (0.0%) |
| $3,000 or more | 0 (0.0%) | 0 (0.0%) |
| Total | 28 (100.0%) | 70 (100.0%) |
Physical Housing Characteristics in Dos Palos Y
Housing Structures in Dos Palos Y
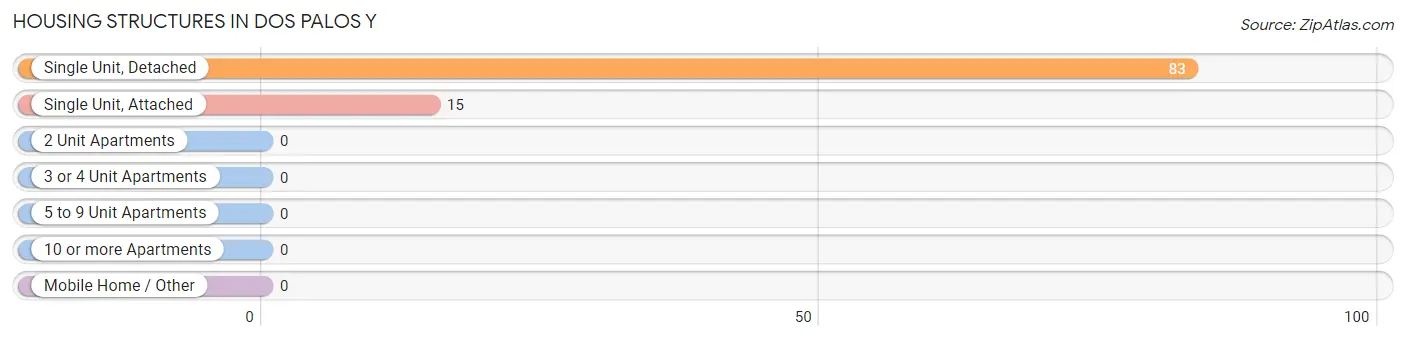
| Structure Type | # Housing Units | % Housing Units |
| Single Unit, Detached | 83 | 84.7% |
| Single Unit, Attached | 15 | 15.3% |
| 2 Unit Apartments | 0 | 0.0% |
| 3 or 4 Unit Apartments | 0 | 0.0% |
| 5 to 9 Unit Apartments | 0 | 0.0% |
| 10 or more Apartments | 0 | 0.0% |
| Mobile Home / Other | 0 | 0.0% |
| Total | 98 | 100.0% |
Housing Structures by Occupancy in Dos Palos Y
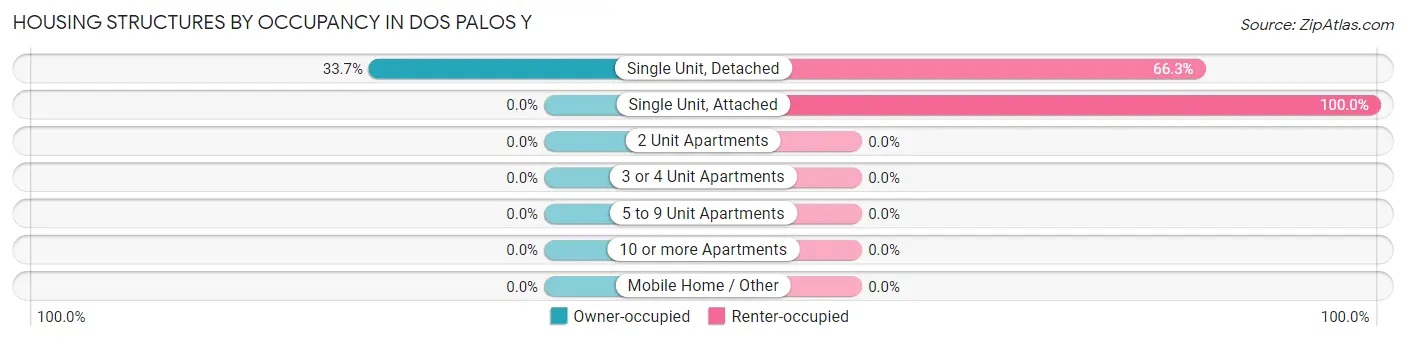
| Structure Type | Owner-occupied | Renter-occupied |
| Single Unit, Detached | 28 (33.7%) | 55 (66.3%) |
| Single Unit, Attached | 0 (0.0%) | 15 (100.0%) |
| 2 Unit Apartments | 0 (0.0%) | 0 (0.0%) |
| 3 or 4 Unit Apartments | 0 (0.0%) | 0 (0.0%) |
| 5 to 9 Unit Apartments | 0 (0.0%) | 0 (0.0%) |
| 10 or more Apartments | 0 (0.0%) | 0 (0.0%) |
| Mobile Home / Other | 0 (0.0%) | 0 (0.0%) |
| Total | 28 (28.6%) | 70 (71.4%) |
Housing Structures by Number of Rooms in Dos Palos Y
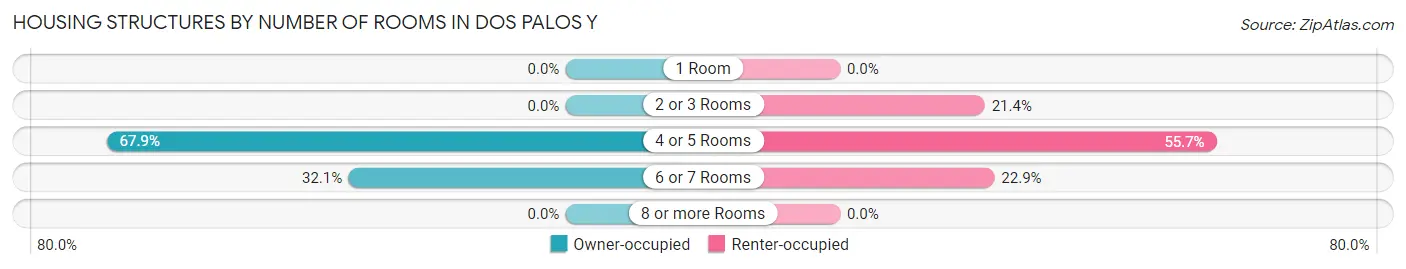
| Number of Rooms | Owner-occupied | Renter-occupied |
| 1 Room | 0 (0.0%) | 0 (0.0%) |
| 2 or 3 Rooms | 0 (0.0%) | 15 (21.4%) |
| 4 or 5 Rooms | 19 (67.9%) | 39 (55.7%) |
| 6 or 7 Rooms | 9 (32.1%) | 16 (22.9%) |
| 8 or more Rooms | 0 (0.0%) | 0 (0.0%) |
| Total | 28 (100.0%) | 70 (100.0%) |
Housing Structure by Heating Type in Dos Palos Y
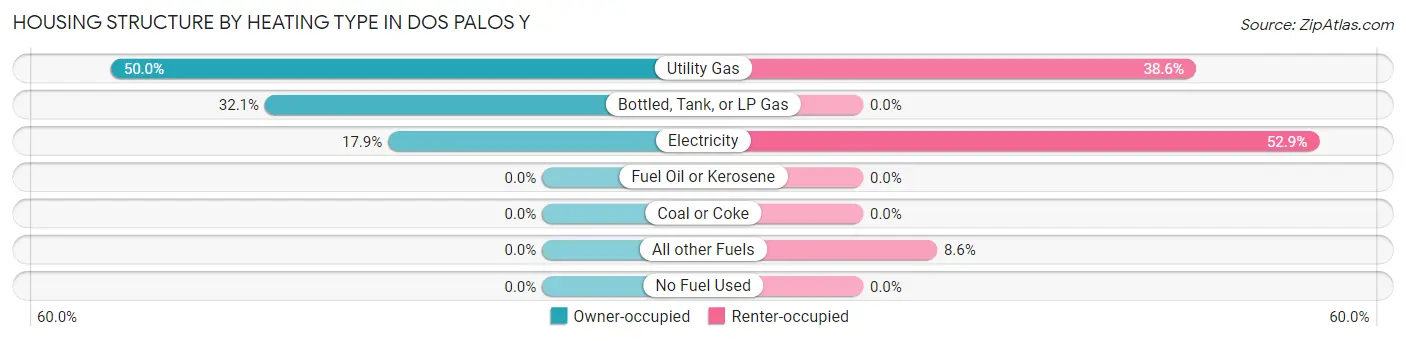
| Heating Type | Owner-occupied | Renter-occupied |
| Utility Gas | 14 (50.0%) | 27 (38.6%) |
| Bottled, Tank, or LP Gas | 9 (32.1%) | 0 (0.0%) |
| Electricity | 5 (17.9%) | 37 (52.9%) |
| Fuel Oil or Kerosene | 0 (0.0%) | 0 (0.0%) |
| Coal or Coke | 0 (0.0%) | 0 (0.0%) |
| All other Fuels | 0 (0.0%) | 6 (8.6%) |
| No Fuel Used | 0 (0.0%) | 0 (0.0%) |
| Total | 28 (100.0%) | 70 (100.0%) |
Household Vehicle Usage in Dos Palos Y
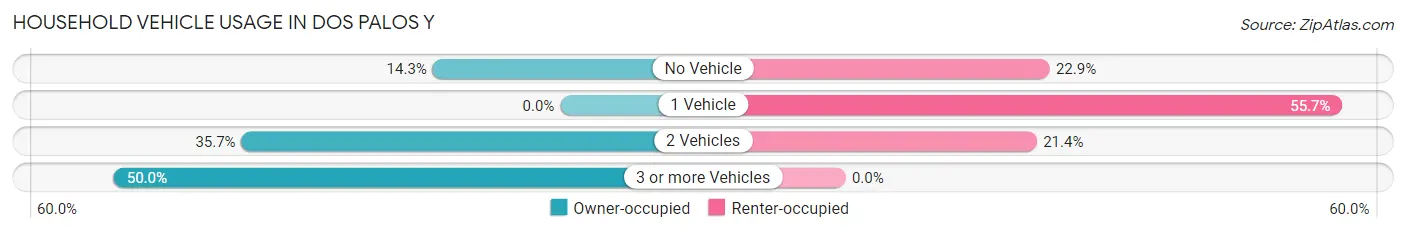
| Vehicles per Household | Owner-occupied | Renter-occupied |
| No Vehicle | 4 (14.3%) | 16 (22.9%) |
| 1 Vehicle | 0 (0.0%) | 39 (55.7%) |
| 2 Vehicles | 10 (35.7%) | 15 (21.4%) |
| 3 or more Vehicles | 14 (50.0%) | 0 (0.0%) |
| Total | 28 (100.0%) | 70 (100.0%) |
Real Estate & Mortgages in Dos Palos Y
Real Estate and Mortgage Overview in Dos Palos Y
| Characteristic | Without Mortgage | With Mortgage |
| Housing Units | 9 | 19 |
| Median Property Value | - | - |
| Median Household Income | - | - |
| Monthly Housing Costs | - | - |
| Real Estate Taxes | - | - |
Property Value by Mortgage Status in Dos Palos Y
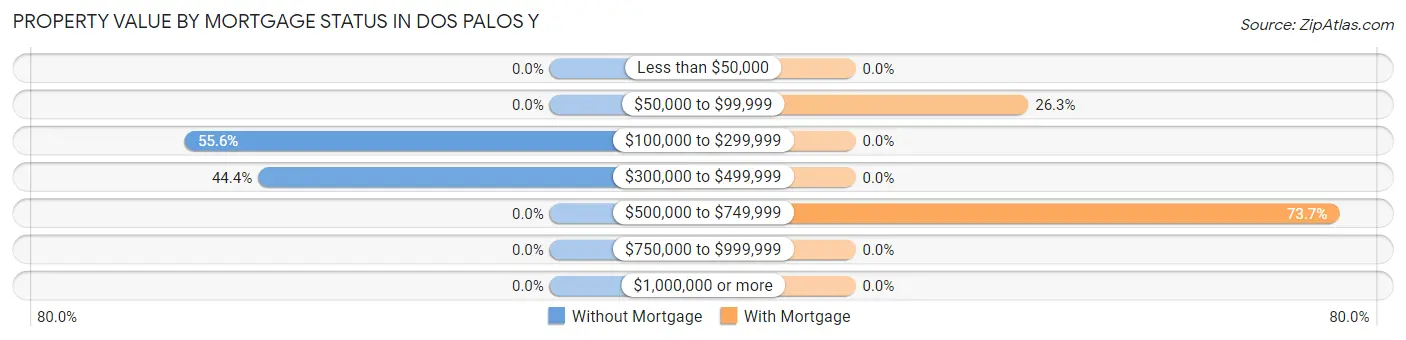
| Property Value | Without Mortgage | With Mortgage |
| Less than $50,000 | 0 (0.0%) | 0 (0.0%) |
| $50,000 to $99,999 | 0 (0.0%) | 5 (26.3%) |
| $100,000 to $299,999 | 5 (55.6%) | 0 (0.0%) |
| $300,000 to $499,999 | 4 (44.4%) | 0 (0.0%) |
| $500,000 to $749,999 | 0 (0.0%) | 14 (73.7%) |
| $750,000 to $999,999 | 0 (0.0%) | 0 (0.0%) |
| $1,000,000 or more | 0 (0.0%) | 0 (0.0%) |
| Total | 9 (100.0%) | 19 (100.0%) |
Household Income by Mortgage Status in Dos Palos Y
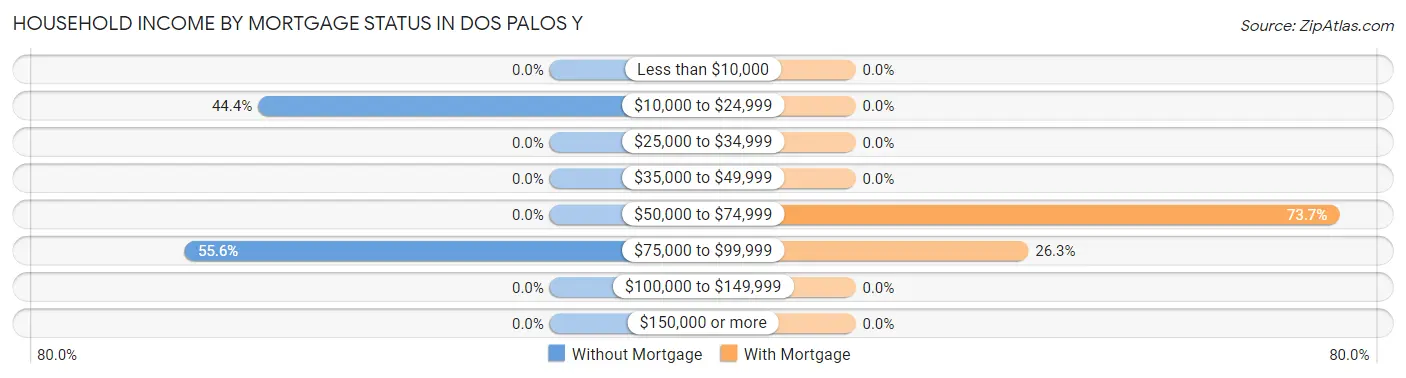
| Household Income | Without Mortgage | With Mortgage |
| Less than $10,000 | 0 (0.0%) | 0 (0.0%) |
| $10,000 to $24,999 | 4 (44.4%) | 0 (0.0%) |
| $25,000 to $34,999 | 0 (0.0%) | 0 (0.0%) |
| $35,000 to $49,999 | 0 (0.0%) | 0 (0.0%) |
| $50,000 to $74,999 | 0 (0.0%) | 14 (73.7%) |
| $75,000 to $99,999 | 5 (55.6%) | 5 (26.3%) |
| $100,000 to $149,999 | 0 (0.0%) | 0 (0.0%) |
| $150,000 or more | 0 (0.0%) | 0 (0.0%) |
| Total | 9 (100.0%) | 19 (100.0%) |
Property Value to Household Income Ratio in Dos Palos Y
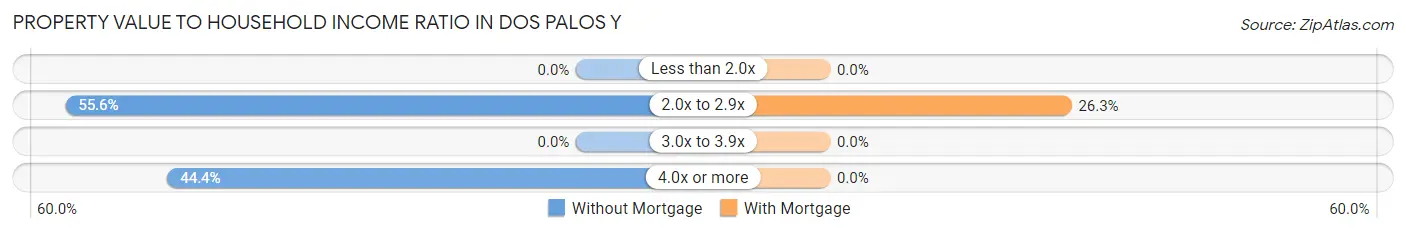
| Value-to-Income Ratio | Without Mortgage | With Mortgage |
| Less than 2.0x | 0 (0.0%) | 0 (0.0%) |
| 2.0x to 2.9x | 5 (55.6%) | 5 (26.3%) |
| 3.0x to 3.9x | 0 (0.0%) | 0 (0.0%) |
| 4.0x or more | 4 (44.4%) | 0 (0.0%) |
| Total | 9 (100.0%) | 19 (100.0%) |
Real Estate Taxes by Mortgage Status in Dos Palos Y
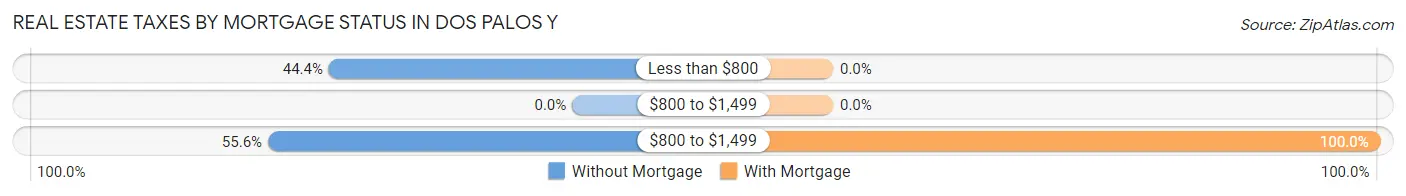
| Property Taxes | Without Mortgage | With Mortgage |
| Less than $800 | 4 (44.4%) | 0 (0.0%) |
| $800 to $1,499 | 0 (0.0%) | 0 (0.0%) |
| $800 to $1,499 | 5 (55.6%) | 19 (100.0%) |
| Total | 9 (100.0%) | 19 (100.0%) |
Health & Disability in Dos Palos Y
Health Insurance Coverage by Age in Dos Palos Y
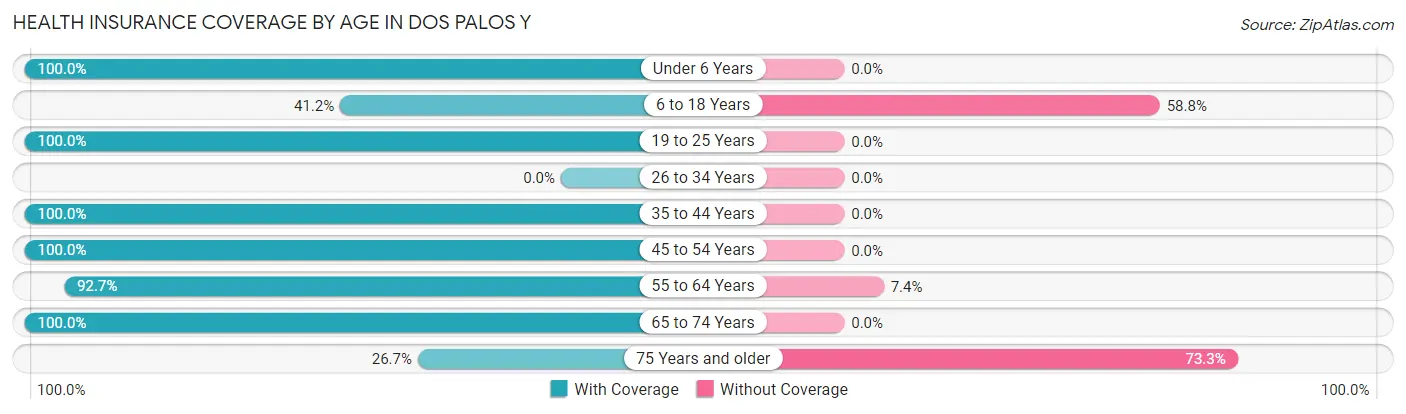
| Age Bracket | With Coverage | Without Coverage |
| Under 6 Years | 7 (100.0%) | 0 (0.0%) |
| 6 to 18 Years | 7 (41.2%) | 10 (58.8%) |
| 19 to 25 Years | 11 (100.0%) | 0 (0.0%) |
| 26 to 34 Years | 0 (0.0%) | 0 (0.0%) |
| 35 to 44 Years | 27 (100.0%) | 0 (0.0%) |
| 45 to 54 Years | 17 (100.0%) | 0 (0.0%) |
| 55 to 64 Years | 63 (92.6%) | 5 (7.3%) |
| 65 to 74 Years | 23 (100.0%) | 0 (0.0%) |
| 75 Years and older | 4 (26.7%) | 11 (73.3%) |
| Total | 159 (86.0%) | 26 (14.1%) |
Health Insurance Coverage by Citizenship Status in Dos Palos Y
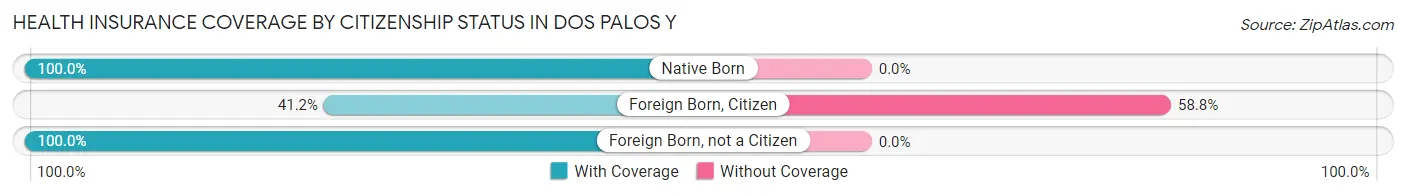
| Citizenship Status | With Coverage | Without Coverage |
| Native Born | 7 (100.0%) | 0 (0.0%) |
| Foreign Born, Citizen | 7 (41.2%) | 10 (58.8%) |
| Foreign Born, not a Citizen | 11 (100.0%) | 0 (0.0%) |
Health Insurance Coverage by Household Income in Dos Palos Y
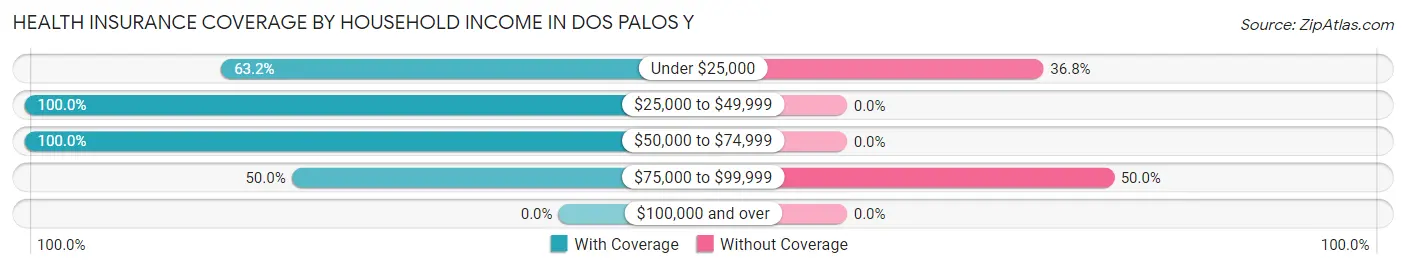
| Household Income | With Coverage | Without Coverage |
| Under $25,000 | 36 (63.2%) | 21 (36.8%) |
| $25,000 to $49,999 | 97 (100.0%) | 0 (0.0%) |
| $50,000 to $74,999 | 21 (100.0%) | 0 (0.0%) |
| $75,000 to $99,999 | 5 (50.0%) | 5 (50.0%) |
| $100,000 and over | 0 (0.0%) | 0 (0.0%) |
Public vs Private Health Insurance Coverage by Age in Dos Palos Y
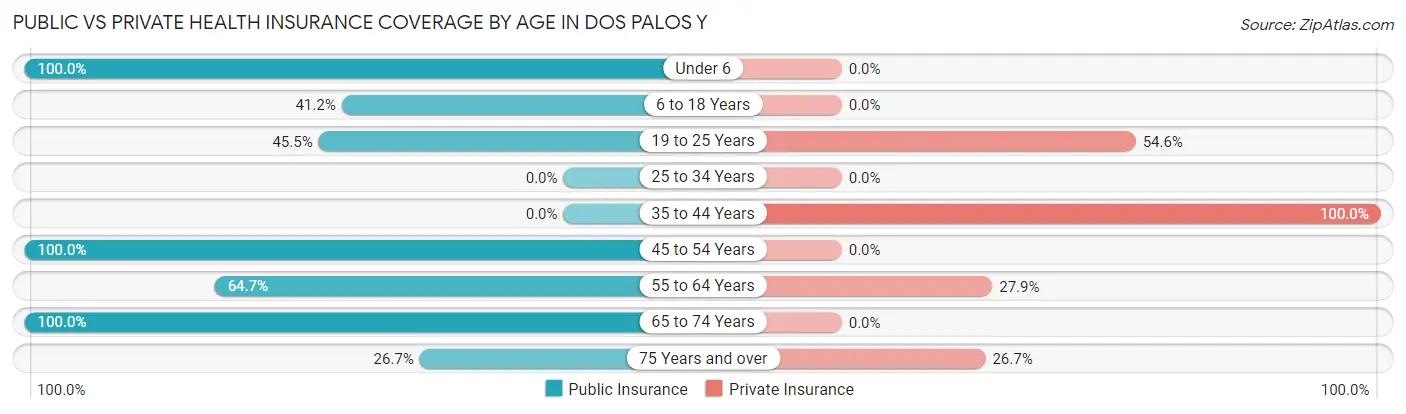
| Age Bracket | Public Insurance | Private Insurance |
| Under 6 | 7 (100.0%) | 0 (0.0%) |
| 6 to 18 Years | 7 (41.2%) | 0 (0.0%) |
| 19 to 25 Years | 5 (45.5%) | 6 (54.5%) |
| 25 to 34 Years | 0 (0.0%) | 0 (0.0%) |
| 35 to 44 Years | 0 (0.0%) | 27 (100.0%) |
| 45 to 54 Years | 17 (100.0%) | 0 (0.0%) |
| 55 to 64 Years | 44 (64.7%) | 19 (27.9%) |
| 65 to 74 Years | 23 (100.0%) | 0 (0.0%) |
| 75 Years and over | 4 (26.7%) | 4 (26.7%) |
| Total | 107 (57.8%) | 56 (30.3%) |
Disability Status by Sex by Age in Dos Palos Y
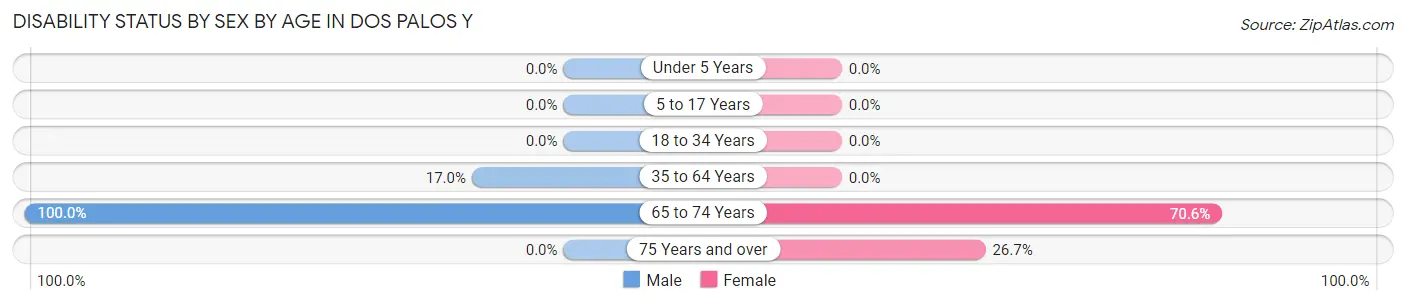
| Age Bracket | Male | Female |
| Under 5 Years | 0 (0.0%) | 0 (0.0%) |
| 5 to 17 Years | 0 (0.0%) | 0 (0.0%) |
| 18 to 34 Years | 0 (0.0%) | 0 (0.0%) |
| 35 to 64 Years | 17 (17.0%) | 0 (0.0%) |
| 65 to 74 Years | 6 (100.0%) | 12 (70.6%) |
| 75 Years and over | 0 (0.0%) | 4 (26.7%) |
Disability Class by Sex by Age in Dos Palos Y
Disability Class: Hearing Difficulty
| Age Bracket | Male | Female |
| Under 5 Years | 0 (0.0%) | 0 (0.0%) |
| 5 to 17 Years | 0 (0.0%) | 0 (0.0%) |
| 18 to 34 Years | 0 (0.0%) | 0 (0.0%) |
| 35 to 64 Years | 0 (0.0%) | 0 (0.0%) |
| 65 to 74 Years | 0 (0.0%) | 0 (0.0%) |
| 75 Years and over | 0 (0.0%) | 0 (0.0%) |
Disability Class: Vision Difficulty
| Age Bracket | Male | Female |
| Under 5 Years | 0 (0.0%) | 0 (0.0%) |
| 5 to 17 Years | 0 (0.0%) | 0 (0.0%) |
| 18 to 34 Years | 0 (0.0%) | 0 (0.0%) |
| 35 to 64 Years | 0 (0.0%) | 0 (0.0%) |
| 65 to 74 Years | 0 (0.0%) | 0 (0.0%) |
| 75 Years and over | 0 (0.0%) | 0 (0.0%) |
Disability Class: Cognitive Difficulty
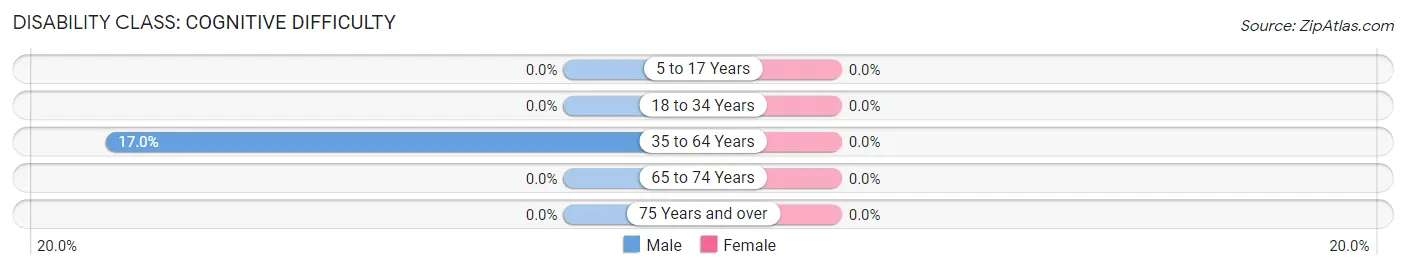
| Age Bracket | Male | Female |
| 5 to 17 Years | 0 (0.0%) | 0 (0.0%) |
| 18 to 34 Years | 0 (0.0%) | 0 (0.0%) |
| 35 to 64 Years | 17 (17.0%) | 0 (0.0%) |
| 65 to 74 Years | 0 (0.0%) | 0 (0.0%) |
| 75 Years and over | 0 (0.0%) | 0 (0.0%) |
Disability Class: Ambulatory Difficulty
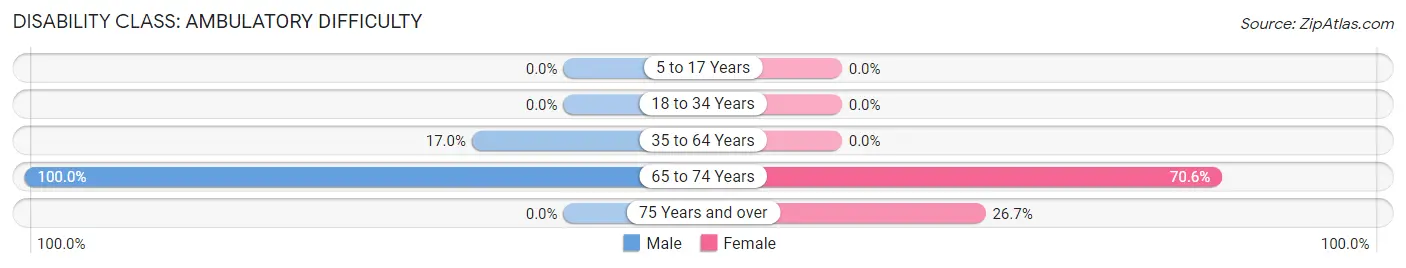
| Age Bracket | Male | Female |
| 5 to 17 Years | 0 (0.0%) | 0 (0.0%) |
| 18 to 34 Years | 0 (0.0%) | 0 (0.0%) |
| 35 to 64 Years | 17 (17.0%) | 0 (0.0%) |
| 65 to 74 Years | 6 (100.0%) | 12 (70.6%) |
| 75 Years and over | 0 (0.0%) | 4 (26.7%) |
Disability Class: Self-Care Difficulty
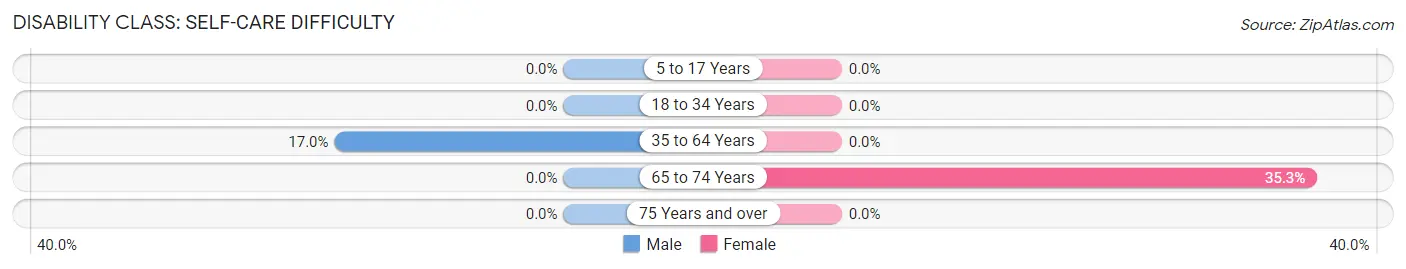
| Age Bracket | Male | Female |
| 5 to 17 Years | 0 (0.0%) | 0 (0.0%) |
| 18 to 34 Years | 0 (0.0%) | 0 (0.0%) |
| 35 to 64 Years | 17 (17.0%) | 0 (0.0%) |
| 65 to 74 Years | 0 (0.0%) | 6 (35.3%) |
| 75 Years and over | 0 (0.0%) | 0 (0.0%) |
Technology Access in Dos Palos Y
Computing Device Access in Dos Palos Y
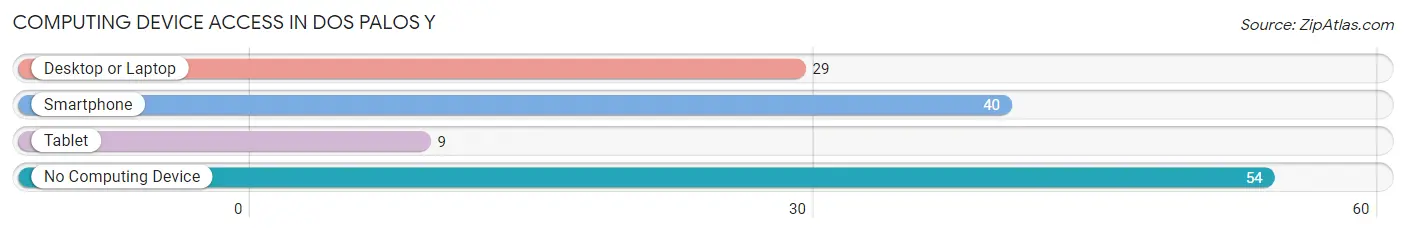
| Device Type | # Households | % Households |
| Desktop or Laptop | 29 | 29.6% |
| Smartphone | 40 | 40.8% |
| Tablet | 9 | 9.2% |
| No Computing Device | 54 | 55.1% |
| Total | 98 | 100.0% |
Internet Access in Dos Palos Y
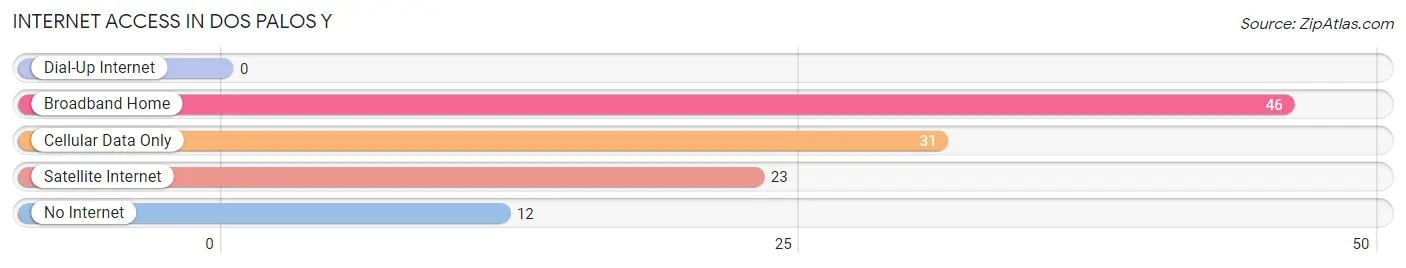
| Internet Type | # Households | % Households |
| Dial-Up Internet | 0 | 0.0% |
| Broadband Home | 46 | 46.9% |
| Cellular Data Only | 31 | 31.6% |
| Satellite Internet | 23 | 23.5% |
| No Internet | 12 | 12.2% |
| Total | 98 | 100.0% |
Dos Palos Y Summary
Dos Palos Y is a small unincorporated community located in Merced County, California. It is situated in the San Joaquin Valley, approximately 10 miles south of Los Banos and 25 miles west of Merced. The population of Dos Palos Y was estimated to be 1,845 in 2019.
History
Dos Palos Y was originally inhabited by the Yokuts Indians, who were the first people to settle in the area. The Yokuts were a peaceful people who lived off the land and were known for their basket weaving and other crafts. The first Europeans to settle in the area were Spanish missionaries, who established a mission in the area in 1806. The mission was named San Luis Gonzaga de Dos Palos Y, after the two rivers that ran through the area.
In 1848, the area became part of the United States after the Mexican-American War. The area was then settled by American settlers, who established farms and ranches in the area. The town of Dos Palos Y was officially established in 1872.
Geography
Dos Palos Y is located in the San Joaquin Valley, which is a large agricultural region in California. The town is situated on the banks of the San Joaquin River, which is the longest river in the state. The town is surrounded by rolling hills and is located in a semi-arid climate. The average temperature in the area is around 70 degrees Fahrenheit.
Economy
The economy of Dos Palos Y is largely based on agriculture. The area is known for its production of almonds, walnuts, tomatoes, and other crops. The town is also home to several dairies, which produce milk and other dairy products. In addition, the town is home to several small businesses, including restaurants, grocery stores, and other retail stores.
Demographics
As of 2019, the population of Dos Palos Y was estimated to be 1,845. The population is largely Hispanic, with over 90% of the population identifying as Hispanic or Latino. The median household income in the area is $45,000, which is slightly lower than the national average. The median age in the area is 33, which is slightly lower than the national average.
Conclusion
Dos Palos Y is a small unincorporated community located in Merced County, California. It is situated in the San Joaquin Valley and is known for its agricultural production. The population of Dos Palos Y is largely Hispanic, with over 90% of the population identifying as Hispanic or Latino. The economy of the town is largely based on agriculture, with the production of almonds, walnuts, tomatoes, and other crops being the main sources of income. The median household income in the area is $45,000, which is slightly lower than the national average.
Common Questions
What is Per Capita Income in Dos Palos Y?
Per Capita income in Dos Palos Y is $20,094.
What is the Median Family Income in Dos Palos Y?
Median Family Income in Dos Palos Y is $28,542.
What is the Median Household income in Dos Palos Y?
Median Household Income in Dos Palos Y is $37,857.
What is Inequality or Gini Index in Dos Palos Y?
Inequality or Gini Index in Dos Palos Y is 0.27.
What is the Total Population of Dos Palos Y?
Total Population of Dos Palos Y is 185.
What is the Total Male Population of Dos Palos Y?
Total Male Population of Dos Palos Y is 136.
What is the Total Female Population of Dos Palos Y?
Total Female Population of Dos Palos Y is 49.
What is the Ratio of Males per 100 Females in Dos Palos Y?
There are 277.55 Males per 100 Females in Dos Palos Y.
What is the Ratio of Females per 100 Males in Dos Palos Y?
There are 36.03 Females per 100 Males in Dos Palos Y.
What is the Median Population Age in Dos Palos Y?
Median Population Age in Dos Palos Y is 55.5 Years.
What is the Average Family Size in Dos Palos Y
Average Family Size in Dos Palos Y is 2.2 People.
What is the Average Household Size in Dos Palos Y
Average Household Size in Dos Palos Y is 1.9 People.
How Large is the Labor Force in Dos Palos Y?
There are 93 People in the Labor Forcein in Dos Palos Y.
What is the Percentage of People in the Labor Force in Dos Palos Y?
54.4% of People are in the Labor Force in Dos Palos Y.
What is the Unemployment Rate in Dos Palos Y?
Unemployment Rate in Dos Palos Y is 32.3%.