Riverdale, CA Map & Demographics
Riverdale Map
Riverdale Overview
$19,564
PER CAPITA INCOME
$54,884
AVG FAMILY INCOME
$55,458
AVG HOUSEHOLD INCOME
5.4%
WAGE / INCOME GAP [ % ]
94.6¢/ $1
WAGE / INCOME GAP [ $ ]
0.38
INEQUALITY / GINI INDEX
2,756
TOTAL POPULATION
1,463
MALE POPULATION
1,293
FEMALE POPULATION
113.15
MALES / 100 FEMALES
88.38
FEMALES / 100 MALES
30.5
MEDIAN AGE
3.9
AVG FAMILY SIZE
3.9
AVG HOUSEHOLD SIZE
1,217
LABOR FORCE [ PEOPLE ]
58.3%
PERCENT IN LABOR FORCE
5.3%
UNEMPLOYMENT RATE
Riverdale Zip Codes
Riverdale Area Codes
Income in Riverdale
Income Overview in Riverdale
Per Capita Income in Riverdale is $19,564, while median incomes of families and households are $54,884 and $55,458 respectively.
| Characteristic | Number | Measure |
| Per Capita Income | 2,756 | $19,564 |
| Median Family Income | 644 | $54,884 |
| Mean Family Income | 644 | $72,152 |
| Median Household Income | 699 | $55,458 |
| Mean Household Income | 699 | $72,666 |
| Income Deficit | 644 | $0 |
| Wage / Income Gap (%) | 2,756 | 5.41% |
| Wage / Income Gap ($) | 2,756 | 94.59¢ per $1 |
| Gini / Inequality Index | 2,756 | 0.38 |
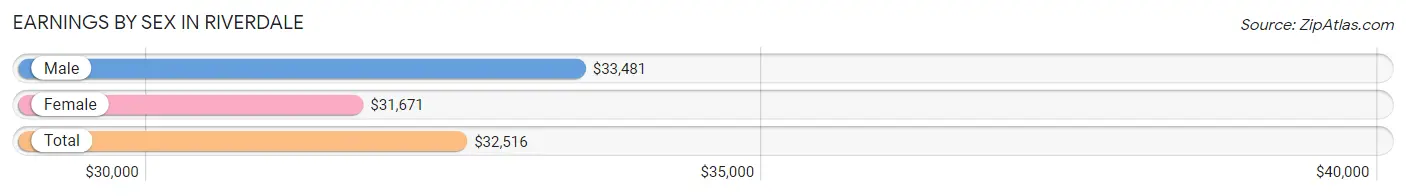
Earnings by Sex in Riverdale
Average Earnings in Riverdale are $32,516, $33,481 for men and $31,671 for women, a difference of 5.4%.
| Sex | Number | Average Earnings |
| Male | 716 (55.5%) | $33,481 |
| Female | 573 (44.5%) | $31,671 |
| Total | 1,289 (100.0%) | $32,516 |
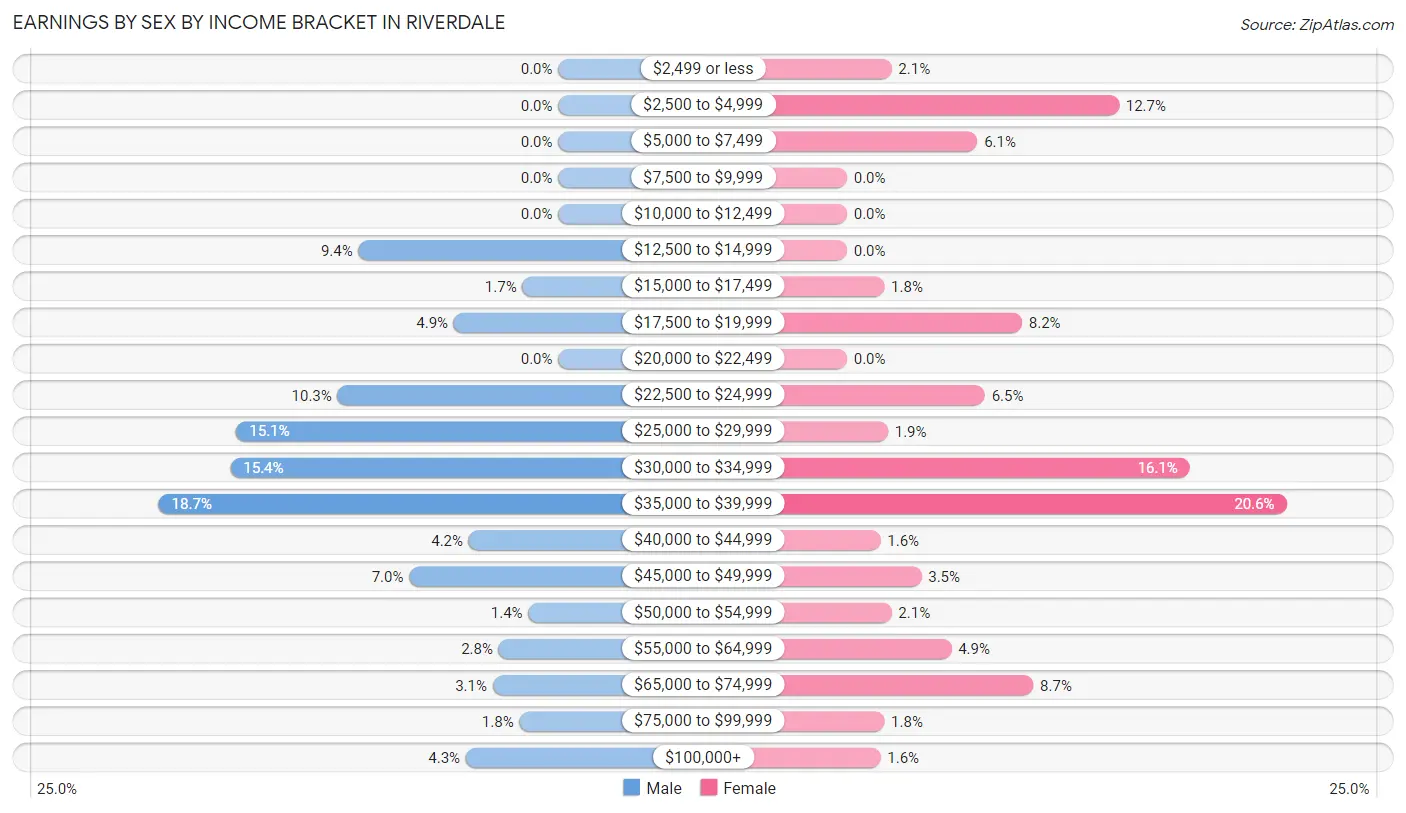
Earnings by Sex by Income Bracket in Riverdale
The most common earnings brackets in Riverdale are $35,000 to $39,999 for men (134 | 18.7%) and $35,000 to $39,999 for women (118 | 20.6%).
| Income | Male | Female |
| $2,499 or less | 0 (0.0%) | 12 (2.1%) |
| $2,500 to $4,999 | 0 (0.0%) | 73 (12.7%) |
| $5,000 to $7,499 | 0 (0.0%) | 35 (6.1%) |
| $7,500 to $9,999 | 0 (0.0%) | 0 (0.0%) |
| $10,000 to $12,499 | 0 (0.0%) | 0 (0.0%) |
| $12,500 to $14,999 | 67 (9.4%) | 0 (0.0%) |
| $15,000 to $17,499 | 12 (1.7%) | 10 (1.8%) |
| $17,500 to $19,999 | 35 (4.9%) | 47 (8.2%) |
| $20,000 to $22,499 | 0 (0.0%) | 0 (0.0%) |
| $22,500 to $24,999 | 74 (10.3%) | 37 (6.5%) |
| $25,000 to $29,999 | 108 (15.1%) | 11 (1.9%) |
| $30,000 to $34,999 | 110 (15.4%) | 92 (16.1%) |
| $35,000 to $39,999 | 134 (18.7%) | 118 (20.6%) |
| $40,000 to $44,999 | 30 (4.2%) | 9 (1.6%) |
| $45,000 to $49,999 | 50 (7.0%) | 20 (3.5%) |
| $50,000 to $54,999 | 10 (1.4%) | 12 (2.1%) |
| $55,000 to $64,999 | 20 (2.8%) | 28 (4.9%) |
| $65,000 to $74,999 | 22 (3.1%) | 50 (8.7%) |
| $75,000 to $99,999 | 13 (1.8%) | 10 (1.8%) |
| $100,000+ | 31 (4.3%) | 9 (1.6%) |
| Total | 716 (100.0%) | 573 (100.0%) |
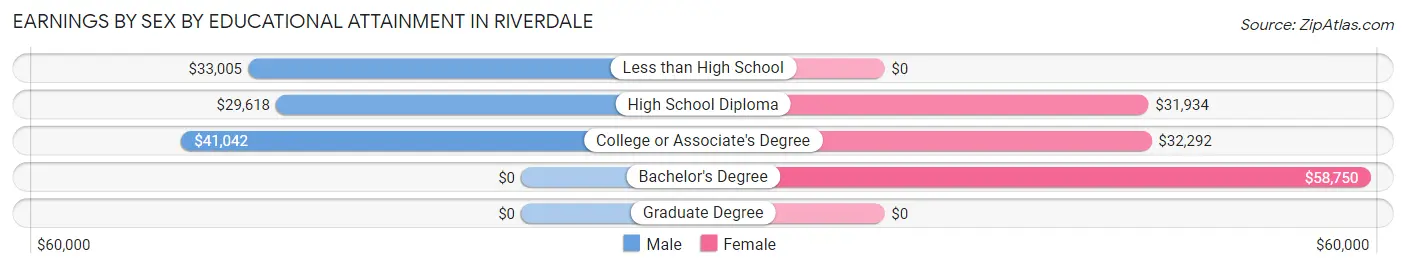
Earnings by Sex by Educational Attainment in Riverdale
Average earnings in Riverdale are $33,671 for men and $32,378 for women, a difference of 3.8%. Men with an educational attainment of college or associate's degree enjoy the highest average annual earnings of $41,042, while those with high school diploma education earn the least with $29,618. Women with an educational attainment of bachelor's degree earn the most with the average annual earnings of $58,750, while those with high school diploma education have the smallest earnings of $31,934.
| Educational Attainment | Male Income | Female Income |
| Less than High School | $33,005 | $0 |
| High School Diploma | $29,618 | $31,934 |
| College or Associate's Degree | $41,042 | $32,292 |
| Bachelor's Degree | - | - |
| Graduate Degree | - | - |
| Total | $33,671 | $32,378 |
Family Income in Riverdale
Family Income Brackets in Riverdale
According to the Riverdale family income data, there are 139 families falling into the $35,000 to $49,999 income range, which is the most common income bracket and makes up 21.6% of all families.
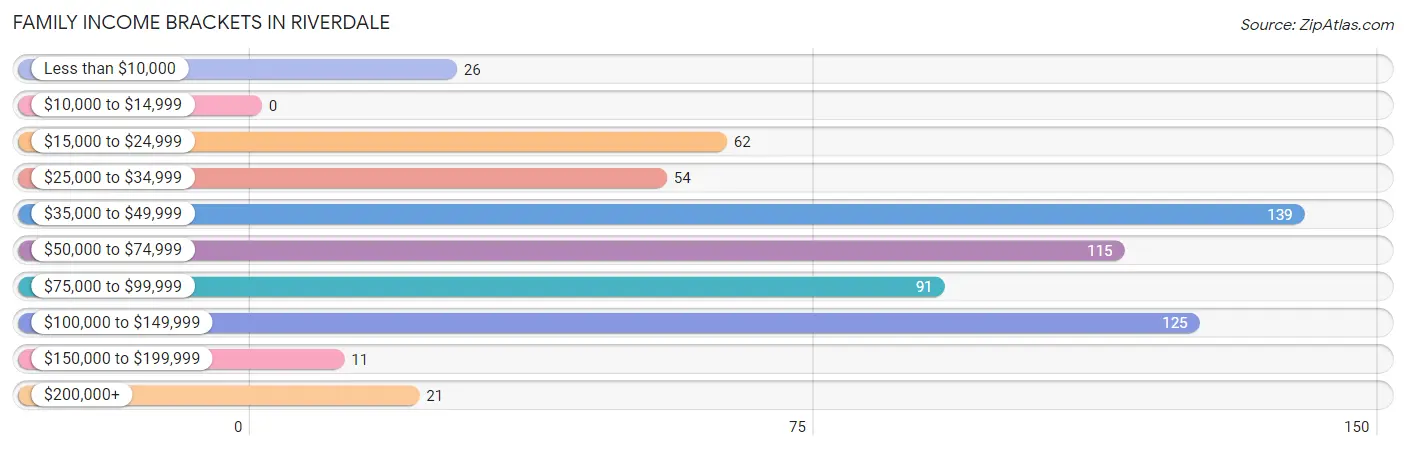
| Income Bracket | # Families | % Families |
| Less than $10,000 | 26 | 4.0% |
| $10,000 to $14,999 | 0 | 0.0% |
| $15,000 to $24,999 | 62 | 9.6% |
| $25,000 to $34,999 | 54 | 8.4% |
| $35,000 to $49,999 | 139 | 21.6% |
| $50,000 to $74,999 | 115 | 17.9% |
| $75,000 to $99,999 | 91 | 14.1% |
| $100,000 to $149,999 | 125 | 19.4% |
| $150,000 to $199,999 | 11 | 1.7% |
| $200,000+ | 21 | 3.3% |
Family Income by Famaliy Size in Riverdale
5-person families (50 | 7.8%) account for the highest median family income in Riverdale with $105,417 per family, while 3-person families (169 | 26.2%) have the highest median income of $23,661 per family member.
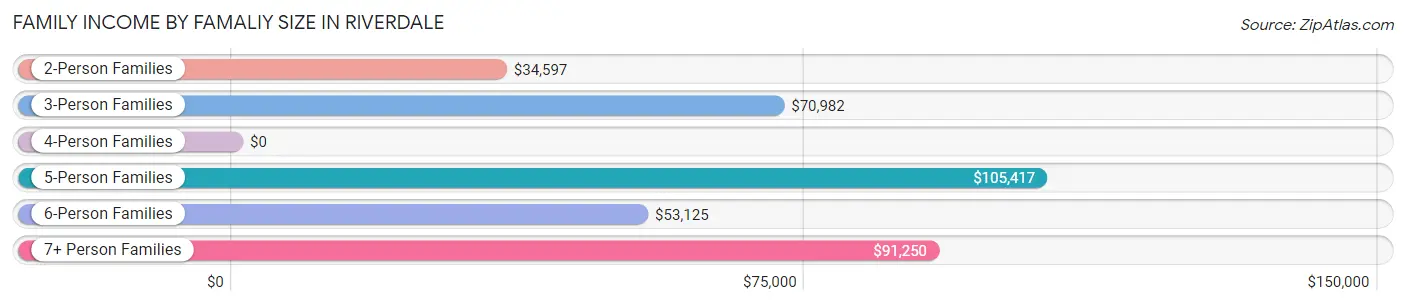
| Income Bracket | # Families | Median Income |
| 2-Person Families | 196 (30.4%) | $34,597 |
| 3-Person Families | 169 (26.2%) | $70,982 |
| 4-Person Families | 105 (16.3%) | $0 |
| 5-Person Families | 50 (7.8%) | $105,417 |
| 6-Person Families | 70 (10.9%) | $53,125 |
| 7+ Person Families | 54 (8.4%) | $91,250 |
| Total | 644 (100.0%) | $54,884 |
Family Income by Number of Earners in Riverdale
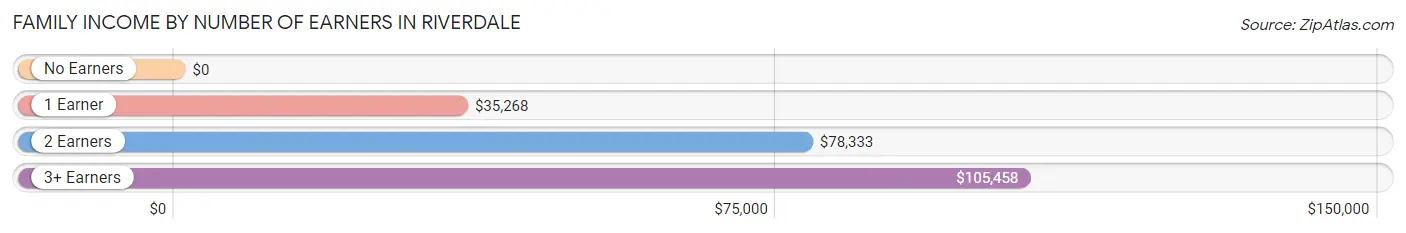
| Number of Earners | # Families | Median Income |
| No Earners | 10 (1.5%) | $0 |
| 1 Earner | 279 (43.3%) | $35,268 |
| 2 Earners | 232 (36.0%) | $78,333 |
| 3+ Earners | 123 (19.1%) | $105,458 |
| Total | 644 (100.0%) | $54,884 |
Household Income in Riverdale
Household Income Brackets in Riverdale
With 140 households falling in the category, the $35,000 to $49,999 income range is the most frequent in Riverdale, accounting for 20.0% of all households.
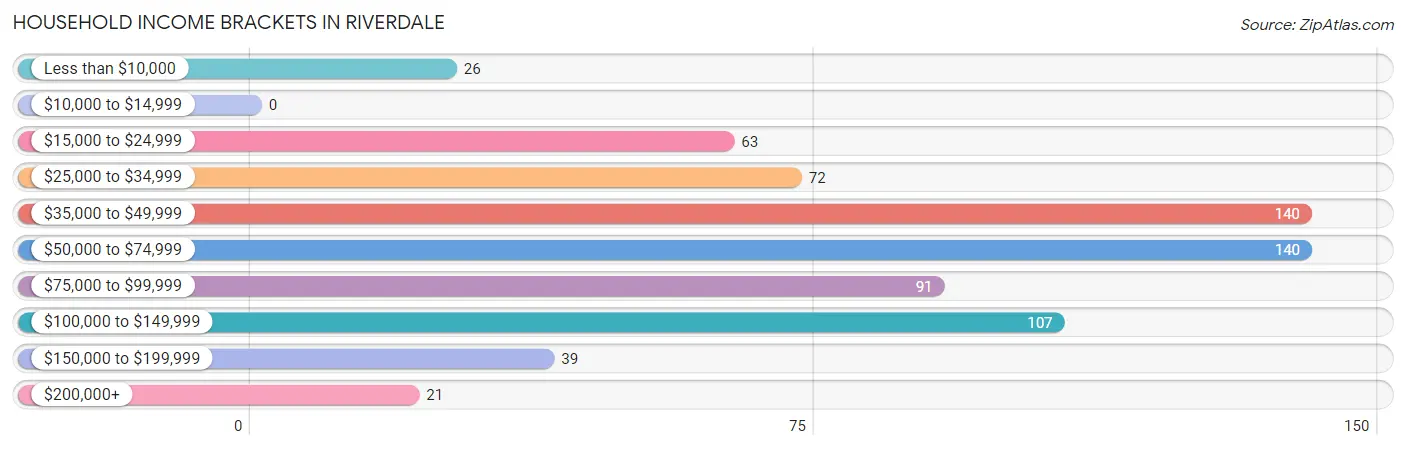
| Income Bracket | # Households | % Households |
| Less than $10,000 | 26 | 3.7% |
| $10,000 to $14,999 | 0 | 0.0% |
| $15,000 to $24,999 | 63 | 9.0% |
| $25,000 to $34,999 | 72 | 10.3% |
| $35,000 to $49,999 | 140 | 20.0% |
| $50,000 to $74,999 | 140 | 20.0% |
| $75,000 to $99,999 | 91 | 13.0% |
| $100,000 to $149,999 | 107 | 15.3% |
| $150,000 to $199,999 | 39 | 5.6% |
| $200,000+ | 21 | 3.0% |
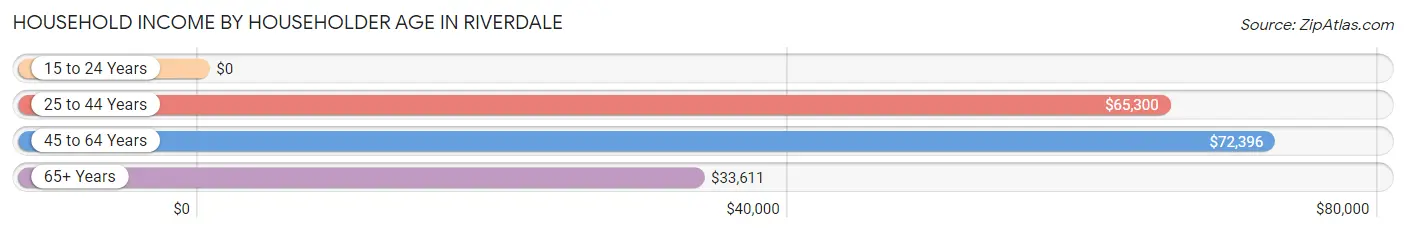
Household Income by Householder Age in Riverdale
The median household income in Riverdale is $55,458, with the highest median household income of $72,396 found in the 45 to 64 years age bracket for the primary householder. A total of 279 households (39.9%) fall into this category.
| Income Bracket | # Households | Median Income |
| 15 to 24 Years | 0 (0.0%) | $0 |
| 25 to 44 Years | 266 (38.1%) | $65,300 |
| 45 to 64 Years | 279 (39.9%) | $72,396 |
| 65+ Years | 154 (22.0%) | $33,611 |
| Total | 699 (100.0%) | $55,458 |
Poverty in Riverdale
Income Below Poverty by Sex and Age in Riverdale
With 13.7% poverty level for males and 14.2% for females among the residents of Riverdale, 18 to 24 year old males and 6 to 11 year old females are the most vulnerable to poverty, with 25 males (52.1%) and 28 females (32.9%) in their respective age groups living below the poverty level.
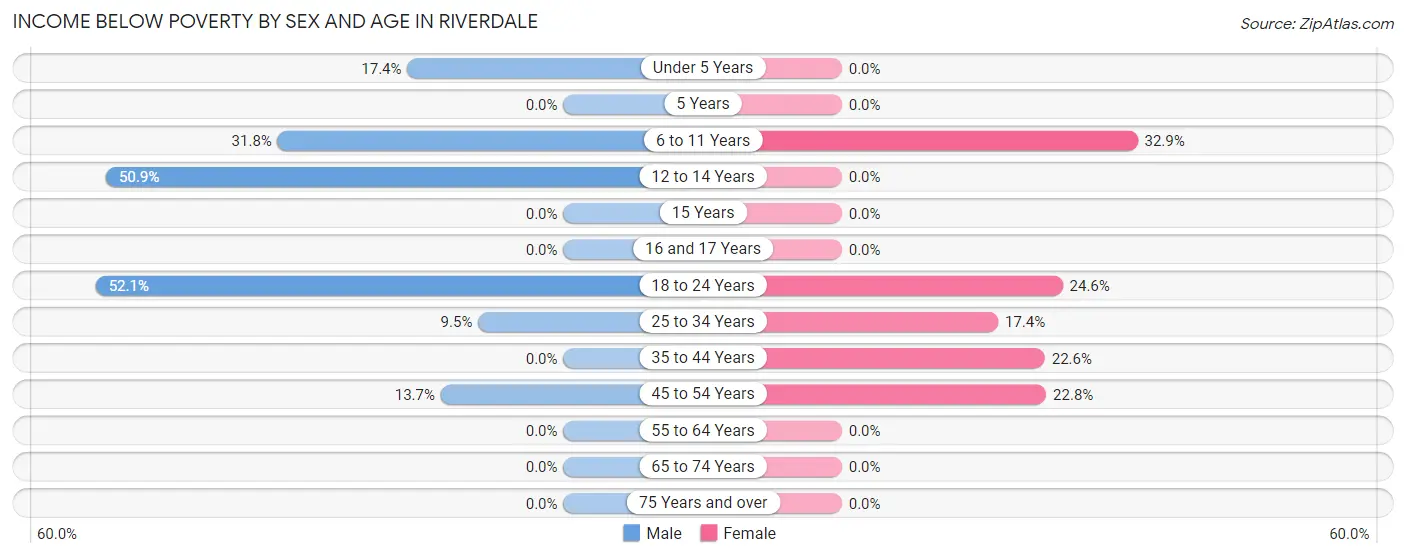
| Age Bracket | Male | Female |
| Under 5 Years | 29 (17.4%) | 0 (0.0%) |
| 5 Years | 0 (0.0%) | 0 (0.0%) |
| 6 to 11 Years | 28 (31.8%) | 28 (32.9%) |
| 12 to 14 Years | 55 (50.9%) | 0 (0.0%) |
| 15 Years | 0 (0.0%) | 0 (0.0%) |
| 16 and 17 Years | 0 (0.0%) | 0 (0.0%) |
| 18 to 24 Years | 25 (52.1%) | 30 (24.6%) |
| 25 to 34 Years | 29 (9.5%) | 67 (17.4%) |
| 35 to 44 Years | 0 (0.0%) | 26 (22.6%) |
| 45 to 54 Years | 34 (13.7%) | 33 (22.8%) |
| 55 to 64 Years | 0 (0.0%) | 0 (0.0%) |
| 65 to 74 Years | 0 (0.0%) | 0 (0.0%) |
| 75 Years and over | 0 (0.0%) | 0 (0.0%) |
| Total | 200 (13.7%) | 184 (14.2%) |
Income Above Poverty by Sex and Age in Riverdale
According to the poverty statistics in Riverdale, males aged 15 years and females aged under 5 years are the age groups that are most secure financially, with 100.0% of males and 100.0% of females in these age groups living above the poverty line.
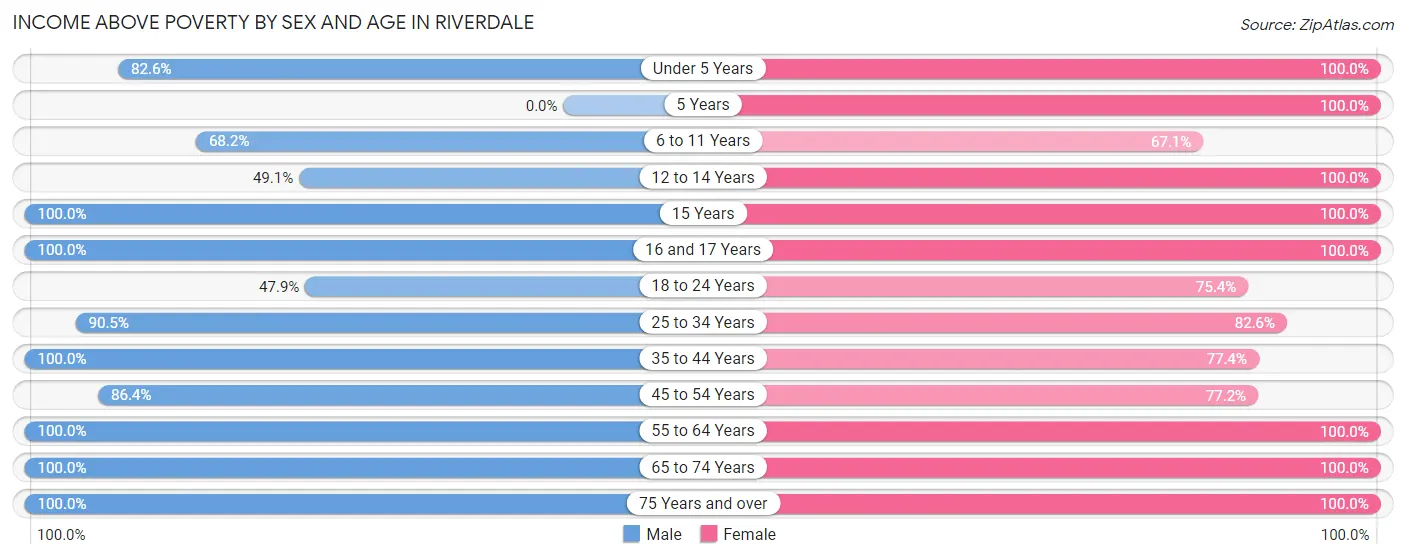
| Age Bracket | Male | Female |
| Under 5 Years | 138 (82.6%) | 93 (100.0%) |
| 5 Years | 0 (0.0%) | 41 (100.0%) |
| 6 to 11 Years | 60 (68.2%) | 57 (67.1%) |
| 12 to 14 Years | 53 (49.1%) | 43 (100.0%) |
| 15 Years | 22 (100.0%) | 21 (100.0%) |
| 16 and 17 Years | 46 (100.0%) | 24 (100.0%) |
| 18 to 24 Years | 23 (47.9%) | 92 (75.4%) |
| 25 to 34 Years | 277 (90.5%) | 318 (82.6%) |
| 35 to 44 Years | 141 (100.0%) | 89 (77.4%) |
| 45 to 54 Years | 215 (86.4%) | 112 (77.2%) |
| 55 to 64 Years | 139 (100.0%) | 150 (100.0%) |
| 65 to 74 Years | 93 (100.0%) | 43 (100.0%) |
| 75 Years and over | 56 (100.0%) | 26 (100.0%) |
| Total | 1,263 (86.3%) | 1,109 (85.8%) |
Income Below Poverty Among Married-Couple Families in Riverdale
The poverty statistics for married-couple families in Riverdale show that 11.7% or 53 of the total 452 families live below the poverty line. Families with 3 or 4 children have the highest poverty rate of 55.1%, comprising of 27 families. On the other hand, families with no children have the lowest poverty rate of 0.0%, which includes 0 families.
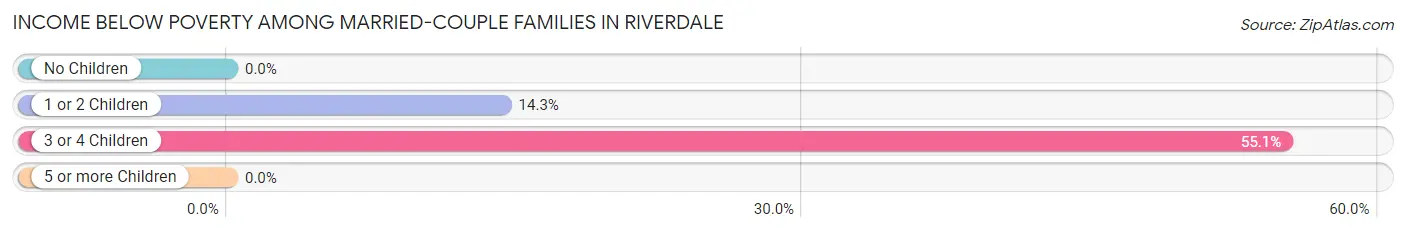
| Children | Above Poverty | Below Poverty |
| No Children | 211 (100.0%) | 0 (0.0%) |
| 1 or 2 Children | 156 (85.7%) | 26 (14.3%) |
| 3 or 4 Children | 22 (44.9%) | 27 (55.1%) |
| 5 or more Children | 10 (100.0%) | 0 (0.0%) |
| Total | 399 (88.3%) | 53 (11.7%) |
Income Below Poverty Among Single-Parent Households in Riverdale
| Children | Single Father | Single Mother |
| No Children | 0 (0.0%) | 0 (0.0%) |
| 1 or 2 Children | 0 (0.0%) | 0 (0.0%) |
| 3 or 4 Children | 0 (0.0%) | 0 (0.0%) |
| 5 or more Children | 0 (0.0%) | 0 (0.0%) |
| Total | 0 (0.0%) | 0 (0.0%) |
Income Below Poverty Among Married-Couple vs Single-Parent Households in Riverdale
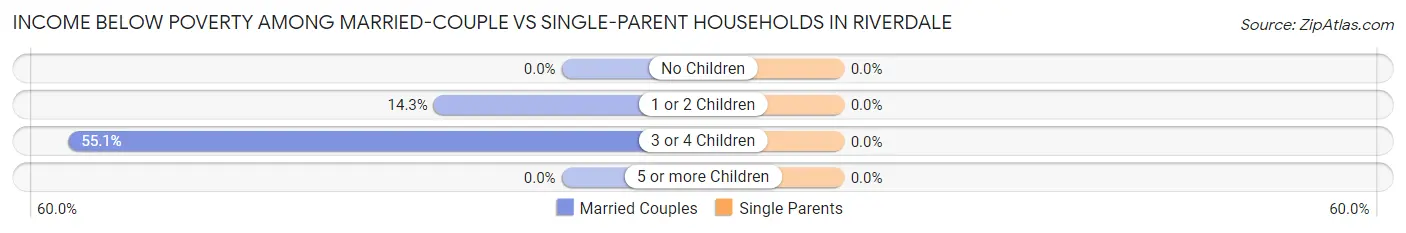
| Children | Married-Couple Families | Single-Parent Households |
| No Children | 0 (0.0%) | 0 (0.0%) |
| 1 or 2 Children | 26 (14.3%) | 0 (0.0%) |
| 3 or 4 Children | 27 (55.1%) | 0 (0.0%) |
| 5 or more Children | 0 (0.0%) | 0 (0.0%) |
| Total | 53 (11.7%) | 0 (0.0%) |
Race in Riverdale
The most populous races in Riverdale are Hispanic or Latino (2,258 | 81.9%), Some other Race (1,199 | 43.5%), and White / Caucasian (1,126 | 40.9%).
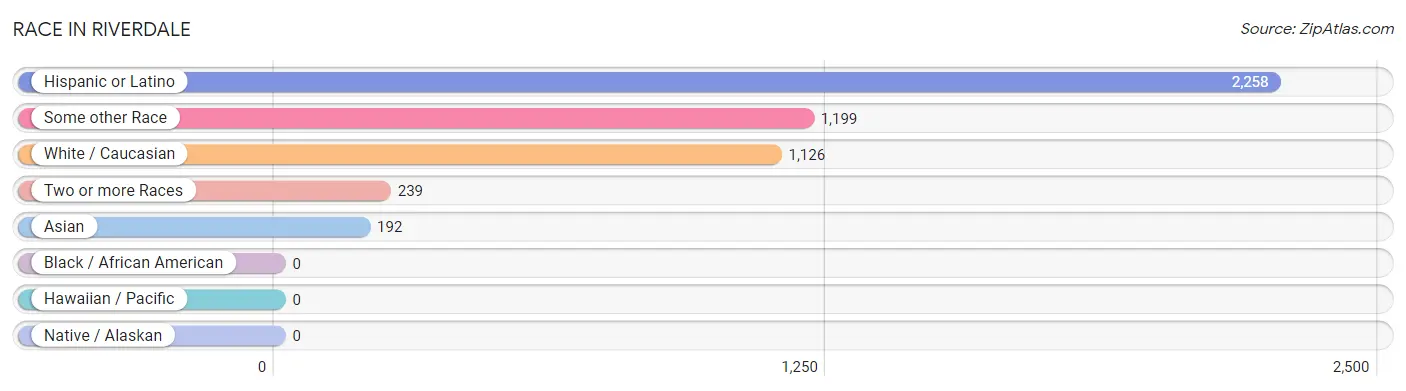
| Race | # Population | % Population |
| Asian | 192 | 7.0% |
| Black / African American | 0 | 0.0% |
| Hawaiian / Pacific | 0 | 0.0% |
| Hispanic or Latino | 2,258 | 81.9% |
| Native / Alaskan | 0 | 0.0% |
| White / Caucasian | 1,126 | 40.9% |
| Two or more Races | 239 | 8.7% |
| Some other Race | 1,199 | 43.5% |
| Total | 2,756 | 100.0% |
Ancestry in Riverdale
The most populous ancestries reported in Riverdale are Mexican (2,258 | 81.9%), Laotian (192 | 7.0%), Scottish (103 | 3.7%), Portuguese (101 | 3.7%), and English (80 | 2.9%), together accounting for 99.2% of all Riverdale residents.
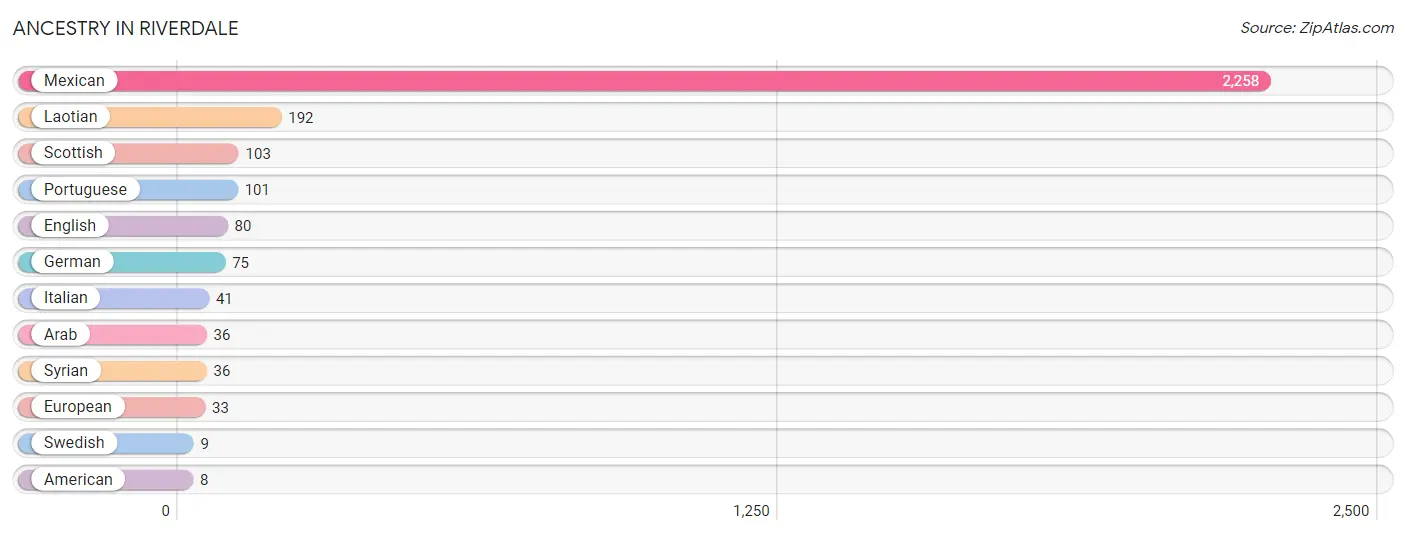
| Ancestry | # Population | % Population |
| American | 8 | 0.3% |
| Arab | 36 | 1.3% |
| English | 80 | 2.9% |
| European | 33 | 1.2% |
| German | 75 | 2.7% |
| Italian | 41 | 1.5% |
| Laotian | 192 | 7.0% |
| Mexican | 2,258 | 81.9% |
| Portuguese | 101 | 3.7% |
| Scottish | 103 | 3.7% |
| Swedish | 9 | 0.3% |
| Syrian | 36 | 1.3% | View All 12 Rows |
Immigrants in Riverdale
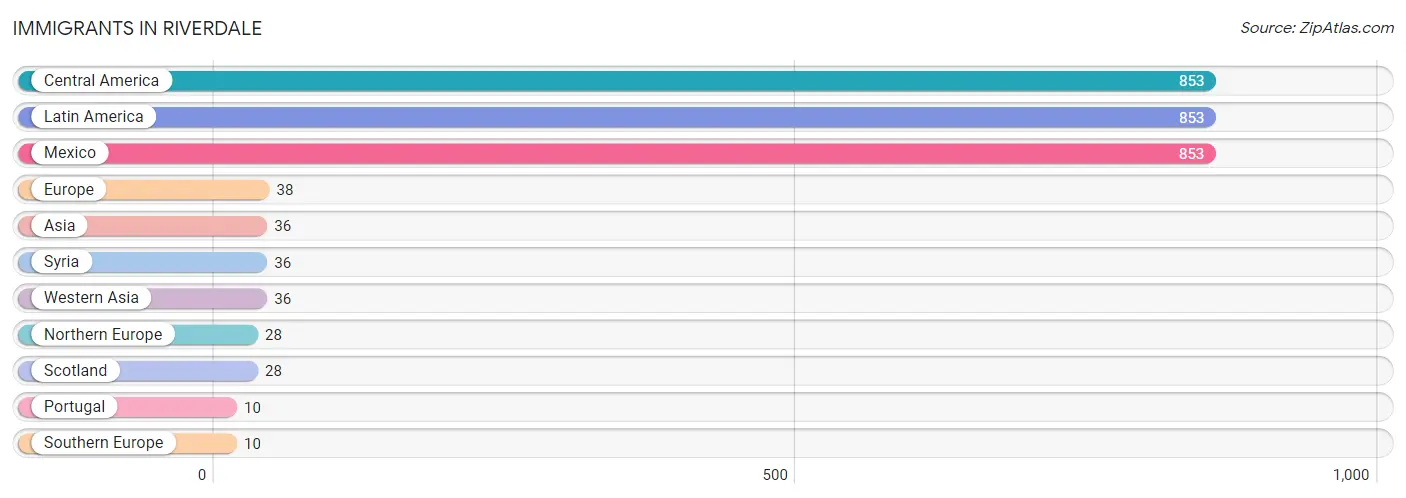
The most numerous immigrant groups reported in Riverdale came from Central America (853 | 30.9%), Latin America (853 | 30.9%), Mexico (853 | 30.9%), Europe (38 | 1.4%), and Asia (36 | 1.3%), together accounting for 95.5% of all Riverdale residents.
| Immigration Origin | # Population | % Population |
| Asia | 36 | 1.3% |
| Central America | 853 | 30.9% |
| Europe | 38 | 1.4% |
| Latin America | 853 | 30.9% |
| Mexico | 853 | 30.9% |
| Northern Europe | 28 | 1.0% |
| Portugal | 10 | 0.4% |
| Scotland | 28 | 1.0% |
| Southern Europe | 10 | 0.4% |
| Syria | 36 | 1.3% |
| Western Asia | 36 | 1.3% | View All 11 Rows |
Sex and Age in Riverdale
Sex and Age in Riverdale
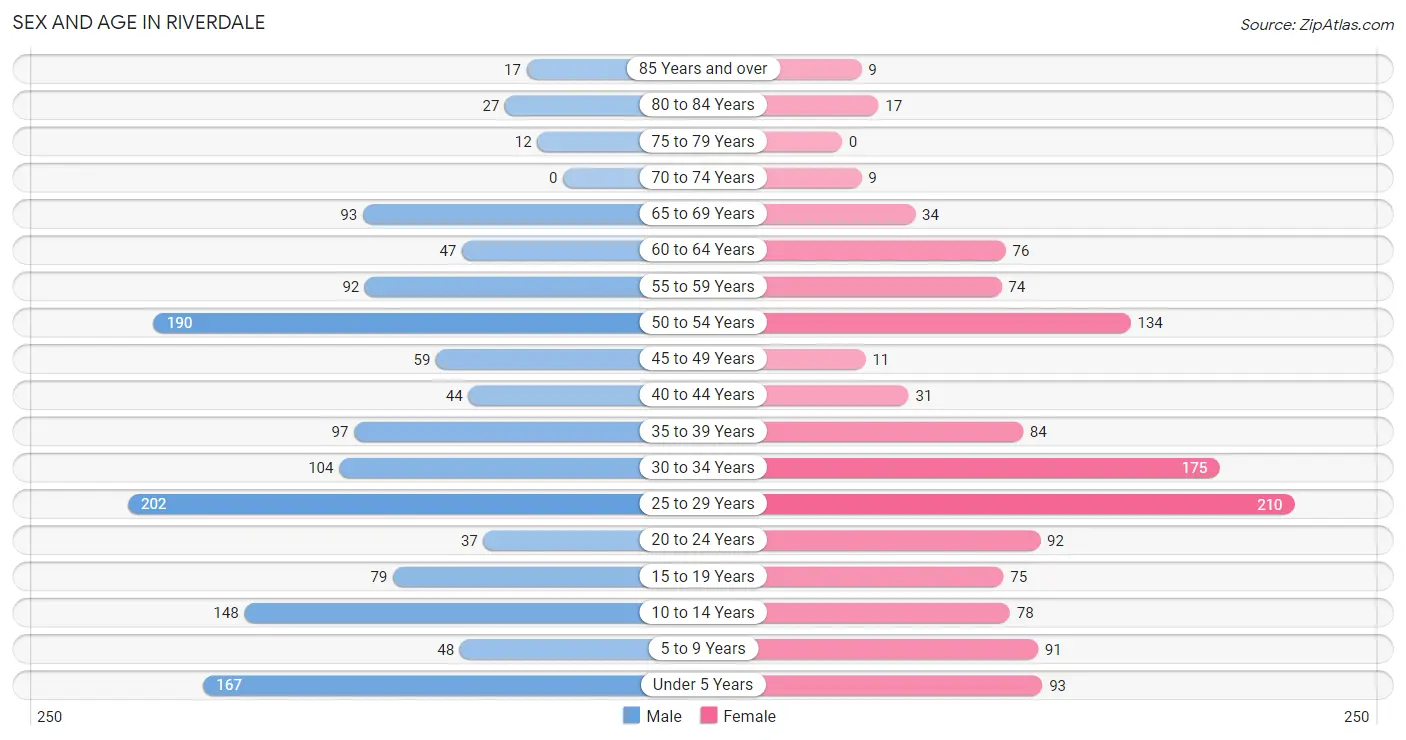
The most populous age groups in Riverdale are 25 to 29 Years (202 | 13.8%) for men and 25 to 29 Years (210 | 16.2%) for women.
| Age Bracket | Male | Female |
| Under 5 Years | 167 (11.4%) | 93 (7.2%) |
| 5 to 9 Years | 48 (3.3%) | 91 (7.0%) |
| 10 to 14 Years | 148 (10.1%) | 78 (6.0%) |
| 15 to 19 Years | 79 (5.4%) | 75 (5.8%) |
| 20 to 24 Years | 37 (2.5%) | 92 (7.1%) |
| 25 to 29 Years | 202 (13.8%) | 210 (16.2%) |
| 30 to 34 Years | 104 (7.1%) | 175 (13.5%) |
| 35 to 39 Years | 97 (6.6%) | 84 (6.5%) |
| 40 to 44 Years | 44 (3.0%) | 31 (2.4%) |
| 45 to 49 Years | 59 (4.0%) | 11 (0.9%) |
| 50 to 54 Years | 190 (13.0%) | 134 (10.4%) |
| 55 to 59 Years | 92 (6.3%) | 74 (5.7%) |
| 60 to 64 Years | 47 (3.2%) | 76 (5.9%) |
| 65 to 69 Years | 93 (6.4%) | 34 (2.6%) |
| 70 to 74 Years | 0 (0.0%) | 9 (0.7%) |
| 75 to 79 Years | 12 (0.8%) | 0 (0.0%) |
| 80 to 84 Years | 27 (1.8%) | 17 (1.3%) |
| 85 Years and over | 17 (1.2%) | 9 (0.7%) |
| Total | 1,463 (100.0%) | 1,293 (100.0%) |
Families and Households in Riverdale
Median Family Size in Riverdale
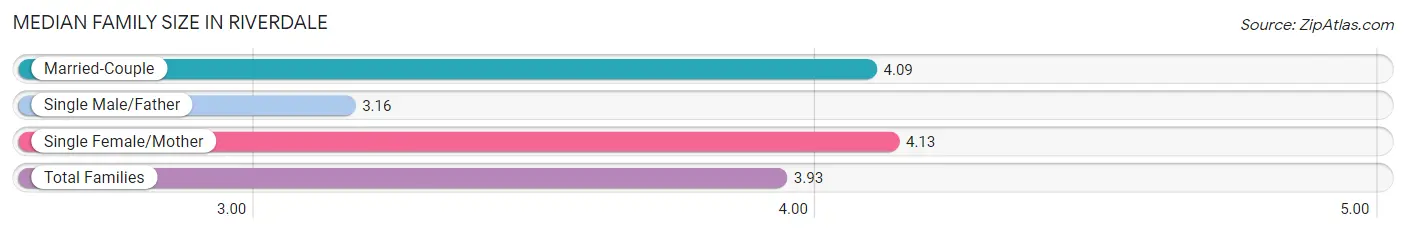
The median family size in Riverdale is 3.93 persons per family, with single female/mother families (76 | 11.8%) accounting for the largest median family size of 4.13 persons per family. On the other hand, single male/father families (116 | 18.0%) represent the smallest median family size with 3.16 persons per family.
| Family Type | # Families | Family Size |
| Married-Couple | 452 (70.2%) | 4.09 |
| Single Male/Father | 116 (18.0%) | 3.16 |
| Single Female/Mother | 76 (11.8%) | 4.13 |
| Total Families | 644 (100.0%) | 3.93 |
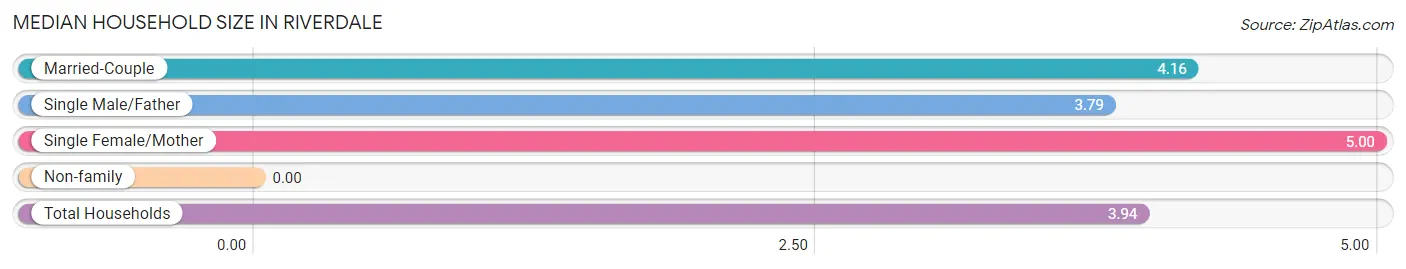
Median Household Size in Riverdale
| Household Type | # Households | Household Size |
| Married-Couple | 452 (64.7%) | 4.16 |
| Single Male/Father | 116 (16.6%) | 3.79 |
| Single Female/Mother | 76 (10.9%) | 5.00 |
| Non-family | 55 (7.9%) | - |
| Total Households | 699 (100.0%) | 3.94 |
Household Size by Marriage Status in Riverdale
Out of a total of 699 households in Riverdale, 644 (92.1%) are family households, while 55 (7.9%) are nonfamily households. The most numerous type of family households are 2-person households, comprising 170, and the most common type of nonfamily households are 1-person households, comprising 55.
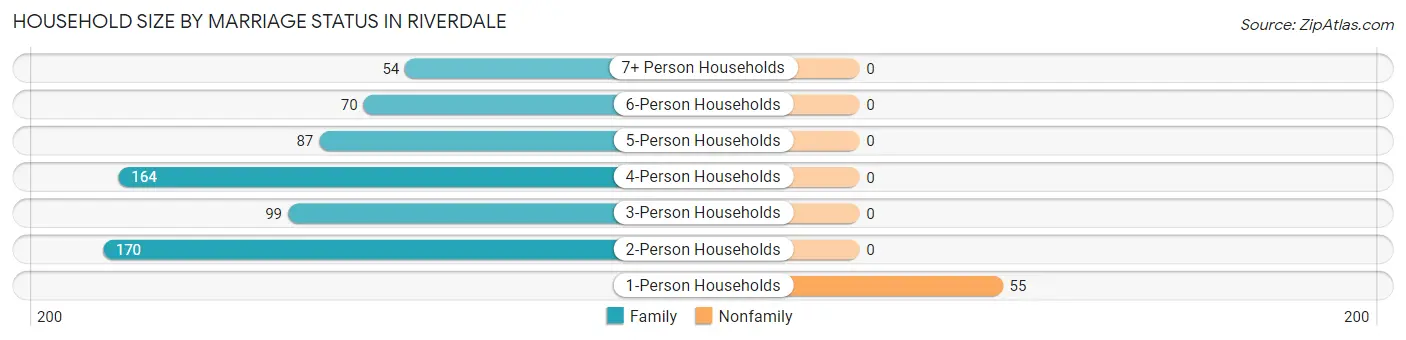
| Household Size | Family Households | Nonfamily Households |
| 1-Person Households | - | 55 (7.9%) |
| 2-Person Households | 170 (24.3%) | 0 (0.0%) |
| 3-Person Households | 99 (14.2%) | 0 (0.0%) |
| 4-Person Households | 164 (23.5%) | 0 (0.0%) |
| 5-Person Households | 87 (12.4%) | 0 (0.0%) |
| 6-Person Households | 70 (10.0%) | 0 (0.0%) |
| 7+ Person Households | 54 (7.7%) | 0 (0.0%) |
| Total | 644 (92.1%) | 55 (7.9%) |
Female Fertility in Riverdale
Fertility by Age in Riverdale
Average fertility rate in Riverdale is 35.0 births per 1,000 women. Women in the age bracket of 20 to 34 years have the highest fertility rate with 52.0 births per 1,000 women. Women in the age bracket of 20 to 34 years acount for 100.0% of all women with births.
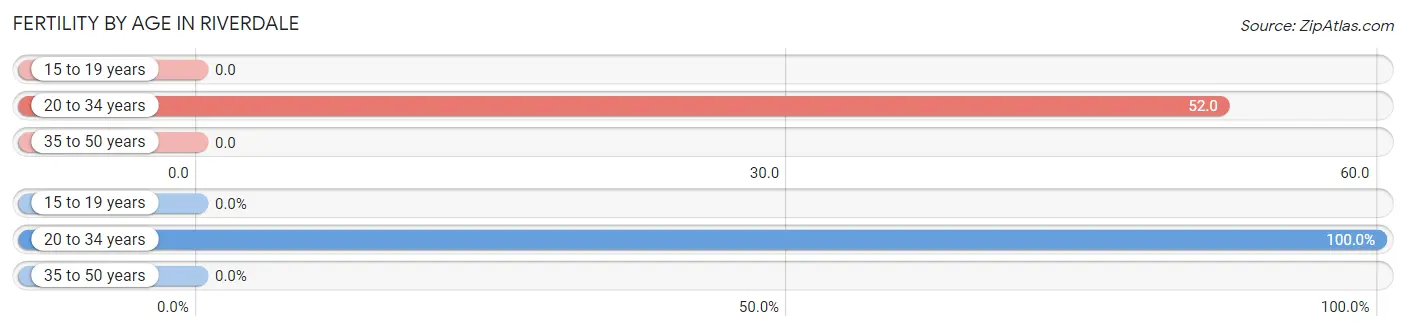
| Age Bracket | Women with Births | Births / 1,000 Women |
| 15 to 19 years | 0 (0.0%) | 0.0 |
| 20 to 34 years | 25 (100.0%) | 52.0 |
| 35 to 50 years | 0 (0.0%) | 0.0 |
| Total | 25 (100.0%) | 35.0 |
Fertility by Age by Marriage Status in Riverdale
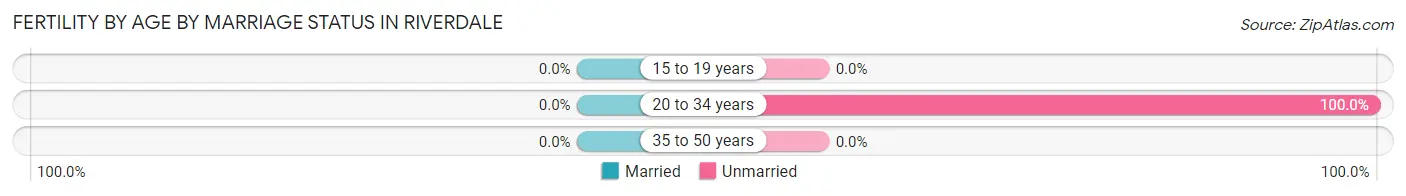
| Age Bracket | Married | Unmarried |
| 15 to 19 years | 0 (0.0%) | 0 (0.0%) |
| 20 to 34 years | 0 (0.0%) | 25 (100.0%) |
| 35 to 50 years | 0 (0.0%) | 0 (0.0%) |
| Total | 0 (0.0%) | 25 (100.0%) |
Fertility by Education in Riverdale
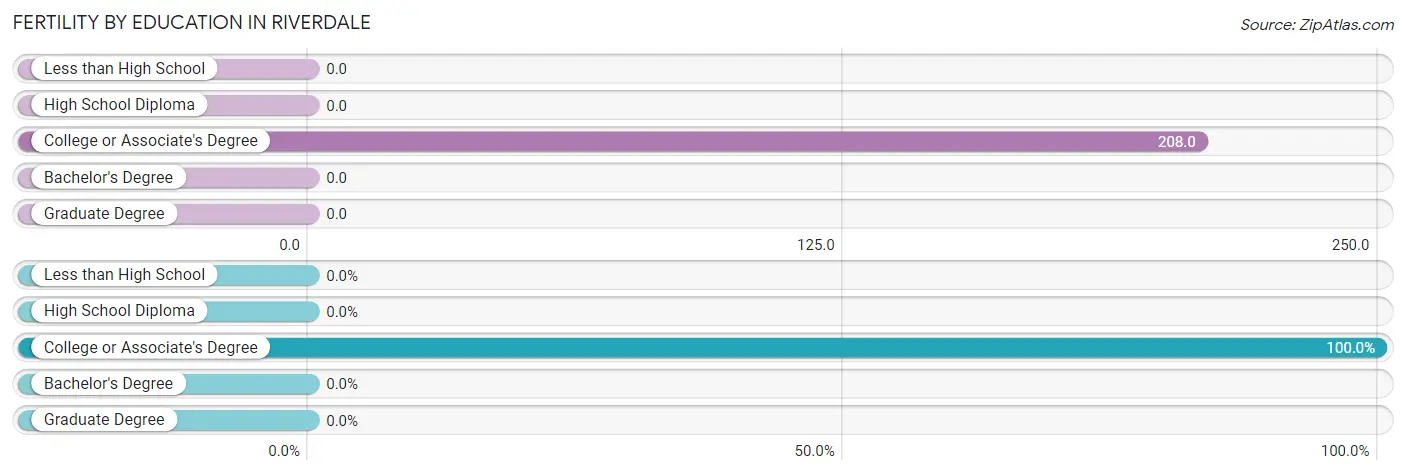
| Educational Attainment | Women with Births | Births / 1,000 Women |
| Less than High School | 0 (0.0%) | 0.0 |
| High School Diploma | 0 (0.0%) | 0.0 |
| College or Associate's Degree | 25 (100.0%) | 208.0 |
| Bachelor's Degree | 0 (0.0%) | 0.0 |
| Graduate Degree | 0 (0.0%) | 0.0 |
| Total | 25 (100.0%) | 35.0 |
Fertility by Education by Marriage Status in Riverdale
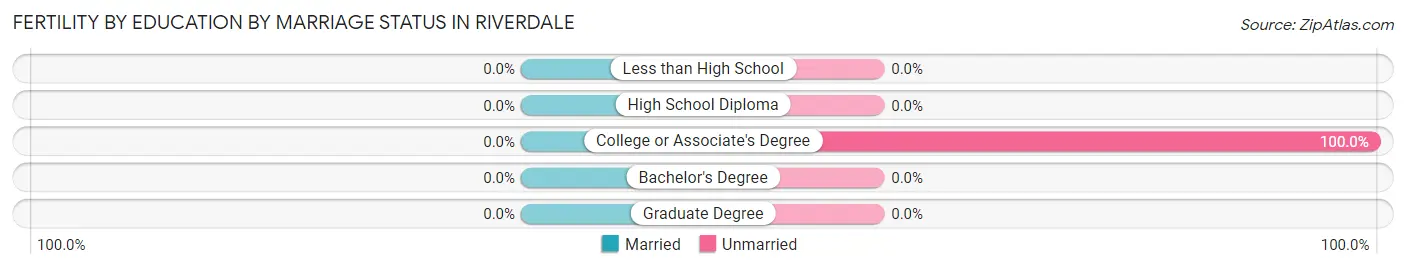
| Educational Attainment | Married | Unmarried |
| Less than High School | 0 (0.0%) | 0 (0.0%) |
| High School Diploma | 0 (0.0%) | 0 (0.0%) |
| College or Associate's Degree | 0 (0.0%) | 25 (100.0%) |
| Bachelor's Degree | 0 (0.0%) | 0 (0.0%) |
| Graduate Degree | 0 (0.0%) | 0 (0.0%) |
| Total | 0 (0.0%) | 25 (100.0%) |
Employment Characteristics in Riverdale
Employment by Class of Employer in Riverdale
Among the 1,153 employed individuals in Riverdale, private company employees (671 | 58.2%), self-employed (not incorporated) (202 | 17.5%), and local government employees (135 | 11.7%) make up the most common classes of employment.
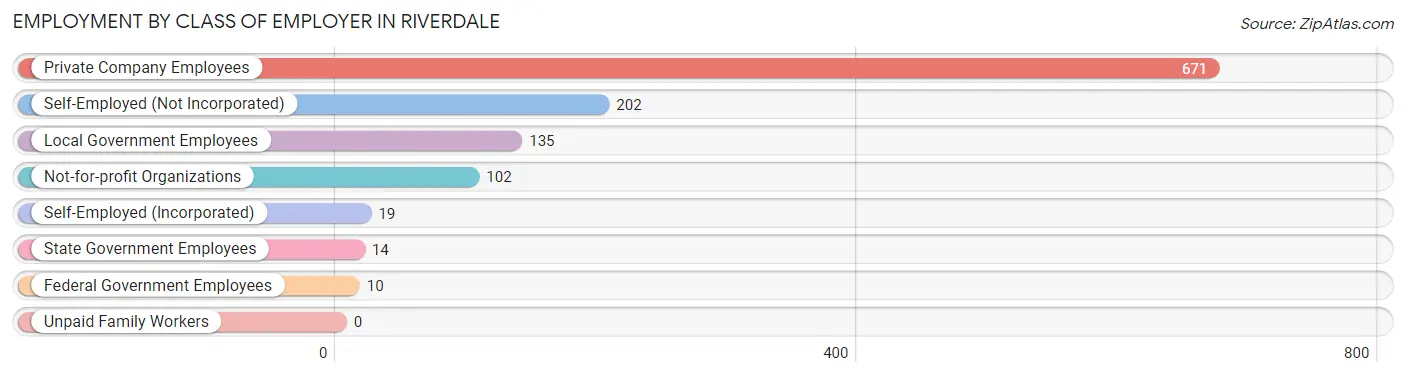
| Employer Class | # Employees | % Employees |
| Private Company Employees | 671 | 58.2% |
| Self-Employed (Incorporated) | 19 | 1.7% |
| Self-Employed (Not Incorporated) | 202 | 17.5% |
| Not-for-profit Organizations | 102 | 8.8% |
| Local Government Employees | 135 | 11.7% |
| State Government Employees | 14 | 1.2% |
| Federal Government Employees | 10 | 0.9% |
| Unpaid Family Workers | 0 | 0.0% |
| Total | 1,153 | 100.0% |
Employment Status by Age in Riverdale
According to the labor force statistics for Riverdale, out of the total population over 16 years of age (2,088), 58.3% or 1,217 individuals are in the labor force, with 5.3% or 65 of them unemployed. The age group with the highest labor force participation rate is 35 to 44 years, with 85.9% or 220 individuals in the labor force. Within the labor force, the 16 to 19 years age range has the highest percentage of unemployed individuals, with 100.0% or 12 of them being unemployed.
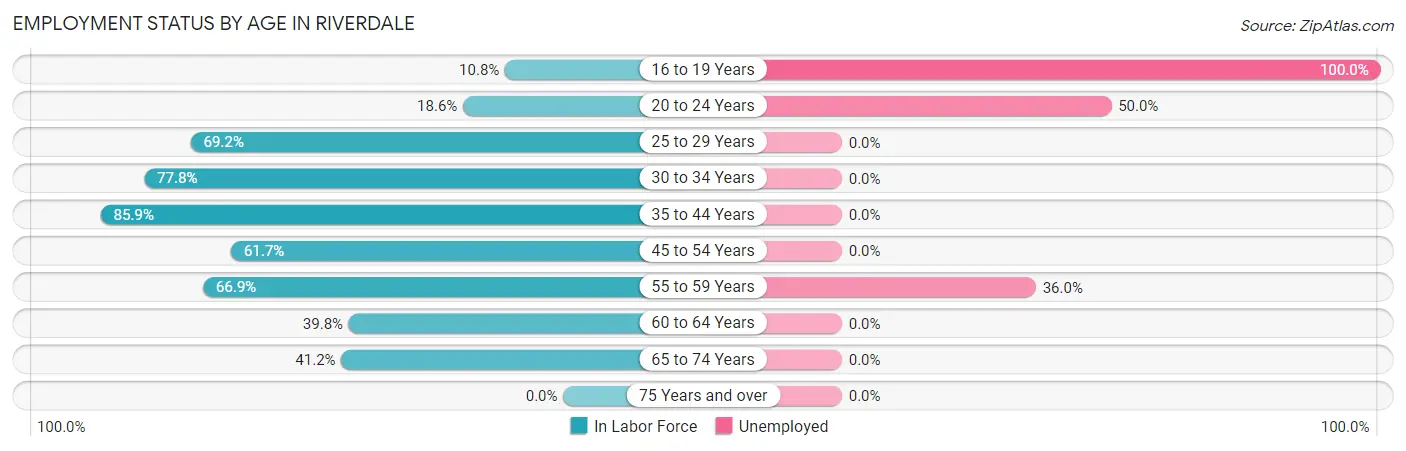
| Age Bracket | In Labor Force | Unemployed |
| 16 to 19 Years | 12 (10.8%) | 12 (100.0%) |
| 20 to 24 Years | 24 (18.6%) | 12 (50.0%) |
| 25 to 29 Years | 285 (69.2%) | 0 (0.0%) |
| 30 to 34 Years | 217 (77.8%) | 0 (0.0%) |
| 35 to 44 Years | 220 (85.9%) | 0 (0.0%) |
| 45 to 54 Years | 243 (61.7%) | 0 (0.0%) |
| 55 to 59 Years | 111 (66.9%) | 40 (36.0%) |
| 60 to 64 Years | 49 (39.8%) | 0 (0.0%) |
| 65 to 74 Years | 56 (41.2%) | 0 (0.0%) |
| 75 Years and over | 0 (0.0%) | 0 (0.0%) |
| Total | 1,217 (58.3%) | 65 (5.3%) |
Employment Status by Educational Attainment in Riverdale
According to labor force statistics for Riverdale, 69.0% of individuals (1,125) out of the total population between 25 and 64 years of age (1,630) are in the labor force, with 3.6% or 40 of them being unemployed. The group with the highest labor force participation rate are those with the educational attainment of bachelor's degree or higher, with 86.2% or 224 individuals in the labor force. Within the labor force, individuals with less than high school education have the highest percentage of unemployment, with 10.0% or 40 of them being unemployed.
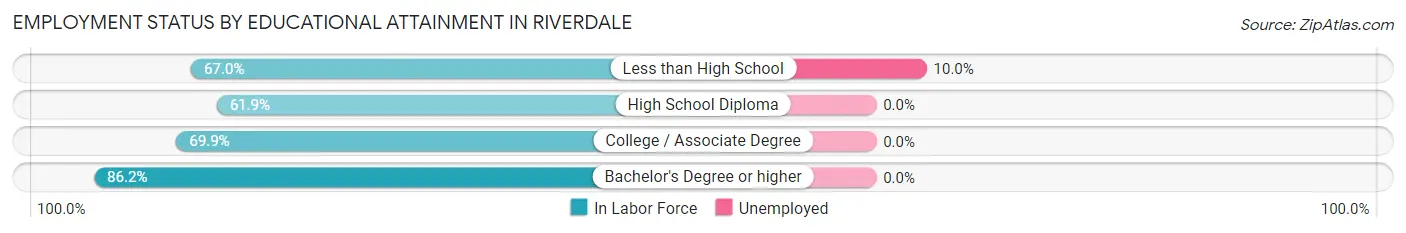
| Educational Attainment | In Labor Force | Unemployed |
| Less than High School | 402 (67.0%) | 60 (10.0%) |
| High School Diploma | 306 (61.9%) | 0 (0.0%) |
| College / Associate Degree | 193 (69.9%) | 0 (0.0%) |
| Bachelor's Degree or higher | 224 (86.2%) | 0 (0.0%) |
| Total | 1,125 (69.0%) | 59 (3.6%) |
Employment Occupations by Sex in Riverdale
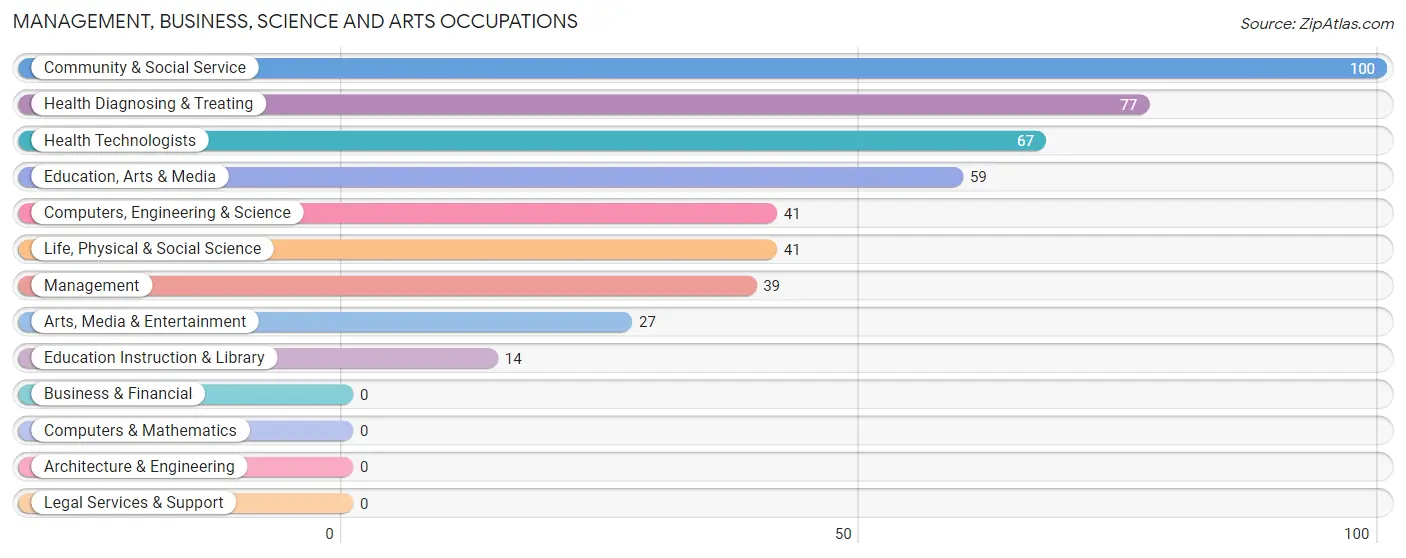
Management, Business, Science and Arts Occupations
The most common Management, Business, Science and Arts occupations in Riverdale are Community & Social Service (100 | 8.7%), Health Diagnosing & Treating (77 | 6.7%), Health Technologists (67 | 5.9%), Education, Arts & Media (59 | 5.2%), and Computers, Engineering & Science (41 | 3.6%).
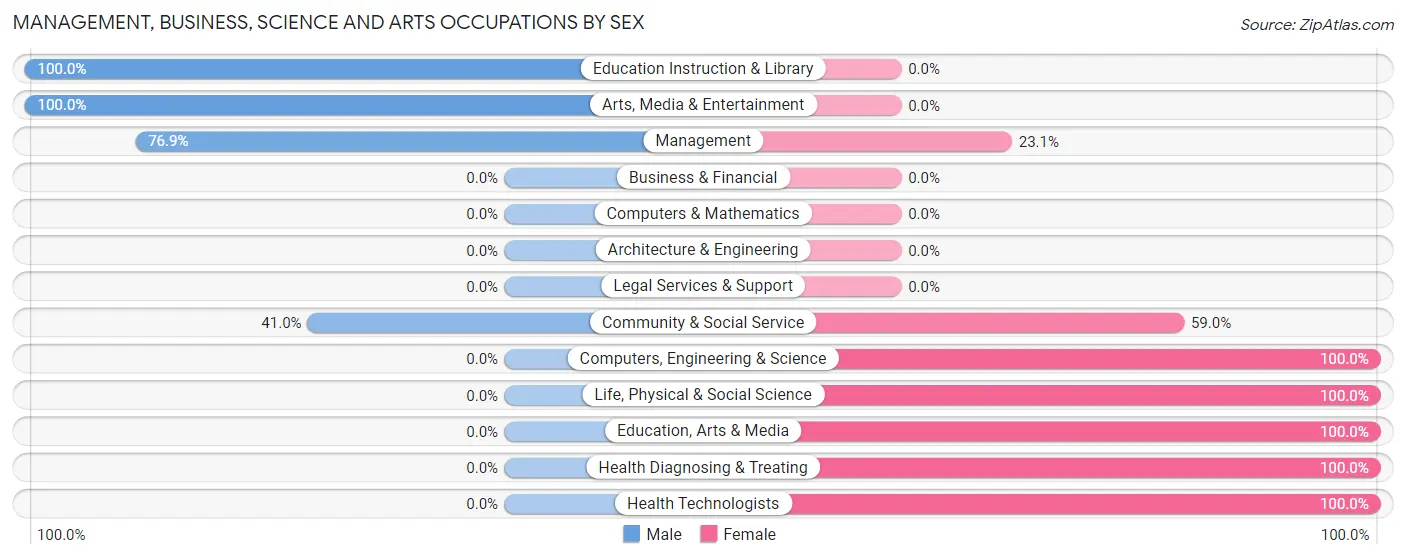
Management, Business, Science and Arts Occupations by Sex
Within the Management, Business, Science and Arts occupations in Riverdale, the most male-oriented occupations are Education Instruction & Library (100.0%), Arts, Media & Entertainment (100.0%), and Management (76.9%), while the most female-oriented occupations are Computers, Engineering & Science (100.0%), Life, Physical & Social Science (100.0%), and Education, Arts & Media (100.0%).
| Occupation | Male | Female |
| Management | 30 (76.9%) | 9 (23.1%) |
| Business & Financial | 0 (0.0%) | 0 (0.0%) |
| Computers, Engineering & Science | 0 (0.0%) | 41 (100.0%) |
| Computers & Mathematics | 0 (0.0%) | 0 (0.0%) |
| Architecture & Engineering | 0 (0.0%) | 0 (0.0%) |
| Life, Physical & Social Science | 0 (0.0%) | 41 (100.0%) |
| Community & Social Service | 41 (41.0%) | 59 (59.0%) |
| Education, Arts & Media | 0 (0.0%) | 59 (100.0%) |
| Legal Services & Support | 0 (0.0%) | 0 (0.0%) |
| Education Instruction & Library | 14 (100.0%) | 0 (0.0%) |
| Arts, Media & Entertainment | 27 (100.0%) | 0 (0.0%) |
| Health Diagnosing & Treating | 0 (0.0%) | 77 (100.0%) |
| Health Technologists | 0 (0.0%) | 67 (100.0%) |
| Total (Category) | 71 (27.6%) | 186 (72.4%) |
| Total (Overall) | 675 (59.1%) | 468 (40.9%) |
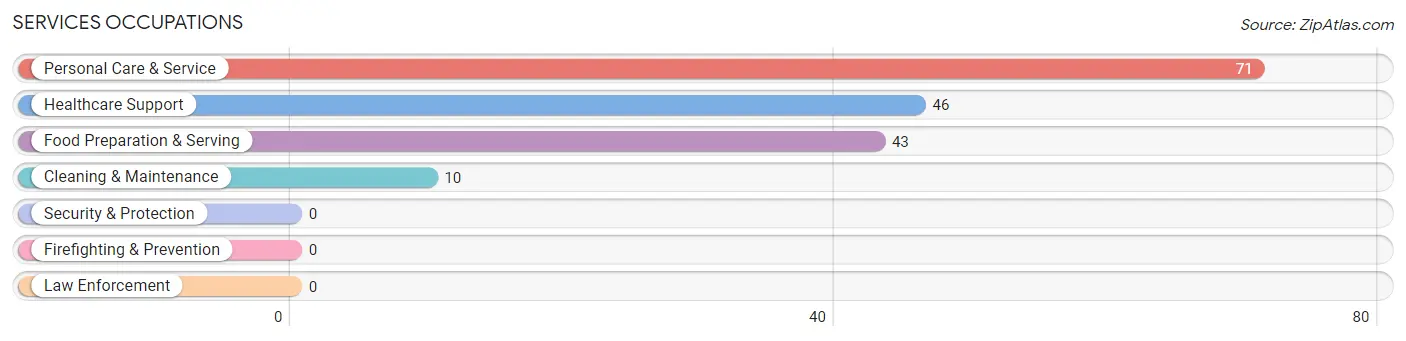
Services Occupations
The most common Services occupations in Riverdale are Personal Care & Service (71 | 6.2%), Healthcare Support (46 | 4.0%), Food Preparation & Serving (43 | 3.8%), and Cleaning & Maintenance (10 | 0.9%).
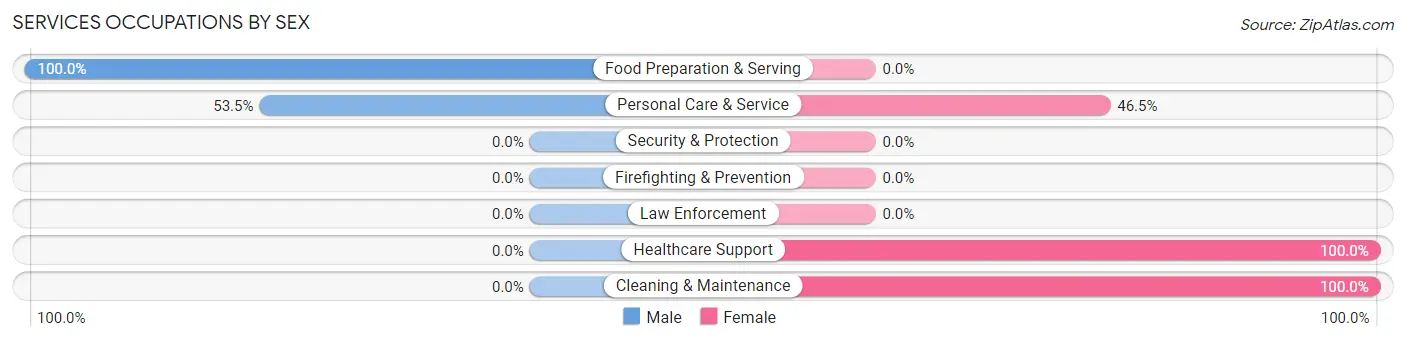
Services Occupations by Sex
Within the Services occupations in Riverdale, the most male-oriented occupations are Food Preparation & Serving (100.0%), and Personal Care & Service (53.5%), while the most female-oriented occupations are Healthcare Support (100.0%), Cleaning & Maintenance (100.0%), and Personal Care & Service (46.5%).
| Occupation | Male | Female |
| Healthcare Support | 0 (0.0%) | 46 (100.0%) |
| Security & Protection | 0 (0.0%) | 0 (0.0%) |
| Firefighting & Prevention | 0 (0.0%) | 0 (0.0%) |
| Law Enforcement | 0 (0.0%) | 0 (0.0%) |
| Food Preparation & Serving | 43 (100.0%) | 0 (0.0%) |
| Cleaning & Maintenance | 0 (0.0%) | 10 (100.0%) |
| Personal Care & Service | 38 (53.5%) | 33 (46.5%) |
| Total (Category) | 81 (47.6%) | 89 (52.3%) |
| Total (Overall) | 675 (59.1%) | 468 (40.9%) |
Sales and Office Occupations
The most common Sales and Office occupations in Riverdale are Office & Administration (119 | 10.4%), and Sales & Related (44 | 3.8%).
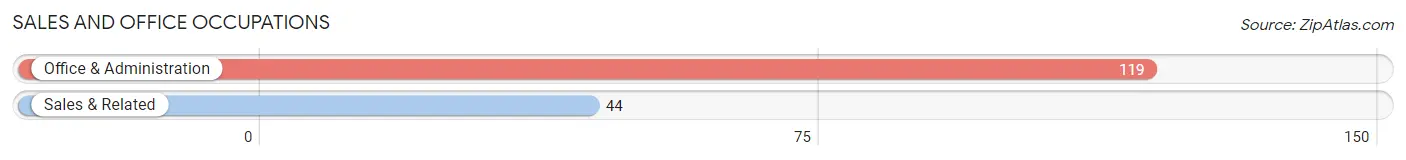
Sales and Office Occupations by Sex

| Occupation | Male | Female |
| Sales & Related | 44 (100.0%) | 0 (0.0%) |
| Office & Administration | 31 (26.1%) | 88 (74.0%) |
| Total (Category) | 75 (46.0%) | 88 (54.0%) |
| Total (Overall) | 675 (59.1%) | 468 (40.9%) |
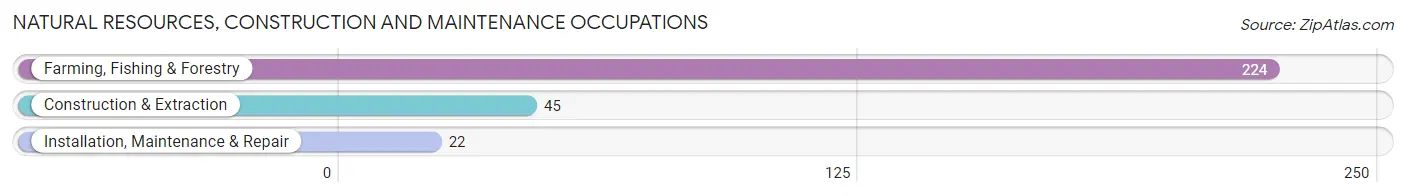
Natural Resources, Construction and Maintenance Occupations
The most common Natural Resources, Construction and Maintenance occupations in Riverdale are Farming, Fishing & Forestry (224 | 19.6%), Construction & Extraction (45 | 3.9%), and Installation, Maintenance & Repair (22 | 1.9%).
Natural Resources, Construction and Maintenance Occupations by Sex
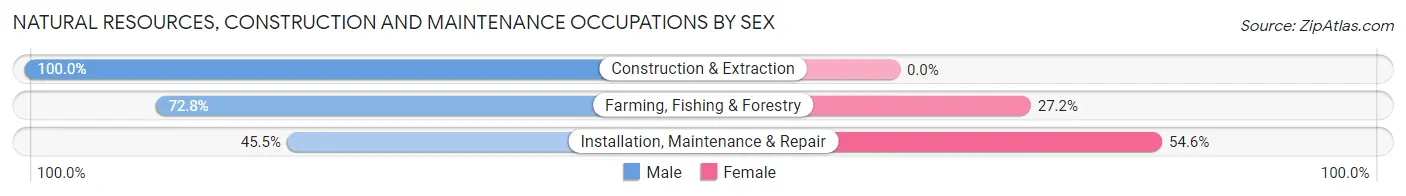
| Occupation | Male | Female |
| Farming, Fishing & Forestry | 163 (72.8%) | 61 (27.2%) |
| Construction & Extraction | 45 (100.0%) | 0 (0.0%) |
| Installation, Maintenance & Repair | 10 (45.5%) | 12 (54.5%) |
| Total (Category) | 218 (74.9%) | 73 (25.1%) |
| Total (Overall) | 675 (59.1%) | 468 (40.9%) |
Production, Transportation and Moving Occupations
The most common Production, Transportation and Moving occupations in Riverdale are Production (141 | 12.3%), Transportation (97 | 8.5%), and Material Moving (24 | 2.1%).
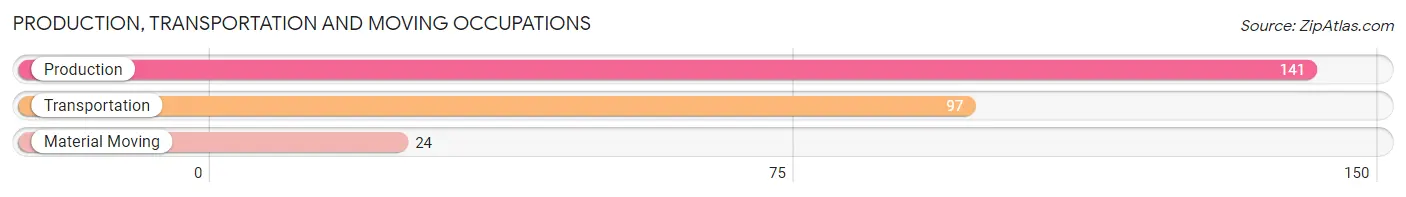
Production, Transportation and Moving Occupations by Sex
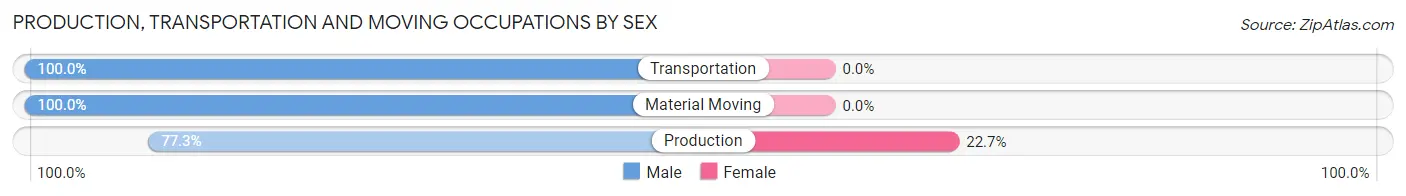
| Occupation | Male | Female |
| Production | 109 (77.3%) | 32 (22.7%) |
| Transportation | 97 (100.0%) | 0 (0.0%) |
| Material Moving | 24 (100.0%) | 0 (0.0%) |
| Total (Category) | 230 (87.8%) | 32 (12.2%) |
| Total (Overall) | 675 (59.1%) | 468 (40.9%) |
Employment Industries by Sex in Riverdale
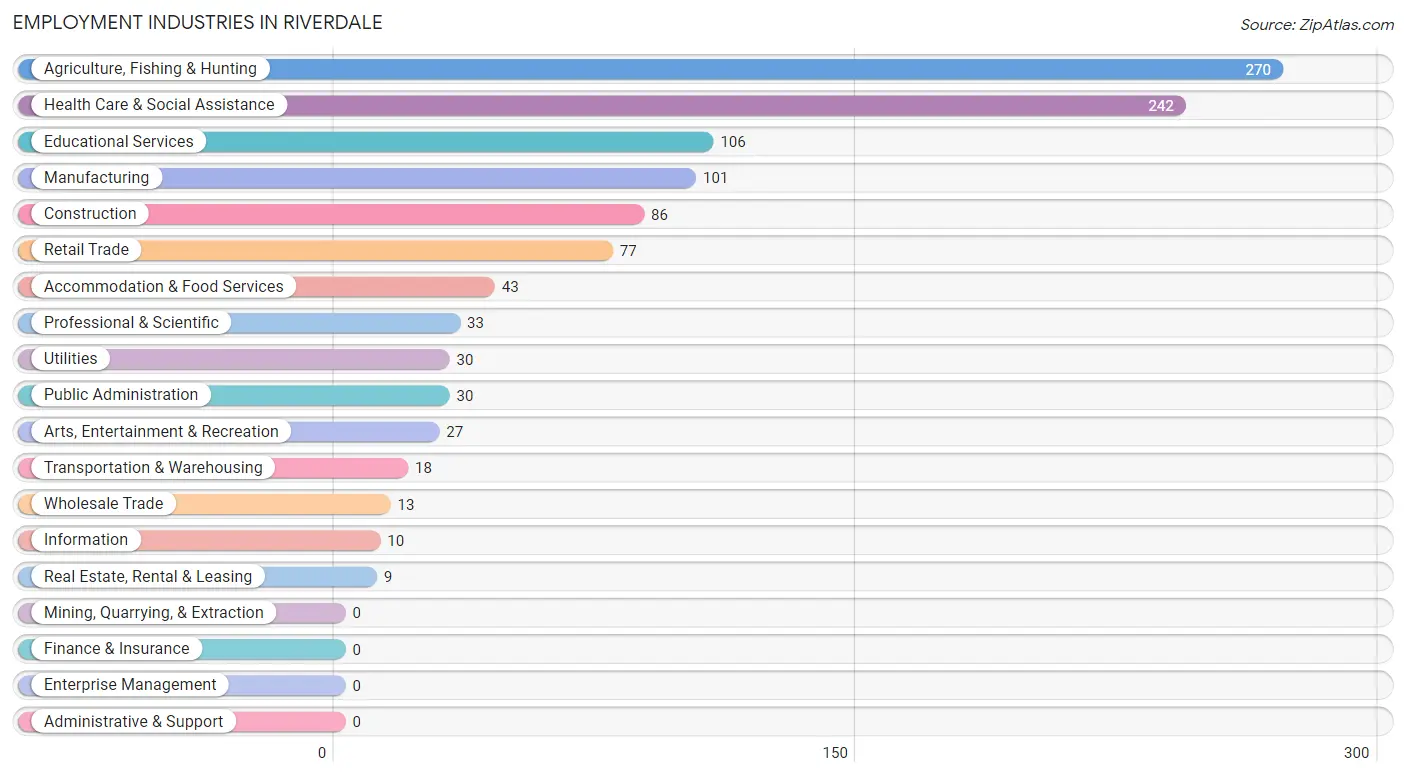
Employment Industries in Riverdale
The major employment industries in Riverdale include Agriculture, Fishing & Hunting (270 | 23.6%), Health Care & Social Assistance (242 | 21.2%), Educational Services (106 | 9.3%), Manufacturing (101 | 8.8%), and Construction (86 | 7.5%).
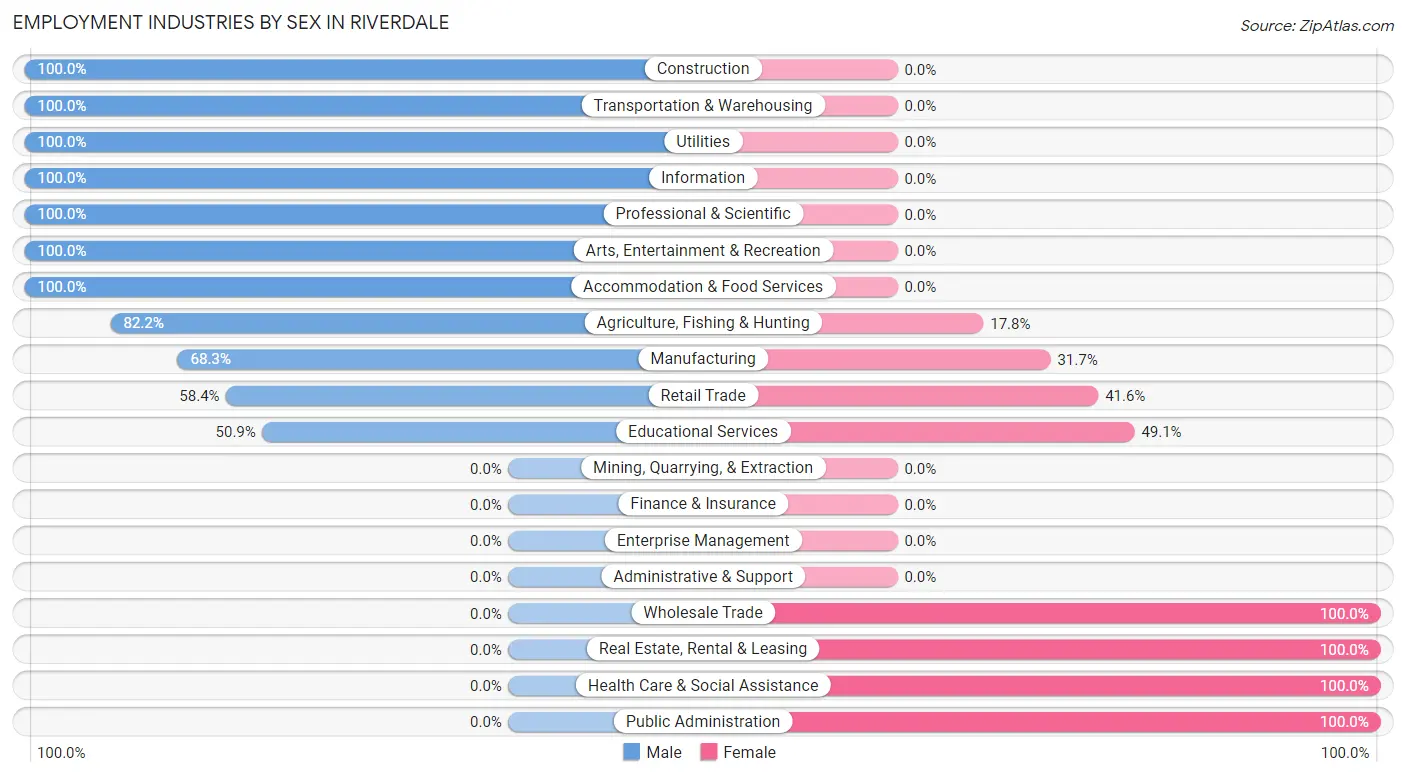
Employment Industries by Sex in Riverdale
The Riverdale industries that see more men than women are Construction (100.0%), Transportation & Warehousing (100.0%), and Utilities (100.0%), whereas the industries that tend to have a higher number of women are Wholesale Trade (100.0%), Real Estate, Rental & Leasing (100.0%), and Health Care & Social Assistance (100.0%).
| Industry | Male | Female |
| Agriculture, Fishing & Hunting | 222 (82.2%) | 48 (17.8%) |
| Mining, Quarrying, & Extraction | 0 (0.0%) | 0 (0.0%) |
| Construction | 86 (100.0%) | 0 (0.0%) |
| Manufacturing | 69 (68.3%) | 32 (31.7%) |
| Wholesale Trade | 0 (0.0%) | 13 (100.0%) |
| Retail Trade | 45 (58.4%) | 32 (41.6%) |
| Transportation & Warehousing | 18 (100.0%) | 0 (0.0%) |
| Utilities | 30 (100.0%) | 0 (0.0%) |
| Information | 10 (100.0%) | 0 (0.0%) |
| Finance & Insurance | 0 (0.0%) | 0 (0.0%) |
| Real Estate, Rental & Leasing | 0 (0.0%) | 9 (100.0%) |
| Professional & Scientific | 33 (100.0%) | 0 (0.0%) |
| Enterprise Management | 0 (0.0%) | 0 (0.0%) |
| Administrative & Support | 0 (0.0%) | 0 (0.0%) |
| Educational Services | 54 (50.9%) | 52 (49.1%) |
| Health Care & Social Assistance | 0 (0.0%) | 242 (100.0%) |
| Arts, Entertainment & Recreation | 27 (100.0%) | 0 (0.0%) |
| Accommodation & Food Services | 43 (100.0%) | 0 (0.0%) |
| Public Administration | 0 (0.0%) | 30 (100.0%) |
| Total | 675 (59.1%) | 468 (40.9%) |
Education in Riverdale
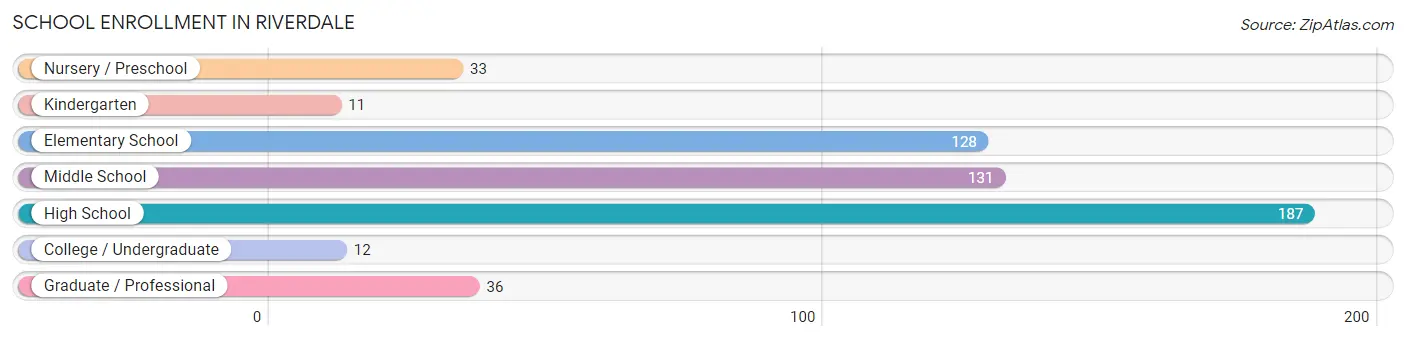
School Enrollment in Riverdale
The most common levels of schooling among the 538 students in Riverdale are high school (187 | 34.8%), middle school (131 | 24.3%), and elementary school (128 | 23.8%).
| School Level | # Students | % Students |
| Nursery / Preschool | 33 | 6.1% |
| Kindergarten | 11 | 2.0% |
| Elementary School | 128 | 23.8% |
| Middle School | 131 | 24.3% |
| High School | 187 | 34.8% |
| College / Undergraduate | 12 | 2.2% |
| Graduate / Professional | 36 | 6.7% |
| Total | 538 | 100.0% |
School Enrollment by Age by Funding Source in Riverdale
Out of a total of 538 students who are enrolled in schools in Riverdale, 62 (11.5%) attend a private institution, while the remaining 476 (88.5%) are enrolled in public schools. The age group of 18 to 19 year olds has the highest likelihood of being enrolled in private schools, with 30 (100.0% in the age bracket) enrolled. Conversely, the age group of 3 to 4 year olds has the lowest likelihood of being enrolled in a private school, with 33 (100.0% in the age bracket) attending a public institution.
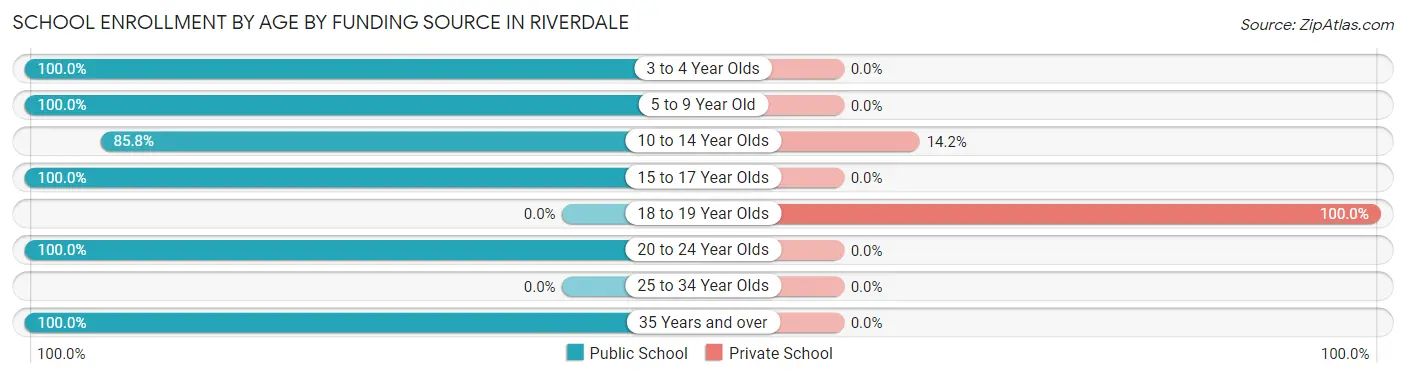
| Age Bracket | Public School | Private School |
| 3 to 4 Year Olds | 33 (100.0%) | 0 (0.0%) |
| 5 to 9 Year Old | 88 (100.0%) | 0 (0.0%) |
| 10 to 14 Year Olds | 194 (85.8%) | 32 (14.2%) |
| 15 to 17 Year Olds | 113 (100.0%) | 0 (0.0%) |
| 18 to 19 Year Olds | 0 (0.0%) | 30 (100.0%) |
| 20 to 24 Year Olds | 12 (100.0%) | 0 (0.0%) |
| 25 to 34 Year Olds | 0 (0.0%) | 0 (0.0%) |
| 35 Years and over | 36 (100.0%) | 0 (0.0%) |
| Total | 476 (88.5%) | 62 (11.5%) |
Educational Attainment by Field of Study in Riverdale
Arts & humanities (105 | 39.0%), business (83 | 30.9%), liberal arts & history (36 | 13.4%), computers & mathematics (33 | 12.3%), and visual & performing arts (12 | 4.5%) are the most common fields of study among 269 individuals in Riverdale who have obtained a bachelor's degree or higher.
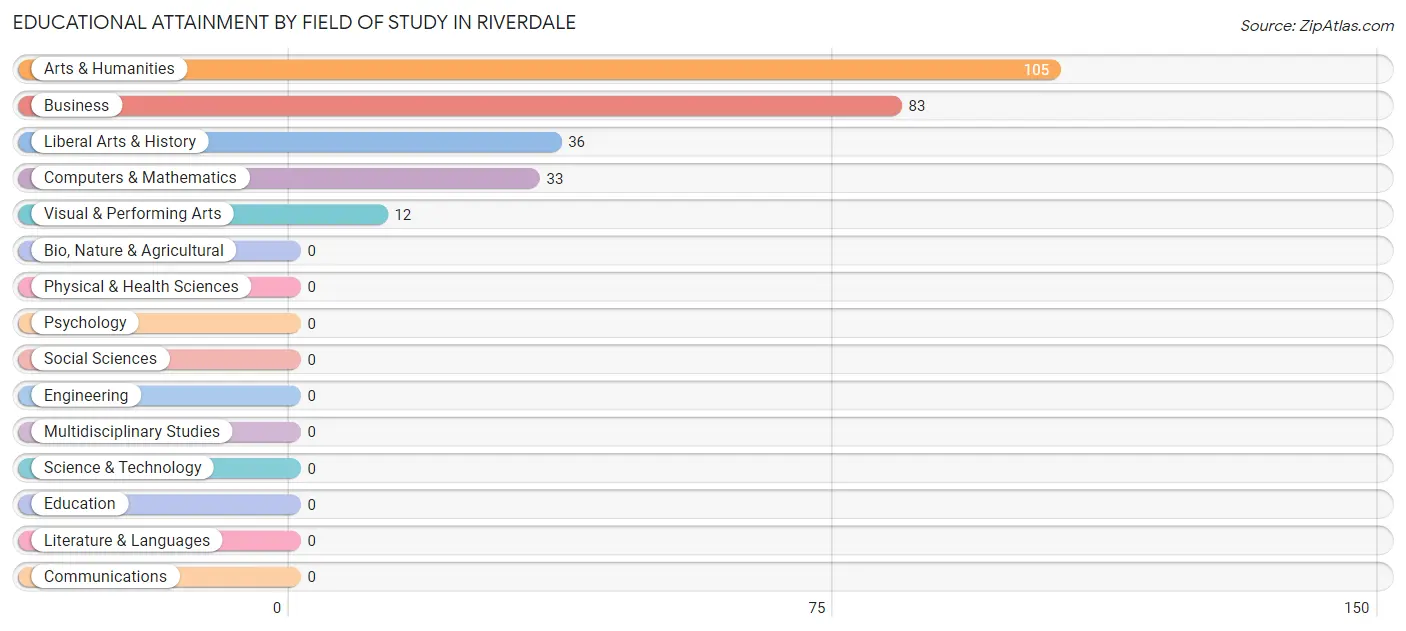
| Field of Study | # Graduates | % Graduates |
| Computers & Mathematics | 33 | 12.3% |
| Bio, Nature & Agricultural | 0 | 0.0% |
| Physical & Health Sciences | 0 | 0.0% |
| Psychology | 0 | 0.0% |
| Social Sciences | 0 | 0.0% |
| Engineering | 0 | 0.0% |
| Multidisciplinary Studies | 0 | 0.0% |
| Science & Technology | 0 | 0.0% |
| Business | 83 | 30.9% |
| Education | 0 | 0.0% |
| Literature & Languages | 0 | 0.0% |
| Liberal Arts & History | 36 | 13.4% |
| Visual & Performing Arts | 12 | 4.5% |
| Communications | 0 | 0.0% |
| Arts & Humanities | 105 | 39.0% |
| Total | 269 | 100.0% |
Transportation & Commute in Riverdale
Vehicle Availability by Sex in Riverdale
The most prevalent vehicle ownership categories in Riverdale are males with 2 vehicles (281, accounting for 41.0%) and females with 2 vehicles (144, making up 60.0%).
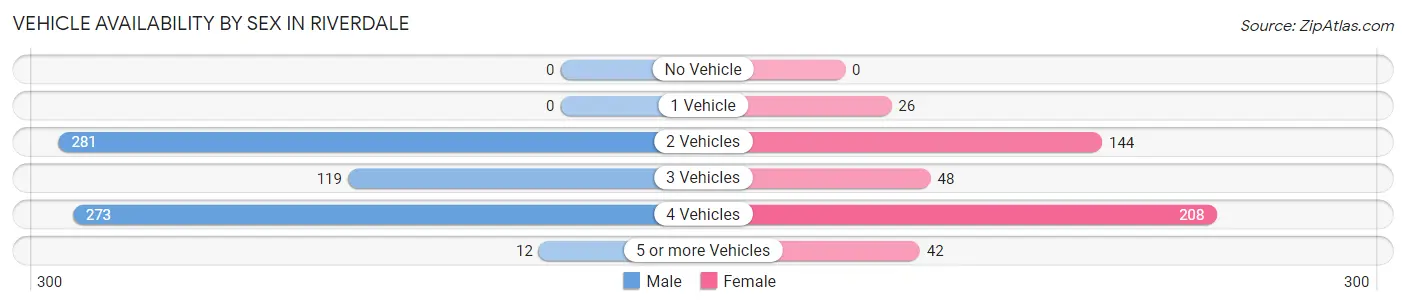
| Vehicles Available | Male | Female |
| No Vehicle | 0 (0.0%) | 0 (0.0%) |
| 1 Vehicle | 0 (0.0%) | 26 (5.6%) |
| 2 Vehicles | 281 (41.0%) | 144 (30.8%) |
| 3 Vehicles | 119 (17.4%) | 48 (10.3%) |
| 4 Vehicles | 273 (39.9%) | 208 (44.4%) |
| 5 or more Vehicles | 12 (1.8%) | 42 (9.0%) |
| Total | 685 (100.0%) | 468 (100.0%) |
Commute Time in Riverdale
The most frequently occuring commute durations in Riverdale are 30 to 34 minutes (251 commuters, 22.8%), 5 to 9 minutes (159 commuters, 14.5%), and 20 to 24 minutes (135 commuters, 12.3%).
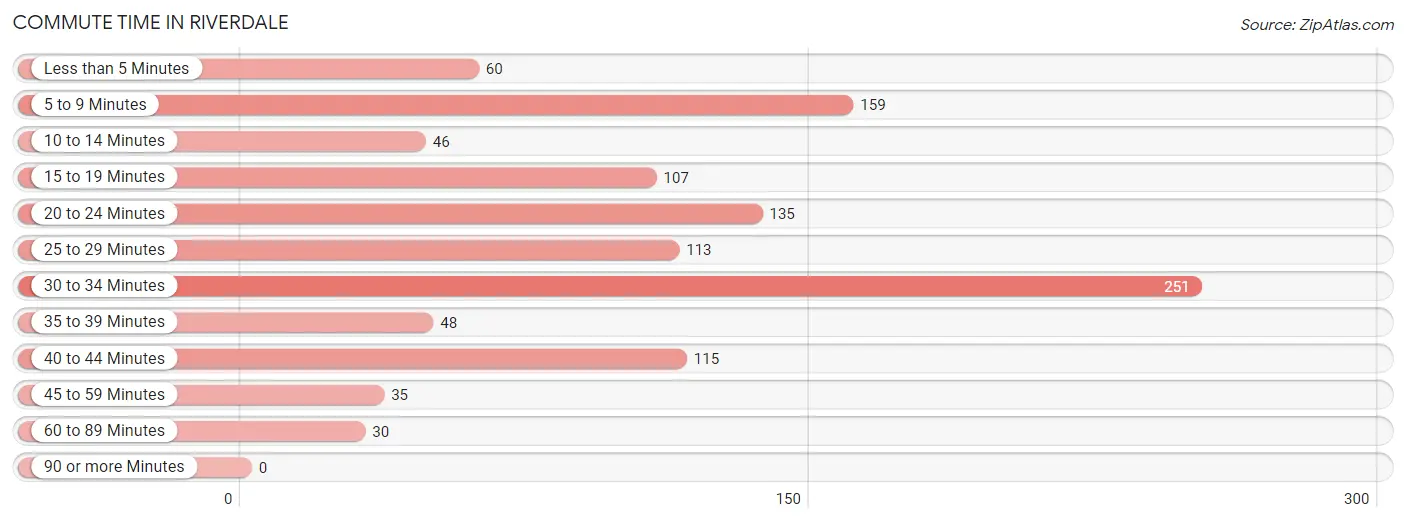
| Commute Time | # Commuters | % Commuters |
| Less than 5 Minutes | 60 | 5.5% |
| 5 to 9 Minutes | 159 | 14.5% |
| 10 to 14 Minutes | 46 | 4.2% |
| 15 to 19 Minutes | 107 | 9.7% |
| 20 to 24 Minutes | 135 | 12.3% |
| 25 to 29 Minutes | 113 | 10.3% |
| 30 to 34 Minutes | 251 | 22.8% |
| 35 to 39 Minutes | 48 | 4.4% |
| 40 to 44 Minutes | 115 | 10.5% |
| 45 to 59 Minutes | 35 | 3.2% |
| 60 to 89 Minutes | 30 | 2.7% |
| 90 or more Minutes | 0 | 0.0% |
Commute Time by Sex in Riverdale
The most common commute times in Riverdale are 15 to 19 minutes (107 commuters, 16.4%) for males and 30 to 34 minutes (145 commuters, 32.4%) for females.
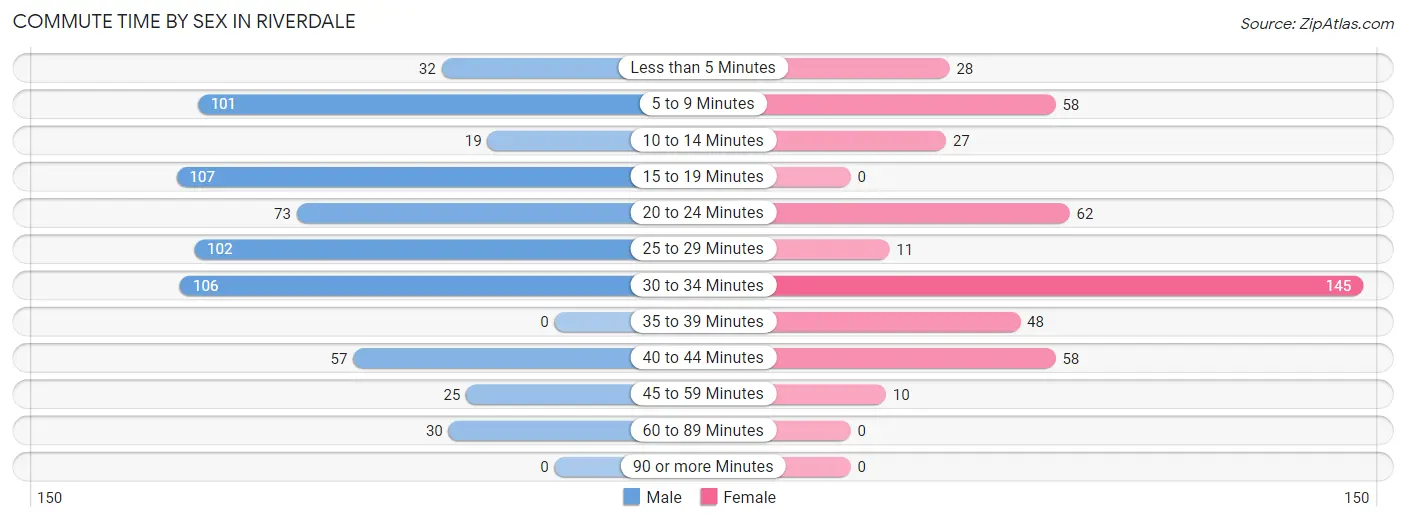
| Commute Time | Male | Female |
| Less than 5 Minutes | 32 (4.9%) | 28 (6.3%) |
| 5 to 9 Minutes | 101 (15.5%) | 58 (13.0%) |
| 10 to 14 Minutes | 19 (2.9%) | 27 (6.0%) |
| 15 to 19 Minutes | 107 (16.4%) | 0 (0.0%) |
| 20 to 24 Minutes | 73 (11.2%) | 62 (13.9%) |
| 25 to 29 Minutes | 102 (15.6%) | 11 (2.5%) |
| 30 to 34 Minutes | 106 (16.3%) | 145 (32.4%) |
| 35 to 39 Minutes | 0 (0.0%) | 48 (10.7%) |
| 40 to 44 Minutes | 57 (8.7%) | 58 (13.0%) |
| 45 to 59 Minutes | 25 (3.8%) | 10 (2.2%) |
| 60 to 89 Minutes | 30 (4.6%) | 0 (0.0%) |
| 90 or more Minutes | 0 (0.0%) | 0 (0.0%) |
Time of Departure to Work by Sex in Riverdale
The most frequent times of departure to work in Riverdale are 5:00 AM to 5:29 AM (154, 23.6%) for males and 5:00 AM to 5:29 AM (115, 25.7%) for females.
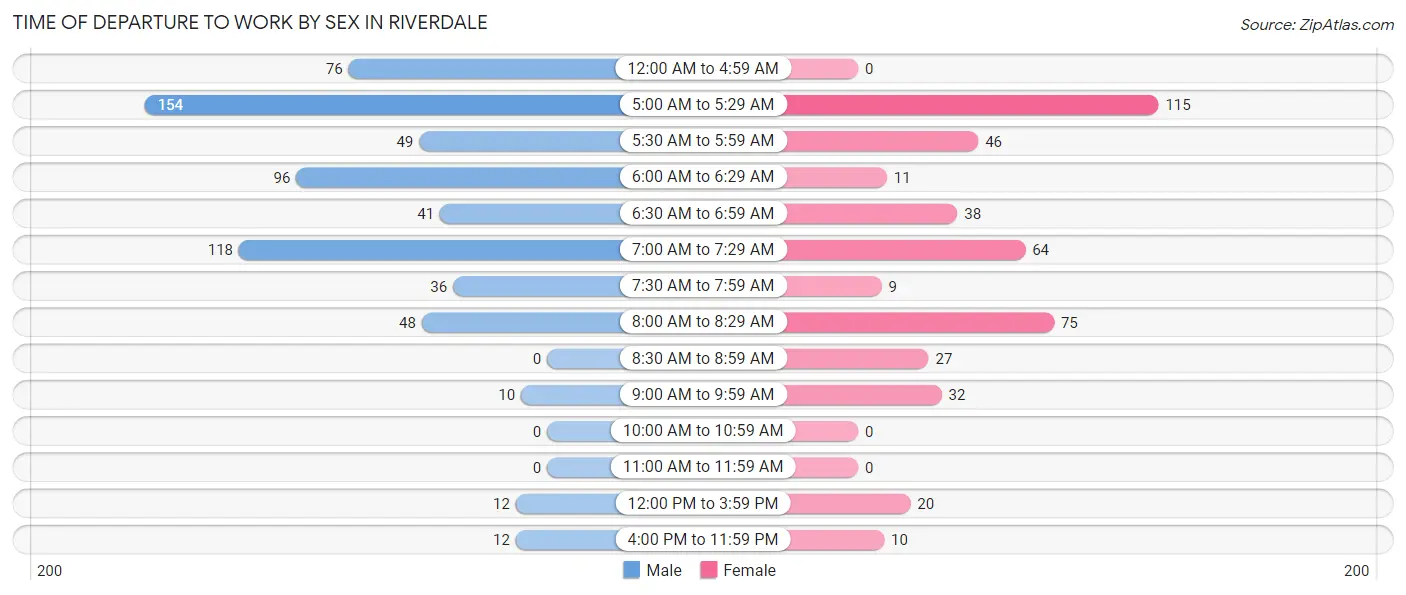
| Time of Departure | Male | Female |
| 12:00 AM to 4:59 AM | 76 (11.7%) | 0 (0.0%) |
| 5:00 AM to 5:29 AM | 154 (23.6%) | 115 (25.7%) |
| 5:30 AM to 5:59 AM | 49 (7.5%) | 46 (10.3%) |
| 6:00 AM to 6:29 AM | 96 (14.7%) | 11 (2.5%) |
| 6:30 AM to 6:59 AM | 41 (6.3%) | 38 (8.5%) |
| 7:00 AM to 7:29 AM | 118 (18.1%) | 64 (14.3%) |
| 7:30 AM to 7:59 AM | 36 (5.5%) | 9 (2.0%) |
| 8:00 AM to 8:29 AM | 48 (7.4%) | 75 (16.8%) |
| 8:30 AM to 8:59 AM | 0 (0.0%) | 27 (6.0%) |
| 9:00 AM to 9:59 AM | 10 (1.5%) | 32 (7.2%) |
| 10:00 AM to 10:59 AM | 0 (0.0%) | 0 (0.0%) |
| 11:00 AM to 11:59 AM | 0 (0.0%) | 0 (0.0%) |
| 12:00 PM to 3:59 PM | 12 (1.8%) | 20 (4.5%) |
| 4:00 PM to 11:59 PM | 12 (1.8%) | 10 (2.2%) |
| Total | 652 (100.0%) | 447 (100.0%) |
Housing Occupancy in Riverdale
Occupancy by Ownership in Riverdale
Of the total 699 dwellings in Riverdale, owner-occupied units account for 432 (61.8%), while renter-occupied units make up 267 (38.2%).
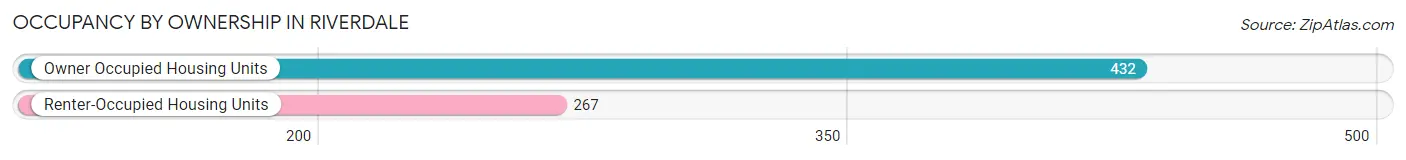
| Occupancy | # Housing Units | % Housing Units |
| Owner Occupied Housing Units | 432 | 61.8% |
| Renter-Occupied Housing Units | 267 | 38.2% |
| Total Occupied Housing Units | 699 | 100.0% |
Occupancy by Household Size in Riverdale
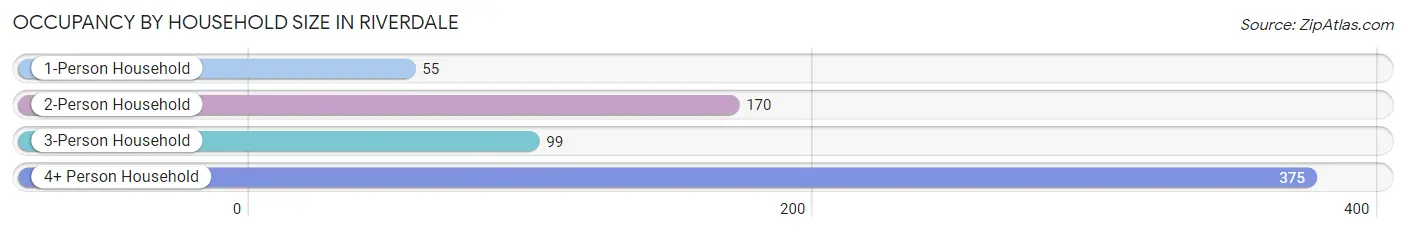
| Household Size | # Housing Units | % Housing Units |
| 1-Person Household | 55 | 7.9% |
| 2-Person Household | 170 | 24.3% |
| 3-Person Household | 99 | 14.2% |
| 4+ Person Household | 375 | 53.6% |
| Total Housing Units | 699 | 100.0% |
Occupancy by Ownership by Household Size in Riverdale
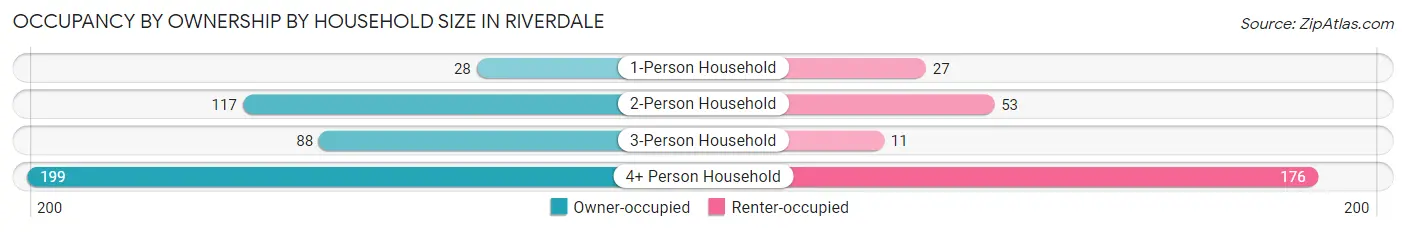
| Household Size | Owner-occupied | Renter-occupied |
| 1-Person Household | 28 (50.9%) | 27 (49.1%) |
| 2-Person Household | 117 (68.8%) | 53 (31.2%) |
| 3-Person Household | 88 (88.9%) | 11 (11.1%) |
| 4+ Person Household | 199 (53.1%) | 176 (46.9%) |
| Total Housing Units | 432 (61.8%) | 267 (38.2%) |
Occupancy by Educational Attainment in Riverdale
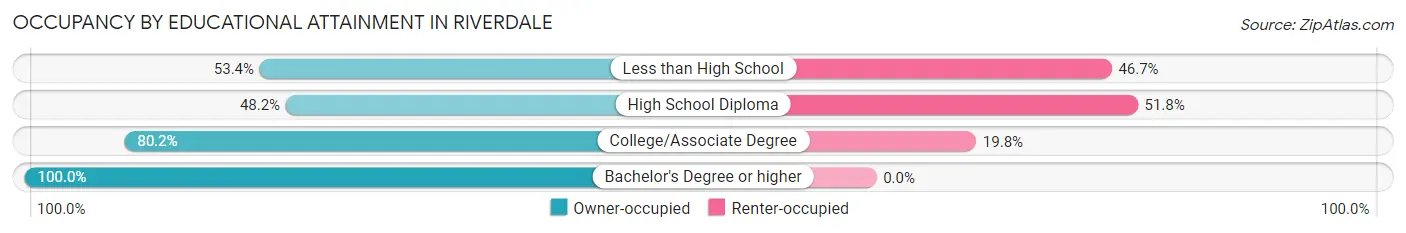
| Household Size | Owner-occupied | Renter-occupied |
| Less than High School | 183 (53.3%) | 160 (46.7%) |
| High School Diploma | 66 (48.2%) | 71 (51.8%) |
| College/Associate Degree | 146 (80.2%) | 36 (19.8%) |
| Bachelor's Degree or higher | 37 (100.0%) | 0 (0.0%) |
Occupancy by Age of Householder in Riverdale
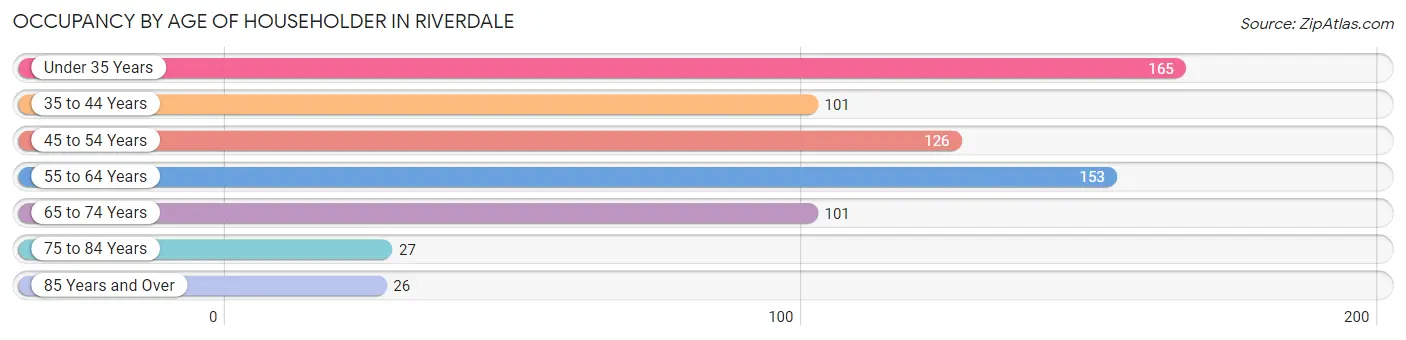
| Age Bracket | # Households | % Households |
| Under 35 Years | 165 | 23.6% |
| 35 to 44 Years | 101 | 14.4% |
| 45 to 54 Years | 126 | 18.0% |
| 55 to 64 Years | 153 | 21.9% |
| 65 to 74 Years | 101 | 14.4% |
| 75 to 84 Years | 27 | 3.9% |
| 85 Years and Over | 26 | 3.7% |
| Total | 699 | 100.0% |
Housing Finances in Riverdale
Median Income by Occupancy in Riverdale
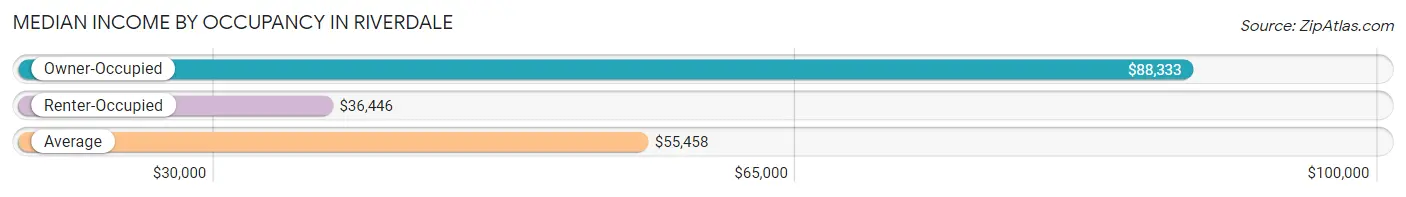
| Occupancy Type | # Households | Median Income |
| Owner-Occupied | 432 (61.8%) | $88,333 |
| Renter-Occupied | 267 (38.2%) | $36,446 |
| Average | 699 (100.0%) | $55,458 |
Occupancy by Householder Income Bracket in Riverdale
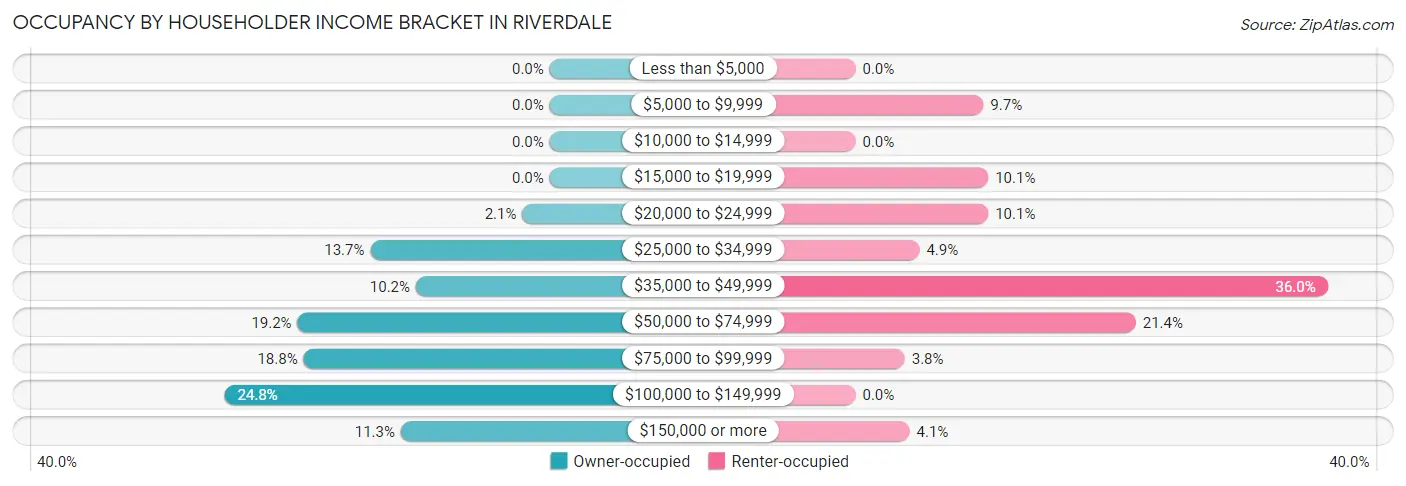
| Income Bracket | Owner-occupied | Renter-occupied |
| Less than $5,000 | 0 (0.0%) | 0 (0.0%) |
| $5,000 to $9,999 | 0 (0.0%) | 26 (9.7%) |
| $10,000 to $14,999 | 0 (0.0%) | 0 (0.0%) |
| $15,000 to $19,999 | 0 (0.0%) | 27 (10.1%) |
| $20,000 to $24,999 | 9 (2.1%) | 27 (10.1%) |
| $25,000 to $34,999 | 59 (13.7%) | 13 (4.9%) |
| $35,000 to $49,999 | 44 (10.2%) | 96 (36.0%) |
| $50,000 to $74,999 | 83 (19.2%) | 57 (21.3%) |
| $75,000 to $99,999 | 81 (18.8%) | 10 (3.7%) |
| $100,000 to $149,999 | 107 (24.8%) | 0 (0.0%) |
| $150,000 or more | 49 (11.3%) | 11 (4.1%) |
| Total | 432 (100.0%) | 267 (100.0%) |
Monthly Housing Cost Tiers in Riverdale
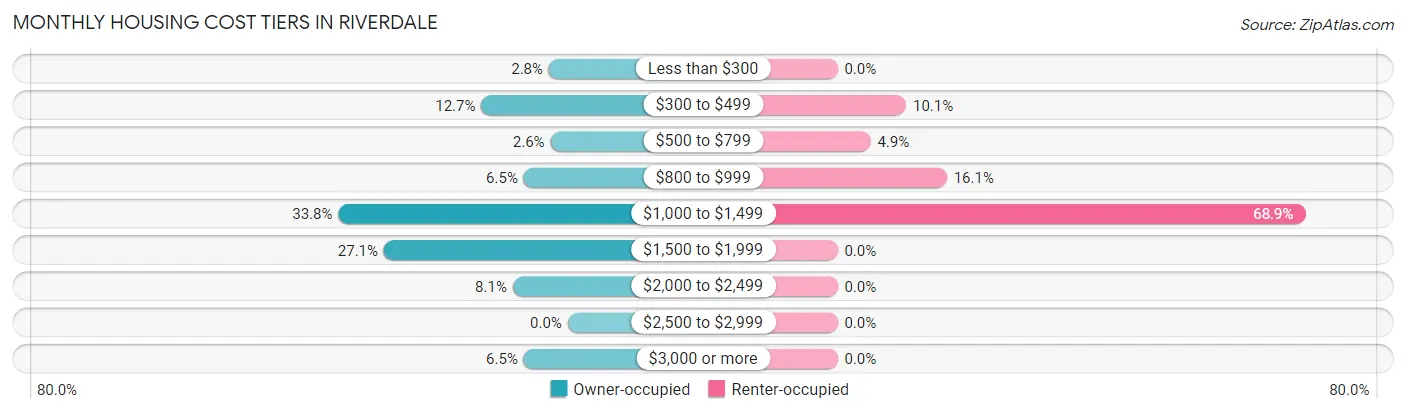
| Monthly Cost | Owner-occupied | Renter-occupied |
| Less than $300 | 12 (2.8%) | 0 (0.0%) |
| $300 to $499 | 55 (12.7%) | 27 (10.1%) |
| $500 to $799 | 11 (2.5%) | 13 (4.9%) |
| $800 to $999 | 28 (6.5%) | 43 (16.1%) |
| $1,000 to $1,499 | 146 (33.8%) | 184 (68.9%) |
| $1,500 to $1,999 | 117 (27.1%) | 0 (0.0%) |
| $2,000 to $2,499 | 35 (8.1%) | 0 (0.0%) |
| $2,500 to $2,999 | 0 (0.0%) | 0 (0.0%) |
| $3,000 or more | 28 (6.5%) | 0 (0.0%) |
| Total | 432 (100.0%) | 267 (100.0%) |
Physical Housing Characteristics in Riverdale
Housing Structures in Riverdale
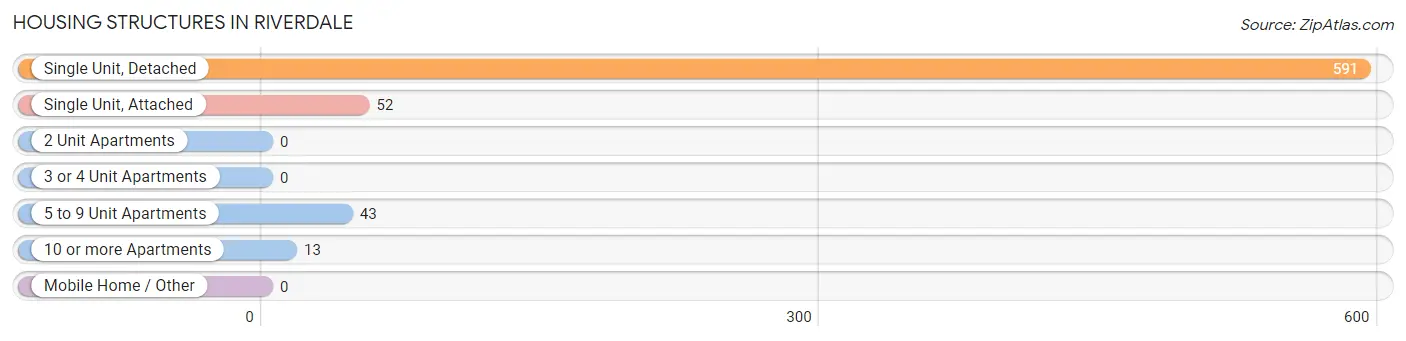
| Structure Type | # Housing Units | % Housing Units |
| Single Unit, Detached | 591 | 84.6% |
| Single Unit, Attached | 52 | 7.4% |
| 2 Unit Apartments | 0 | 0.0% |
| 3 or 4 Unit Apartments | 0 | 0.0% |
| 5 to 9 Unit Apartments | 43 | 6.1% |
| 10 or more Apartments | 13 | 1.9% |
| Mobile Home / Other | 0 | 0.0% |
| Total | 699 | 100.0% |
Housing Structures by Occupancy in Riverdale
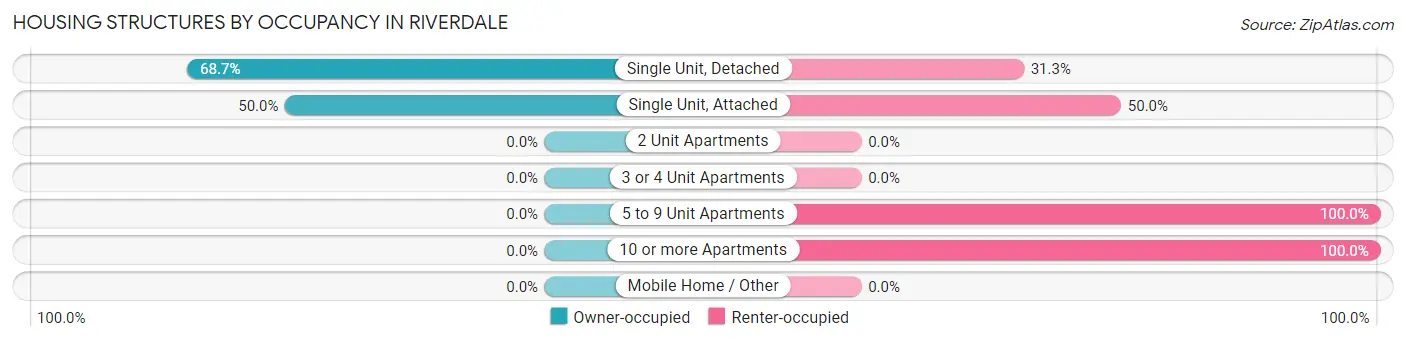
| Structure Type | Owner-occupied | Renter-occupied |
| Single Unit, Detached | 406 (68.7%) | 185 (31.3%) |
| Single Unit, Attached | 26 (50.0%) | 26 (50.0%) |
| 2 Unit Apartments | 0 (0.0%) | 0 (0.0%) |
| 3 or 4 Unit Apartments | 0 (0.0%) | 0 (0.0%) |
| 5 to 9 Unit Apartments | 0 (0.0%) | 43 (100.0%) |
| 10 or more Apartments | 0 (0.0%) | 13 (100.0%) |
| Mobile Home / Other | 0 (0.0%) | 0 (0.0%) |
| Total | 432 (61.8%) | 267 (38.2%) |
Housing Structures by Number of Rooms in Riverdale
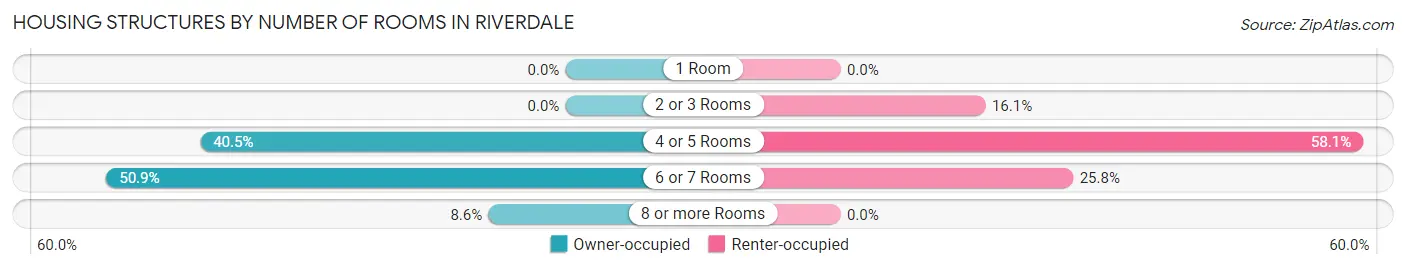
| Number of Rooms | Owner-occupied | Renter-occupied |
| 1 Room | 0 (0.0%) | 0 (0.0%) |
| 2 or 3 Rooms | 0 (0.0%) | 43 (16.1%) |
| 4 or 5 Rooms | 175 (40.5%) | 155 (58.1%) |
| 6 or 7 Rooms | 220 (50.9%) | 69 (25.8%) |
| 8 or more Rooms | 37 (8.6%) | 0 (0.0%) |
| Total | 432 (100.0%) | 267 (100.0%) |
Housing Structure by Heating Type in Riverdale
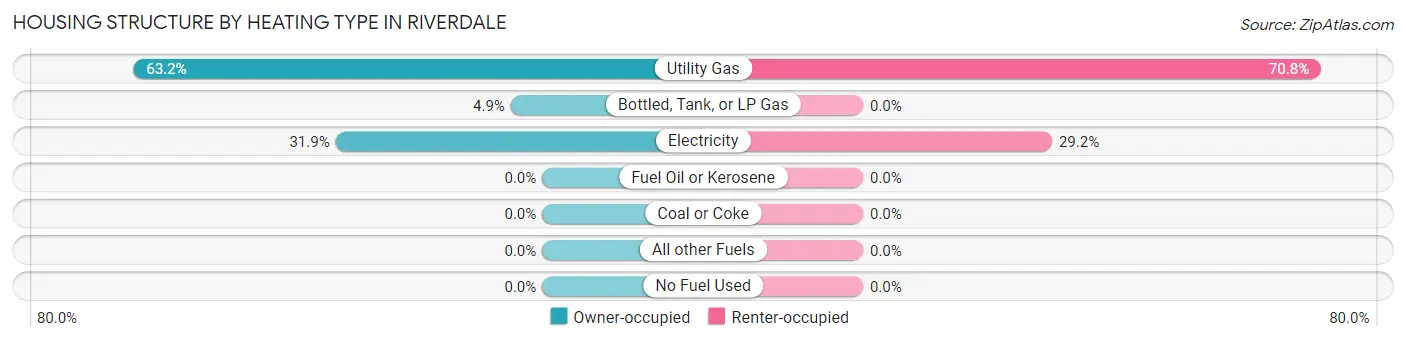
| Heating Type | Owner-occupied | Renter-occupied |
| Utility Gas | 273 (63.2%) | 189 (70.8%) |
| Bottled, Tank, or LP Gas | 21 (4.9%) | 0 (0.0%) |
| Electricity | 138 (31.9%) | 78 (29.2%) |
| Fuel Oil or Kerosene | 0 (0.0%) | 0 (0.0%) |
| Coal or Coke | 0 (0.0%) | 0 (0.0%) |
| All other Fuels | 0 (0.0%) | 0 (0.0%) |
| No Fuel Used | 0 (0.0%) | 0 (0.0%) |
| Total | 432 (100.0%) | 267 (100.0%) |
Household Vehicle Usage in Riverdale
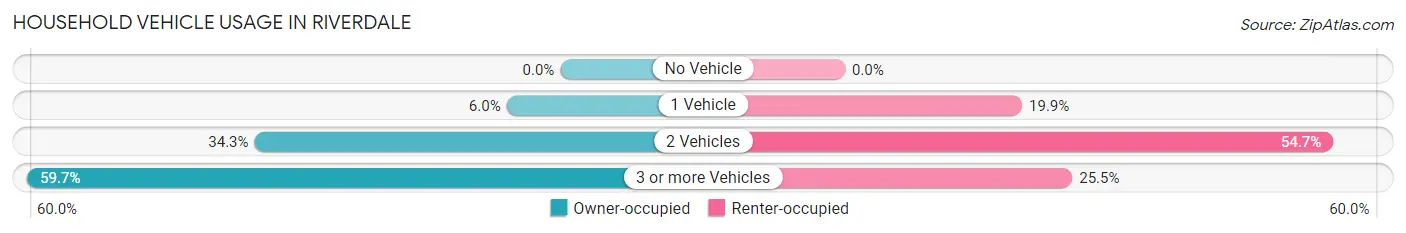
| Vehicles per Household | Owner-occupied | Renter-occupied |
| No Vehicle | 0 (0.0%) | 0 (0.0%) |
| 1 Vehicle | 26 (6.0%) | 53 (19.9%) |
| 2 Vehicles | 148 (34.3%) | 146 (54.7%) |
| 3 or more Vehicles | 258 (59.7%) | 68 (25.5%) |
| Total | 432 (100.0%) | 267 (100.0%) |
Real Estate & Mortgages in Riverdale
Real Estate and Mortgage Overview in Riverdale
| Characteristic | Without Mortgage | With Mortgage |
| Housing Units | 69 | 363 |
| Median Property Value | $223,900 | $253,700 |
| Median Household Income | $86,528 | $38 |
| Monthly Housing Costs | $436 | $28 |
| Real Estate Taxes | $1,179 | $0 |
Property Value by Mortgage Status in Riverdale
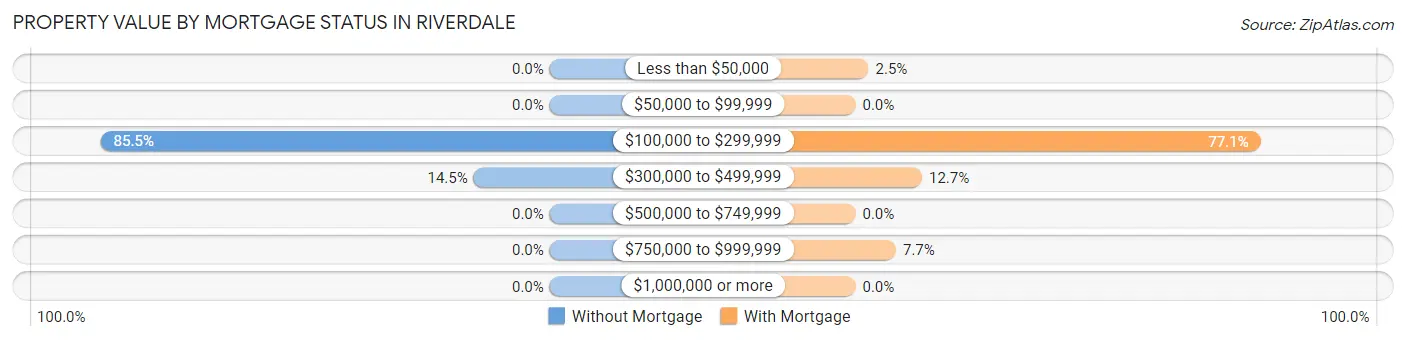
| Property Value | Without Mortgage | With Mortgage |
| Less than $50,000 | 0 (0.0%) | 9 (2.5%) |
| $50,000 to $99,999 | 0 (0.0%) | 0 (0.0%) |
| $100,000 to $299,999 | 59 (85.5%) | 280 (77.1%) |
| $300,000 to $499,999 | 10 (14.5%) | 46 (12.7%) |
| $500,000 to $749,999 | 0 (0.0%) | 0 (0.0%) |
| $750,000 to $999,999 | 0 (0.0%) | 28 (7.7%) |
| $1,000,000 or more | 0 (0.0%) | 0 (0.0%) |
| Total | 69 (100.0%) | 363 (100.0%) |
Household Income by Mortgage Status in Riverdale
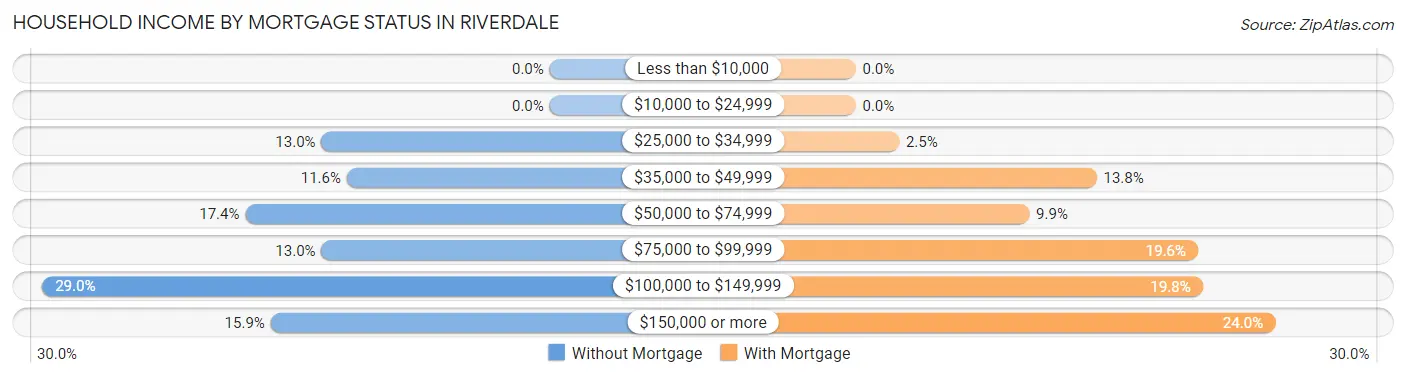
| Household Income | Without Mortgage | With Mortgage |
| Less than $10,000 | 0 (0.0%) | 0 (0.0%) |
| $10,000 to $24,999 | 0 (0.0%) | 0 (0.0%) |
| $25,000 to $34,999 | 9 (13.0%) | 9 (2.5%) |
| $35,000 to $49,999 | 8 (11.6%) | 50 (13.8%) |
| $50,000 to $74,999 | 12 (17.4%) | 36 (9.9%) |
| $75,000 to $99,999 | 9 (13.0%) | 71 (19.6%) |
| $100,000 to $149,999 | 20 (29.0%) | 72 (19.8%) |
| $150,000 or more | 11 (15.9%) | 87 (24.0%) |
| Total | 69 (100.0%) | 363 (100.0%) |
Property Value to Household Income Ratio in Riverdale
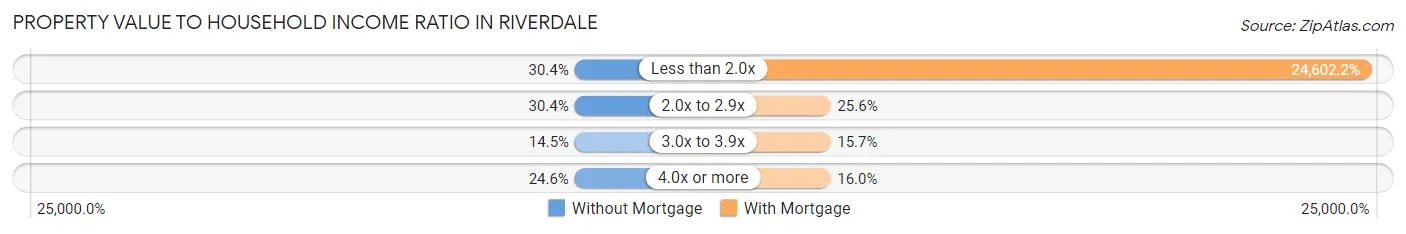
| Value-to-Income Ratio | Without Mortgage | With Mortgage |
| Less than 2.0x | 21 (30.4%) | 89,306 (24,602.2%) |
| 2.0x to 2.9x | 21 (30.4%) | 93 (25.6%) |
| 3.0x to 3.9x | 10 (14.5%) | 57 (15.7%) |
| 4.0x or more | 17 (24.6%) | 58 (16.0%) |
| Total | 69 (100.0%) | 363 (100.0%) |
Real Estate Taxes by Mortgage Status in Riverdale
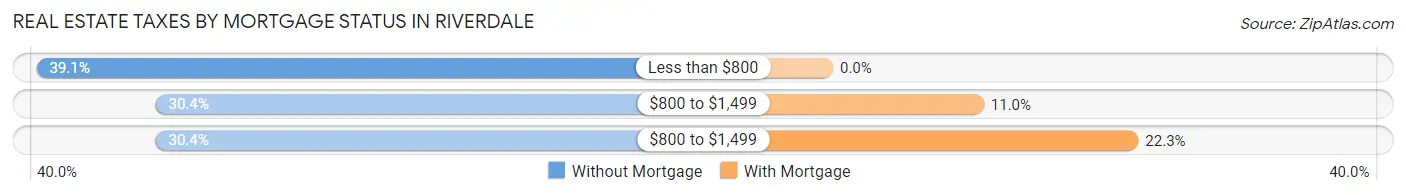
| Property Taxes | Without Mortgage | With Mortgage |
| Less than $800 | 27 (39.1%) | 0 (0.0%) |
| $800 to $1,499 | 21 (30.4%) | 40 (11.0%) |
| $800 to $1,499 | 21 (30.4%) | 81 (22.3%) |
| Total | 69 (100.0%) | 363 (100.0%) |
Health & Disability in Riverdale
Health Insurance Coverage by Age in Riverdale
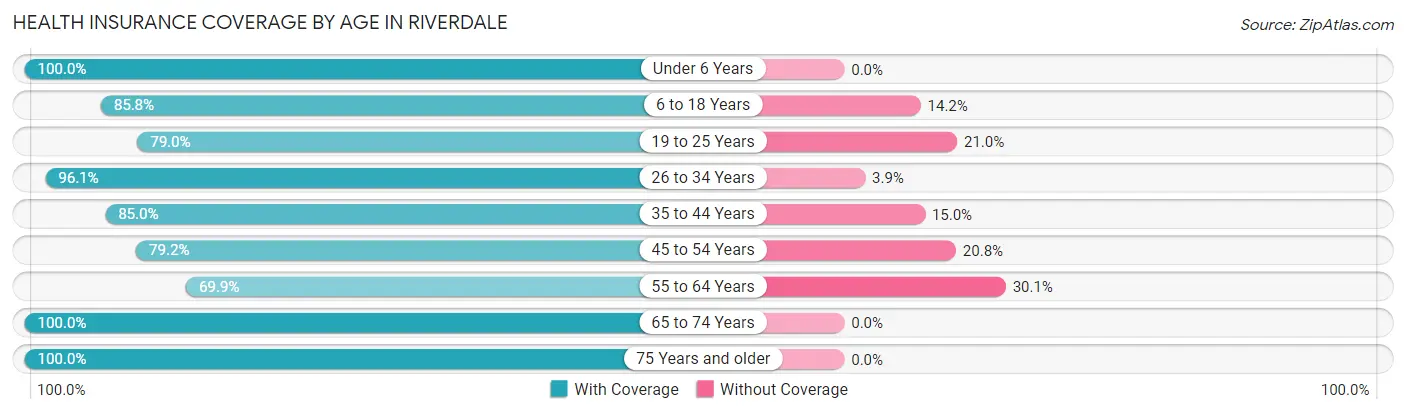
| Age Bracket | With Coverage | Without Coverage |
| Under 6 Years | 301 (100.0%) | 0 (0.0%) |
| 6 to 18 Years | 410 (85.8%) | 68 (14.2%) |
| 19 to 25 Years | 139 (79.0%) | 37 (21.0%) |
| 26 to 34 Years | 619 (96.1%) | 25 (3.9%) |
| 35 to 44 Years | 209 (85.0%) | 37 (15.0%) |
| 45 to 54 Years | 312 (79.2%) | 82 (20.8%) |
| 55 to 64 Years | 202 (69.9%) | 87 (30.1%) |
| 65 to 74 Years | 136 (100.0%) | 0 (0.0%) |
| 75 Years and older | 82 (100.0%) | 0 (0.0%) |
| Total | 2,410 (87.8%) | 336 (12.2%) |
Health Insurance Coverage by Citizenship Status in Riverdale

| Citizenship Status | With Coverage | Without Coverage |
| Native Born | 301 (100.0%) | 0 (0.0%) |
| Foreign Born, Citizen | 410 (85.8%) | 68 (14.2%) |
| Foreign Born, not a Citizen | 139 (79.0%) | 37 (21.0%) |
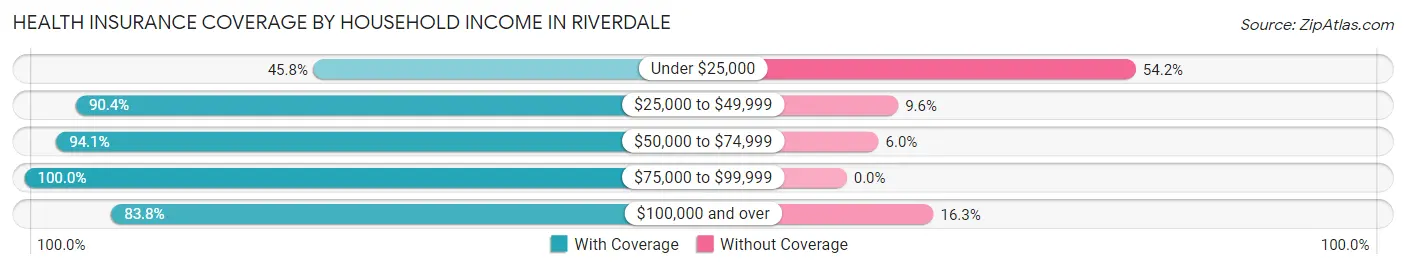
Health Insurance Coverage by Household Income in Riverdale
| Household Income | With Coverage | Without Coverage |
| Under $25,000 | 99 (45.8%) | 117 (54.2%) |
| $25,000 to $49,999 | 657 (90.4%) | 70 (9.6%) |
| $50,000 to $74,999 | 522 (94.1%) | 33 (5.9%) |
| $75,000 to $99,999 | 534 (100.0%) | 0 (0.0%) |
| $100,000 and over | 598 (83.8%) | 116 (16.3%) |
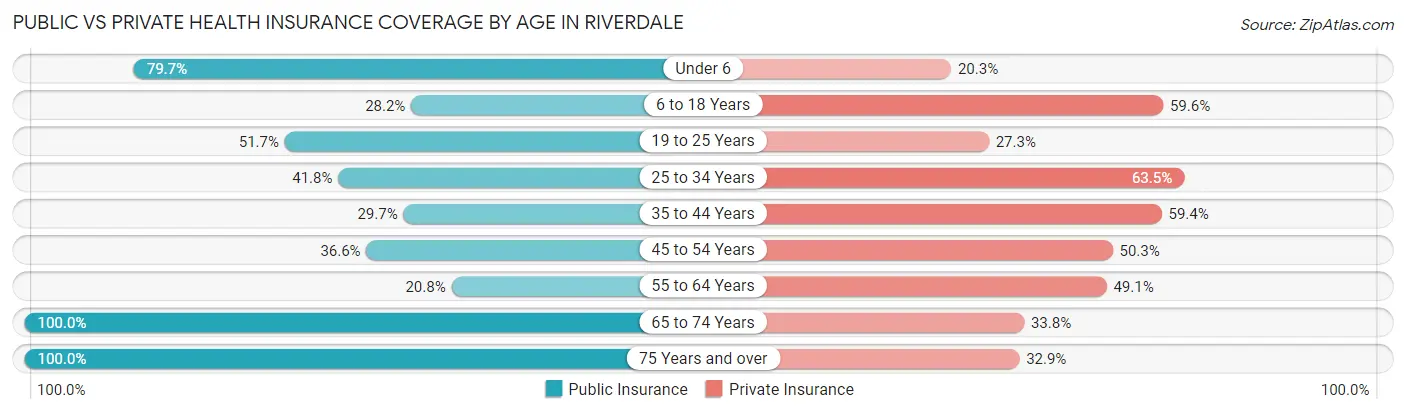
Public vs Private Health Insurance Coverage by Age in Riverdale
| Age Bracket | Public Insurance | Private Insurance |
| Under 6 | 240 (79.7%) | 61 (20.3%) |
| 6 to 18 Years | 135 (28.2%) | 285 (59.6%) |
| 19 to 25 Years | 91 (51.7%) | 48 (27.3%) |
| 25 to 34 Years | 269 (41.8%) | 409 (63.5%) |
| 35 to 44 Years | 73 (29.7%) | 146 (59.4%) |
| 45 to 54 Years | 144 (36.5%) | 198 (50.2%) |
| 55 to 64 Years | 60 (20.8%) | 142 (49.1%) |
| 65 to 74 Years | 136 (100.0%) | 46 (33.8%) |
| 75 Years and over | 82 (100.0%) | 27 (32.9%) |
| Total | 1,230 (44.8%) | 1,362 (49.6%) |
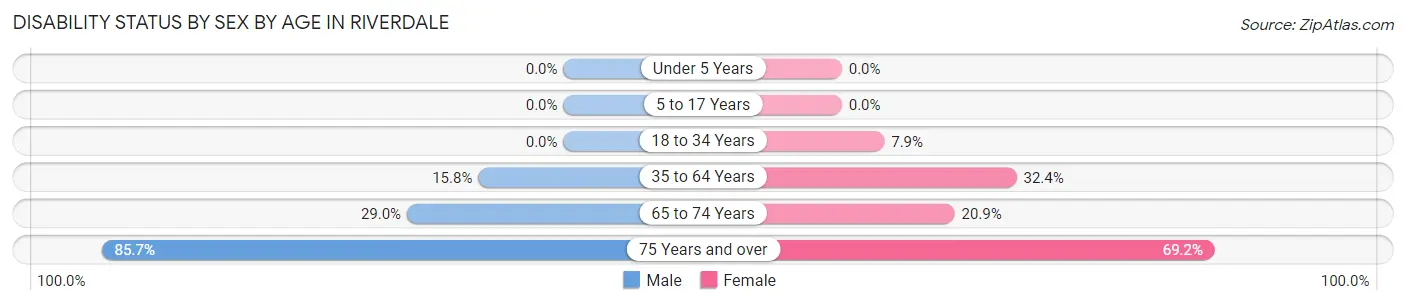
Disability Status by Sex by Age in Riverdale
| Age Bracket | Male | Female |
| Under 5 Years | 0 (0.0%) | 0 (0.0%) |
| 5 to 17 Years | 0 (0.0%) | 0 (0.0%) |
| 18 to 34 Years | 0 (0.0%) | 40 (7.9%) |
| 35 to 64 Years | 82 (15.8%) | 133 (32.4%) |
| 65 to 74 Years | 27 (29.0%) | 9 (20.9%) |
| 75 Years and over | 48 (85.7%) | 18 (69.2%) |
Disability Class by Sex by Age in Riverdale
Disability Class: Hearing Difficulty
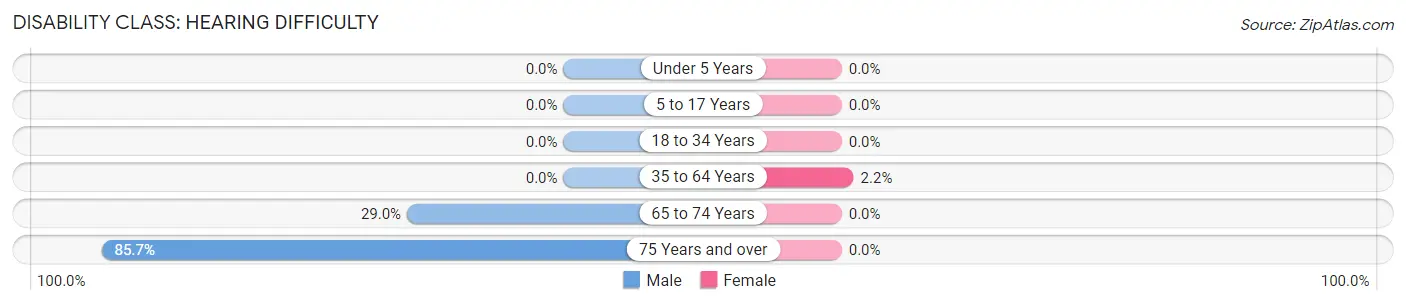
| Age Bracket | Male | Female |
| Under 5 Years | 0 (0.0%) | 0 (0.0%) |
| 5 to 17 Years | 0 (0.0%) | 0 (0.0%) |
| 18 to 34 Years | 0 (0.0%) | 0 (0.0%) |
| 35 to 64 Years | 0 (0.0%) | 9 (2.2%) |
| 65 to 74 Years | 27 (29.0%) | 0 (0.0%) |
| 75 Years and over | 48 (85.7%) | 0 (0.0%) |
Disability Class: Vision Difficulty
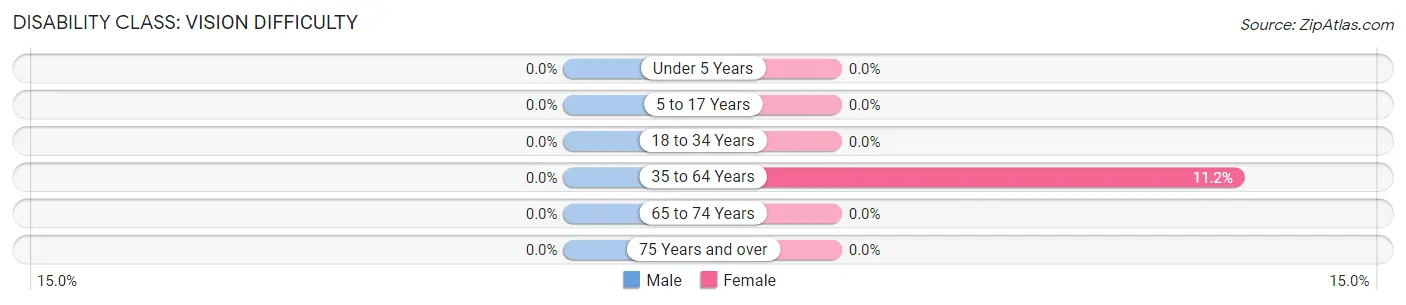
| Age Bracket | Male | Female |
| Under 5 Years | 0 (0.0%) | 0 (0.0%) |
| 5 to 17 Years | 0 (0.0%) | 0 (0.0%) |
| 18 to 34 Years | 0 (0.0%) | 0 (0.0%) |
| 35 to 64 Years | 0 (0.0%) | 46 (11.2%) |
| 65 to 74 Years | 0 (0.0%) | 0 (0.0%) |
| 75 Years and over | 0 (0.0%) | 0 (0.0%) |
Disability Class: Cognitive Difficulty
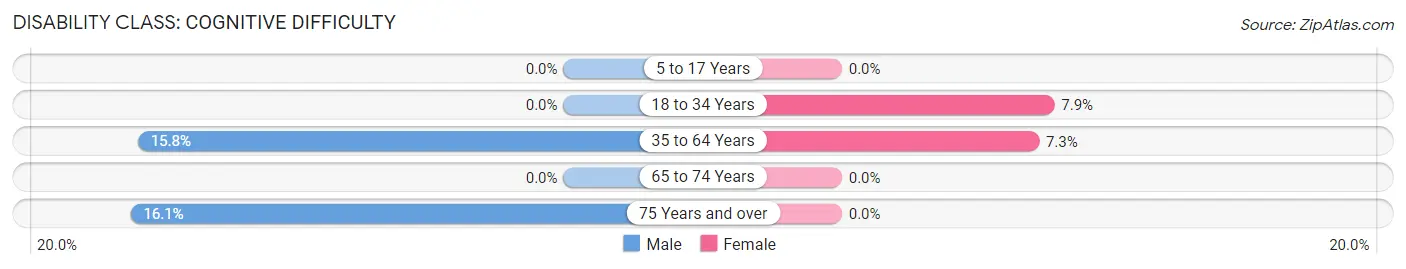
| Age Bracket | Male | Female |
| 5 to 17 Years | 0 (0.0%) | 0 (0.0%) |
| 18 to 34 Years | 0 (0.0%) | 40 (7.9%) |
| 35 to 64 Years | 82 (15.8%) | 30 (7.3%) |
| 65 to 74 Years | 0 (0.0%) | 0 (0.0%) |
| 75 Years and over | 9 (16.1%) | 0 (0.0%) |
Disability Class: Ambulatory Difficulty
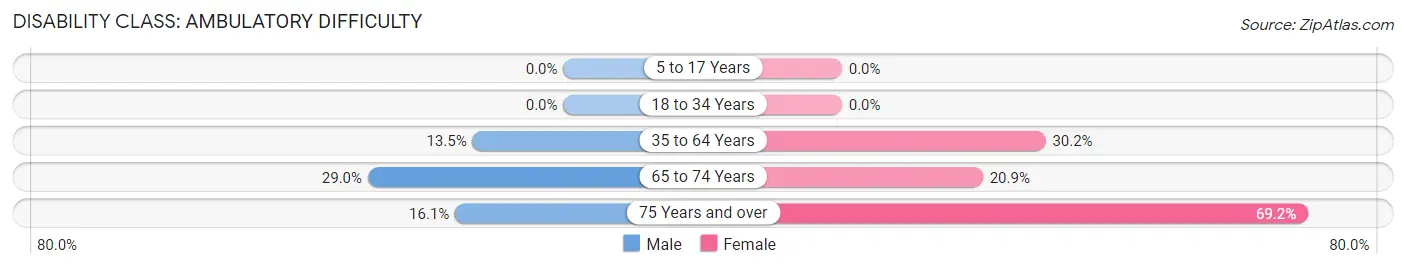
| Age Bracket | Male | Female |
| 5 to 17 Years | 0 (0.0%) | 0 (0.0%) |
| 18 to 34 Years | 0 (0.0%) | 0 (0.0%) |
| 35 to 64 Years | 70 (13.5%) | 124 (30.2%) |
| 65 to 74 Years | 27 (29.0%) | 9 (20.9%) |
| 75 Years and over | 9 (16.1%) | 18 (69.2%) |
Disability Class: Self-Care Difficulty
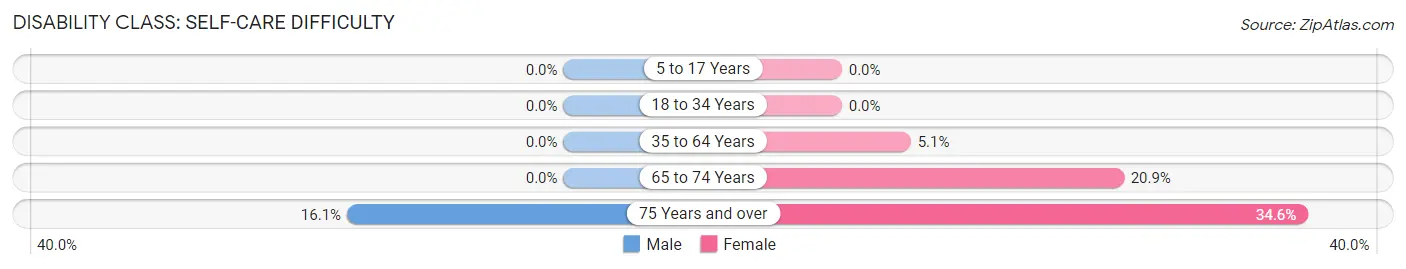
| Age Bracket | Male | Female |
| 5 to 17 Years | 0 (0.0%) | 0 (0.0%) |
| 18 to 34 Years | 0 (0.0%) | 0 (0.0%) |
| 35 to 64 Years | 0 (0.0%) | 21 (5.1%) |
| 65 to 74 Years | 0 (0.0%) | 9 (20.9%) |
| 75 Years and over | 9 (16.1%) | 9 (34.6%) |
Technology Access in Riverdale
Computing Device Access in Riverdale
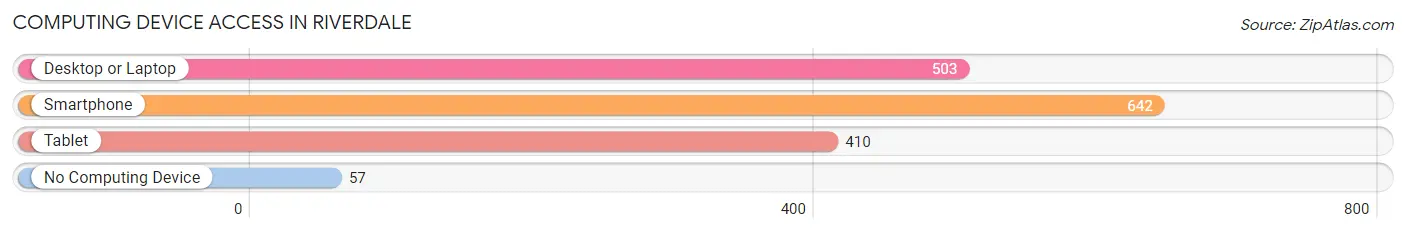
| Device Type | # Households | % Households |
| Desktop or Laptop | 503 | 72.0% |
| Smartphone | 642 | 91.8% |
| Tablet | 410 | 58.7% |
| No Computing Device | 57 | 8.2% |
| Total | 699 | 100.0% |
Internet Access in Riverdale
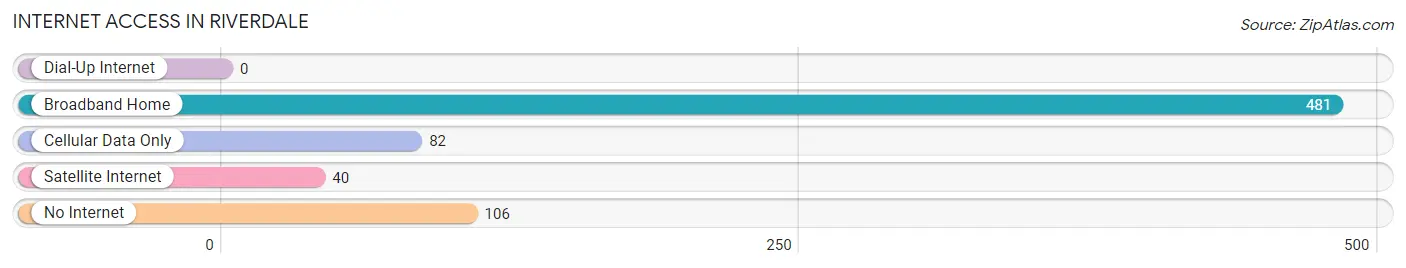
| Internet Type | # Households | % Households |
| Dial-Up Internet | 0 | 0.0% |
| Broadband Home | 481 | 68.8% |
| Cellular Data Only | 82 | 11.7% |
| Satellite Internet | 40 | 5.7% |
| No Internet | 106 | 15.2% |
| Total | 699 | 100.0% |
Riverdale Summary
Riverdale is a small unincorporated community located in the San Joaquin Valley of California. It is situated in Fresno County, approximately 10 miles south of the city of Fresno. The population of Riverdale was estimated to be around 4,000 in 2020.
History
The area that is now Riverdale was originally inhabited by the Yokuts Indians. The first European settlers arrived in the area in the late 1800s. The town was founded in 1891 by a group of settlers from the Midwest. The town was named after the nearby river, which was named after the nearby town of Riverdale, Iowa.
The town grew slowly but steadily over the years, and by the early 1900s, it had become a thriving agricultural community. The town was home to a variety of crops, including cotton, wheat, and alfalfa. The town also had a number of small businesses, including a general store, a blacksmith shop, and a hotel.
In the 1920s, the town began to experience a decline in population as many of the residents moved away to larger cities. However, the town was able to remain a viable community due to its proximity to Fresno and the surrounding agricultural areas.
Geography
Riverdale is located in the San Joaquin Valley of California, approximately 10 miles south of the city of Fresno. The town is situated on the banks of the San Joaquin River, which is the largest river in the state. The town is surrounded by a variety of agricultural land, including cotton, wheat, and alfalfa fields.
The climate in Riverdale is generally mild, with temperatures ranging from the mid-50s in the winter to the mid-90s in the summer. The town receives an average of 10 inches of rain per year.
Economy
The economy of Riverdale is largely based on agriculture. The town is home to a variety of crops, including cotton, wheat, and alfalfa. The town also has a number of small businesses, including a general store, a blacksmith shop, and a hotel.
In recent years, the town has seen an increase in tourism due to its proximity to Fresno and the surrounding agricultural areas. The town is also home to a number of wineries, which attract visitors from all over the world.
Demographics
The population of Riverdale was estimated to be around 4,000 in 2020. The town is predominantly white, with a small Hispanic population. The median household income in Riverdale is around $50,000, which is slightly lower than the national average.
The town has a high rate of poverty, with around 25% of the population living below the poverty line. The town also has a high rate of unemployment, with around 10% of the population unemployed.
Conclusion
Riverdale is a small unincorporated community located in the San Joaquin Valley of California. It is situated in Fresno County, approximately 10 miles south of the city of Fresno. The town has a long history, dating back to the late 1800s, and has a largely agricultural economy. The population of Riverdale was estimated to be around 4,000 in 2020, and the town is predominantly white, with a small Hispanic population. The town has a high rate of poverty and unemployment, but has seen an increase in tourism in recent years due to its proximity to Fresno and the surrounding agricultural areas.
Common Questions
What is Per Capita Income in Riverdale?
Per Capita income in Riverdale is $19,564.
What is the Median Family Income in Riverdale?
Median Family Income in Riverdale is $54,884.
What is the Median Household income in Riverdale?
Median Household Income in Riverdale is $55,458.
What is Income or Wage Gap in Riverdale?
Income or Wage Gap in Riverdale is 5.4%.
Women in Riverdale earn 94.6 cents for every dollar earned by a man.
What is Inequality or Gini Index in Riverdale?
Inequality or Gini Index in Riverdale is 0.38.
What is the Total Population of Riverdale?
Total Population of Riverdale is 2,756.
What is the Total Male Population of Riverdale?
Total Male Population of Riverdale is 1,463.
What is the Total Female Population of Riverdale?
Total Female Population of Riverdale is 1,293.
What is the Ratio of Males per 100 Females in Riverdale?
There are 113.15 Males per 100 Females in Riverdale.
What is the Ratio of Females per 100 Males in Riverdale?
There are 88.38 Females per 100 Males in Riverdale.
What is the Median Population Age in Riverdale?
Median Population Age in Riverdale is 30.5 Years.
What is the Average Family Size in Riverdale
Average Family Size in Riverdale is 3.9 People.
What is the Average Household Size in Riverdale
Average Household Size in Riverdale is 3.9 People.
How Large is the Labor Force in Riverdale?
There are 1,217 People in the Labor Forcein in Riverdale.
What is the Percentage of People in the Labor Force in Riverdale?
58.3% of People are in the Labor Force in Riverdale.
What is the Unemployment Rate in Riverdale?
Unemployment Rate in Riverdale is 5.3%.