Cities with the Highest Unemployment Rate Amomg Youth Under the Age of 25 in Vermont
RELATED REPORTS & OPTIONS
Highest Unemployment | Youth < 25
Vermont
Compare Cities
Map of Cities with the Highest Unemployment Rate Amomg Youth Under the Age of 25 in Vermont
0.0%
100.0%
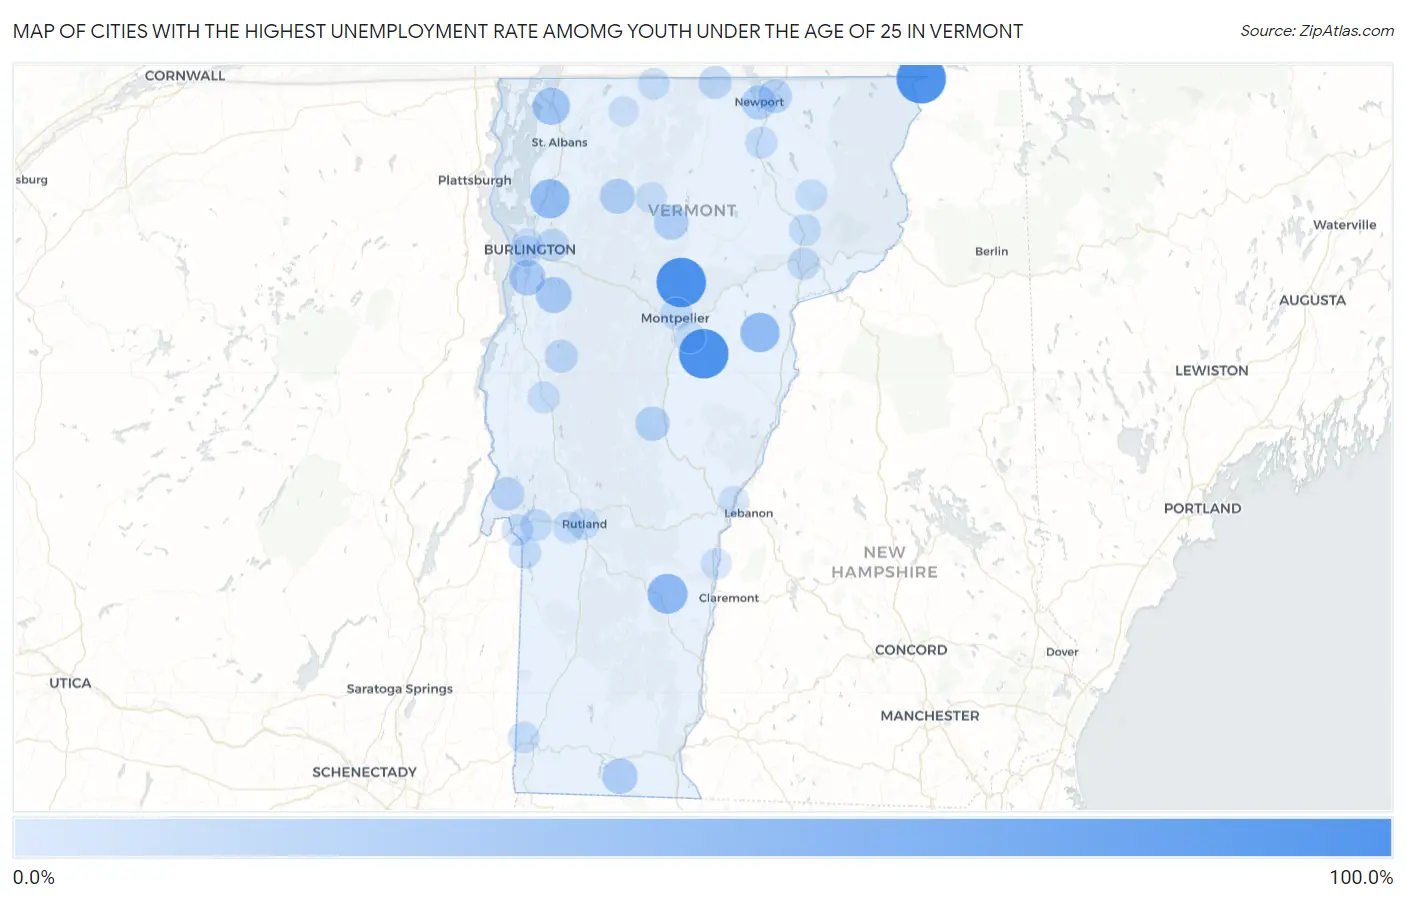
Cities with the Highest Unemployment Rate Amomg Youth Under the Age of 25 in Vermont
| City | Youth Unemployment | vs State | vs National | |
| 1. | East Barre | 100.0% | 7.5%(+92.5)#1 | 10.9%(+89.1)#55 |
| 2. | North Pownal | 100.0% | 7.5%(+92.5)#2 | 10.9%(+89.1)#121 |
| 3. | Worcester | 100.0% | 7.5%(+92.5)#3 | 10.9%(+89.1)#250 |
| 4. | Beecher Falls | 100.0% | 7.5%(+92.5)#4 | 10.9%(+89.1)#266 |
| 5. | Lunenburg | 72.2% | 7.5%(+64.7)#5 | 10.9%(+61.3)#552 |
| 6. | Bakersfield | 69.7% | 7.5%(+62.2)#6 | 10.9%(+58.8)#589 |
| 7. | Cavendish | 50.0% | 7.5%(+42.5)#7 | 10.9%(+39.1)#1,126 |
| 8. | Killington | 47.0% | 7.5%(+39.5)#8 | 10.9%(+36.1)#1,268 |
| 9. | Groton | 46.6% | 7.5%(+39.1)#9 | 10.9%(+35.7)#1,279 |
| 10. | Milton | 45.9% | 7.5%(+38.4)#10 | 10.9%(+35.0)#1,318 |
| 11. | Stamford | 43.5% | 7.5%(+36.0)#11 | 10.9%(+32.6)#1,454 |
| 12. | Danby | 40.0% | 7.5%(+32.5)#12 | 10.9%(+29.1)#1,701 |
| 13. | Swanton | 36.2% | 7.5%(+28.7)#13 | 10.9%(+25.3)#2,000 |
| 14. | Bolton | 33.3% | 7.5%(+25.8)#14 | 10.9%(+22.4)#2,348 |
| 15. | Hinesburg | 29.5% | 7.5%(+22.0)#15 | 10.9%(+18.6)#2,754 |
| 16. | Shelburne | 29.1% | 7.5%(+21.6)#16 | 10.9%(+18.2)#2,797 |
| 17. | Jacksonville | 25.8% | 7.5%(+18.3)#17 | 10.9%(+14.9)#3,348 |
| 18. | Jeffersonville | 25.0% | 7.5%(+17.5)#18 | 10.9%(+14.1)#3,473 |
| 19. | Morrisville | 22.9% | 7.5%(+15.4)#19 | 10.9%(+12.0)#3,967 |
| 20. | Randolph | 21.8% | 7.5%(+14.3)#20 | 10.9%(+10.9)#4,228 |
| 21. | Newport | 21.4% | 7.5%(+13.9)#21 | 10.9%(+10.5)#4,329 |
| 22. | Lyndon Center | 19.1% | 7.5%(+11.6)#22 | 10.9%(+8.20)#5,024 |
| 23. | Derby Center | 18.3% | 7.5%(+10.8)#23 | 10.9%(+7.40)#5,271 |
| 24. | Huntington | 17.6% | 7.5%(+10.1)#24 | 10.9%(+6.70)#5,575 |
| 25. | Benson | 16.6% | 7.5%(+9.10)#25 | 10.9%(+5.70)#5,989 |
| 26. | Westford | 16.6% | 7.5%(+9.10)#26 | 10.9%(+5.70)#5,990 |
| 27. | Bristol | 15.0% | 7.5%(+7.50)#27 | 10.9%(+4.10)#6,680 |
| 28. | North Troy | 14.7% | 7.5%(+7.20)#28 | 10.9%(+3.80)#6,858 |
| 29. | Essex Junction | 13.9% | 7.5%(+6.40)#29 | 10.9%(+3.00)#7,247 |
| 30. | St Johnsbury | 11.6% | 7.5%(+4.10)#30 | 10.9%(+0.700)#8,664 |
| 31. | Proctor | 10.9% | 7.5%(+3.40)#31 | 10.9%(=0.000)#9,152 |
| 32. | Montpelier | 10.8% | 7.5%(+3.30)#32 | 10.9%(-0.100)#9,196 |
| 33. | Poultney | 10.6% | 7.5%(+3.10)#33 | 10.9%(-0.300)#9,366 |
| 34. | Orleans | 10.2% | 7.5%(+2.70)#34 | 10.9%(-0.700)#9,686 |
| 35. | Lyndonville | 9.9% | 7.5%(+2.40)#35 | 10.9%(-1.000)#9,916 |
| 36. | Castleton | 9.5% | 7.5%(+2.00)#36 | 10.9%(-1.40)#10,229 |
| 37. | Richford | 9.4% | 7.5%(+1.90)#37 | 10.9%(-1.50)#10,302 |
| 38. | Middlebury | 9.3% | 7.5%(+1.80)#38 | 10.9%(-1.60)#10,354 |
| 39. | St. George | 9.3% | 7.5%(+1.80)#39 | 10.9%(-1.60)#10,400 |
| 40. | Rutland | 9.2% | 7.5%(+1.70)#40 | 10.9%(-1.70)#10,437 |
| 41. | West Rutland | 9.0% | 7.5%(+1.50)#41 | 10.9%(-1.90)#10,588 |
| 42. | West Burke | 9.0% | 7.5%(+1.50)#42 | 10.9%(-1.90)#10,648 |
| 43. | Fair Haven | 8.8% | 7.5%(+1.30)#43 | 10.9%(-2.10)#10,780 |
| 44. | North Bennington | 8.4% | 7.5%(+0.900)#44 | 10.9%(-2.50)#11,147 |
| 45. | Barre | 7.8% | 7.5%(+0.300)#45 | 10.9%(-3.10)#11,559 |
| 46. | Burlington | 7.2% | 7.5%(-0.300)#46 | 10.9%(-3.70)#12,022 |
| 47. | Johnson | 7.2% | 7.5%(-0.300)#47 | 10.9%(-3.70)#12,082 |
| 48. | South Burlington | 6.5% | 7.5%(-1.000)#48 | 10.9%(-4.40)#12,564 |
| 49. | Windsor | 5.6% | 7.5%(-1.90)#49 | 10.9%(-5.30)#13,318 |
| 50. | Wilder | 4.1% | 7.5%(-3.40)#50 | 10.9%(-6.80)#14,413 |
| 51. | Enosburg Falls | 3.8% | 7.5%(-3.70)#51 | 10.9%(-7.10)#14,627 |
1
Common Questions
What are the Top 10 Cities with the Highest Unemployment Rate Amomg Youth Under the Age of 25 in Vermont?
Top 10 Cities with the Highest Unemployment Rate Amomg Youth Under the Age of 25 in Vermont are:
#1
100.0%
#2
100.0%
#3
100.0%
#4
50.0%
#5
46.6%
#6
45.9%
#7
36.2%
#8
29.5%
#9
29.1%
#10
25.8%
What city has the Highest Unemployment Rate Amomg Youth Under the Age of 25 in Vermont?
East Barre has the Highest Unemployment Rate Amomg Youth Under the Age of 25 in Vermont with 100.0%.
What is the Unemployment Rate Amomg Youth Under the Age of 25 in the State of Vermont?
Unemployment Rate Amomg Youth Under the Age of 25 in Vermont is 7.5%.
What is the Unemployment Rate Amomg Youth Under the Age of 25 in the United States?
Unemployment Rate Amomg Youth Under the Age of 25 in the United States is 10.9%.