Vernon, CA Map & Demographics
Vernon Map
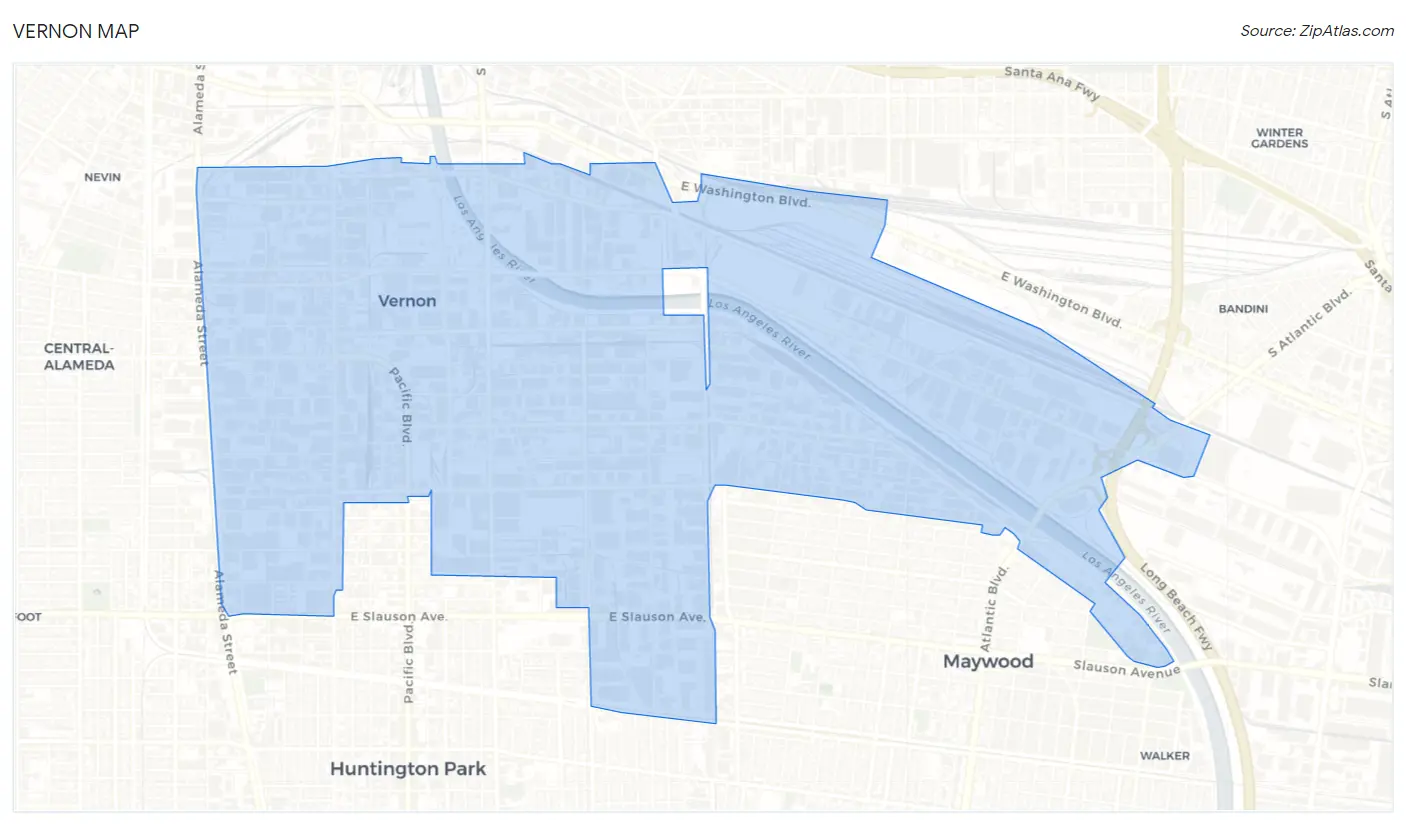
Vernon Overview
$20,296
PER CAPITA INCOME
$68,929
AVG FAMILY INCOME
$69,345
AVG HOUSEHOLD INCOME
41.9%
WAGE / INCOME GAP [ % ]
58.1¢/ $1
WAGE / INCOME GAP [ $ ]
0.24
INEQUALITY / GINI INDEX
329
TOTAL POPULATION
117
MALE POPULATION
212
FEMALE POPULATION
55.19
MALES / 100 FEMALES
181.20
FEMALES / 100 MALES
28.7
MEDIAN AGE
4.0
AVG FAMILY SIZE
3.6
AVG HOUSEHOLD SIZE
130
LABOR FORCE [ PEOPLE ]
57.5%
PERCENT IN LABOR FORCE
8.6%
UNEMPLOYMENT RATE
Vernon Area Codes
Income in Vernon
Income Overview in Vernon
Per Capita Income in Vernon is $20,296, while median incomes of families and households are $68,929 and $69,345 respectively.
| Characteristic | Number | Measure |
| Per Capita Income | 329 | $20,296 |
| Median Family Income | 76 | $68,929 |
| Mean Family Income | 76 | $73,579 |
| Median Household Income | 91 | $69,345 |
| Mean Household Income | 91 | $71,042 |
| Income Deficit | 76 | $0 |
| Wage / Income Gap (%) | 329 | 41.89% |
| Wage / Income Gap ($) | 329 | 58.11¢ per $1 |
| Gini / Inequality Index | 329 | 0.24 |
Earnings by Sex in Vernon
Average Earnings in Vernon are $42,188, $66,250 for men and $38,500 for women, a difference of 41.9%.
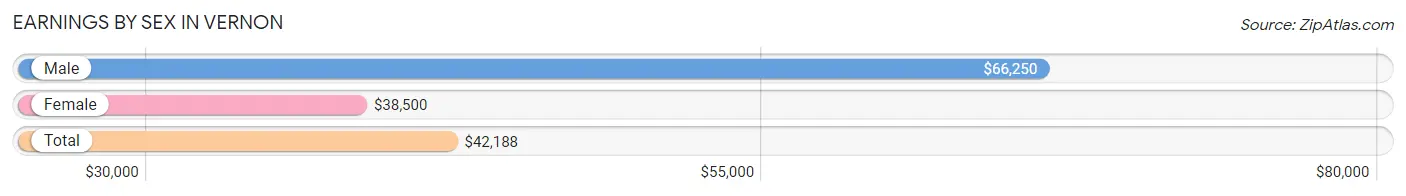
| Sex | Number | Average Earnings |
| Male | 30 (23.1%) | $66,250 |
| Female | 100 (76.9%) | $38,500 |
| Total | 130 (100.0%) | $42,188 |
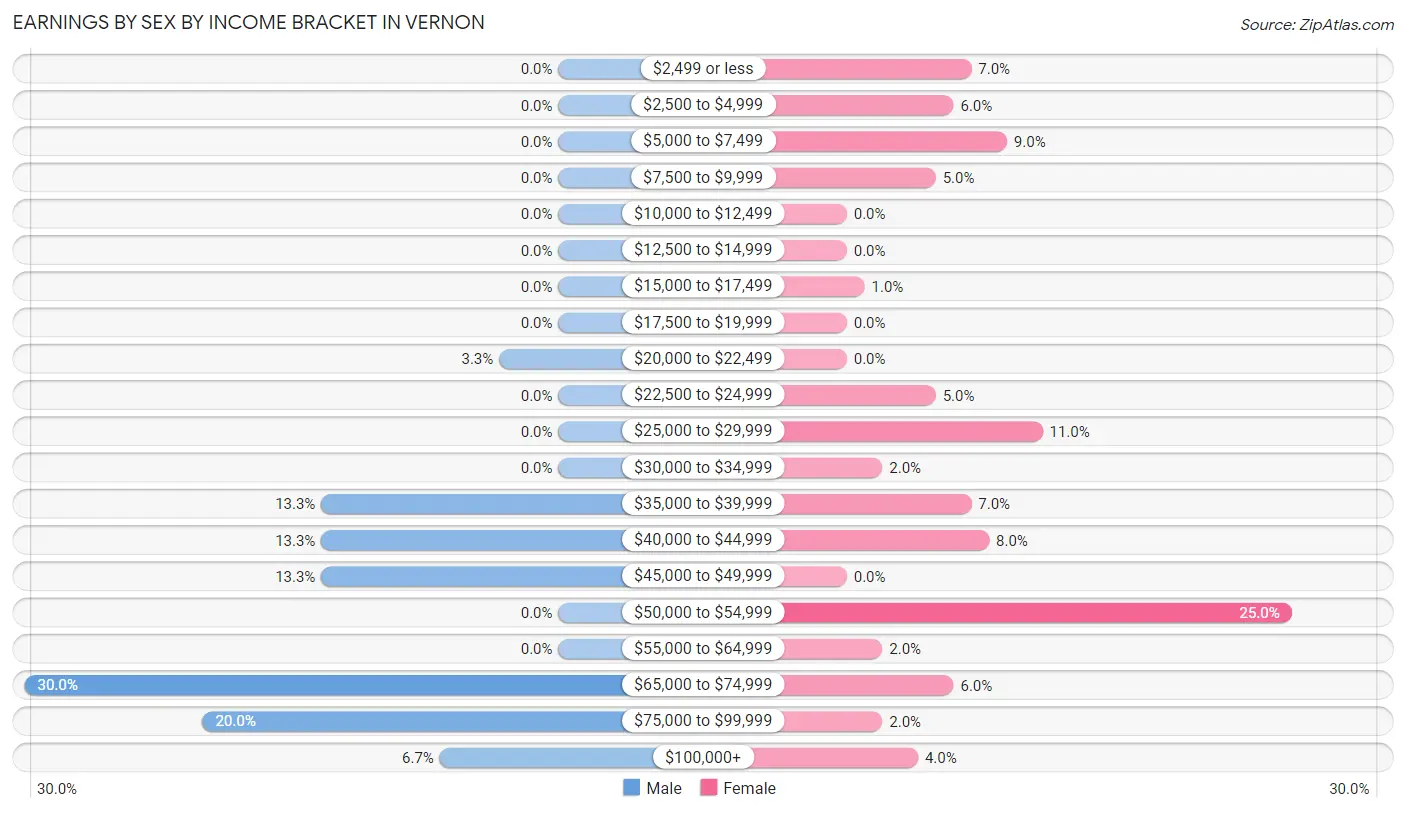
Earnings by Sex by Income Bracket in Vernon
The most common earnings brackets in Vernon are $65,000 to $74,999 for men (9 | 30.0%) and $50,000 to $54,999 for women (25 | 25.0%).
| Income | Male | Female |
| $2,499 or less | 0 (0.0%) | 7 (7.0%) |
| $2,500 to $4,999 | 0 (0.0%) | 6 (6.0%) |
| $5,000 to $7,499 | 0 (0.0%) | 9 (9.0%) |
| $7,500 to $9,999 | 0 (0.0%) | 5 (5.0%) |
| $10,000 to $12,499 | 0 (0.0%) | 0 (0.0%) |
| $12,500 to $14,999 | 0 (0.0%) | 0 (0.0%) |
| $15,000 to $17,499 | 0 (0.0%) | 1 (1.0%) |
| $17,500 to $19,999 | 0 (0.0%) | 0 (0.0%) |
| $20,000 to $22,499 | 1 (3.3%) | 0 (0.0%) |
| $22,500 to $24,999 | 0 (0.0%) | 5 (5.0%) |
| $25,000 to $29,999 | 0 (0.0%) | 11 (11.0%) |
| $30,000 to $34,999 | 0 (0.0%) | 2 (2.0%) |
| $35,000 to $39,999 | 4 (13.3%) | 7 (7.0%) |
| $40,000 to $44,999 | 4 (13.3%) | 8 (8.0%) |
| $45,000 to $49,999 | 4 (13.3%) | 0 (0.0%) |
| $50,000 to $54,999 | 0 (0.0%) | 25 (25.0%) |
| $55,000 to $64,999 | 0 (0.0%) | 2 (2.0%) |
| $65,000 to $74,999 | 9 (30.0%) | 6 (6.0%) |
| $75,000 to $99,999 | 6 (20.0%) | 2 (2.0%) |
| $100,000+ | 2 (6.7%) | 4 (4.0%) |
| Total | 30 (100.0%) | 100 (100.0%) |
Earnings by Sex by Educational Attainment in Vernon
Average earnings in Vernon are $66,250 for men and $44,688 for women, a difference of 32.6%. Men with an educational attainment of college or associate's degree enjoy the highest average annual earnings of $57,500, while those with college or associate's degree education earn the least with $57,500. Women with an educational attainment of college or associate's degree earn the most with the average annual earnings of $50,556, while those with bachelor's degree education have the smallest earnings of $50,500.
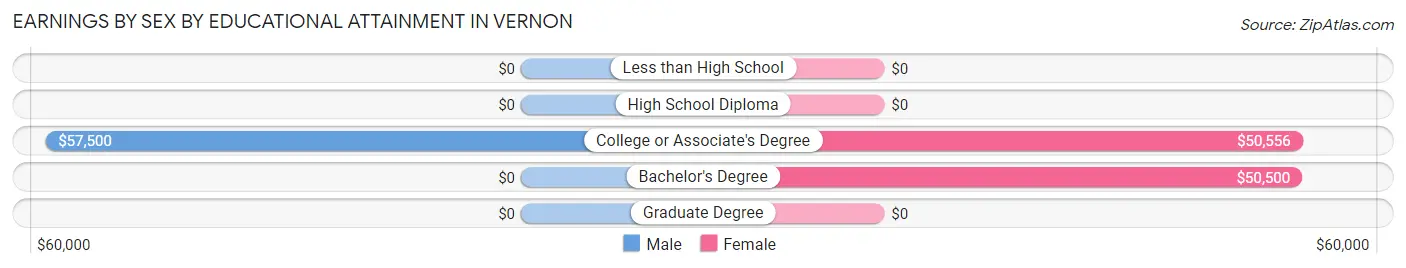
| Educational Attainment | Male Income | Female Income |
| Less than High School | - | - |
| High School Diploma | - | - |
| College or Associate's Degree | $57,500 | $50,556 |
| Bachelor's Degree | - | - |
| Graduate Degree | - | - |
| Total | $66,250 | $44,688 |
Family Income in Vernon
Family Income Brackets in Vernon
According to the Vernon family income data, there are 29 families falling into the $50,000 to $74,999 income range, which is the most common income bracket and makes up 38.2% of all families.
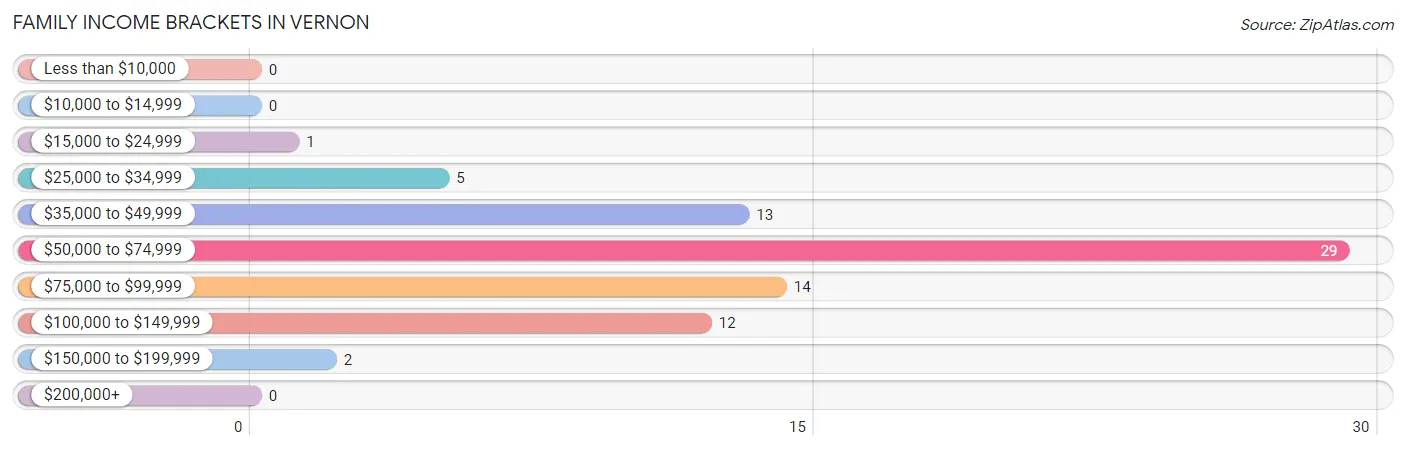
| Income Bracket | # Families | % Families |
| Less than $10,000 | 0 | 0.0% |
| $10,000 to $14,999 | 0 | 0.0% |
| $15,000 to $24,999 | 1 | 1.3% |
| $25,000 to $34,999 | 5 | 6.6% |
| $35,000 to $49,999 | 13 | 17.1% |
| $50,000 to $74,999 | 29 | 38.2% |
| $75,000 to $99,999 | 14 | 18.4% |
| $100,000 to $149,999 | 12 | 15.8% |
| $150,000 to $199,999 | 2 | 2.6% |
| $200,000+ | 0 | 0.0% |
Family Income by Famaliy Size in Vernon
3-person families (26 | 34.2%) account for the highest median family income in Vernon with $78,500 per family, while 3-person families (26 | 34.2%) have the highest median income of $26,167 per family member.
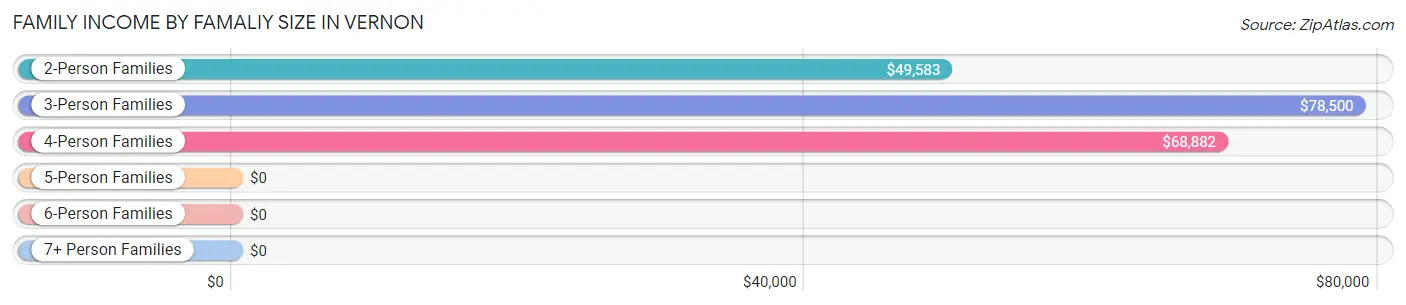
| Income Bracket | # Families | Median Income |
| 2-Person Families | 15 (19.7%) | $49,583 |
| 3-Person Families | 26 (34.2%) | $78,500 |
| 4-Person Families | 21 (27.6%) | $68,882 |
| 5-Person Families | 6 (7.9%) | $0 |
| 6-Person Families | 4 (5.3%) | $0 |
| 7+ Person Families | 4 (5.3%) | $0 |
| Total | 76 (100.0%) | $68,929 |
Family Income by Number of Earners in Vernon
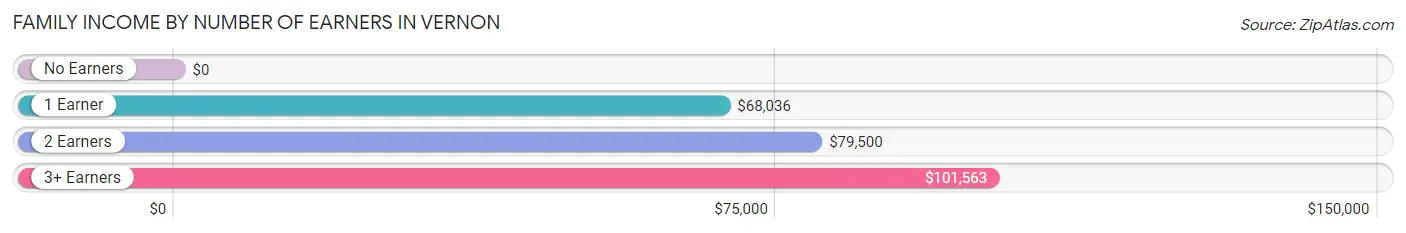
| Number of Earners | # Families | Median Income |
| No Earners | 0 (0.0%) | $0 |
| 1 Earner | 47 (61.8%) | $68,036 |
| 2 Earners | 22 (28.9%) | $79,500 |
| 3+ Earners | 7 (9.2%) | $101,563 |
| Total | 76 (100.0%) | $68,929 |
Household Income in Vernon
Household Income Brackets in Vernon
With 34 households falling in the category, the $50,000 to $74,999 income range is the most frequent in Vernon, accounting for 37.4% of all households.
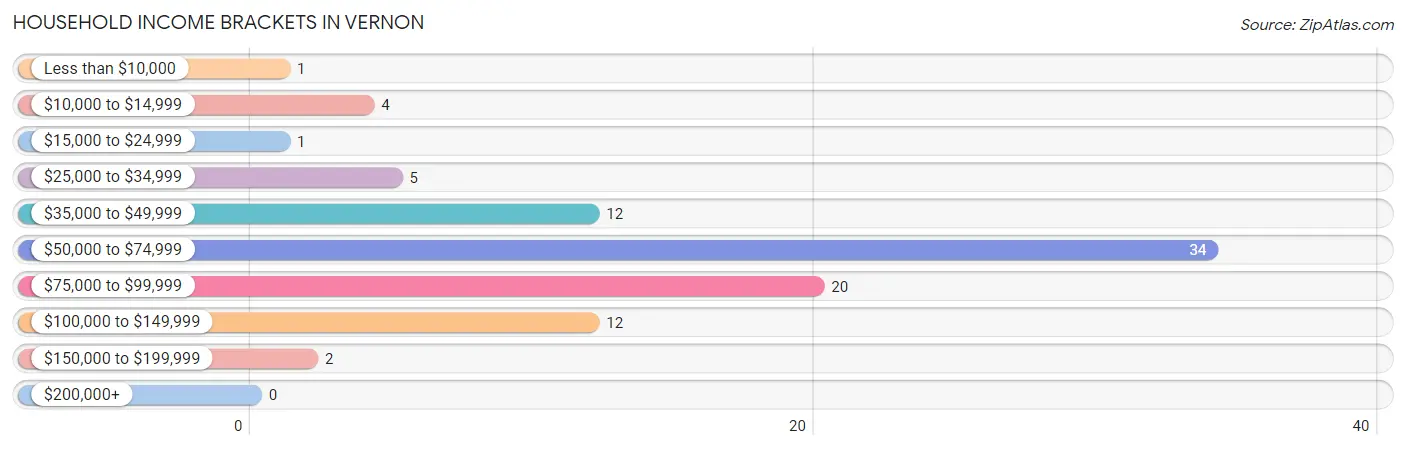
| Income Bracket | # Households | % Households |
| Less than $10,000 | 1 | 1.1% |
| $10,000 to $14,999 | 4 | 4.4% |
| $15,000 to $24,999 | 1 | 1.1% |
| $25,000 to $34,999 | 5 | 5.5% |
| $35,000 to $49,999 | 12 | 13.2% |
| $50,000 to $74,999 | 34 | 37.4% |
| $75,000 to $99,999 | 20 | 22.0% |
| $100,000 to $149,999 | 12 | 13.2% |
| $150,000 to $199,999 | 2 | 2.2% |
| $200,000+ | 0 | 0.0% |
Household Income by Householder Age in Vernon
The median household income in Vernon is $69,345, with the highest median household income of $78,250 found in the 65+ years age bracket for the primary householder. A total of 15 households (16.5%) fall into this category.
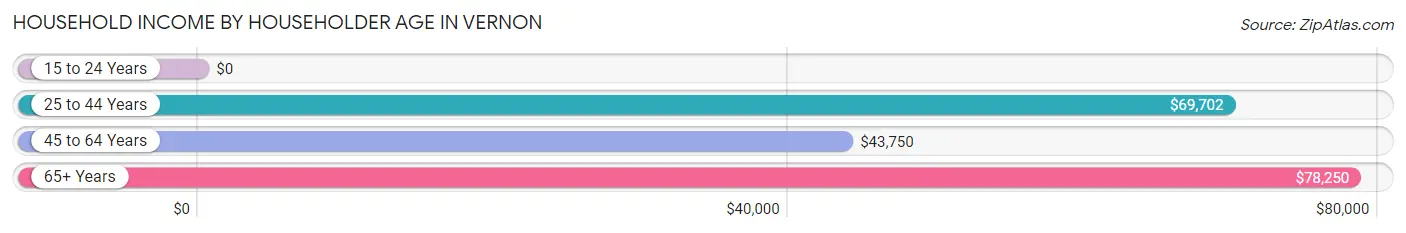
| Income Bracket | # Households | Median Income |
| 15 to 24 Years | 0 (0.0%) | $0 |
| 25 to 44 Years | 61 (67.0%) | $69,702 |
| 45 to 64 Years | 15 (16.5%) | $43,750 |
| 65+ Years | 15 (16.5%) | $78,250 |
| Total | 91 (100.0%) | $69,345 |
Poverty in Vernon
Income Below Poverty by Sex and Age in Vernon
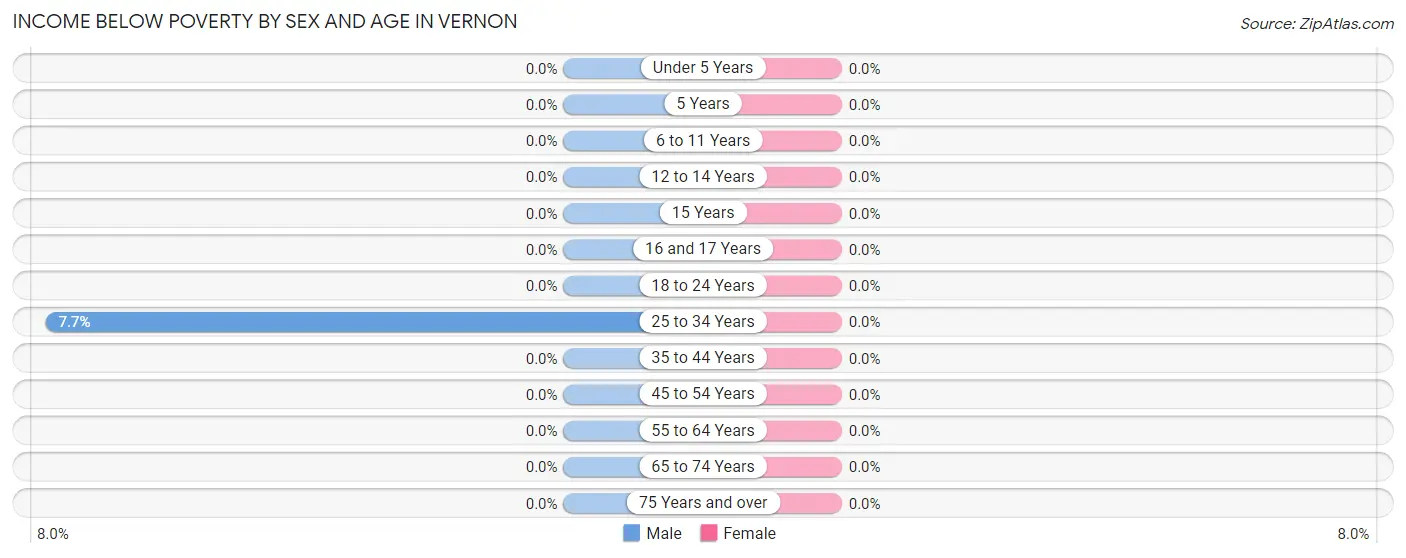
| Age Bracket | Male | Female |
| Under 5 Years | 0 (0.0%) | 0 (0.0%) |
| 5 Years | 0 (0.0%) | 0 (0.0%) |
| 6 to 11 Years | 0 (0.0%) | 0 (0.0%) |
| 12 to 14 Years | 0 (0.0%) | 0 (0.0%) |
| 15 Years | 0 (0.0%) | 0 (0.0%) |
| 16 and 17 Years | 0 (0.0%) | 0 (0.0%) |
| 18 to 24 Years | 0 (0.0%) | 0 (0.0%) |
| 25 to 34 Years | 1 (7.7%) | 0 (0.0%) |
| 35 to 44 Years | 0 (0.0%) | 0 (0.0%) |
| 45 to 54 Years | 0 (0.0%) | 0 (0.0%) |
| 55 to 64 Years | 0 (0.0%) | 0 (0.0%) |
| 65 to 74 Years | 0 (0.0%) | 0 (0.0%) |
| 75 Years and over | 0 (0.0%) | 0 (0.0%) |
| Total | 1 (0.9%) | 0 (0.0%) |
Income Above Poverty by Sex and Age in Vernon
According to the poverty statistics in Vernon, males aged under 5 years and females aged under 5 years are the age groups that are most secure financially, with 100.0% of males and 100.0% of females in these age groups living above the poverty line.
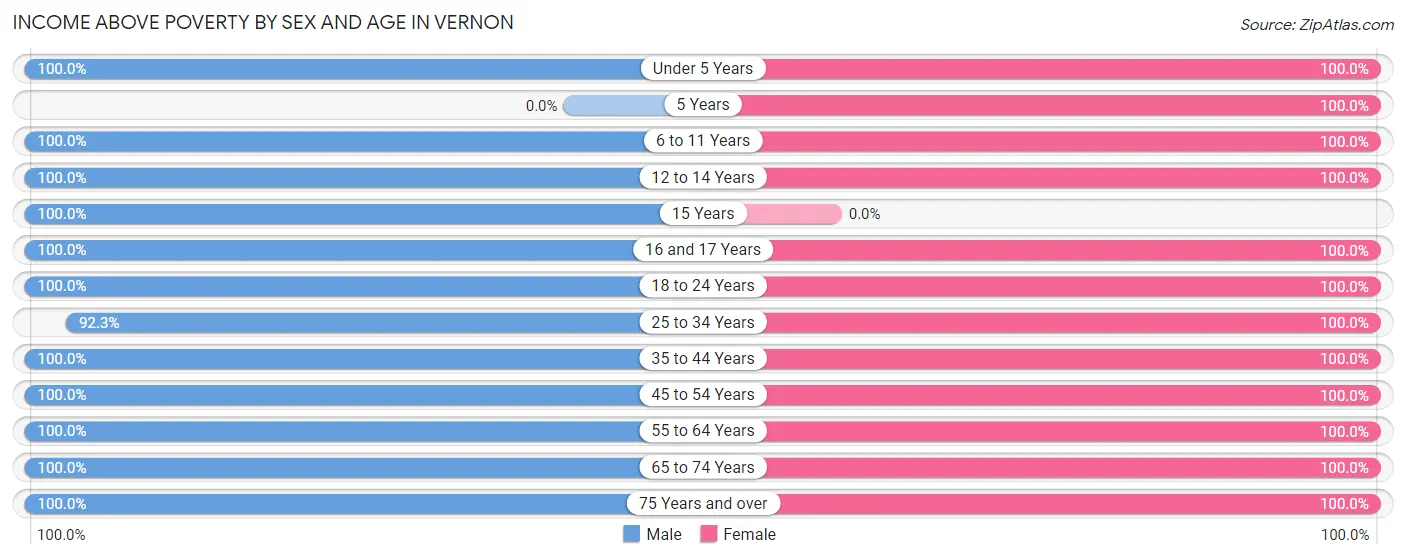
| Age Bracket | Male | Female |
| Under 5 Years | 10 (100.0%) | 7 (100.0%) |
| 5 Years | 0 (0.0%) | 1 (100.0%) |
| 6 to 11 Years | 27 (100.0%) | 28 (100.0%) |
| 12 to 14 Years | 6 (100.0%) | 22 (100.0%) |
| 15 Years | 2 (100.0%) | 0 (0.0%) |
| 16 and 17 Years | 9 (100.0%) | 1 (100.0%) |
| 18 to 24 Years | 10 (100.0%) | 28 (100.0%) |
| 25 to 34 Years | 12 (92.3%) | 24 (100.0%) |
| 35 to 44 Years | 14 (100.0%) | 39 (100.0%) |
| 45 to 54 Years | 6 (100.0%) | 8 (100.0%) |
| 55 to 64 Years | 3 (100.0%) | 16 (100.0%) |
| 65 to 74 Years | 9 (100.0%) | 34 (100.0%) |
| 75 Years and over | 8 (100.0%) | 4 (100.0%) |
| Total | 116 (99.2%) | 212 (100.0%) |
Income Below Poverty Among Married-Couple Families in Vernon
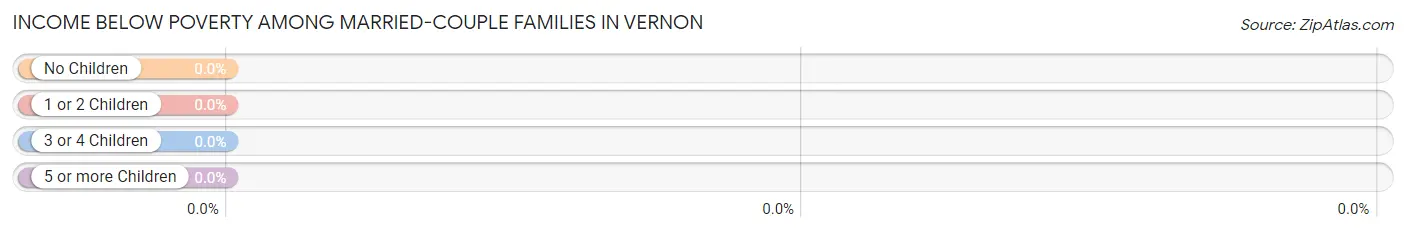
| Children | Above Poverty | Below Poverty |
| No Children | 19 (100.0%) | 0 (0.0%) |
| 1 or 2 Children | 4 (100.0%) | 0 (0.0%) |
| 3 or 4 Children | 8 (100.0%) | 0 (0.0%) |
| 5 or more Children | 0 (0.0%) | 0 (0.0%) |
| Total | 31 (100.0%) | 0 (0.0%) |
Income Below Poverty Among Single-Parent Households in Vernon
| Children | Single Father | Single Mother |
| No Children | 0 (0.0%) | 0 (0.0%) |
| 1 or 2 Children | 0 (0.0%) | 0 (0.0%) |
| 3 or 4 Children | 0 (0.0%) | 0 (0.0%) |
| 5 or more Children | 0 (0.0%) | 0 (0.0%) |
| Total | 0 (0.0%) | 0 (0.0%) |
Income Below Poverty Among Married-Couple vs Single-Parent Households in Vernon
| Children | Married-Couple Families | Single-Parent Households |
| No Children | 0 (0.0%) | 0 (0.0%) |
| 1 or 2 Children | 0 (0.0%) | 0 (0.0%) |
| 3 or 4 Children | 0 (0.0%) | 0 (0.0%) |
| 5 or more Children | 0 (0.0%) | 0 (0.0%) |
| Total | 0 (0.0%) | 0 (0.0%) |
Race in Vernon
The most populous races in Vernon are Hispanic or Latino (301 | 91.5%), Some other Race (198 | 60.2%), and White / Caucasian (111 | 33.7%).
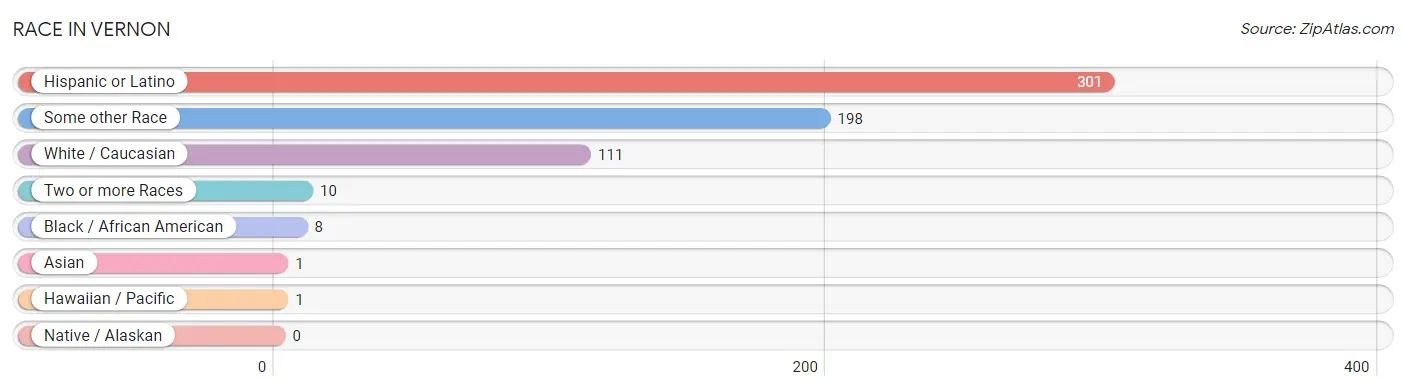
| Race | # Population | % Population |
| Asian | 1 | 0.3% |
| Black / African American | 8 | 2.4% |
| Hawaiian / Pacific | 1 | 0.3% |
| Hispanic or Latino | 301 | 91.5% |
| Native / Alaskan | 0 | 0.0% |
| White / Caucasian | 111 | 33.7% |
| Two or more Races | 10 | 3.0% |
| Some other Race | 198 | 60.2% |
| Total | 329 | 100.0% |
Ancestry in Vernon
The most populous ancestries reported in Vernon are Mexican (235 | 71.4%), Central American (61 | 18.5%), Salvadoran (49 | 14.9%), Guatemalan (11 | 3.3%), and American (8 | 2.4%), together accounting for 110.6% of all Vernon residents.
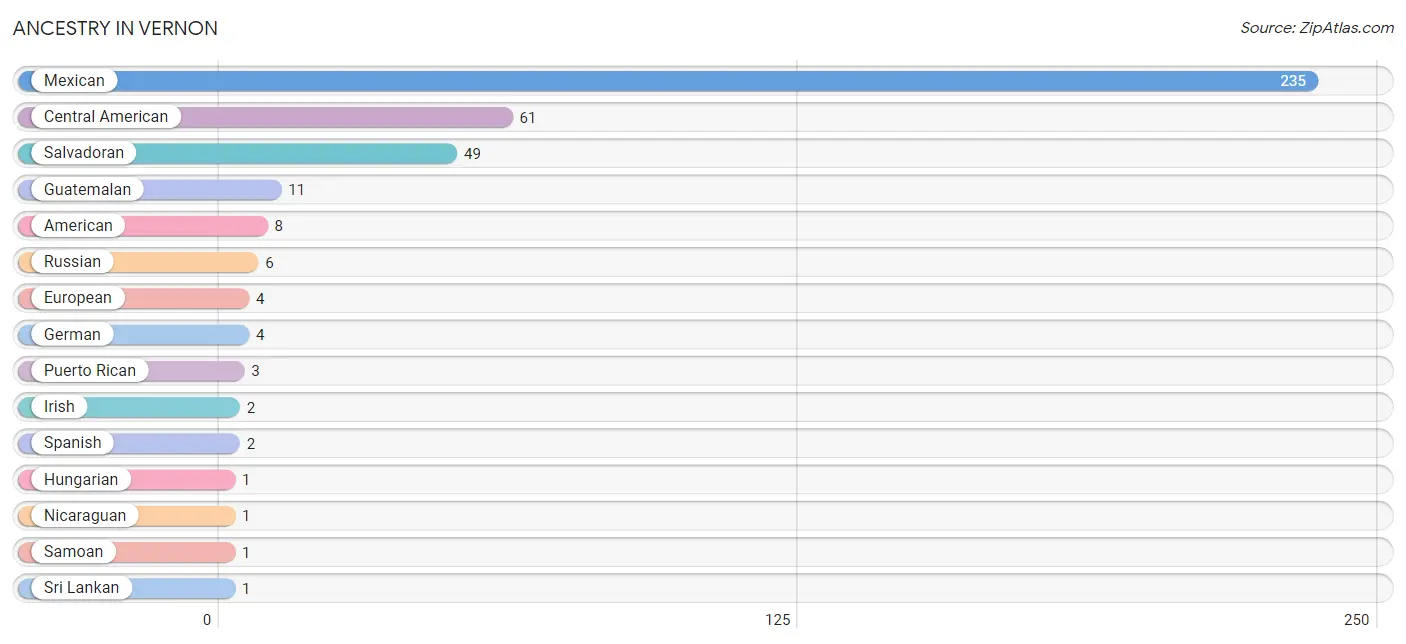
| Ancestry | # Population | % Population |
| American | 8 | 2.4% |
| Central American | 61 | 18.5% |
| European | 4 | 1.2% |
| German | 4 | 1.2% |
| Guatemalan | 11 | 3.3% |
| Hungarian | 1 | 0.3% |
| Irish | 2 | 0.6% |
| Mexican | 235 | 71.4% |
| Nicaraguan | 1 | 0.3% |
| Puerto Rican | 3 | 0.9% |
| Russian | 6 | 1.8% |
| Salvadoran | 49 | 14.9% |
| Samoan | 1 | 0.3% |
| Spanish | 2 | 0.6% |
| Sri Lankan | 1 | 0.3% | View All 15 Rows |
Immigrants in Vernon
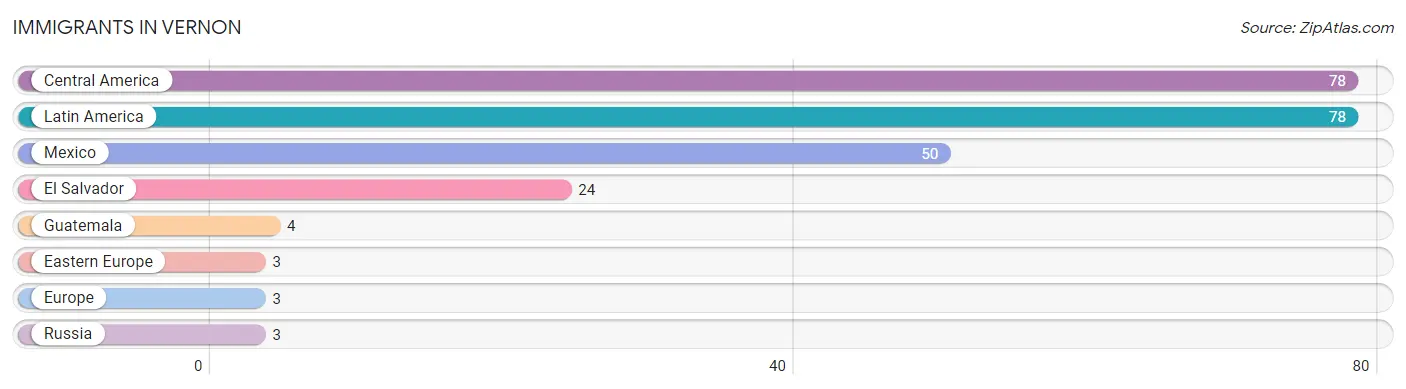
The most numerous immigrant groups reported in Vernon came from Central America (78 | 23.7%), Latin America (78 | 23.7%), Mexico (50 | 15.2%), El Salvador (24 | 7.3%), and Guatemala (4 | 1.2%), together accounting for 71.1% of all Vernon residents.
| Immigration Origin | # Population | % Population |
| Central America | 78 | 23.7% |
| Eastern Europe | 3 | 0.9% |
| El Salvador | 24 | 7.3% |
| Europe | 3 | 0.9% |
| Guatemala | 4 | 1.2% |
| Latin America | 78 | 23.7% |
| Mexico | 50 | 15.2% |
| Russia | 3 | 0.9% | View All 8 Rows |
Sex and Age in Vernon
Sex and Age in Vernon
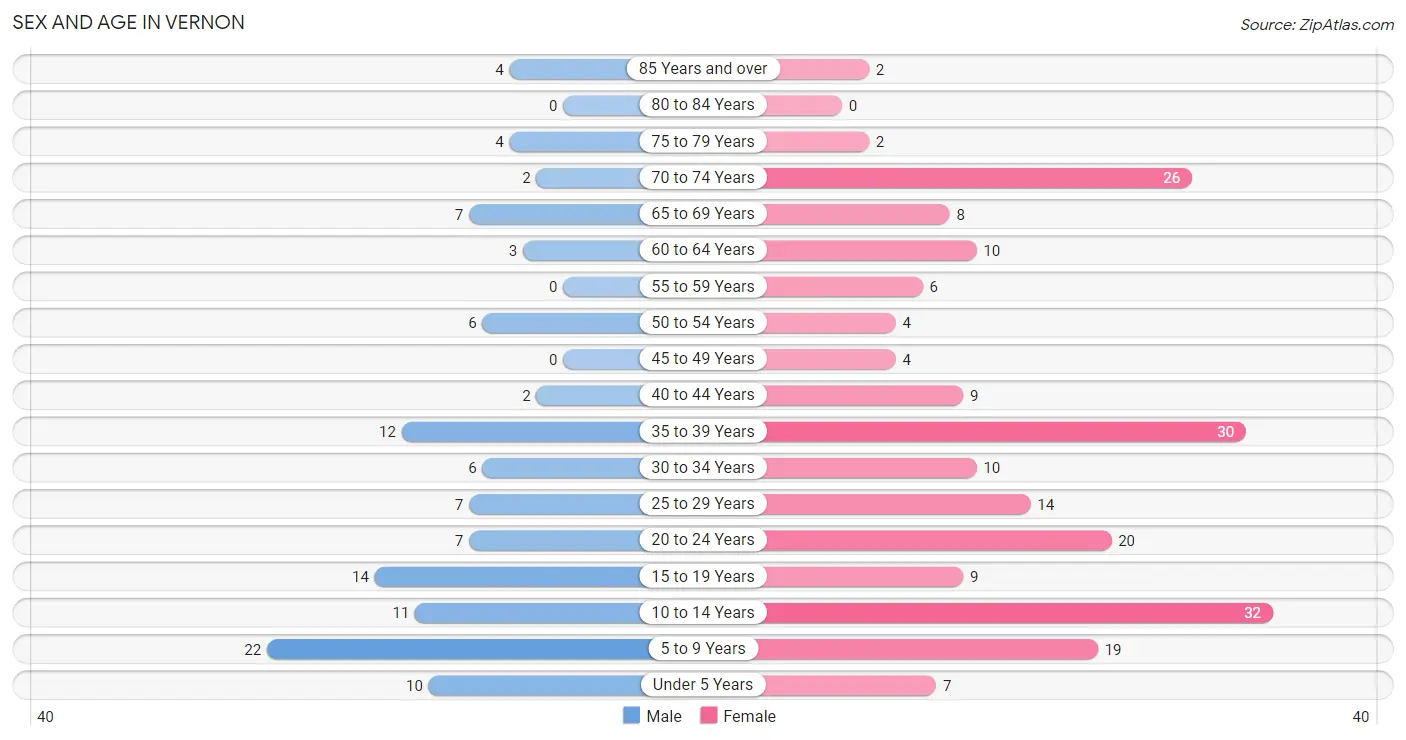
The most populous age groups in Vernon are 5 to 9 Years (22 | 18.8%) for men and 10 to 14 Years (32 | 15.1%) for women.
| Age Bracket | Male | Female |
| Under 5 Years | 10 (8.6%) | 7 (3.3%) |
| 5 to 9 Years | 22 (18.8%) | 19 (9.0%) |
| 10 to 14 Years | 11 (9.4%) | 32 (15.1%) |
| 15 to 19 Years | 14 (12.0%) | 9 (4.3%) |
| 20 to 24 Years | 7 (6.0%) | 20 (9.4%) |
| 25 to 29 Years | 7 (6.0%) | 14 (6.6%) |
| 30 to 34 Years | 6 (5.1%) | 10 (4.7%) |
| 35 to 39 Years | 12 (10.3%) | 30 (14.1%) |
| 40 to 44 Years | 2 (1.7%) | 9 (4.3%) |
| 45 to 49 Years | 0 (0.0%) | 4 (1.9%) |
| 50 to 54 Years | 6 (5.1%) | 4 (1.9%) |
| 55 to 59 Years | 0 (0.0%) | 6 (2.8%) |
| 60 to 64 Years | 3 (2.6%) | 10 (4.7%) |
| 65 to 69 Years | 7 (6.0%) | 8 (3.8%) |
| 70 to 74 Years | 2 (1.7%) | 26 (12.3%) |
| 75 to 79 Years | 4 (3.4%) | 2 (0.9%) |
| 80 to 84 Years | 0 (0.0%) | 0 (0.0%) |
| 85 Years and over | 4 (3.4%) | 2 (0.9%) |
| Total | 117 (100.0%) | 212 (100.0%) |
Families and Households in Vernon
Median Family Size in Vernon
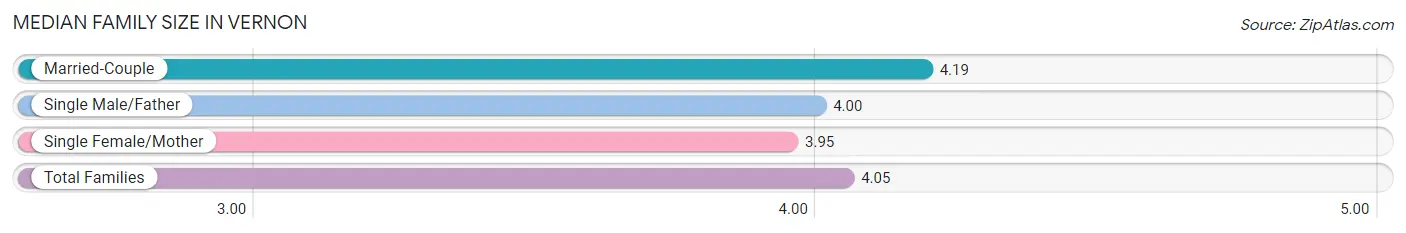
The median family size in Vernon is 4.05 persons per family, with married-couple families (31 | 40.8%) accounting for the largest median family size of 4.19 persons per family. On the other hand, single female/mother families (44 | 57.9%) represent the smallest median family size with 3.95 persons per family.
| Family Type | # Families | Family Size |
| Married-Couple | 31 (40.8%) | 4.19 |
| Single Male/Father | 1 (1.3%) | 4.00 |
| Single Female/Mother | 44 (57.9%) | 3.95 |
| Total Families | 76 (100.0%) | 4.05 |
Median Household Size in Vernon
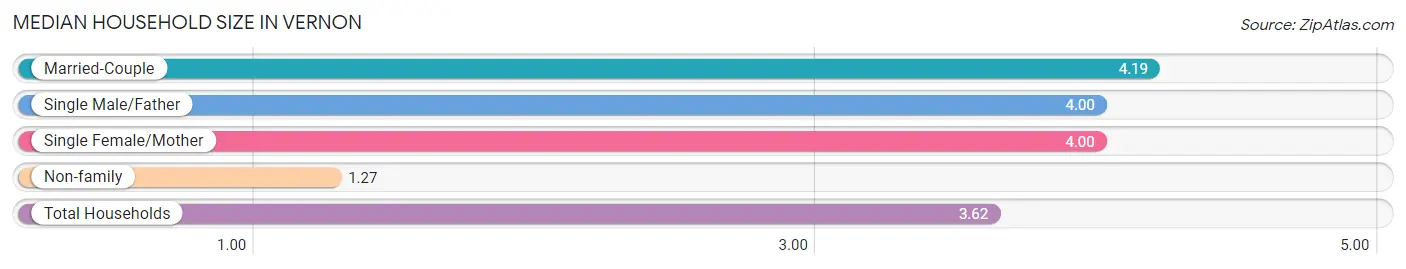
The median household size in Vernon is 3.62 persons per household, with married-couple households (31 | 34.1%) accounting for the largest median household size of 4.19 persons per household. non-family households (15 | 16.5%) represent the smallest median household size with 1.27 persons per household.
| Household Type | # Households | Household Size |
| Married-Couple | 31 (34.1%) | 4.19 |
| Single Male/Father | 1 (1.1%) | 4.00 |
| Single Female/Mother | 44 (48.3%) | 4.00 |
| Non-family | 15 (16.5%) | 1.27 |
| Total Households | 91 (100.0%) | 3.62 |
Household Size by Marriage Status in Vernon
Out of a total of 91 households in Vernon, 76 (83.5%) are family households, while 15 (16.5%) are nonfamily households. The most numerous type of family households are 3-person households, comprising 26, and the most common type of nonfamily households are 1-person households, comprising 11.
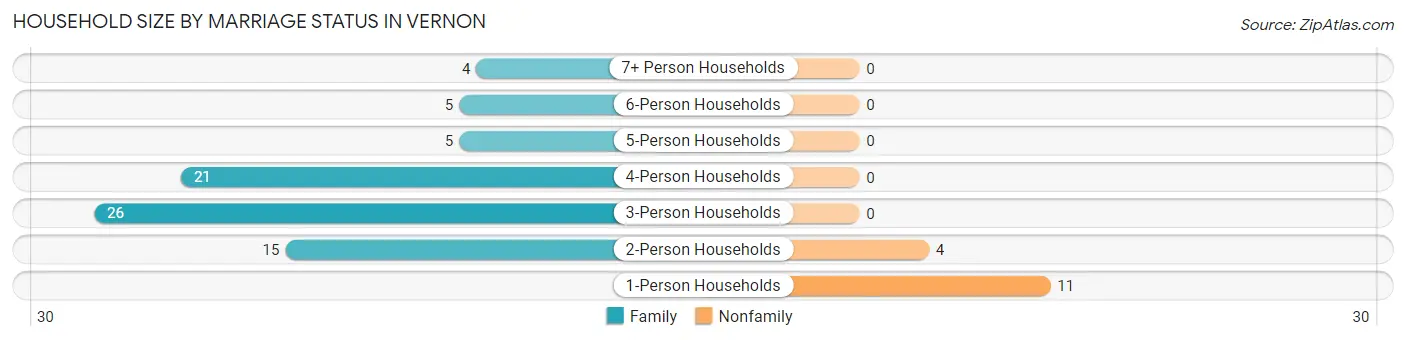
| Household Size | Family Households | Nonfamily Households |
| 1-Person Households | - | 11 (12.1%) |
| 2-Person Households | 15 (16.5%) | 4 (4.4%) |
| 3-Person Households | 26 (28.6%) | 0 (0.0%) |
| 4-Person Households | 21 (23.1%) | 0 (0.0%) |
| 5-Person Households | 5 (5.5%) | 0 (0.0%) |
| 6-Person Households | 5 (5.5%) | 0 (0.0%) |
| 7+ Person Households | 4 (4.4%) | 0 (0.0%) |
| Total | 76 (83.5%) | 15 (16.5%) |
Female Fertility in Vernon
Fertility by Age in Vernon
| Age Bracket | Women with Births | Births / 1,000 Women |
| 15 to 19 years | 0 (0.0%) | 0.0 |
| 20 to 34 years | 0 (0.0%) | 0.0 |
| 35 to 50 years | 0 (0.0%) | 0.0 |
| Total | 0 (0.0%) | 0.0 |
Fertility by Age by Marriage Status in Vernon
| Age Bracket | Married | Unmarried |
| 15 to 19 years | 0 (0.0%) | 0 (0.0%) |
| 20 to 34 years | 0 (0.0%) | 0 (0.0%) |
| 35 to 50 years | 0 (0.0%) | 0 (0.0%) |
| Total | 0 (0.0%) | 0 (0.0%) |
Fertility by Education in Vernon
| Educational Attainment | Women with Births | Births / 1,000 Women |
| Less than High School | 0 (0.0%) | 0.0 |
| High School Diploma | 0 (0.0%) | 0.0 |
| College or Associate's Degree | 0 (0.0%) | 0.0 |
| Bachelor's Degree | 0 (0.0%) | 0.0 |
| Graduate Degree | 0 (0.0%) | 0.0 |
| Total | 0 (0.0%) | 0.0 |
Fertility by Education by Marriage Status in Vernon
| Educational Attainment | Married | Unmarried |
| Less than High School | 0 (0.0%) | 0 (0.0%) |
| High School Diploma | 0 (0.0%) | 0 (0.0%) |
| College or Associate's Degree | 0 (0.0%) | 0 (0.0%) |
| Bachelor's Degree | 0 (0.0%) | 0 (0.0%) |
| Graduate Degree | 0 (0.0%) | 0 (0.0%) |
| Total | 0 (0.0%) | 0 (0.0%) |
Employment Characteristics in Vernon
Employment by Class of Employer in Vernon
Among the 119 employed individuals in Vernon, private company employees (68 | 57.1%), local government employees (32 | 26.9%), and not-for-profit organizations (6 | 5.0%) make up the most common classes of employment.
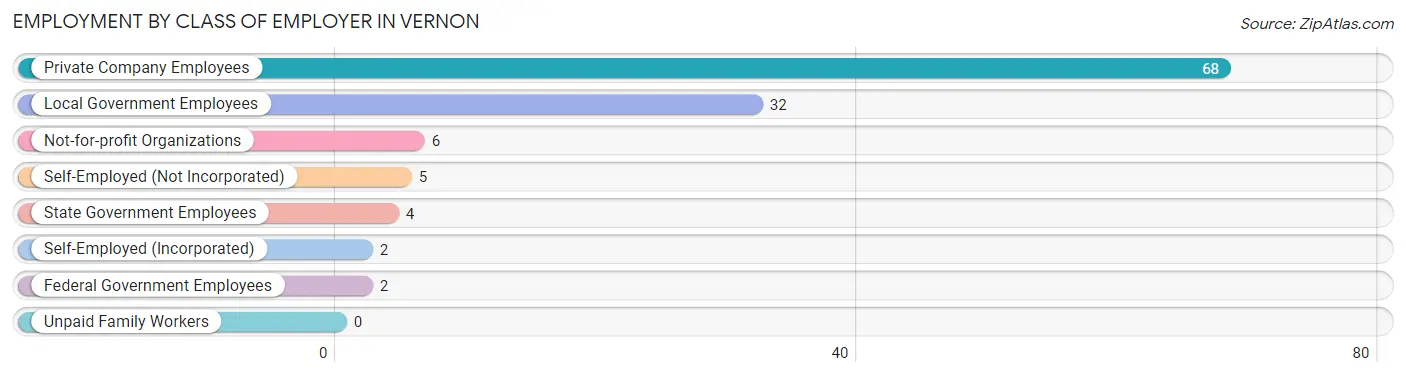
| Employer Class | # Employees | % Employees |
| Private Company Employees | 68 | 57.1% |
| Self-Employed (Incorporated) | 2 | 1.7% |
| Self-Employed (Not Incorporated) | 5 | 4.2% |
| Not-for-profit Organizations | 6 | 5.0% |
| Local Government Employees | 32 | 26.9% |
| State Government Employees | 4 | 3.4% |
| Federal Government Employees | 2 | 1.7% |
| Unpaid Family Workers | 0 | 0.0% |
| Total | 119 | 100.0% |
Employment Status by Age in Vernon
According to the labor force statistics for Vernon, out of the total population over 16 years of age (226), 57.5% or 130 individuals are in the labor force, with 8.6% or 11 of them unemployed. The age group with the highest labor force participation rate is 30 to 34 years, with 100.0% or 16 individuals in the labor force. Within the labor force, the 20 to 24 years age range has the highest percentage of unemployed individuals, with 50.0% or 8 of them being unemployed.
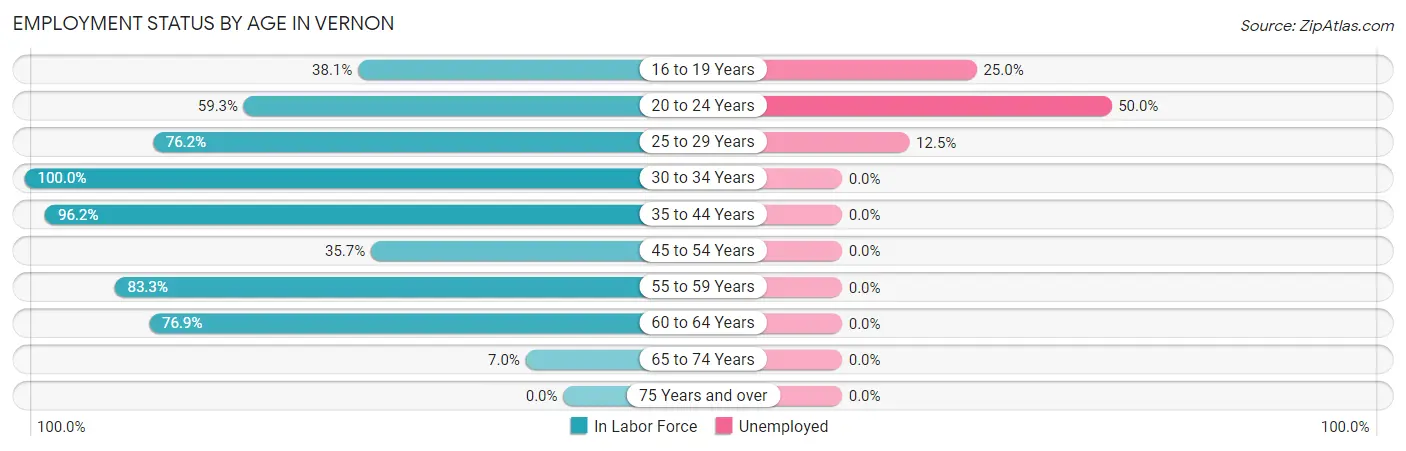
| Age Bracket | In Labor Force | Unemployed |
| 16 to 19 Years | 8 (38.1%) | 2 (25.0%) |
| 20 to 24 Years | 16 (59.3%) | 8 (50.0%) |
| 25 to 29 Years | 16 (76.2%) | 2 (12.5%) |
| 30 to 34 Years | 16 (100.0%) | 0 (0.0%) |
| 35 to 44 Years | 51 (96.2%) | 0 (0.0%) |
| 45 to 54 Years | 5 (35.7%) | 0 (0.0%) |
| 55 to 59 Years | 5 (83.3%) | 0 (0.0%) |
| 60 to 64 Years | 10 (76.9%) | 0 (0.0%) |
| 65 to 74 Years | 3 (7.0%) | 0 (0.0%) |
| 75 Years and over | 0 (0.0%) | 0 (0.0%) |
| Total | 130 (57.5%) | 11 (8.6%) |
Employment Status by Educational Attainment in Vernon
According to labor force statistics for Vernon, 83.7% of individuals (103) out of the total population between 25 and 64 years of age (123) are in the labor force, with 1.9% or 2 of them being unemployed. The group with the highest labor force participation rate are those with the educational attainment of college / associate degree, with 92.1% or 58 individuals in the labor force. Within the labor force, individuals with college / associate degree education have the highest percentage of unemployment, with 3.4% or 2 of them being unemployed.
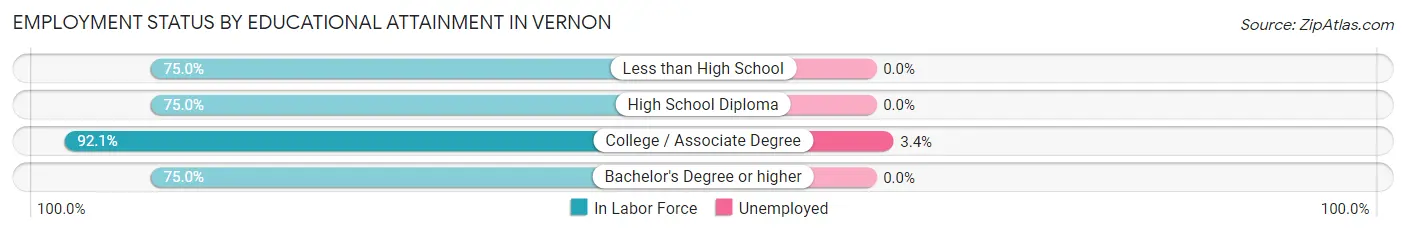
| Educational Attainment | In Labor Force | Unemployed |
| Less than High School | 15 (75.0%) | 0 (0.0%) |
| High School Diploma | 15 (75.0%) | 0 (0.0%) |
| College / Associate Degree | 58 (92.1%) | 2 (3.4%) |
| Bachelor's Degree or higher | 15 (75.0%) | 0 (0.0%) |
| Total | 103 (83.7%) | 2 (1.9%) |
Employment Occupations by Sex in Vernon
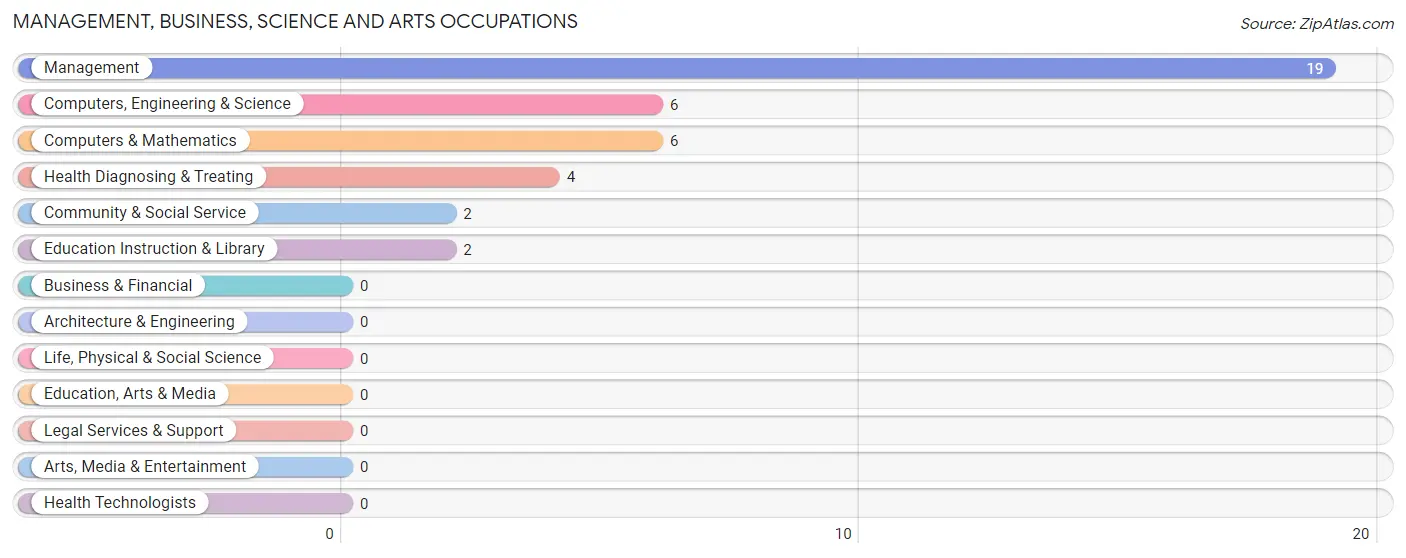
Management, Business, Science and Arts Occupations
The most common Management, Business, Science and Arts occupations in Vernon are Management (19 | 16.2%), Computers, Engineering & Science (6 | 5.1%), Computers & Mathematics (6 | 5.1%), Health Diagnosing & Treating (4 | 3.4%), and Community & Social Service (2 | 1.7%).
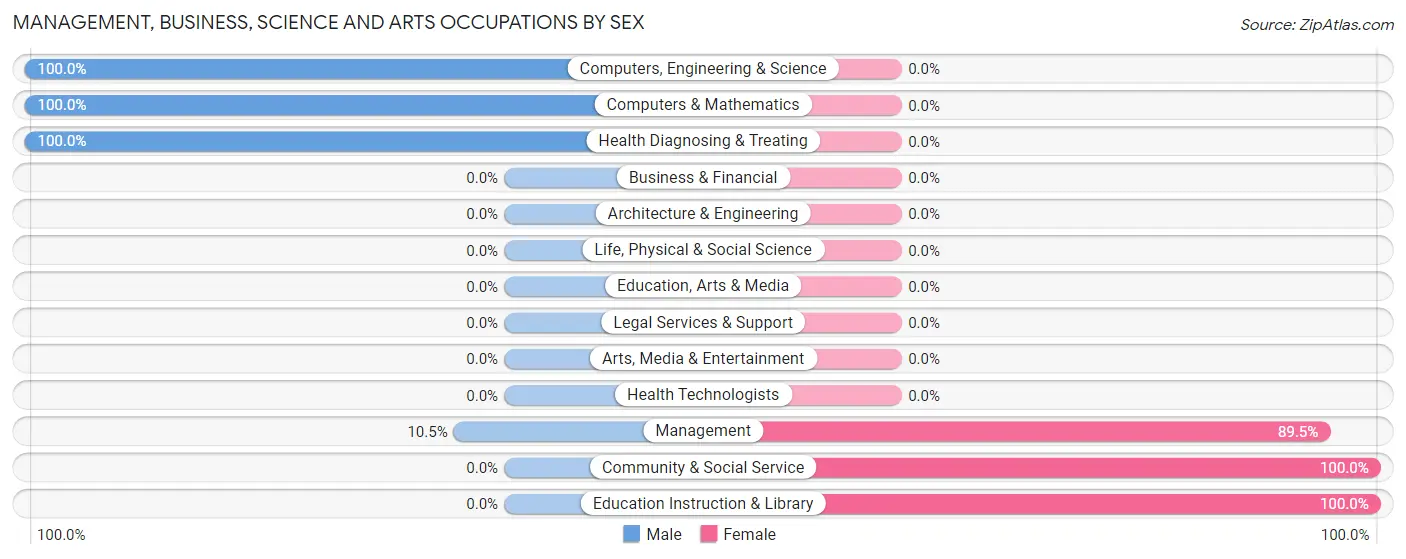
Management, Business, Science and Arts Occupations by Sex
Within the Management, Business, Science and Arts occupations in Vernon, the most male-oriented occupations are Computers, Engineering & Science (100.0%), Computers & Mathematics (100.0%), and Health Diagnosing & Treating (100.0%), while the most female-oriented occupations are Community & Social Service (100.0%), Education Instruction & Library (100.0%), and Management (89.5%).
| Occupation | Male | Female |
| Management | 2 (10.5%) | 17 (89.5%) |
| Business & Financial | 0 (0.0%) | 0 (0.0%) |
| Computers, Engineering & Science | 6 (100.0%) | 0 (0.0%) |
| Computers & Mathematics | 6 (100.0%) | 0 (0.0%) |
| Architecture & Engineering | 0 (0.0%) | 0 (0.0%) |
| Life, Physical & Social Science | 0 (0.0%) | 0 (0.0%) |
| Community & Social Service | 0 (0.0%) | 2 (100.0%) |
| Education, Arts & Media | 0 (0.0%) | 0 (0.0%) |
| Legal Services & Support | 0 (0.0%) | 0 (0.0%) |
| Education Instruction & Library | 0 (0.0%) | 2 (100.0%) |
| Arts, Media & Entertainment | 0 (0.0%) | 0 (0.0%) |
| Health Diagnosing & Treating | 4 (100.0%) | 0 (0.0%) |
| Health Technologists | 0 (0.0%) | 0 (0.0%) |
| Total (Category) | 12 (38.7%) | 19 (61.3%) |
| Total (Overall) | 30 (25.6%) | 87 (74.4%) |
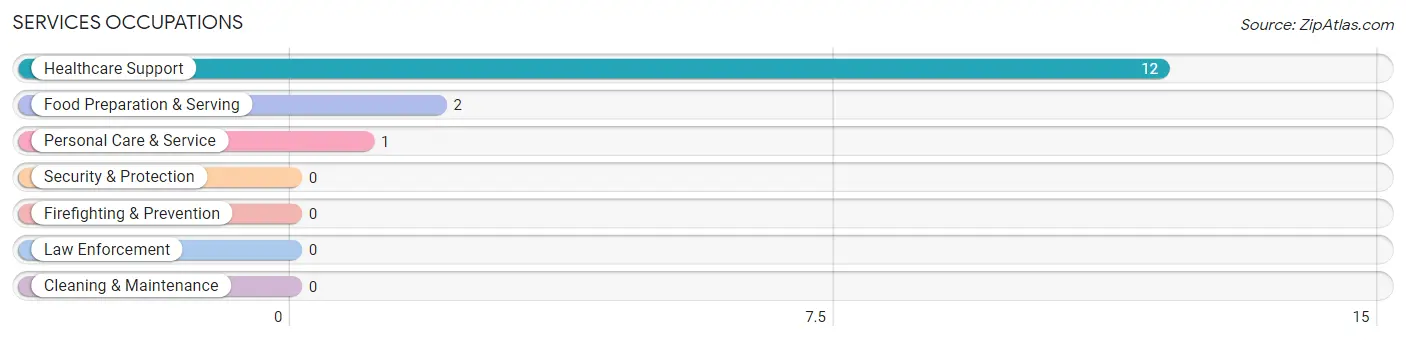
Services Occupations
The most common Services occupations in Vernon are Healthcare Support (12 | 10.3%), Food Preparation & Serving (2 | 1.7%), and Personal Care & Service (1 | 0.9%).
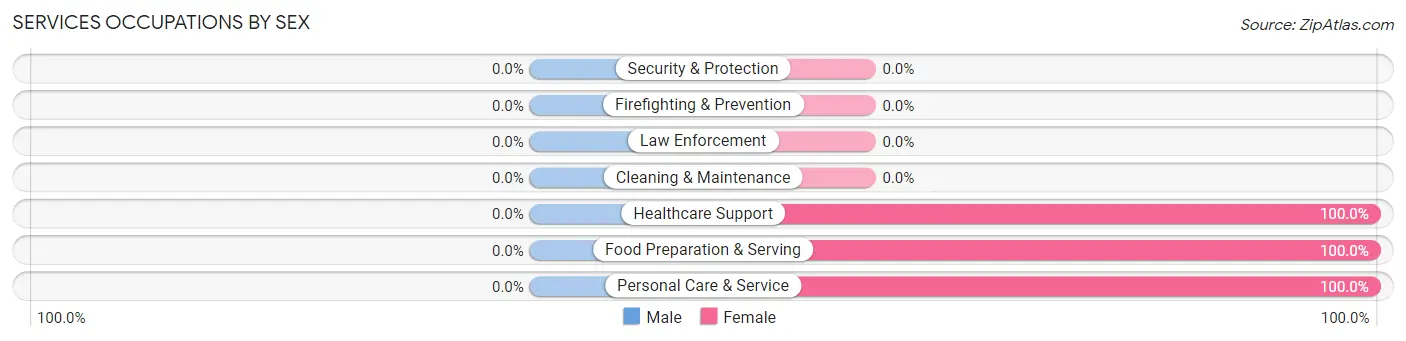
Services Occupations by Sex
| Occupation | Male | Female |
| Healthcare Support | 0 (0.0%) | 12 (100.0%) |
| Security & Protection | 0 (0.0%) | 0 (0.0%) |
| Firefighting & Prevention | 0 (0.0%) | 0 (0.0%) |
| Law Enforcement | 0 (0.0%) | 0 (0.0%) |
| Food Preparation & Serving | 0 (0.0%) | 2 (100.0%) |
| Cleaning & Maintenance | 0 (0.0%) | 0 (0.0%) |
| Personal Care & Service | 0 (0.0%) | 1 (100.0%) |
| Total (Category) | 0 (0.0%) | 15 (100.0%) |
| Total (Overall) | 30 (25.6%) | 87 (74.4%) |
Sales and Office Occupations
The most common Sales and Office occupations in Vernon are Office & Administration (35 | 29.9%), and Sales & Related (4 | 3.4%).
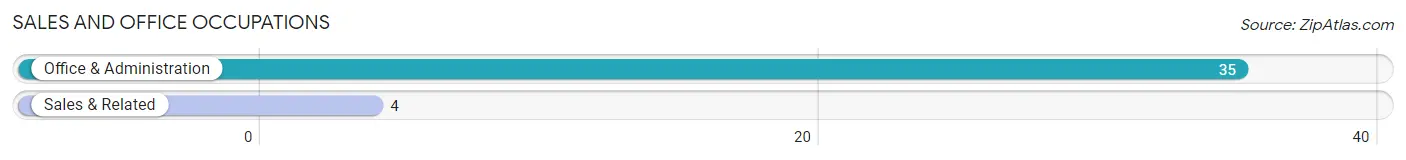
Sales and Office Occupations by Sex
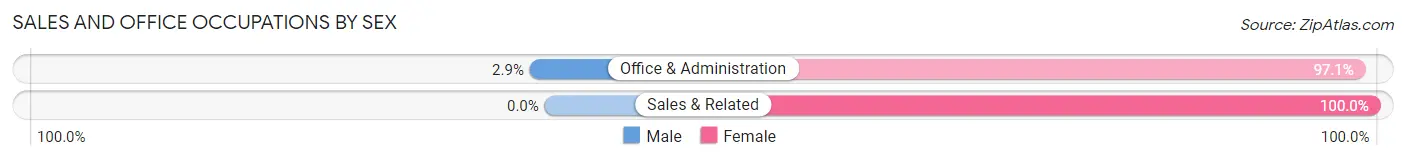
| Occupation | Male | Female |
| Sales & Related | 0 (0.0%) | 4 (100.0%) |
| Office & Administration | 1 (2.9%) | 34 (97.1%) |
| Total (Category) | 1 (2.6%) | 38 (97.4%) |
| Total (Overall) | 30 (25.6%) | 87 (74.4%) |
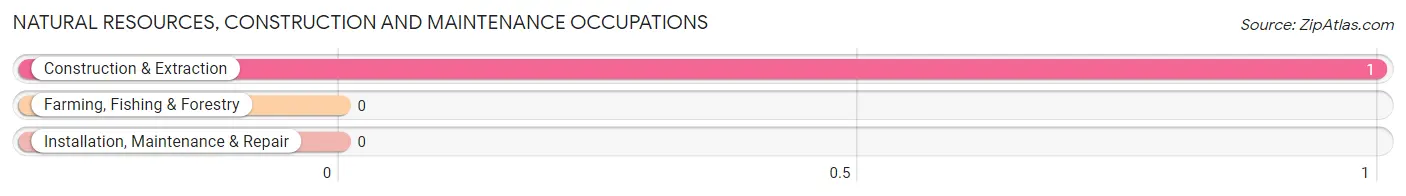
Natural Resources, Construction and Maintenance Occupations
The most common Natural Resources, Construction and Maintenance occupations in Vernon are , and Construction & Extraction (1 | 0.9%).
Natural Resources, Construction and Maintenance Occupations by Sex
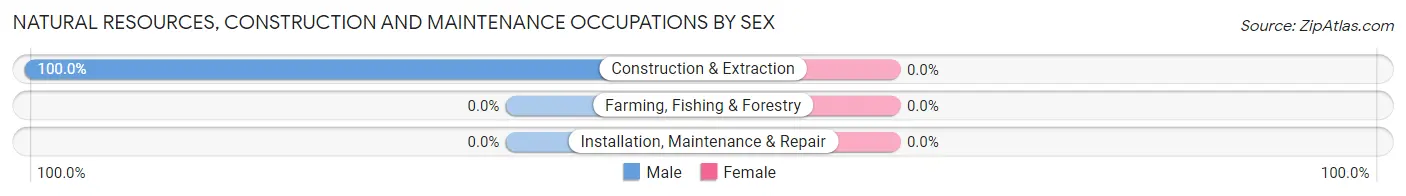
| Occupation | Male | Female |
| Farming, Fishing & Forestry | 0 (0.0%) | 0 (0.0%) |
| Construction & Extraction | 1 (100.0%) | 0 (0.0%) |
| Installation, Maintenance & Repair | 0 (0.0%) | 0 (0.0%) |
| Total (Category) | 1 (100.0%) | 0 (0.0%) |
| Total (Overall) | 30 (25.6%) | 87 (74.4%) |
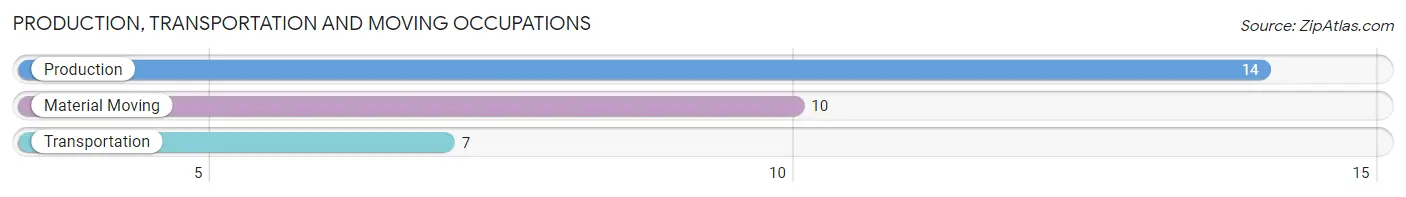
Production, Transportation and Moving Occupations
The most common Production, Transportation and Moving occupations in Vernon are Production (14 | 12.0%), Material Moving (10 | 8.6%), and Transportation (7 | 6.0%).
Production, Transportation and Moving Occupations by Sex
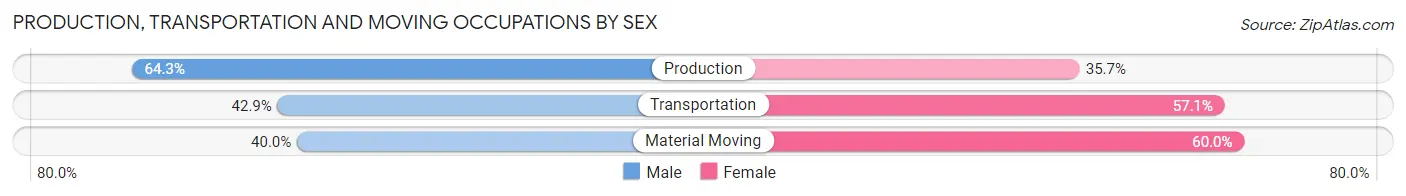
| Occupation | Male | Female |
| Production | 9 (64.3%) | 5 (35.7%) |
| Transportation | 3 (42.9%) | 4 (57.1%) |
| Material Moving | 4 (40.0%) | 6 (60.0%) |
| Total (Category) | 16 (51.6%) | 15 (48.4%) |
| Total (Overall) | 30 (25.6%) | 87 (74.4%) |
Employment Industries by Sex in Vernon
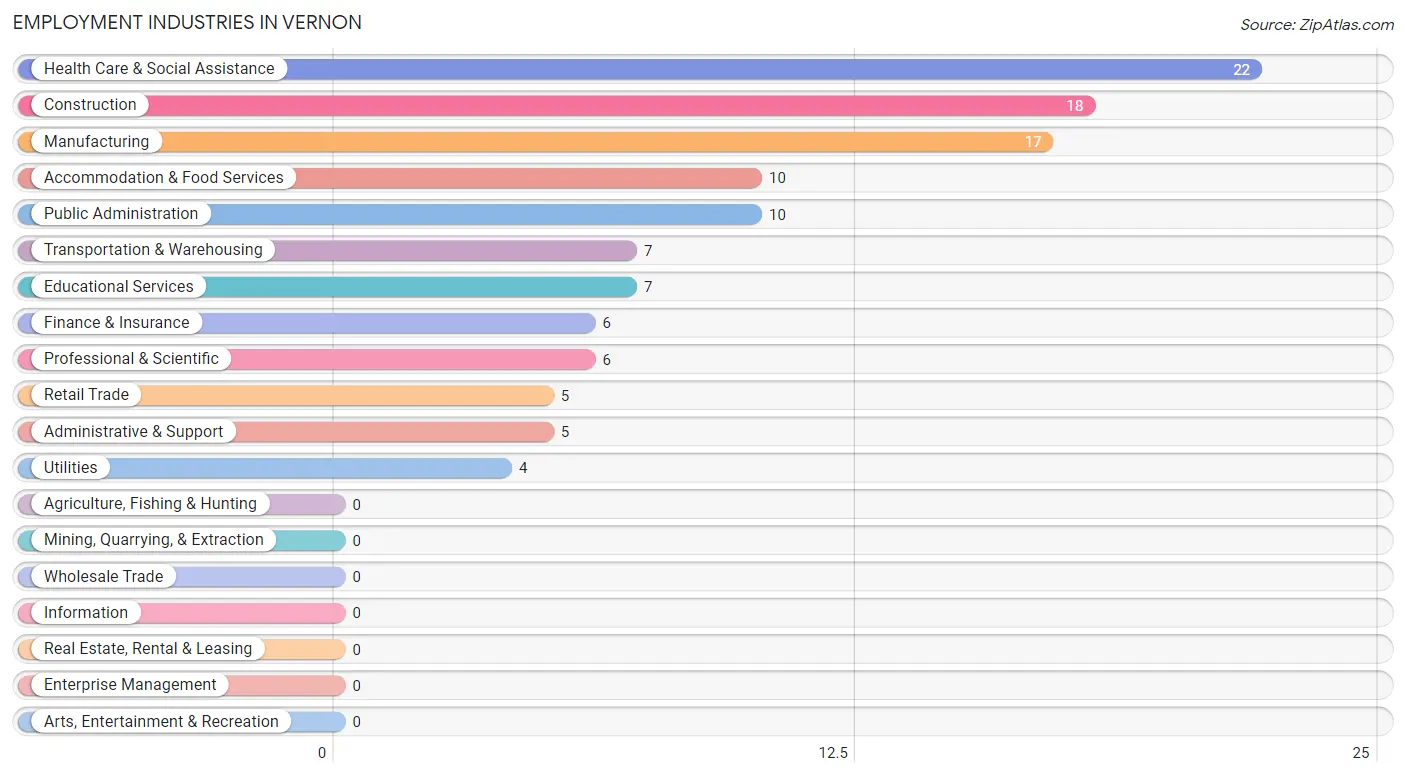
Employment Industries in Vernon
The major employment industries in Vernon include Health Care & Social Assistance (22 | 18.8%), Construction (18 | 15.4%), Manufacturing (17 | 14.5%), Accommodation & Food Services (10 | 8.6%), and Public Administration (10 | 8.6%).
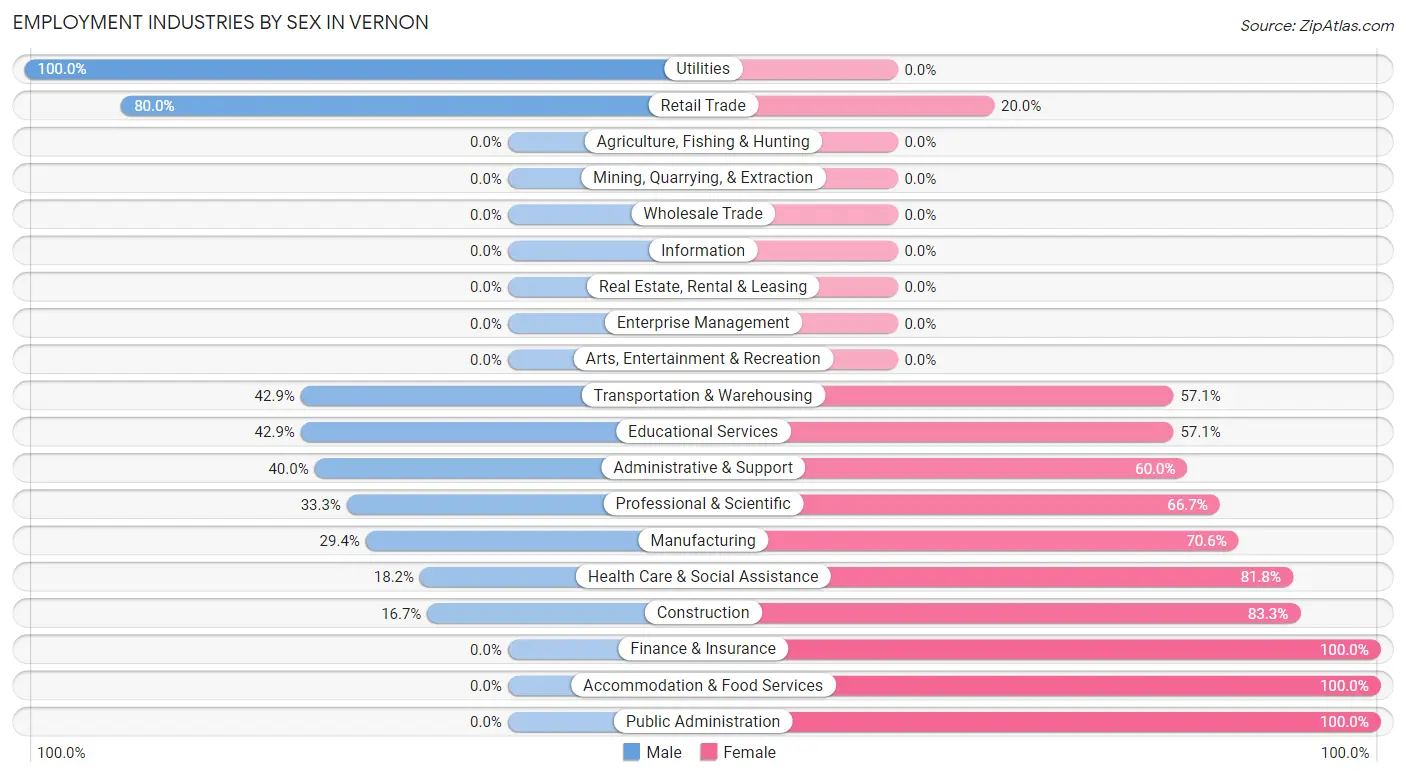
Employment Industries by Sex in Vernon
The Vernon industries that see more men than women are Utilities (100.0%), Retail Trade (80.0%), and Transportation & Warehousing (42.9%), whereas the industries that tend to have a higher number of women are Finance & Insurance (100.0%), Accommodation & Food Services (100.0%), and Public Administration (100.0%).
| Industry | Male | Female |
| Agriculture, Fishing & Hunting | 0 (0.0%) | 0 (0.0%) |
| Mining, Quarrying, & Extraction | 0 (0.0%) | 0 (0.0%) |
| Construction | 3 (16.7%) | 15 (83.3%) |
| Manufacturing | 5 (29.4%) | 12 (70.6%) |
| Wholesale Trade | 0 (0.0%) | 0 (0.0%) |
| Retail Trade | 4 (80.0%) | 1 (20.0%) |
| Transportation & Warehousing | 3 (42.9%) | 4 (57.1%) |
| Utilities | 4 (100.0%) | 0 (0.0%) |
| Information | 0 (0.0%) | 0 (0.0%) |
| Finance & Insurance | 0 (0.0%) | 6 (100.0%) |
| Real Estate, Rental & Leasing | 0 (0.0%) | 0 (0.0%) |
| Professional & Scientific | 2 (33.3%) | 4 (66.7%) |
| Enterprise Management | 0 (0.0%) | 0 (0.0%) |
| Administrative & Support | 2 (40.0%) | 3 (60.0%) |
| Educational Services | 3 (42.9%) | 4 (57.1%) |
| Health Care & Social Assistance | 4 (18.2%) | 18 (81.8%) |
| Arts, Entertainment & Recreation | 0 (0.0%) | 0 (0.0%) |
| Accommodation & Food Services | 0 (0.0%) | 10 (100.0%) |
| Public Administration | 0 (0.0%) | 10 (100.0%) |
| Total | 30 (25.6%) | 87 (74.4%) |
Education in Vernon
School Enrollment in Vernon
The most common levels of schooling among the 149 students in Vernon are college / undergraduate (45 | 30.2%), high school (38 | 25.5%), and elementary school (31 | 20.8%).
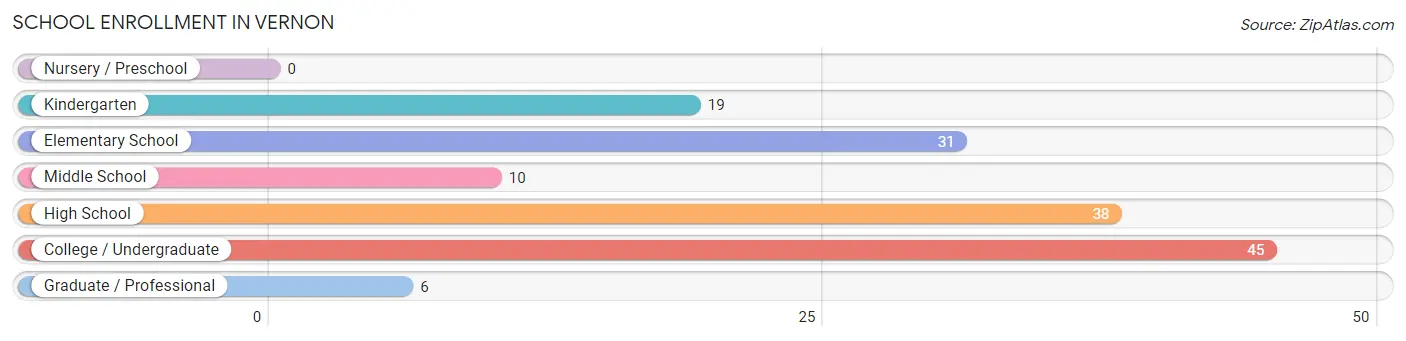
| School Level | # Students | % Students |
| Nursery / Preschool | 0 | 0.0% |
| Kindergarten | 19 | 12.8% |
| Elementary School | 31 | 20.8% |
| Middle School | 10 | 6.7% |
| High School | 38 | 25.5% |
| College / Undergraduate | 45 | 30.2% |
| Graduate / Professional | 6 | 4.0% |
| Total | 149 | 100.0% |
School Enrollment by Age by Funding Source in Vernon
Out of a total of 149 students who are enrolled in schools in Vernon, 1 (0.7%) attend a private institution, while the remaining 148 (99.3%) are enrolled in public schools. The age group of 25 to 34 year olds has the highest likelihood of being enrolled in private schools, with 1 (7.7% in the age bracket) enrolled. Conversely, the age group of 5 to 9 year old has the lowest likelihood of being enrolled in a private school, with 41 (100.0% in the age bracket) attending a public institution.
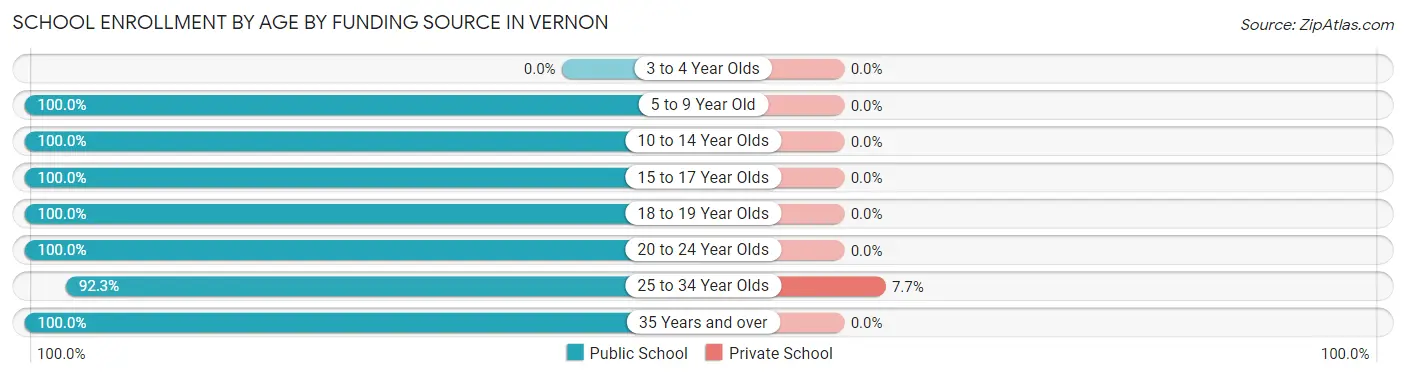
| Age Bracket | Public School | Private School |
| 3 to 4 Year Olds | 0 (0.0%) | 0 (0.0%) |
| 5 to 9 Year Old | 41 (100.0%) | 0 (0.0%) |
| 10 to 14 Year Olds | 43 (100.0%) | 0 (0.0%) |
| 15 to 17 Year Olds | 12 (100.0%) | 0 (0.0%) |
| 18 to 19 Year Olds | 5 (100.0%) | 0 (0.0%) |
| 20 to 24 Year Olds | 18 (100.0%) | 0 (0.0%) |
| 25 to 34 Year Olds | 12 (92.3%) | 1 (7.7%) |
| 35 Years and over | 17 (100.0%) | 0 (0.0%) |
| Total | 148 (99.3%) | 1 (0.7%) |
Educational Attainment by Field of Study in Vernon
Bio, nature & agricultural (5 | 21.7%), multidisciplinary studies (5 | 21.7%), arts & humanities (5 | 21.7%), psychology (2 | 8.7%), and engineering (2 | 8.7%) are the most common fields of study among 23 individuals in Vernon who have obtained a bachelor's degree or higher.
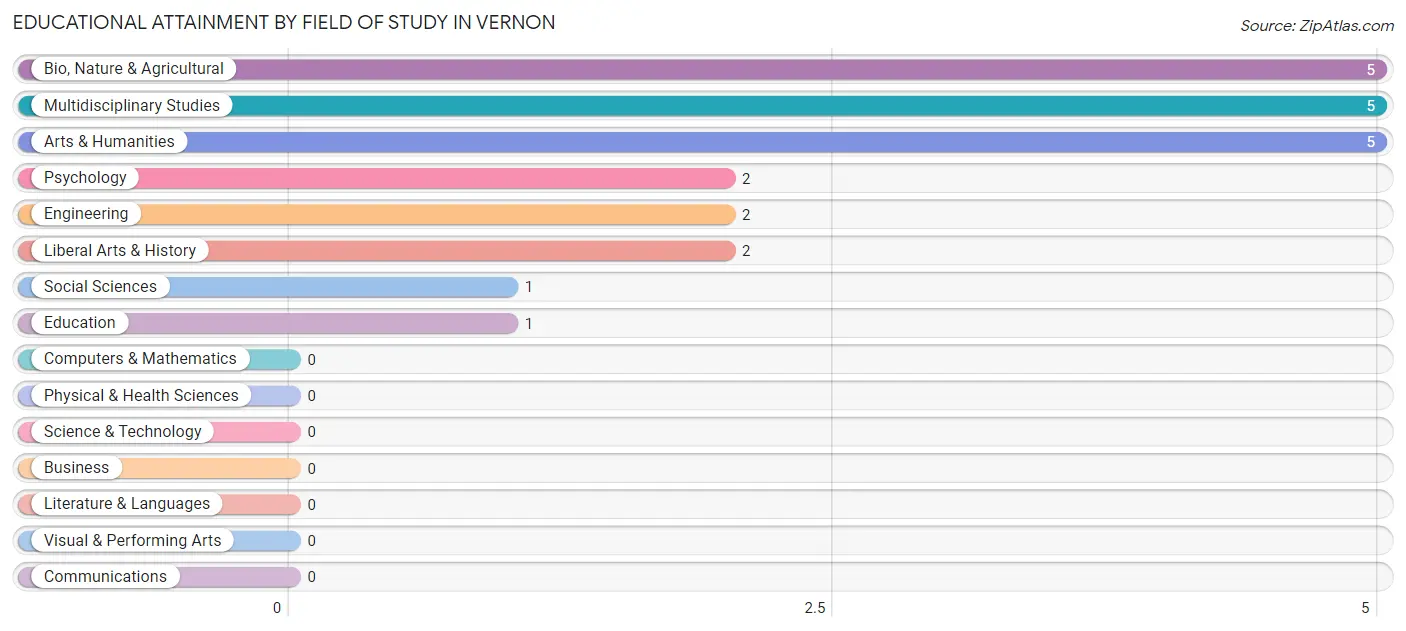
| Field of Study | # Graduates | % Graduates |
| Computers & Mathematics | 0 | 0.0% |
| Bio, Nature & Agricultural | 5 | 21.7% |
| Physical & Health Sciences | 0 | 0.0% |
| Psychology | 2 | 8.7% |
| Social Sciences | 1 | 4.3% |
| Engineering | 2 | 8.7% |
| Multidisciplinary Studies | 5 | 21.7% |
| Science & Technology | 0 | 0.0% |
| Business | 0 | 0.0% |
| Education | 1 | 4.3% |
| Literature & Languages | 0 | 0.0% |
| Liberal Arts & History | 2 | 8.7% |
| Visual & Performing Arts | 0 | 0.0% |
| Communications | 0 | 0.0% |
| Arts & Humanities | 5 | 21.7% |
| Total | 23 | 100.0% |
Transportation & Commute in Vernon
Vehicle Availability by Sex in Vernon
The most prevalent vehicle ownership categories in Vernon are males with 2 vehicles (15, accounting for 50.0%) and females with 2 vehicles (34, making up 16.9%).
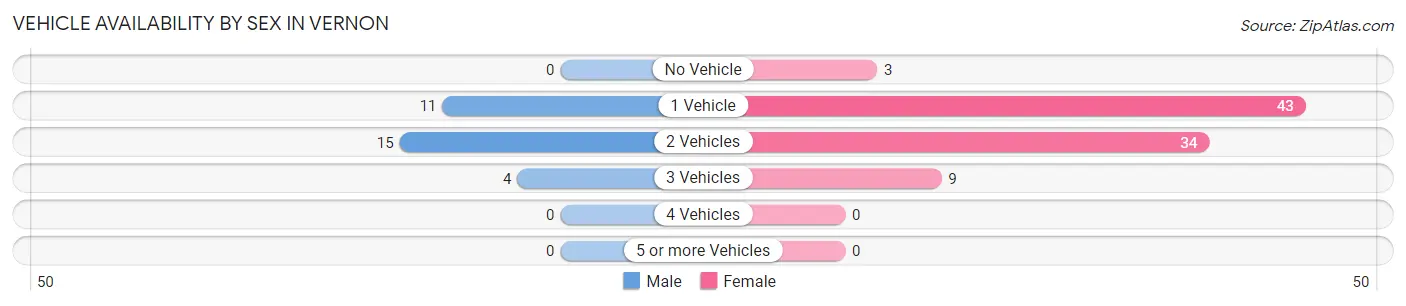
| Vehicles Available | Male | Female |
| No Vehicle | 0 (0.0%) | 3 (3.4%) |
| 1 Vehicle | 11 (36.7%) | 43 (48.3%) |
| 2 Vehicles | 15 (50.0%) | 34 (38.2%) |
| 3 Vehicles | 4 (13.3%) | 9 (10.1%) |
| 4 Vehicles | 0 (0.0%) | 0 (0.0%) |
| 5 or more Vehicles | 0 (0.0%) | 0 (0.0%) |
| Total | 30 (100.0%) | 89 (100.0%) |
Commute Time in Vernon
The most frequently occuring commute durations in Vernon are 40 to 44 minutes (20 commuters, 17.9%), 20 to 24 minutes (14 commuters, 12.5%), and 30 to 34 minutes (14 commuters, 12.5%).
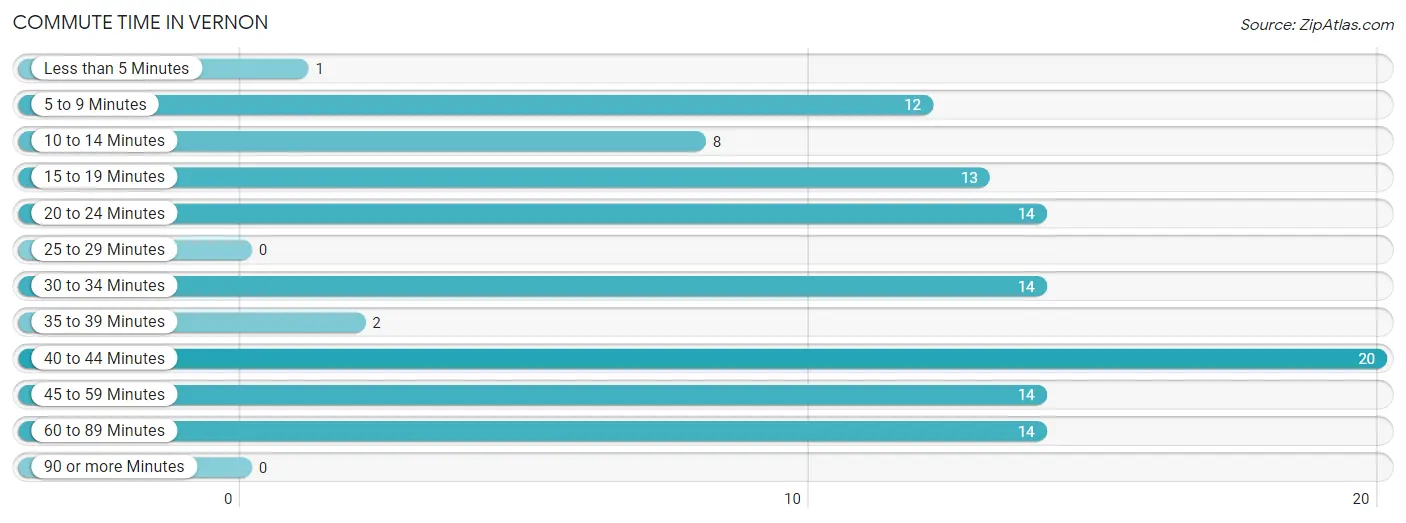
| Commute Time | # Commuters | % Commuters |
| Less than 5 Minutes | 1 | 0.9% |
| 5 to 9 Minutes | 12 | 10.7% |
| 10 to 14 Minutes | 8 | 7.1% |
| 15 to 19 Minutes | 13 | 11.6% |
| 20 to 24 Minutes | 14 | 12.5% |
| 25 to 29 Minutes | 0 | 0.0% |
| 30 to 34 Minutes | 14 | 12.5% |
| 35 to 39 Minutes | 2 | 1.8% |
| 40 to 44 Minutes | 20 | 17.9% |
| 45 to 59 Minutes | 14 | 12.5% |
| 60 to 89 Minutes | 14 | 12.5% |
| 90 or more Minutes | 0 | 0.0% |
Commute Time by Sex in Vernon
The most common commute times in Vernon are 5 to 9 minutes (9 commuters, 30.0%) for males and 40 to 44 minutes (15 commuters, 18.3%) for females.
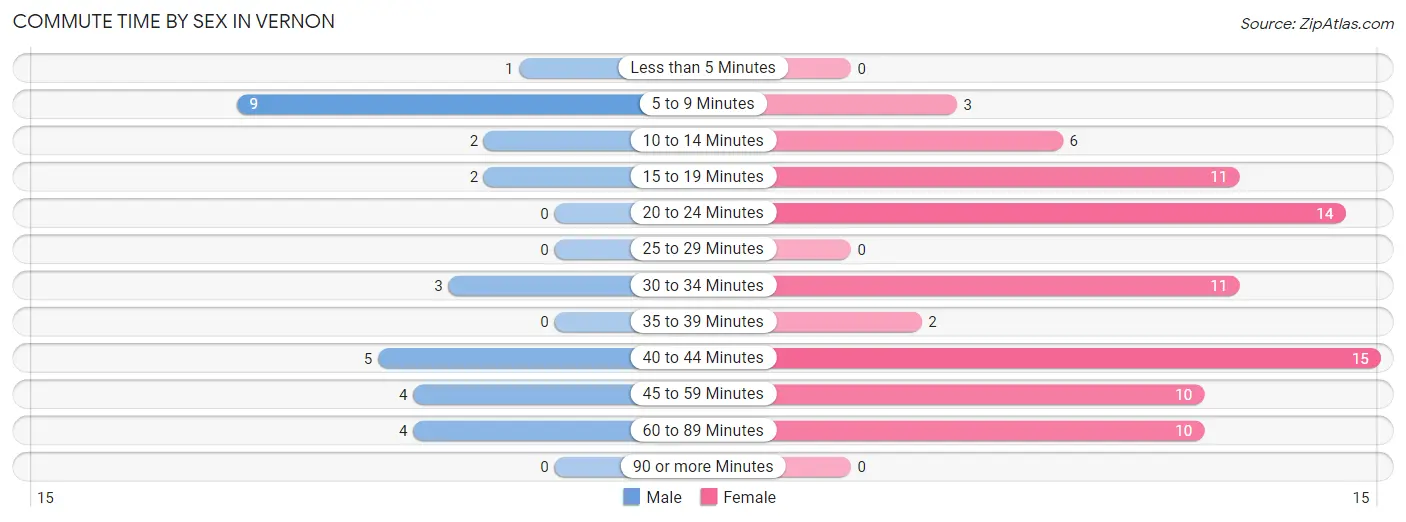
| Commute Time | Male | Female |
| Less than 5 Minutes | 1 (3.3%) | 0 (0.0%) |
| 5 to 9 Minutes | 9 (30.0%) | 3 (3.7%) |
| 10 to 14 Minutes | 2 (6.7%) | 6 (7.3%) |
| 15 to 19 Minutes | 2 (6.7%) | 11 (13.4%) |
| 20 to 24 Minutes | 0 (0.0%) | 14 (17.1%) |
| 25 to 29 Minutes | 0 (0.0%) | 0 (0.0%) |
| 30 to 34 Minutes | 3 (10.0%) | 11 (13.4%) |
| 35 to 39 Minutes | 0 (0.0%) | 2 (2.4%) |
| 40 to 44 Minutes | 5 (16.7%) | 15 (18.3%) |
| 45 to 59 Minutes | 4 (13.3%) | 10 (12.2%) |
| 60 to 89 Minutes | 4 (13.3%) | 10 (12.2%) |
| 90 or more Minutes | 0 (0.0%) | 0 (0.0%) |
Time of Departure to Work by Sex in Vernon
The most frequent times of departure to work in Vernon are 8:00 AM to 8:29 AM (7, 23.3%) for males and 5:30 AM to 5:59 AM (21, 25.6%) for females.
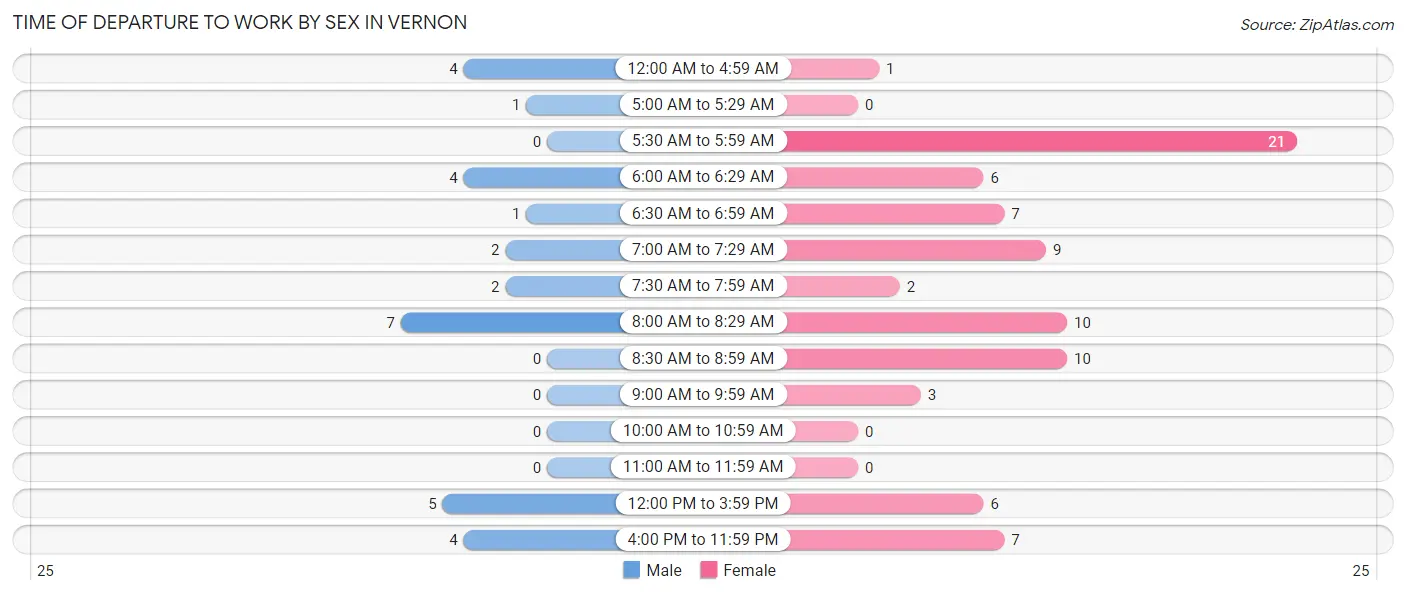
| Time of Departure | Male | Female |
| 12:00 AM to 4:59 AM | 4 (13.3%) | 1 (1.2%) |
| 5:00 AM to 5:29 AM | 1 (3.3%) | 0 (0.0%) |
| 5:30 AM to 5:59 AM | 0 (0.0%) | 21 (25.6%) |
| 6:00 AM to 6:29 AM | 4 (13.3%) | 6 (7.3%) |
| 6:30 AM to 6:59 AM | 1 (3.3%) | 7 (8.5%) |
| 7:00 AM to 7:29 AM | 2 (6.7%) | 9 (11.0%) |
| 7:30 AM to 7:59 AM | 2 (6.7%) | 2 (2.4%) |
| 8:00 AM to 8:29 AM | 7 (23.3%) | 10 (12.2%) |
| 8:30 AM to 8:59 AM | 0 (0.0%) | 10 (12.2%) |
| 9:00 AM to 9:59 AM | 0 (0.0%) | 3 (3.7%) |
| 10:00 AM to 10:59 AM | 0 (0.0%) | 0 (0.0%) |
| 11:00 AM to 11:59 AM | 0 (0.0%) | 0 (0.0%) |
| 12:00 PM to 3:59 PM | 5 (16.7%) | 6 (7.3%) |
| 4:00 PM to 11:59 PM | 4 (13.3%) | 7 (8.5%) |
| Total | 30 (100.0%) | 82 (100.0%) |
Housing Occupancy in Vernon
Occupancy by Ownership in Vernon
Of the total 91 dwellings in Vernon, owner-occupied units account for 4 (4.4%), while renter-occupied units make up 87 (95.6%).
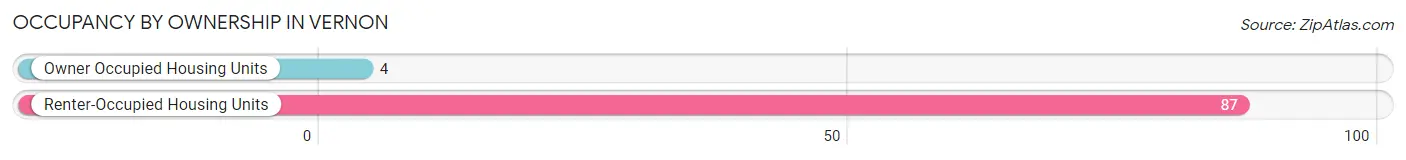
| Occupancy | # Housing Units | % Housing Units |
| Owner Occupied Housing Units | 4 | 4.4% |
| Renter-Occupied Housing Units | 87 | 95.6% |
| Total Occupied Housing Units | 91 | 100.0% |
Occupancy by Household Size in Vernon
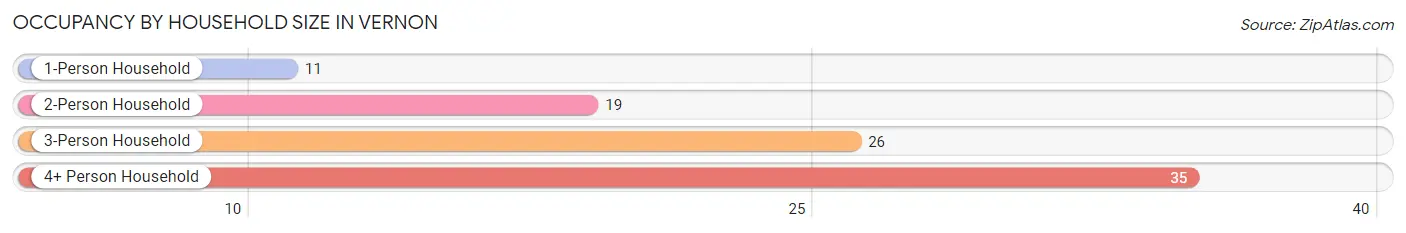
| Household Size | # Housing Units | % Housing Units |
| 1-Person Household | 11 | 12.1% |
| 2-Person Household | 19 | 20.9% |
| 3-Person Household | 26 | 28.6% |
| 4+ Person Household | 35 | 38.5% |
| Total Housing Units | 91 | 100.0% |
Occupancy by Ownership by Household Size in Vernon
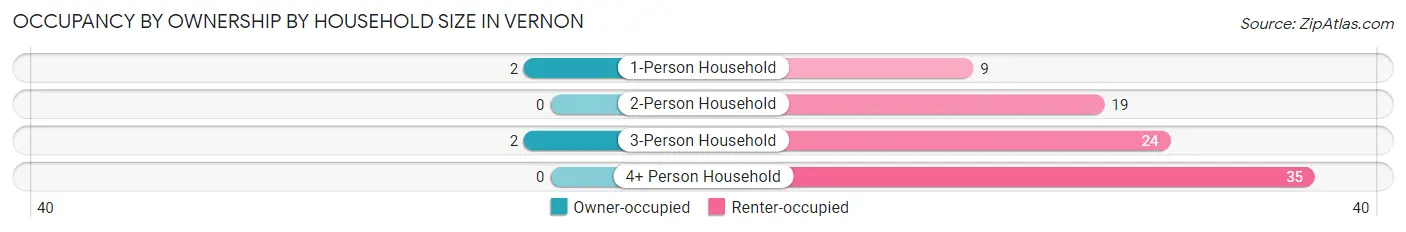
| Household Size | Owner-occupied | Renter-occupied |
| 1-Person Household | 2 (18.2%) | 9 (81.8%) |
| 2-Person Household | 0 (0.0%) | 19 (100.0%) |
| 3-Person Household | 2 (7.7%) | 24 (92.3%) |
| 4+ Person Household | 0 (0.0%) | 35 (100.0%) |
| Total Housing Units | 4 (4.4%) | 87 (95.6%) |
Occupancy by Educational Attainment in Vernon
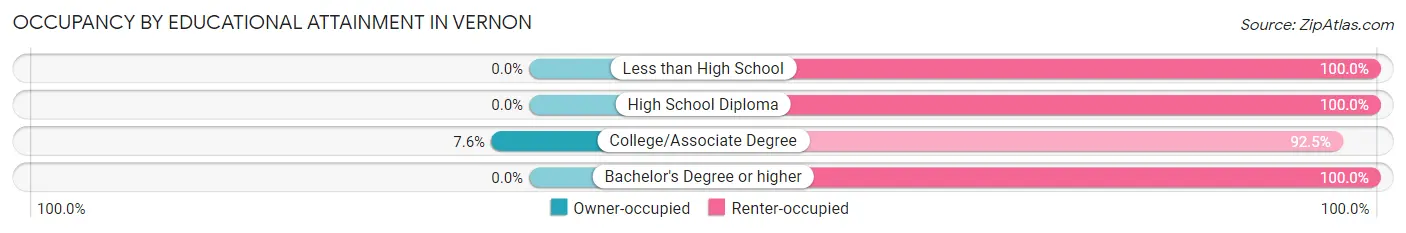
| Household Size | Owner-occupied | Renter-occupied |
| Less than High School | 0 (0.0%) | 14 (100.0%) |
| High School Diploma | 0 (0.0%) | 15 (100.0%) |
| College/Associate Degree | 4 (7.5%) | 49 (92.4%) |
| Bachelor's Degree or higher | 0 (0.0%) | 9 (100.0%) |
Occupancy by Age of Householder in Vernon
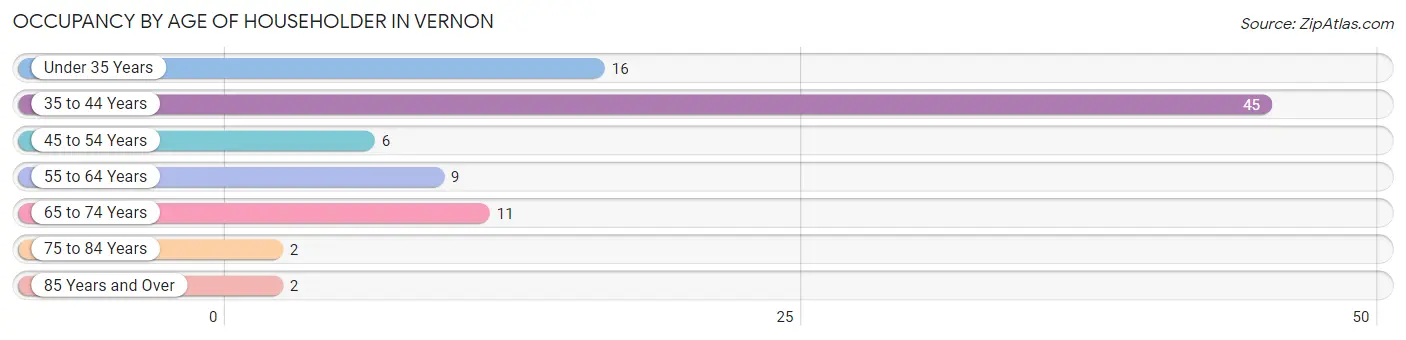
| Age Bracket | # Households | % Households |
| Under 35 Years | 16 | 17.6% |
| 35 to 44 Years | 45 | 49.4% |
| 45 to 54 Years | 6 | 6.6% |
| 55 to 64 Years | 9 | 9.9% |
| 65 to 74 Years | 11 | 12.1% |
| 75 to 84 Years | 2 | 2.2% |
| 85 Years and Over | 2 | 2.2% |
| Total | 91 | 100.0% |
Housing Finances in Vernon
Median Income by Occupancy in Vernon
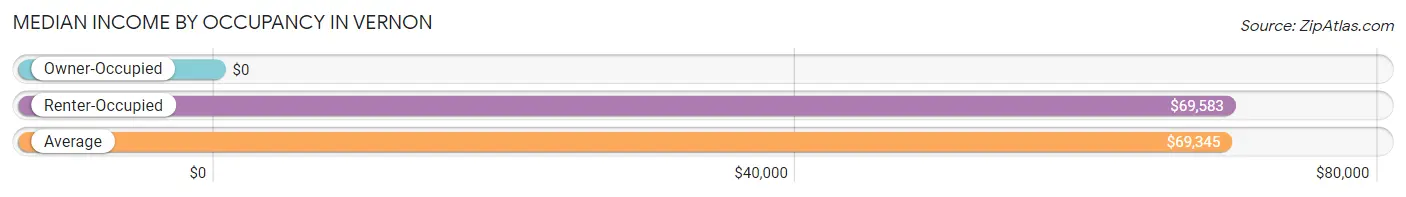
| Occupancy Type | # Households | Median Income |
| Owner-Occupied | 4 (4.4%) | $0 |
| Renter-Occupied | 87 (95.6%) | $69,583 |
| Average | 91 (100.0%) | $69,345 |
Occupancy by Householder Income Bracket in Vernon
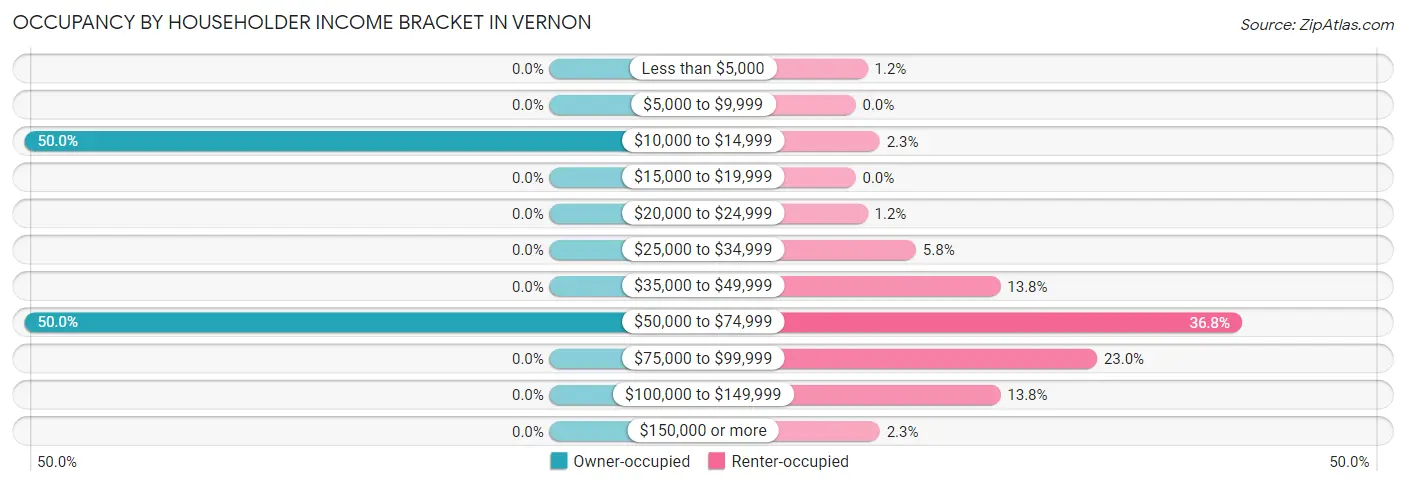
| Income Bracket | Owner-occupied | Renter-occupied |
| Less than $5,000 | 0 (0.0%) | 1 (1.1%) |
| $5,000 to $9,999 | 0 (0.0%) | 0 (0.0%) |
| $10,000 to $14,999 | 2 (50.0%) | 2 (2.3%) |
| $15,000 to $19,999 | 0 (0.0%) | 0 (0.0%) |
| $20,000 to $24,999 | 0 (0.0%) | 1 (1.1%) |
| $25,000 to $34,999 | 0 (0.0%) | 5 (5.8%) |
| $35,000 to $49,999 | 0 (0.0%) | 12 (13.8%) |
| $50,000 to $74,999 | 2 (50.0%) | 32 (36.8%) |
| $75,000 to $99,999 | 0 (0.0%) | 20 (23.0%) |
| $100,000 to $149,999 | 0 (0.0%) | 12 (13.8%) |
| $150,000 or more | 0 (0.0%) | 2 (2.3%) |
| Total | 4 (100.0%) | 87 (100.0%) |
Monthly Housing Cost Tiers in Vernon
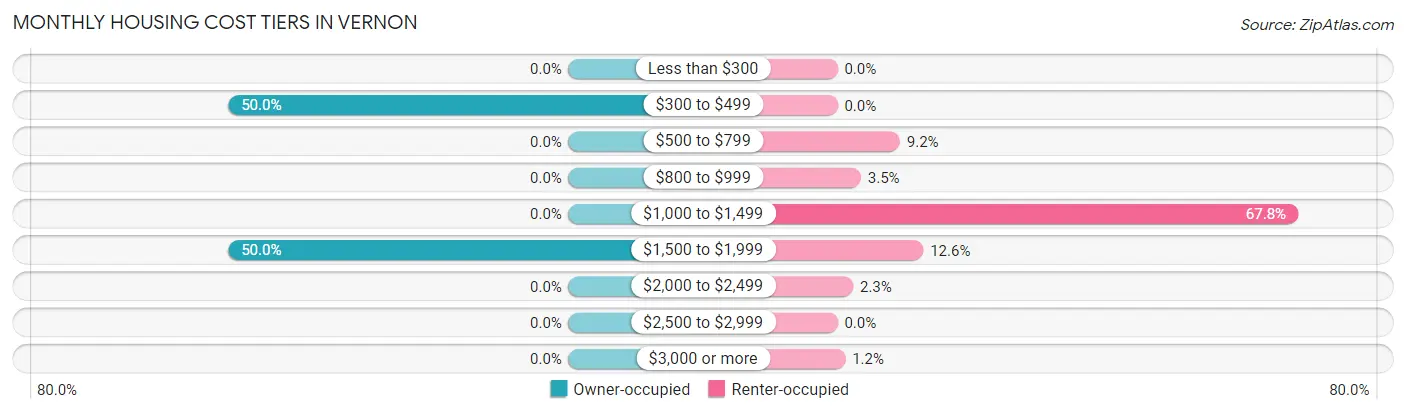
| Monthly Cost | Owner-occupied | Renter-occupied |
| Less than $300 | 0 (0.0%) | 0 (0.0%) |
| $300 to $499 | 2 (50.0%) | 0 (0.0%) |
| $500 to $799 | 0 (0.0%) | 8 (9.2%) |
| $800 to $999 | 0 (0.0%) | 3 (3.5%) |
| $1,000 to $1,499 | 0 (0.0%) | 59 (67.8%) |
| $1,500 to $1,999 | 2 (50.0%) | 11 (12.6%) |
| $2,000 to $2,499 | 0 (0.0%) | 2 (2.3%) |
| $2,500 to $2,999 | 0 (0.0%) | 0 (0.0%) |
| $3,000 or more | 0 (0.0%) | 1 (1.1%) |
| Total | 4 (100.0%) | 87 (100.0%) |
Physical Housing Characteristics in Vernon
Housing Structures in Vernon
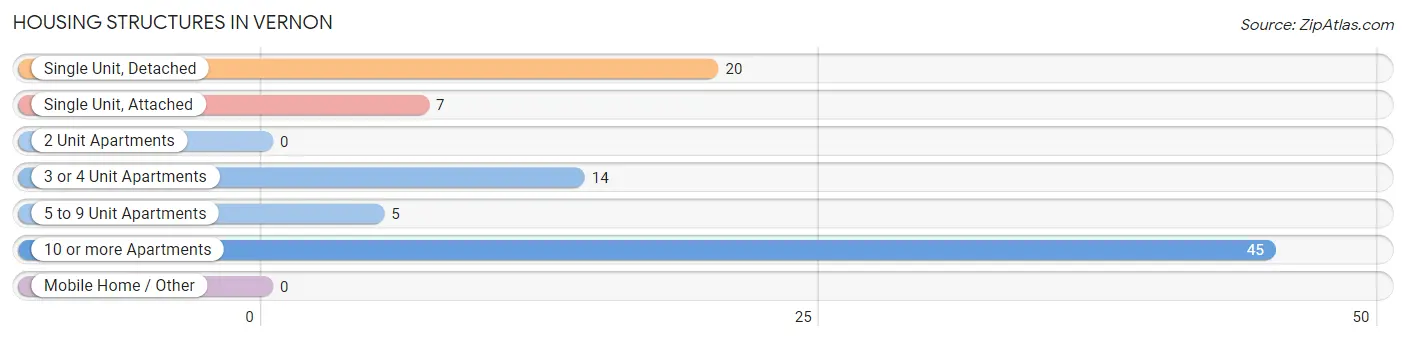
| Structure Type | # Housing Units | % Housing Units |
| Single Unit, Detached | 20 | 22.0% |
| Single Unit, Attached | 7 | 7.7% |
| 2 Unit Apartments | 0 | 0.0% |
| 3 or 4 Unit Apartments | 14 | 15.4% |
| 5 to 9 Unit Apartments | 5 | 5.5% |
| 10 or more Apartments | 45 | 49.4% |
| Mobile Home / Other | 0 | 0.0% |
| Total | 91 | 100.0% |
Housing Structures by Occupancy in Vernon
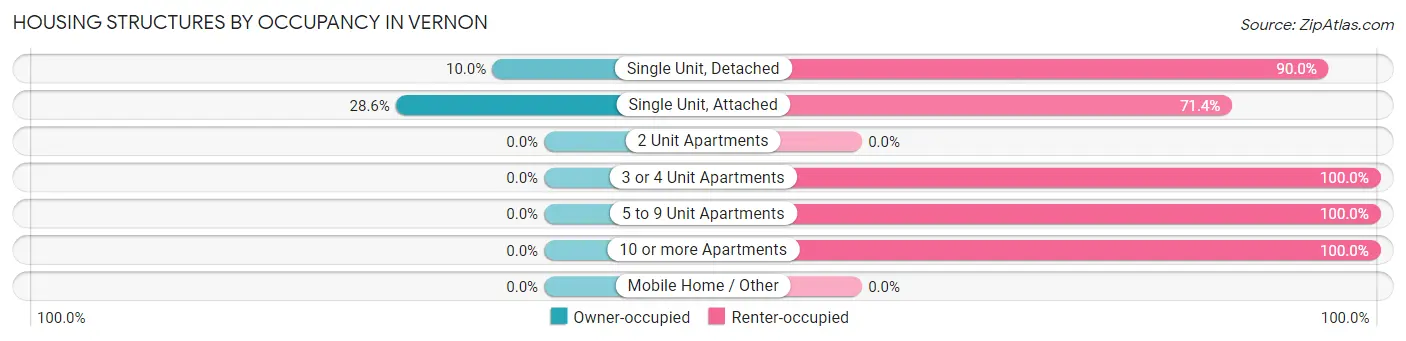
| Structure Type | Owner-occupied | Renter-occupied |
| Single Unit, Detached | 2 (10.0%) | 18 (90.0%) |
| Single Unit, Attached | 2 (28.6%) | 5 (71.4%) |
| 2 Unit Apartments | 0 (0.0%) | 0 (0.0%) |
| 3 or 4 Unit Apartments | 0 (0.0%) | 14 (100.0%) |
| 5 to 9 Unit Apartments | 0 (0.0%) | 5 (100.0%) |
| 10 or more Apartments | 0 (0.0%) | 45 (100.0%) |
| Mobile Home / Other | 0 (0.0%) | 0 (0.0%) |
| Total | 4 (4.4%) | 87 (95.6%) |
Housing Structures by Number of Rooms in Vernon
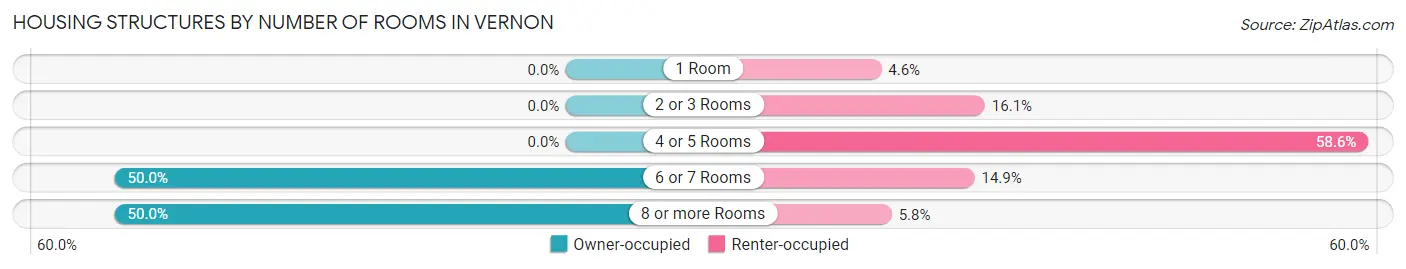
| Number of Rooms | Owner-occupied | Renter-occupied |
| 1 Room | 0 (0.0%) | 4 (4.6%) |
| 2 or 3 Rooms | 0 (0.0%) | 14 (16.1%) |
| 4 or 5 Rooms | 0 (0.0%) | 51 (58.6%) |
| 6 or 7 Rooms | 2 (50.0%) | 13 (14.9%) |
| 8 or more Rooms | 2 (50.0%) | 5 (5.8%) |
| Total | 4 (100.0%) | 87 (100.0%) |
Housing Structure by Heating Type in Vernon
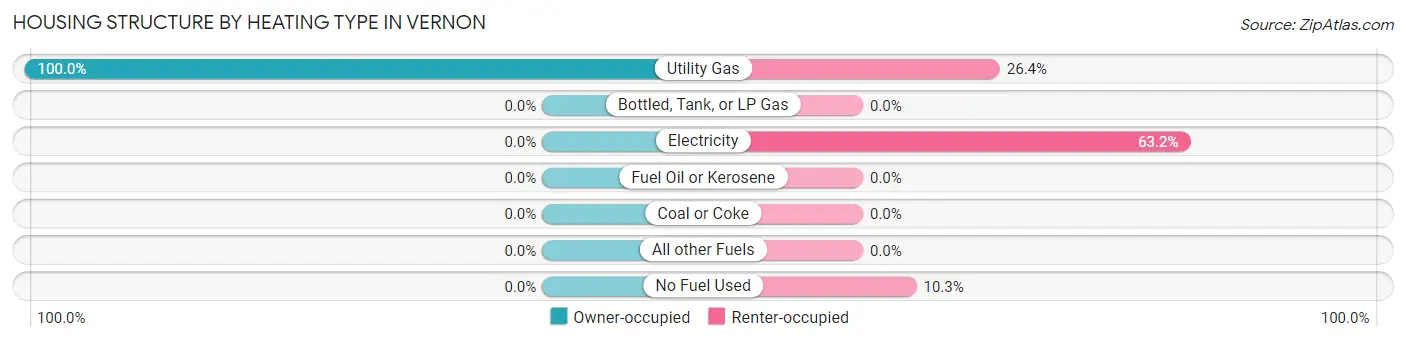
| Heating Type | Owner-occupied | Renter-occupied |
| Utility Gas | 4 (100.0%) | 23 (26.4%) |
| Bottled, Tank, or LP Gas | 0 (0.0%) | 0 (0.0%) |
| Electricity | 0 (0.0%) | 55 (63.2%) |
| Fuel Oil or Kerosene | 0 (0.0%) | 0 (0.0%) |
| Coal or Coke | 0 (0.0%) | 0 (0.0%) |
| All other Fuels | 0 (0.0%) | 0 (0.0%) |
| No Fuel Used | 0 (0.0%) | 9 (10.3%) |
| Total | 4 (100.0%) | 87 (100.0%) |
Household Vehicle Usage in Vernon
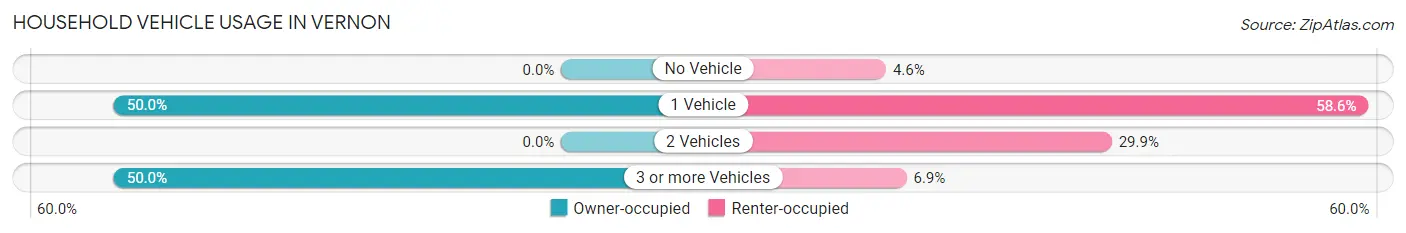
| Vehicles per Household | Owner-occupied | Renter-occupied |
| No Vehicle | 0 (0.0%) | 4 (4.6%) |
| 1 Vehicle | 2 (50.0%) | 51 (58.6%) |
| 2 Vehicles | 0 (0.0%) | 26 (29.9%) |
| 3 or more Vehicles | 2 (50.0%) | 6 (6.9%) |
| Total | 4 (100.0%) | 87 (100.0%) |
Real Estate & Mortgages in Vernon
Real Estate and Mortgage Overview in Vernon
| Characteristic | Without Mortgage | With Mortgage |
| Housing Units | 2 | 2 |
| Median Property Value | - | - |
| Median Household Income | - | - |
| Monthly Housing Costs | - | - |
| Real Estate Taxes | - | - |
Property Value by Mortgage Status in Vernon
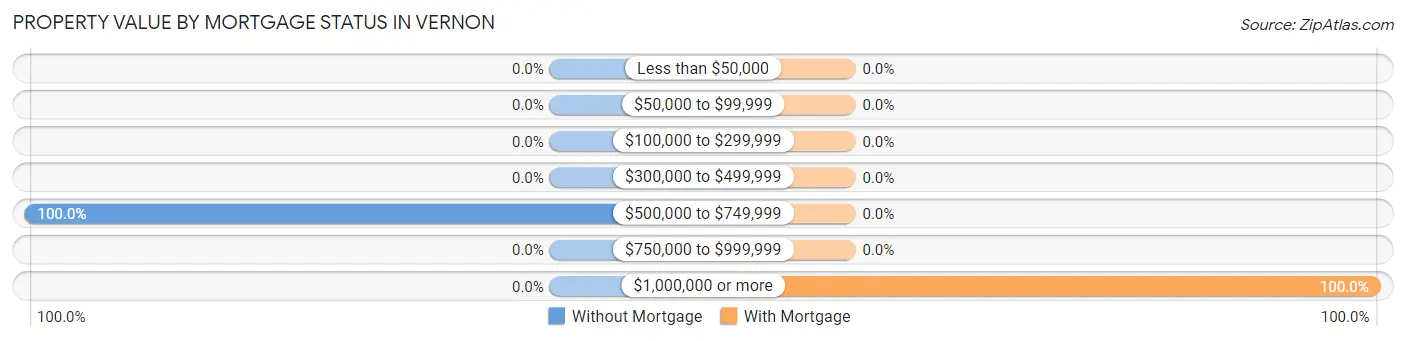
| Property Value | Without Mortgage | With Mortgage |
| Less than $50,000 | 0 (0.0%) | 0 (0.0%) |
| $50,000 to $99,999 | 0 (0.0%) | 0 (0.0%) |
| $100,000 to $299,999 | 0 (0.0%) | 0 (0.0%) |
| $300,000 to $499,999 | 0 (0.0%) | 0 (0.0%) |
| $500,000 to $749,999 | 2 (100.0%) | 0 (0.0%) |
| $750,000 to $999,999 | 0 (0.0%) | 0 (0.0%) |
| $1,000,000 or more | 0 (0.0%) | 2 (100.0%) |
| Total | 2 (100.0%) | 2 (100.0%) |
Household Income by Mortgage Status in Vernon
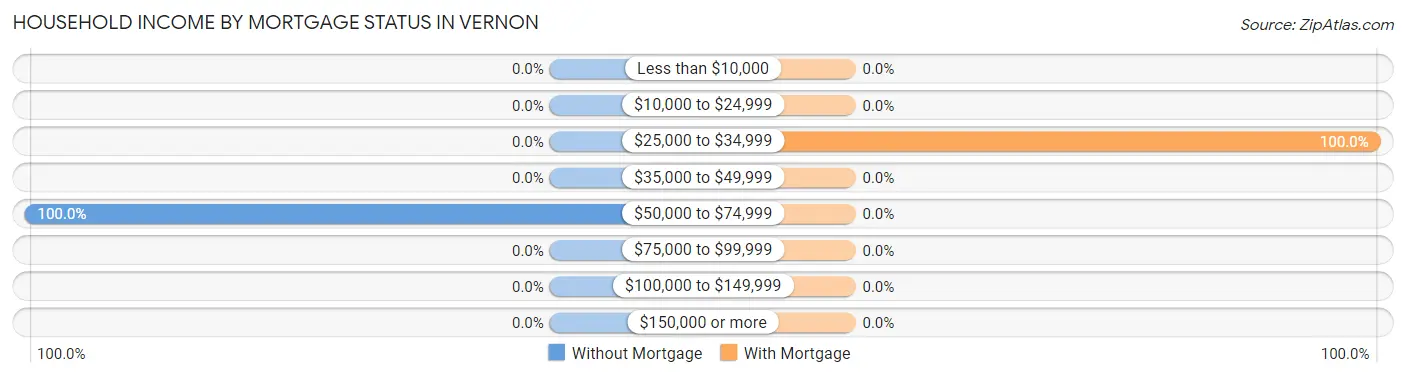
| Household Income | Without Mortgage | With Mortgage |
| Less than $10,000 | 0 (0.0%) | 0 (0.0%) |
| $10,000 to $24,999 | 0 (0.0%) | 0 (0.0%) |
| $25,000 to $34,999 | 0 (0.0%) | 2 (100.0%) |
| $35,000 to $49,999 | 0 (0.0%) | 0 (0.0%) |
| $50,000 to $74,999 | 2 (100.0%) | 0 (0.0%) |
| $75,000 to $99,999 | 0 (0.0%) | 0 (0.0%) |
| $100,000 to $149,999 | 0 (0.0%) | 0 (0.0%) |
| $150,000 or more | 0 (0.0%) | 0 (0.0%) |
| Total | 2 (100.0%) | 2 (100.0%) |
Property Value to Household Income Ratio in Vernon
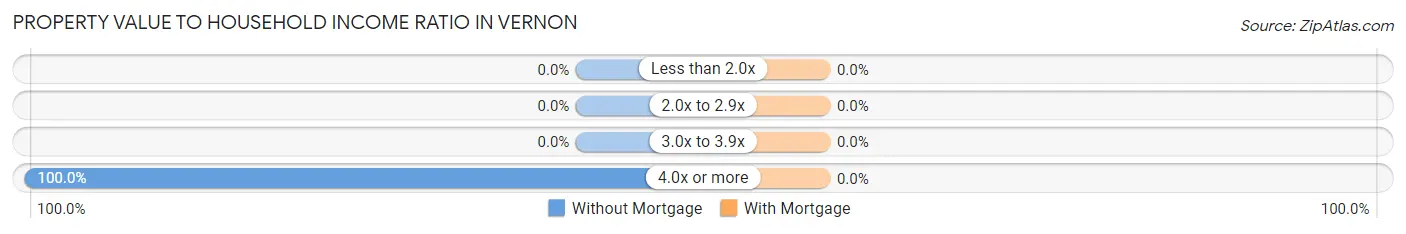
| Value-to-Income Ratio | Without Mortgage | With Mortgage |
| Less than 2.0x | 0 (0.0%) | 0 (0.0%) |
| 2.0x to 2.9x | 0 (0.0%) | 0 (0.0%) |
| 3.0x to 3.9x | 0 (0.0%) | 0 (0.0%) |
| 4.0x or more | 2 (100.0%) | 0 (0.0%) |
| Total | 2 (100.0%) | 2 (100.0%) |
Real Estate Taxes by Mortgage Status in Vernon
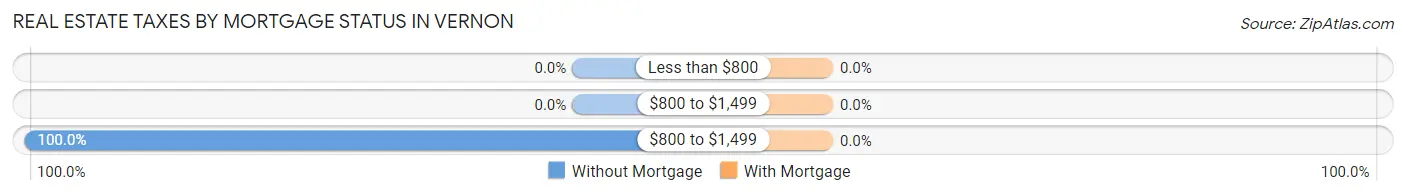
| Property Taxes | Without Mortgage | With Mortgage |
| Less than $800 | 0 (0.0%) | 0 (0.0%) |
| $800 to $1,499 | 0 (0.0%) | 0 (0.0%) |
| $800 to $1,499 | 2 (100.0%) | 0 (0.0%) |
| Total | 2 (100.0%) | 2 (100.0%) |
Health & Disability in Vernon
Health Insurance Coverage by Age in Vernon
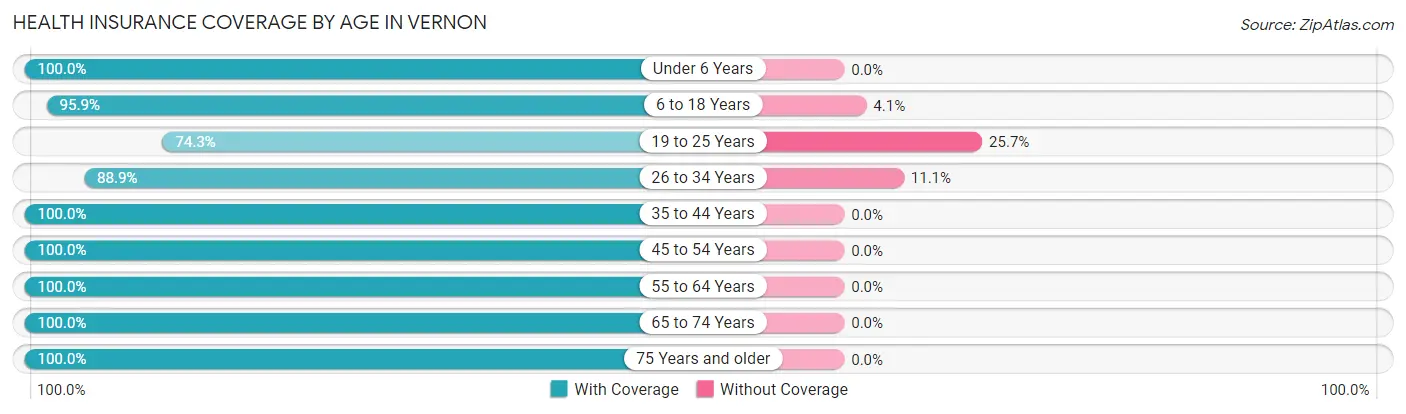
| Age Bracket | With Coverage | Without Coverage |
| Under 6 Years | 18 (100.0%) | 0 (0.0%) |
| 6 to 18 Years | 93 (95.9%) | 4 (4.1%) |
| 19 to 25 Years | 26 (74.3%) | 9 (25.7%) |
| 26 to 34 Years | 32 (88.9%) | 4 (11.1%) |
| 35 to 44 Years | 53 (100.0%) | 0 (0.0%) |
| 45 to 54 Years | 14 (100.0%) | 0 (0.0%) |
| 55 to 64 Years | 19 (100.0%) | 0 (0.0%) |
| 65 to 74 Years | 43 (100.0%) | 0 (0.0%) |
| 75 Years and older | 12 (100.0%) | 0 (0.0%) |
| Total | 310 (94.8%) | 17 (5.2%) |
Health Insurance Coverage by Citizenship Status in Vernon
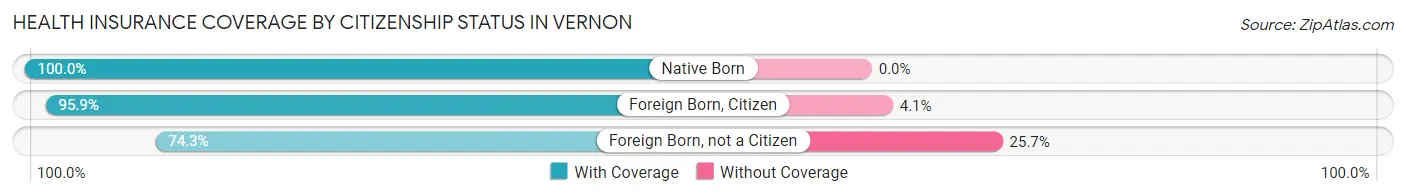
| Citizenship Status | With Coverage | Without Coverage |
| Native Born | 18 (100.0%) | 0 (0.0%) |
| Foreign Born, Citizen | 93 (95.9%) | 4 (4.1%) |
| Foreign Born, not a Citizen | 26 (74.3%) | 9 (25.7%) |
Health Insurance Coverage by Household Income in Vernon
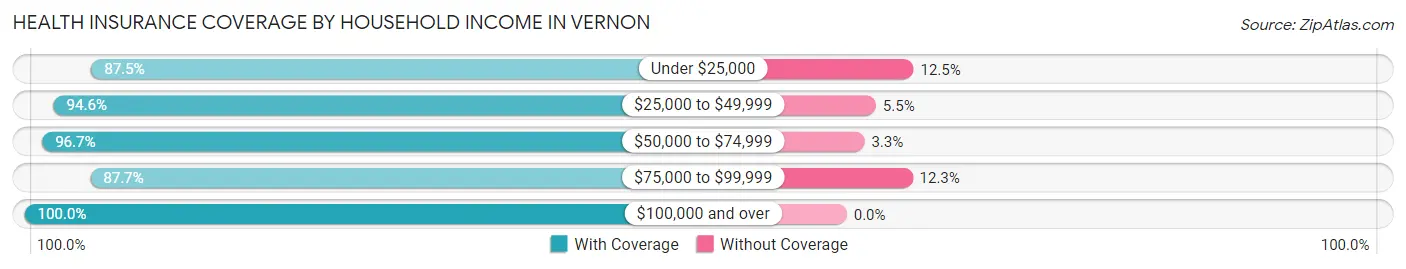
| Household Income | With Coverage | Without Coverage |
| Under $25,000 | 7 (87.5%) | 1 (12.5%) |
| $25,000 to $49,999 | 52 (94.6%) | 3 (5.4%) |
| $50,000 to $74,999 | 117 (96.7%) | 4 (3.3%) |
| $75,000 to $99,999 | 64 (87.7%) | 9 (12.3%) |
| $100,000 and over | 70 (100.0%) | 0 (0.0%) |
Public vs Private Health Insurance Coverage by Age in Vernon
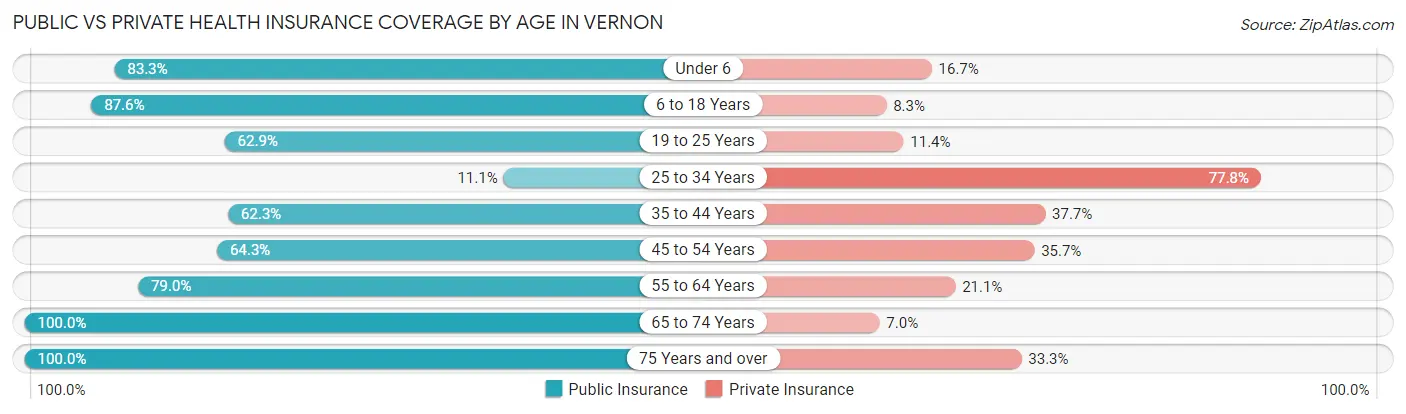
| Age Bracket | Public Insurance | Private Insurance |
| Under 6 | 15 (83.3%) | 3 (16.7%) |
| 6 to 18 Years | 85 (87.6%) | 8 (8.3%) |
| 19 to 25 Years | 22 (62.9%) | 4 (11.4%) |
| 25 to 34 Years | 4 (11.1%) | 28 (77.8%) |
| 35 to 44 Years | 33 (62.3%) | 20 (37.7%) |
| 45 to 54 Years | 9 (64.3%) | 5 (35.7%) |
| 55 to 64 Years | 15 (78.9%) | 4 (21.0%) |
| 65 to 74 Years | 43 (100.0%) | 3 (7.0%) |
| 75 Years and over | 12 (100.0%) | 4 (33.3%) |
| Total | 238 (72.8%) | 79 (24.2%) |
Disability Status by Sex by Age in Vernon
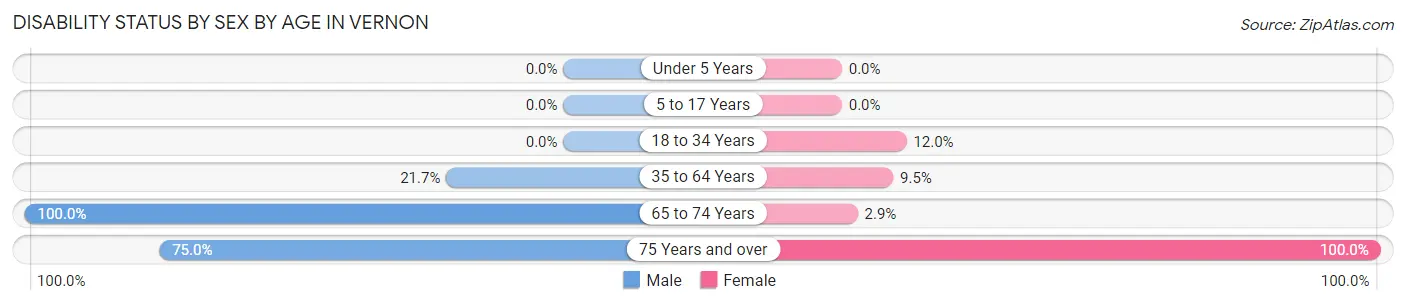
| Age Bracket | Male | Female |
| Under 5 Years | 0 (0.0%) | 0 (0.0%) |
| 5 to 17 Years | 0 (0.0%) | 0 (0.0%) |
| 18 to 34 Years | 0 (0.0%) | 6 (12.0%) |
| 35 to 64 Years | 5 (21.7%) | 6 (9.5%) |
| 65 to 74 Years | 9 (100.0%) | 1 (2.9%) |
| 75 Years and over | 6 (75.0%) | 4 (100.0%) |
Disability Class by Sex by Age in Vernon
Disability Class: Hearing Difficulty
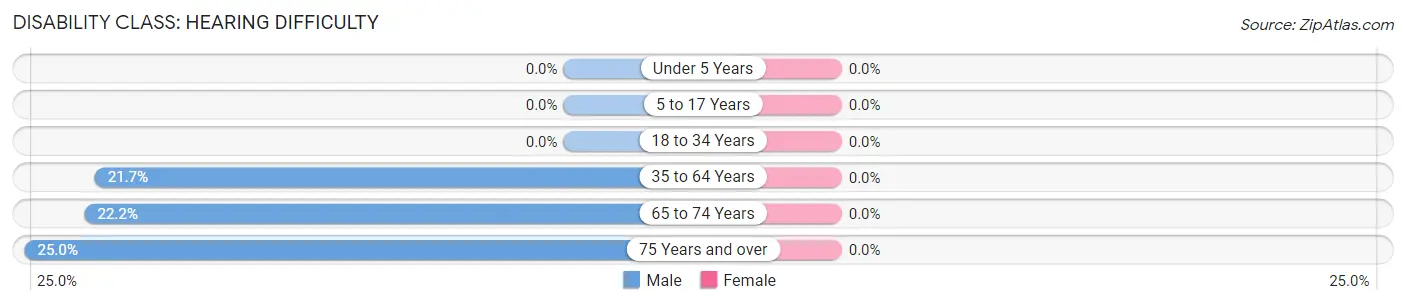
| Age Bracket | Male | Female |
| Under 5 Years | 0 (0.0%) | 0 (0.0%) |
| 5 to 17 Years | 0 (0.0%) | 0 (0.0%) |
| 18 to 34 Years | 0 (0.0%) | 0 (0.0%) |
| 35 to 64 Years | 5 (21.7%) | 0 (0.0%) |
| 65 to 74 Years | 2 (22.2%) | 0 (0.0%) |
| 75 Years and over | 2 (25.0%) | 0 (0.0%) |
Disability Class: Vision Difficulty
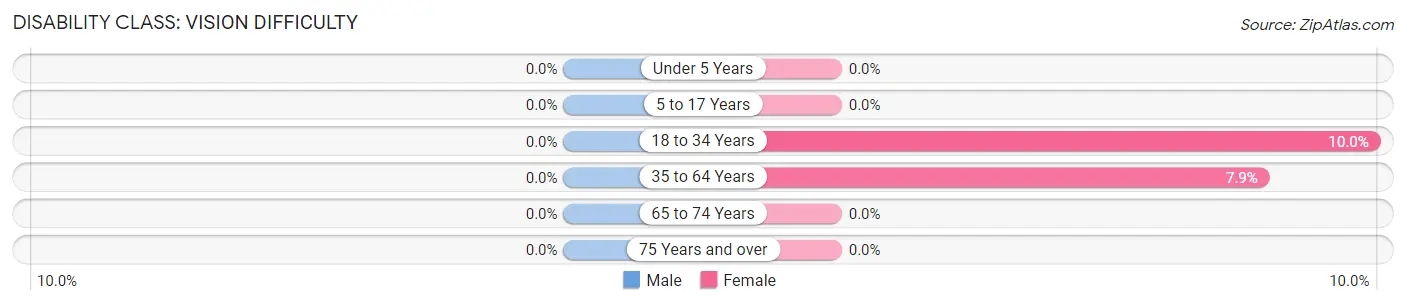
| Age Bracket | Male | Female |
| Under 5 Years | 0 (0.0%) | 0 (0.0%) |
| 5 to 17 Years | 0 (0.0%) | 0 (0.0%) |
| 18 to 34 Years | 0 (0.0%) | 5 (10.0%) |
| 35 to 64 Years | 0 (0.0%) | 5 (7.9%) |
| 65 to 74 Years | 0 (0.0%) | 0 (0.0%) |
| 75 Years and over | 0 (0.0%) | 0 (0.0%) |
Disability Class: Cognitive Difficulty
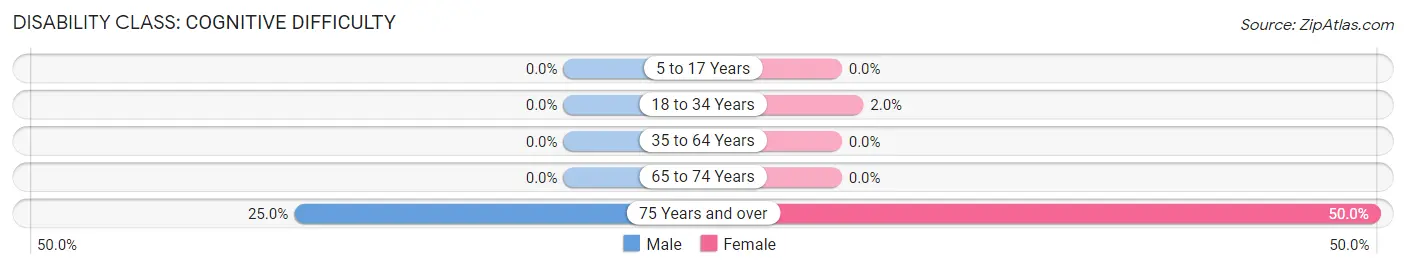
| Age Bracket | Male | Female |
| 5 to 17 Years | 0 (0.0%) | 0 (0.0%) |
| 18 to 34 Years | 0 (0.0%) | 1 (2.0%) |
| 35 to 64 Years | 0 (0.0%) | 0 (0.0%) |
| 65 to 74 Years | 0 (0.0%) | 0 (0.0%) |
| 75 Years and over | 2 (25.0%) | 2 (50.0%) |
Disability Class: Ambulatory Difficulty
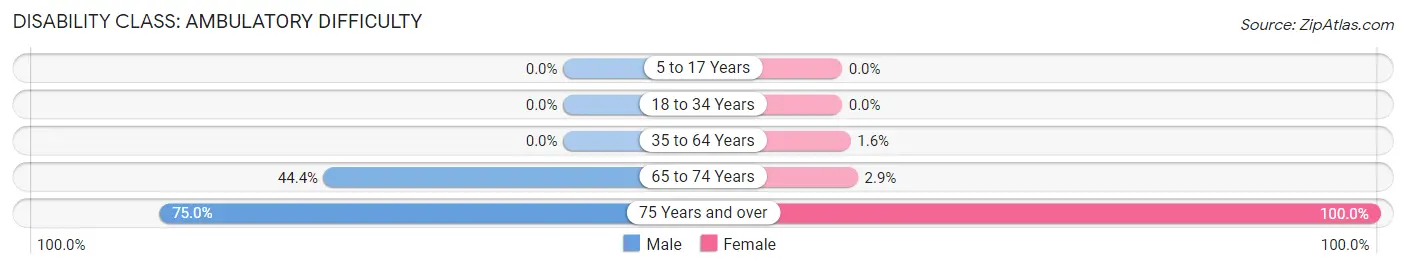
| Age Bracket | Male | Female |
| 5 to 17 Years | 0 (0.0%) | 0 (0.0%) |
| 18 to 34 Years | 0 (0.0%) | 0 (0.0%) |
| 35 to 64 Years | 0 (0.0%) | 1 (1.6%) |
| 65 to 74 Years | 4 (44.4%) | 1 (2.9%) |
| 75 Years and over | 6 (75.0%) | 4 (100.0%) |
Disability Class: Self-Care Difficulty
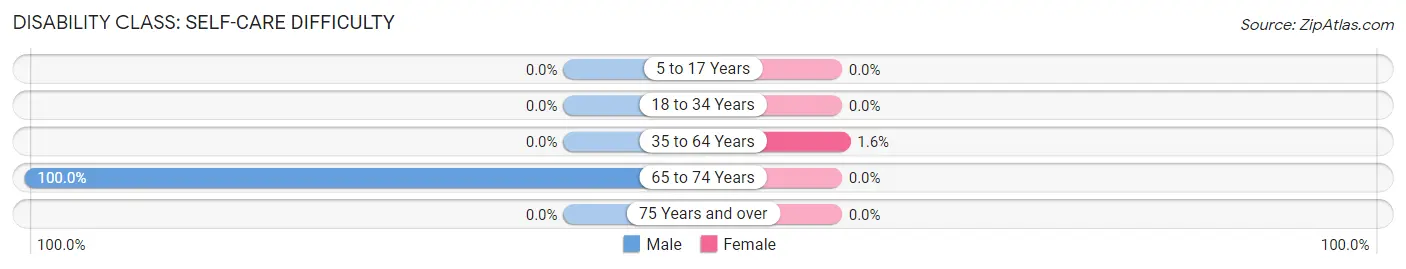
| Age Bracket | Male | Female |
| 5 to 17 Years | 0 (0.0%) | 0 (0.0%) |
| 18 to 34 Years | 0 (0.0%) | 0 (0.0%) |
| 35 to 64 Years | 0 (0.0%) | 1 (1.6%) |
| 65 to 74 Years | 9 (100.0%) | 0 (0.0%) |
| 75 Years and over | 0 (0.0%) | 0 (0.0%) |
Technology Access in Vernon
Computing Device Access in Vernon
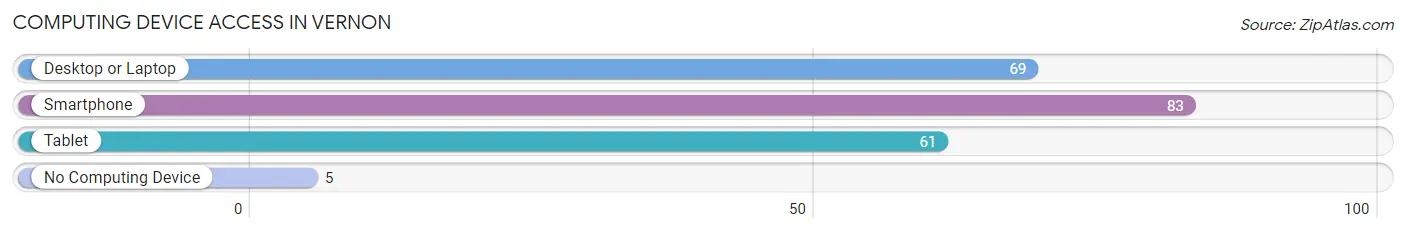
| Device Type | # Households | % Households |
| Desktop or Laptop | 69 | 75.8% |
| Smartphone | 83 | 91.2% |
| Tablet | 61 | 67.0% |
| No Computing Device | 5 | 5.5% |
| Total | 91 | 100.0% |
Internet Access in Vernon
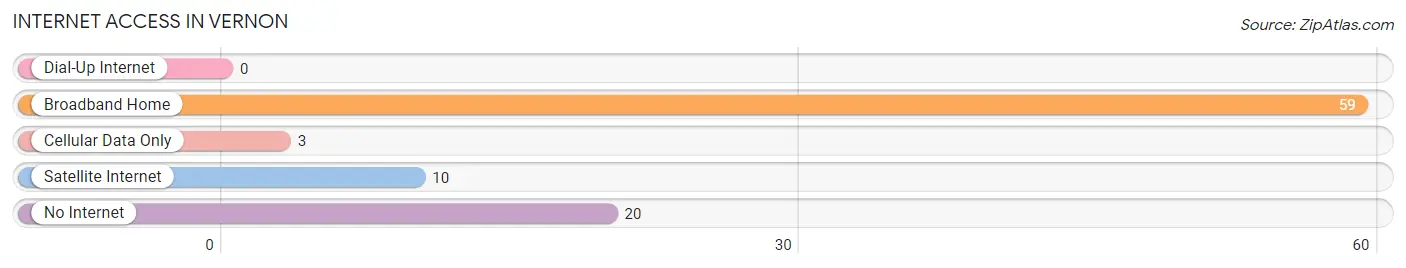
| Internet Type | # Households | % Households |
| Dial-Up Internet | 0 | 0.0% |
| Broadband Home | 59 | 64.8% |
| Cellular Data Only | 3 | 3.3% |
| Satellite Internet | 10 | 11.0% |
| No Internet | 20 | 22.0% |
| Total | 91 | 100.0% |
Vernon Summary
Vernon, California is a city located in Los Angeles County, California. It is an industrial city with a population of 112,000 people as of the 2010 census. The city is located just south of downtown Los Angeles and is bordered by the cities of Huntington Park, Maywood, and Commerce.
History
Vernon was founded in 1905 by John B. Leonis, a French-Basque immigrant who had previously owned a successful grocery store in downtown Los Angeles. Leonis purchased 4,000 acres of land in the area and began to develop it into an industrial center. He named the city after his hometown of Vernon, France.
In 1906, the city was incorporated and Leonis was elected as the first mayor. He was re-elected in 1908 and served until his death in 1910. During his tenure, he oversaw the construction of the city’s first water system, sewer system, and electric power plant.
In the 1920s, the city experienced a period of rapid growth as new industries moved into the area. The city’s population grew from 1,000 in 1920 to over 10,000 by 1930. During this time, the city also saw the construction of its first public library, post office, and police station.
In the 1950s, the city continued to grow and expand. The population reached over 20,000 by 1960 and the city was home to a variety of industries, including food processing, metal fabrication, and furniture manufacturing.
Geography
Vernon is located in the southeastern corner of Los Angeles County, California. It is bordered by the cities of Huntington Park, Maywood, and Commerce. The city covers an area of 5.2 square miles and has an elevation of 200 feet.
The city is located in the Los Angeles Basin and is surrounded by hills and mountains. The San Gabriel Mountains are located to the north and the Santa Monica Mountains are located to the south.
Economy
Vernon is an industrial city and is home to a variety of industries, including food processing, metal fabrication, and furniture manufacturing. The city is also home to a number of warehouses and distribution centers.
The city’s largest employer is the Vernon Company, which is a food processing and distribution company. Other major employers include the Los Angeles County Department of Public Works, the Los Angeles County Sheriff’s Department, and the Los Angeles County Fire Department.
Demographics
As of the 2010 census, the population of Vernon was 112,000. The racial makeup of the city was 79.2% Hispanic or Latino, 10.2% White, 5.2% African American, 2.2% Asian, and 3.2% other.
The median household income in Vernon was $37,000 and the median family income was $41,000. The per capita income was $17,000. The poverty rate was 28.3%.
Conclusion
Vernon, California is an industrial city located in Los Angeles County. It was founded in 1905 by John B. Leonis and has since grown to a population of 112,000 people. The city is home to a variety of industries, including food processing, metal fabrication, and furniture manufacturing. The city’s largest employer is the Vernon Company. The racial makeup of the city is 79.2% Hispanic or Latino, 10.2% White, 5.2% African American, 2.2% Asian, and 3.2% other. The median household income in Vernon was $37,000 and the median family income was $41,000. The poverty rate was 28.3%.
Common Questions
What is Per Capita Income in Vernon?
Per Capita income in Vernon is $20,296.
What is the Median Family Income in Vernon?
Median Family Income in Vernon is $68,929.
What is the Median Household income in Vernon?
Median Household Income in Vernon is $69,345.
What is Income or Wage Gap in Vernon?
Income or Wage Gap in Vernon is 41.9%.
Women in Vernon earn 58.1 cents for every dollar earned by a man.
What is Inequality or Gini Index in Vernon?
Inequality or Gini Index in Vernon is 0.24.
What is the Total Population of Vernon?
Total Population of Vernon is 329.
What is the Total Male Population of Vernon?
Total Male Population of Vernon is 117.
What is the Total Female Population of Vernon?
Total Female Population of Vernon is 212.
What is the Ratio of Males per 100 Females in Vernon?
There are 55.19 Males per 100 Females in Vernon.
What is the Ratio of Females per 100 Males in Vernon?
There are 181.20 Females per 100 Males in Vernon.
What is the Median Population Age in Vernon?
Median Population Age in Vernon is 28.7 Years.
What is the Average Family Size in Vernon
Average Family Size in Vernon is 4.0 People.
What is the Average Household Size in Vernon
Average Household Size in Vernon is 3.6 People.
How Large is the Labor Force in Vernon?
There are 130 People in the Labor Forcein in Vernon.
What is the Percentage of People in the Labor Force in Vernon?
57.5% of People are in the Labor Force in Vernon.
What is the Unemployment Rate in Vernon?
Unemployment Rate in Vernon is 8.6%.