Hood, CA Map & Demographics
Hood Map
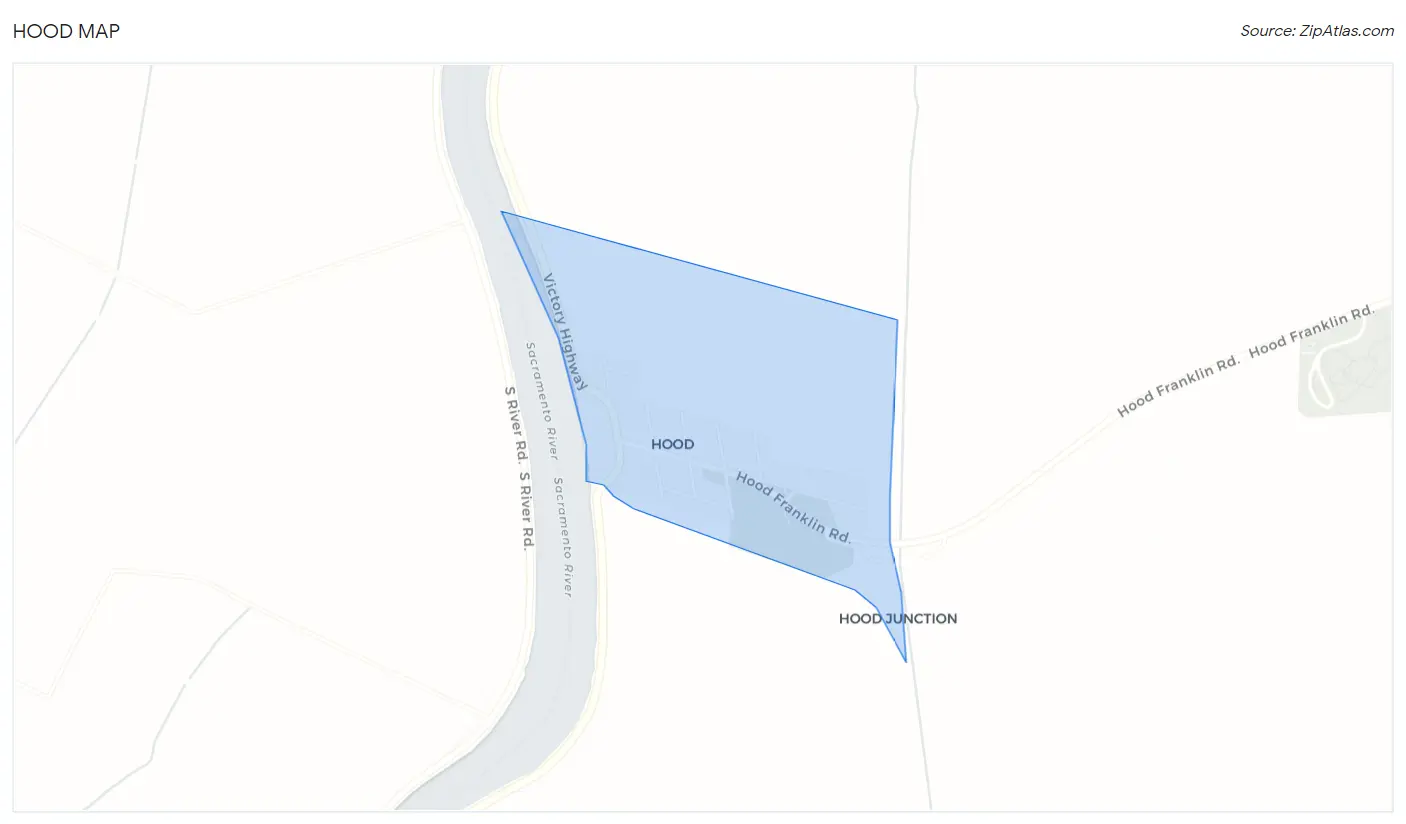
Hood Overview
$19,061
PER CAPITA INCOME
0.44
INEQUALITY / GINI INDEX
314
TOTAL POPULATION
127
MALE POPULATION
187
FEMALE POPULATION
67.91
MALES / 100 FEMALES
147.24
FEMALES / 100 MALES
45.2
MEDIAN AGE
7.7
AVG FAMILY SIZE
2.9
AVG HOUSEHOLD SIZE
148
LABOR FORCE [ PEOPLE ]
55.2%
PERCENT IN LABOR FORCE
11.5%
UNEMPLOYMENT RATE
Hood Zip Codes
Income in Hood
Income Overview in Hood
| Characteristic | Number | Measure |
| Per Capita Income | 314 | $19,061 |
| Median Family Income | 28 | $0 |
| Mean Family Income | 28 | $0 |
| Median Household Income | 109 | $0 |
| Mean Household Income | 109 | $52,247 |
| Income Deficit | 28 | $0 |
| Wage / Income Gap (%) | 314 | 0.00% |
| Wage / Income Gap ($) | 314 | 100.00¢ per $1 |
| Gini / Inequality Index | 314 | 0.44 |
Earnings by Sex in Hood
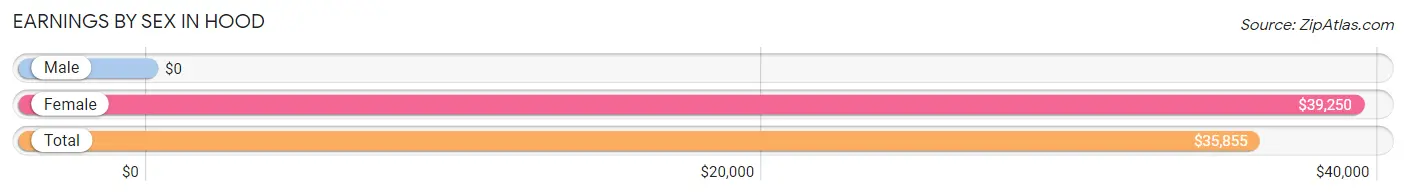
| Sex | Number | Average Earnings |
| Male | 85 (51.8%) | $0 |
| Female | 79 (48.2%) | $39,250 |
| Total | 164 (100.0%) | $35,855 |
Earnings by Sex by Income Bracket in Hood
The most common earnings brackets in Hood are $35,000 to $39,999 for men (38 | 44.7%) and $35,000 to $39,999 for women (25 | 31.7%).
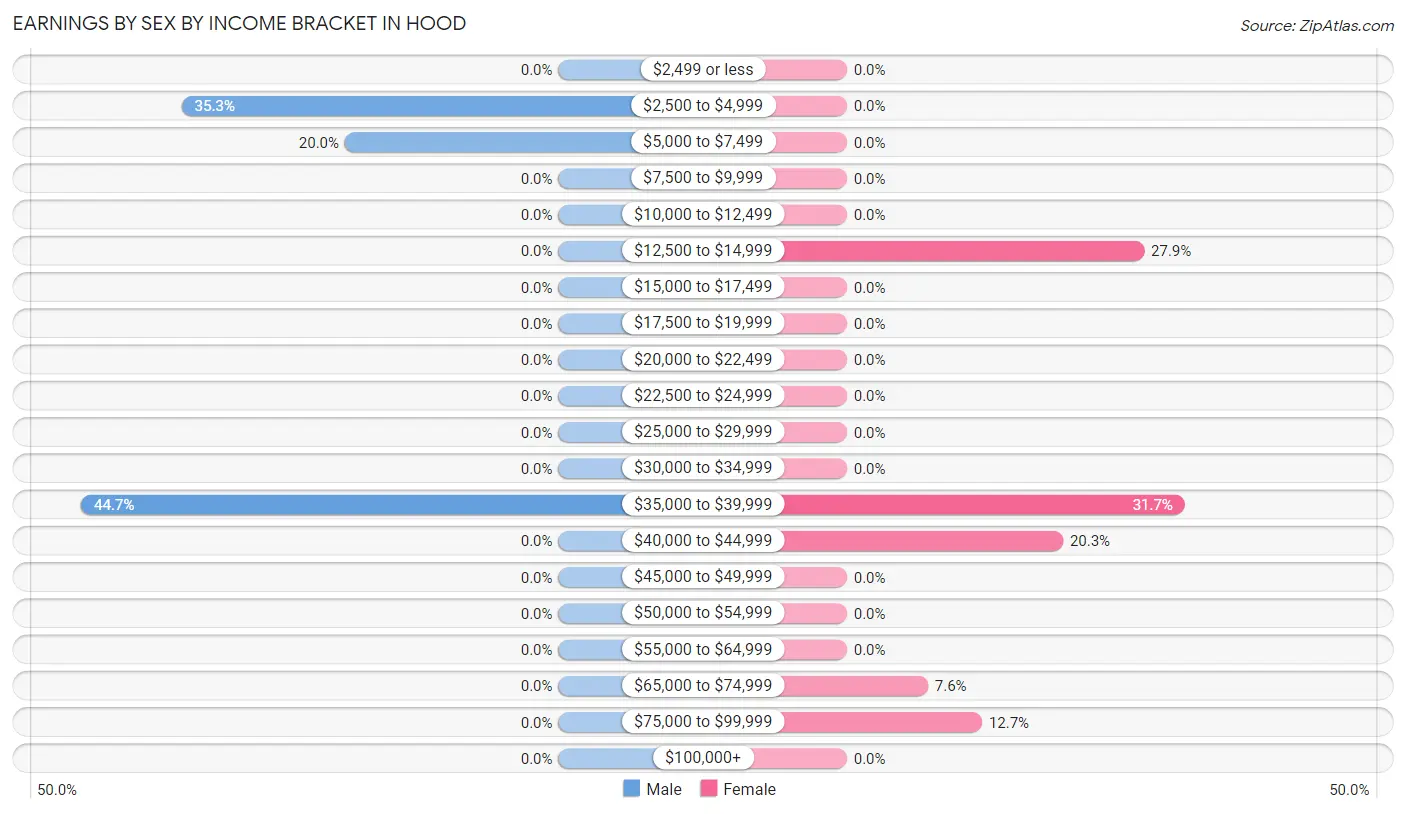
| Income | Male | Female |
| $2,499 or less | 0 (0.0%) | 0 (0.0%) |
| $2,500 to $4,999 | 30 (35.3%) | 0 (0.0%) |
| $5,000 to $7,499 | 17 (20.0%) | 0 (0.0%) |
| $7,500 to $9,999 | 0 (0.0%) | 0 (0.0%) |
| $10,000 to $12,499 | 0 (0.0%) | 0 (0.0%) |
| $12,500 to $14,999 | 0 (0.0%) | 22 (27.9%) |
| $15,000 to $17,499 | 0 (0.0%) | 0 (0.0%) |
| $17,500 to $19,999 | 0 (0.0%) | 0 (0.0%) |
| $20,000 to $22,499 | 0 (0.0%) | 0 (0.0%) |
| $22,500 to $24,999 | 0 (0.0%) | 0 (0.0%) |
| $25,000 to $29,999 | 0 (0.0%) | 0 (0.0%) |
| $30,000 to $34,999 | 0 (0.0%) | 0 (0.0%) |
| $35,000 to $39,999 | 38 (44.7%) | 25 (31.7%) |
| $40,000 to $44,999 | 0 (0.0%) | 16 (20.3%) |
| $45,000 to $49,999 | 0 (0.0%) | 0 (0.0%) |
| $50,000 to $54,999 | 0 (0.0%) | 0 (0.0%) |
| $55,000 to $64,999 | 0 (0.0%) | 0 (0.0%) |
| $65,000 to $74,999 | 0 (0.0%) | 6 (7.6%) |
| $75,000 to $99,999 | 0 (0.0%) | 10 (12.7%) |
| $100,000+ | 0 (0.0%) | 0 (0.0%) |
| Total | 85 (100.0%) | 79 (100.0%) |
Earnings by Sex by Educational Attainment in Hood
| Educational Attainment | Male Income | Female Income |
| Less than High School | - | - |
| High School Diploma | - | - |
| College or Associate's Degree | - | - |
| Bachelor's Degree | - | - |
| Graduate Degree | - | - |
| Total | - | - |
Family Income in Hood
Family Income Brackets in Hood
According to the Hood family income data, there are 16 families falling into the $75,000 to $99,999 income range, which is the most common income bracket and makes up 57.1% of all families.
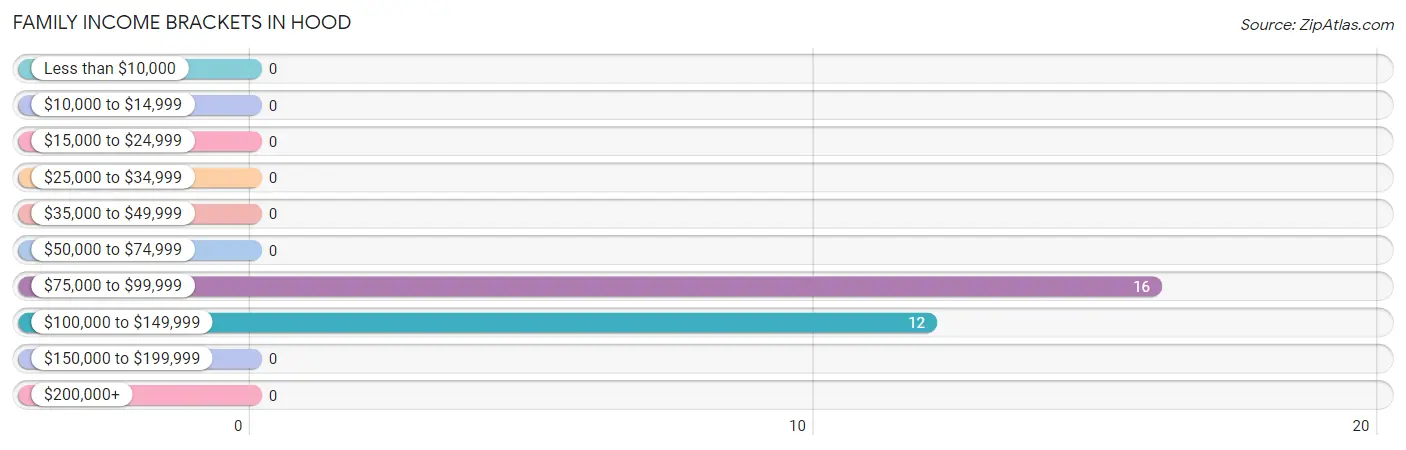
| Income Bracket | # Families | % Families |
| Less than $10,000 | 0 | 0.0% |
| $10,000 to $14,999 | 0 | 0.0% |
| $15,000 to $24,999 | 0 | 0.0% |
| $25,000 to $34,999 | 0 | 0.0% |
| $35,000 to $49,999 | 0 | 0.0% |
| $50,000 to $74,999 | 0 | 0.0% |
| $75,000 to $99,999 | 16 | 57.1% |
| $100,000 to $149,999 | 12 | 42.9% |
| $150,000 to $199,999 | 0 | 0.0% |
| $200,000+ | 0 | 0.0% |
Family Income by Famaliy Size in Hood
| Income Bracket | # Families | Median Income |
| 2-Person Families | 0 (0.0%) | $0 |
| 3-Person Families | 0 (0.0%) | $0 |
| 4-Person Families | 12 (42.9%) | $0 |
| 5-Person Families | 0 (0.0%) | $0 |
| 6-Person Families | 0 (0.0%) | $0 |
| 7+ Person Families | 16 (57.1%) | $0 |
| Total | 28 (100.0%) | $0 |
Family Income by Number of Earners in Hood
| Number of Earners | # Families | Median Income |
| No Earners | 0 (0.0%) | $0 |
| 1 Earner | 0 (0.0%) | $0 |
| 2 Earners | 12 (42.9%) | $0 |
| 3+ Earners | 16 (57.1%) | $0 |
| Total | 28 (100.0%) | $0 |
Household Income in Hood
Household Income Brackets in Hood
With 35 households falling in the category, the $35,000 to $49,999 income range is the most frequent in Hood, accounting for 32.1% of all households.
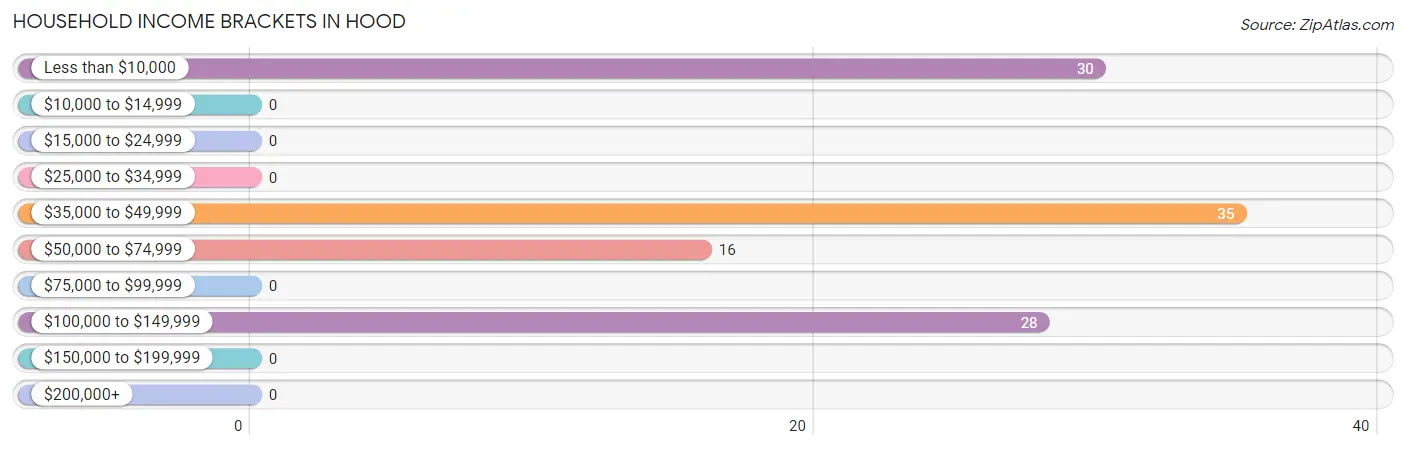
| Income Bracket | # Households | % Households |
| Less than $10,000 | 30 | 27.5% |
| $10,000 to $14,999 | 0 | 0.0% |
| $15,000 to $24,999 | 0 | 0.0% |
| $25,000 to $34,999 | 0 | 0.0% |
| $35,000 to $49,999 | 35 | 32.1% |
| $50,000 to $74,999 | 16 | 14.7% |
| $75,000 to $99,999 | 0 | 0.0% |
| $100,000 to $149,999 | 28 | 25.7% |
| $150,000 to $199,999 | 0 | 0.0% |
| $200,000+ | 0 | 0.0% |
Household Income by Householder Age in Hood
| Income Bracket | # Households | Median Income |
| 15 to 24 Years | 0 (0.0%) | $0 |
| 25 to 44 Years | 0 (0.0%) | $0 |
| 45 to 64 Years | 90 (82.6%) | $0 |
| 65+ Years | 19 (17.4%) | $0 |
| Total | 109 (100.0%) | $0 |
Poverty in Hood
Income Below Poverty by Sex and Age in Hood
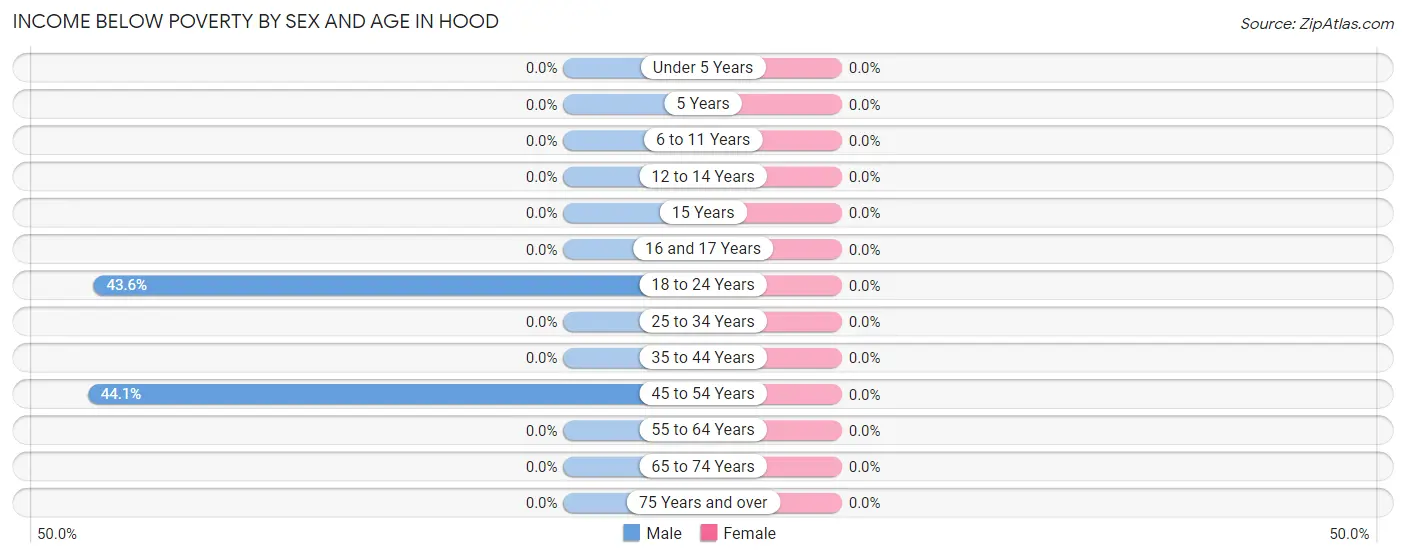
| Age Bracket | Male | Female |
| Under 5 Years | 0 (0.0%) | 0 (0.0%) |
| 5 Years | 0 (0.0%) | 0 (0.0%) |
| 6 to 11 Years | 0 (0.0%) | 0 (0.0%) |
| 12 to 14 Years | 0 (0.0%) | 0 (0.0%) |
| 15 Years | 0 (0.0%) | 0 (0.0%) |
| 16 and 17 Years | 0 (0.0%) | 0 (0.0%) |
| 18 to 24 Years | 17 (43.6%) | 0 (0.0%) |
| 25 to 34 Years | 0 (0.0%) | 0 (0.0%) |
| 35 to 44 Years | 0 (0.0%) | 0 (0.0%) |
| 45 to 54 Years | 30 (44.1%) | 0 (0.0%) |
| 55 to 64 Years | 0 (0.0%) | 0 (0.0%) |
| 65 to 74 Years | 0 (0.0%) | 0 (0.0%) |
| 75 Years and over | 0 (0.0%) | 0 (0.0%) |
| Total | 47 (37.0%) | 0 (0.0%) |
Income Above Poverty by Sex and Age in Hood
According to the poverty statistics in Hood, males aged under 5 years and females aged under 5 years are the age groups that are most secure financially, with 100.0% of males and 100.0% of females in these age groups living above the poverty line.
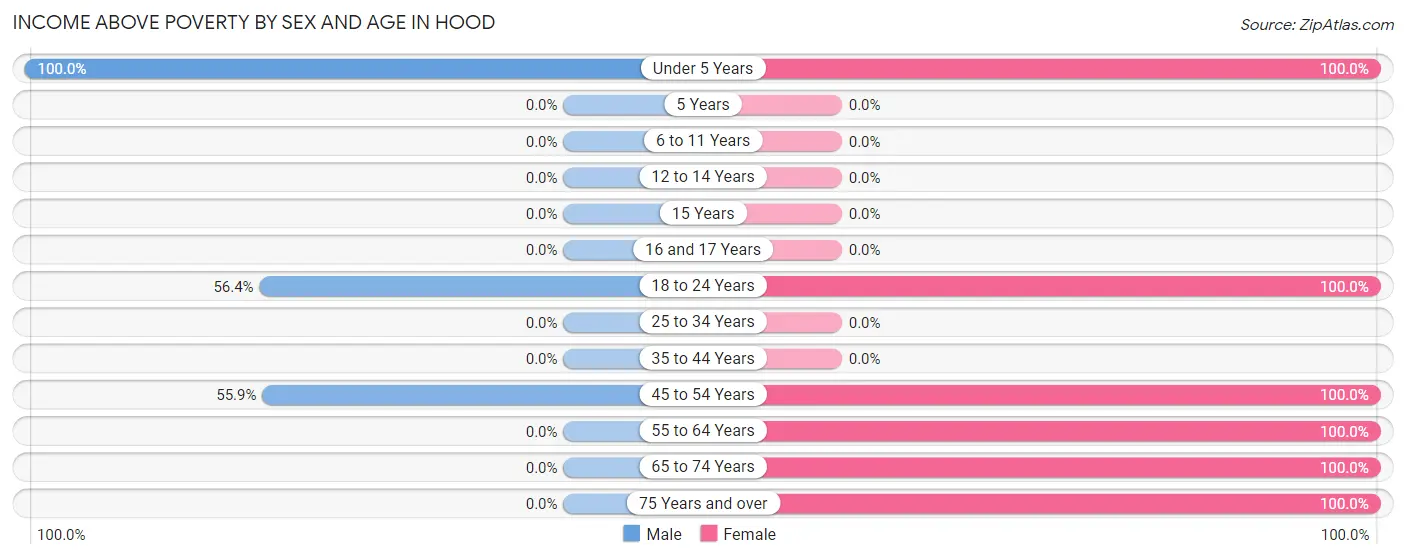
| Age Bracket | Male | Female |
| Under 5 Years | 20 (100.0%) | 26 (100.0%) |
| 5 Years | 0 (0.0%) | 0 (0.0%) |
| 6 to 11 Years | 0 (0.0%) | 0 (0.0%) |
| 12 to 14 Years | 0 (0.0%) | 0 (0.0%) |
| 15 Years | 0 (0.0%) | 0 (0.0%) |
| 16 and 17 Years | 0 (0.0%) | 0 (0.0%) |
| 18 to 24 Years | 22 (56.4%) | 62 (100.0%) |
| 25 to 34 Years | 0 (0.0%) | 0 (0.0%) |
| 35 to 44 Years | 0 (0.0%) | 0 (0.0%) |
| 45 to 54 Years | 38 (55.9%) | 64 (100.0%) |
| 55 to 64 Years | 0 (0.0%) | 16 (100.0%) |
| 65 to 74 Years | 0 (0.0%) | 10 (100.0%) |
| 75 Years and over | 0 (0.0%) | 9 (100.0%) |
| Total | 80 (63.0%) | 187 (100.0%) |
Income Below Poverty Among Married-Couple Families in Hood
| Children | Above Poverty | Below Poverty |
| No Children | 12 (100.0%) | 0 (0.0%) |
| 1 or 2 Children | 0 (0.0%) | 0 (0.0%) |
| 3 or 4 Children | 0 (0.0%) | 0 (0.0%) |
| 5 or more Children | 0 (0.0%) | 0 (0.0%) |
| Total | 12 (100.0%) | 0 (0.0%) |
Income Below Poverty Among Single-Parent Households in Hood
| Children | Single Father | Single Mother |
| No Children | 0 (0.0%) | 0 (0.0%) |
| 1 or 2 Children | 0 (0.0%) | 0 (0.0%) |
| 3 or 4 Children | 0 (0.0%) | 0 (0.0%) |
| 5 or more Children | 0 (0.0%) | 0 (0.0%) |
| Total | 0 (0.0%) | 0 (0.0%) |
Income Below Poverty Among Married-Couple vs Single-Parent Households in Hood
| Children | Married-Couple Families | Single-Parent Households |
| No Children | 0 (0.0%) | 0 (0.0%) |
| 1 or 2 Children | 0 (0.0%) | 0 (0.0%) |
| 3 or 4 Children | 0 (0.0%) | 0 (0.0%) |
| 5 or more Children | 0 (0.0%) | 0 (0.0%) |
| Total | 0 (0.0%) | 0 (0.0%) |
Race in Hood
The most populous races in Hood are Hispanic or Latino (289 | 92.0%), White / Caucasian (208 | 66.2%), and Two or more Races (62 | 19.8%).
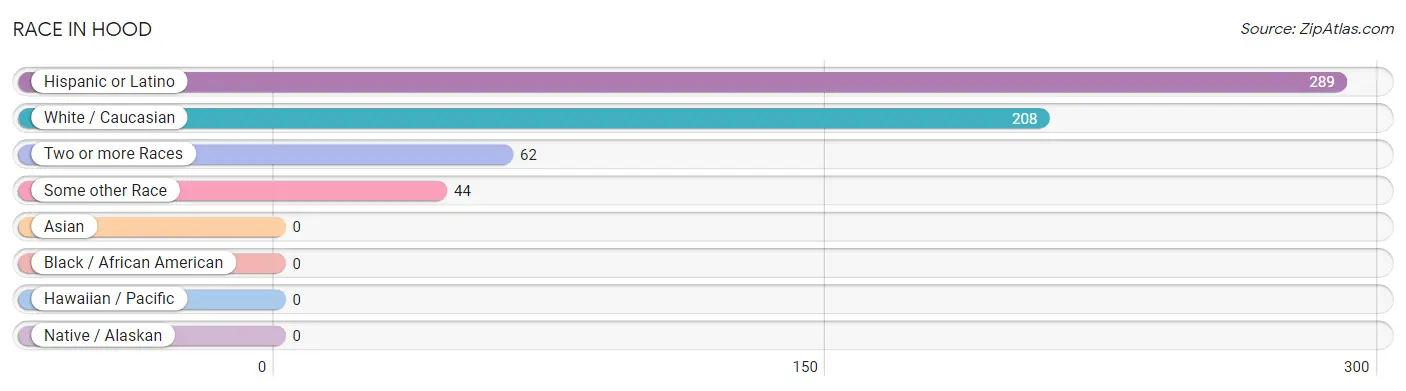
| Race | # Population | % Population |
| Asian | 0 | 0.0% |
| Black / African American | 0 | 0.0% |
| Hawaiian / Pacific | 0 | 0.0% |
| Hispanic or Latino | 289 | 92.0% |
| Native / Alaskan | 0 | 0.0% |
| White / Caucasian | 208 | 66.2% |
| Two or more Races | 62 | 19.8% |
| Some other Race | 44 | 14.0% |
| Total | 314 | 100.0% |
Ancestry in Hood
The most populous ancestries reported in Hood are Mexican (245 | 78.0%), Native Hawaiian (26 | 8.3%), Central American (22 | 7.0%), Salvadoran (22 | 7.0%), and Irish (10 | 3.2%), together accounting for 103.5% of all Hood residents.
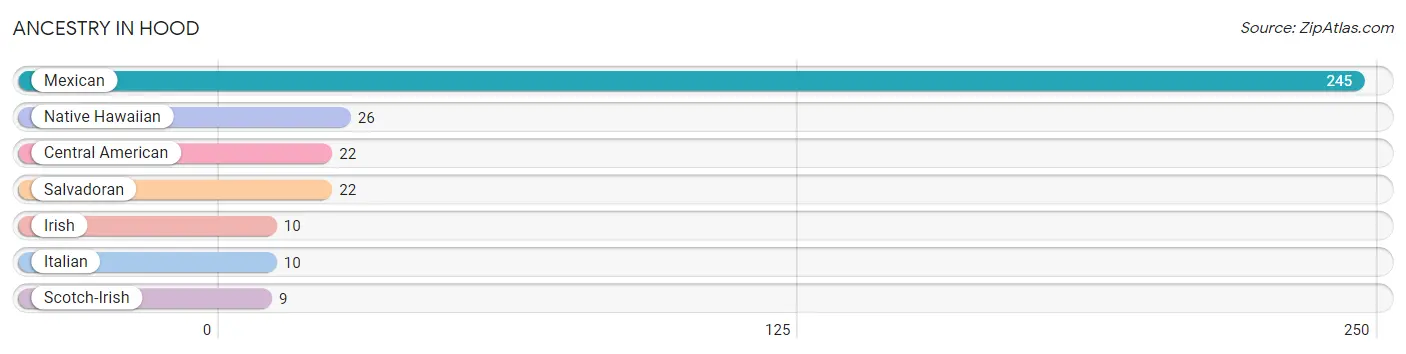
| Ancestry | # Population | % Population |
| Central American | 22 | 7.0% |
| Irish | 10 | 3.2% |
| Italian | 10 | 3.2% |
| Mexican | 245 | 78.0% |
| Native Hawaiian | 26 | 8.3% |
| Salvadoran | 22 | 7.0% |
| Scotch-Irish | 9 | 2.9% | View All 7 Rows |
Immigrants in Hood
The most numerous immigrant groups reported in Hood came from Central America (22 | 7.0%), El Salvador (22 | 7.0%), and Latin America (22 | 7.0%), together accounting for 21.0% of all Hood residents.
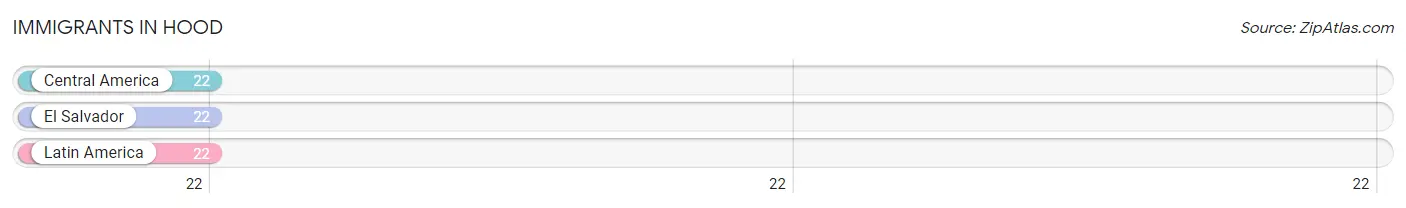
| Immigration Origin | # Population | % Population |
| Central America | 22 | 7.0% |
| El Salvador | 22 | 7.0% |
| Latin America | 22 | 7.0% | View All 3 Rows |
Sex and Age in Hood
Sex and Age in Hood
The most populous age groups in Hood are 45 to 49 Years (56 | 44.1%) for men and 45 to 49 Years (48 | 25.7%) for women.
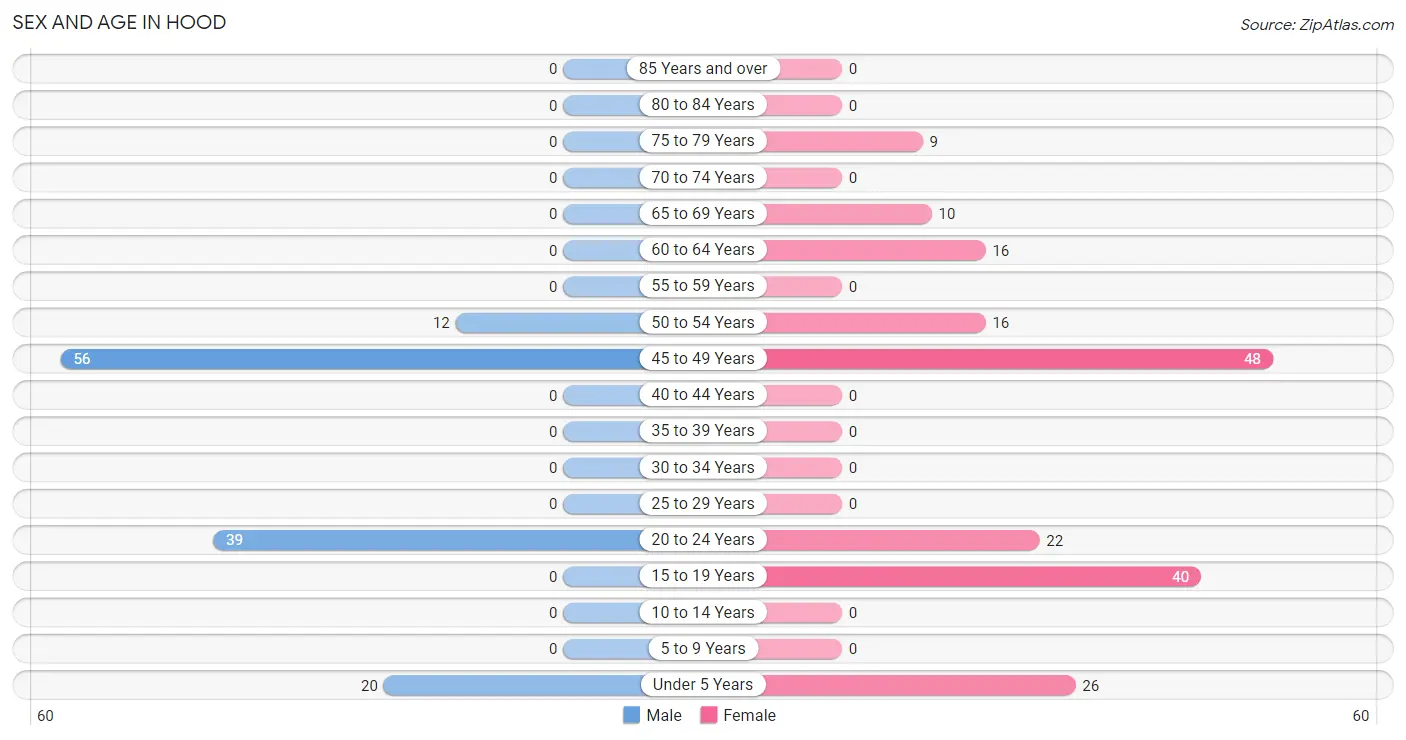
| Age Bracket | Male | Female |
| Under 5 Years | 20 (15.8%) | 26 (13.9%) |
| 5 to 9 Years | 0 (0.0%) | 0 (0.0%) |
| 10 to 14 Years | 0 (0.0%) | 0 (0.0%) |
| 15 to 19 Years | 0 (0.0%) | 40 (21.4%) |
| 20 to 24 Years | 39 (30.7%) | 22 (11.8%) |
| 25 to 29 Years | 0 (0.0%) | 0 (0.0%) |
| 30 to 34 Years | 0 (0.0%) | 0 (0.0%) |
| 35 to 39 Years | 0 (0.0%) | 0 (0.0%) |
| 40 to 44 Years | 0 (0.0%) | 0 (0.0%) |
| 45 to 49 Years | 56 (44.1%) | 48 (25.7%) |
| 50 to 54 Years | 12 (9.5%) | 16 (8.6%) |
| 55 to 59 Years | 0 (0.0%) | 0 (0.0%) |
| 60 to 64 Years | 0 (0.0%) | 16 (8.6%) |
| 65 to 69 Years | 0 (0.0%) | 10 (5.3%) |
| 70 to 74 Years | 0 (0.0%) | 0 (0.0%) |
| 75 to 79 Years | 0 (0.0%) | 9 (4.8%) |
| 80 to 84 Years | 0 (0.0%) | 0 (0.0%) |
| 85 Years and over | 0 (0.0%) | 0 (0.0%) |
| Total | 127 (100.0%) | 187 (100.0%) |
Families and Households in Hood
Median Family Size in Hood
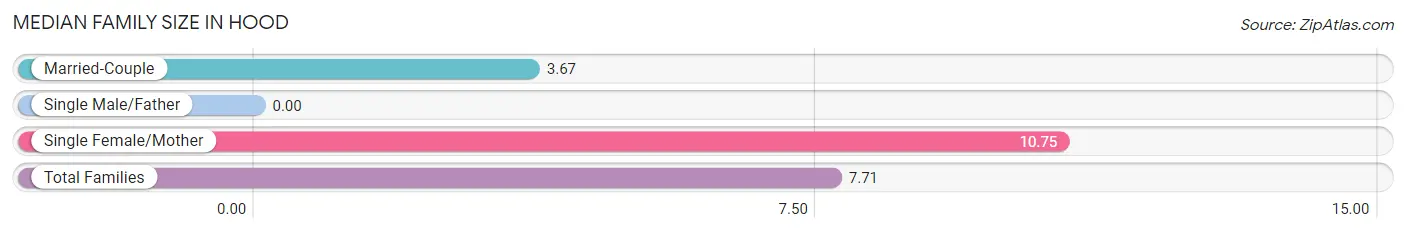
| Family Type | # Families | Family Size |
| Married-Couple | 12 (42.9%) | 3.67 |
| Single Male/Father | 0 (0.0%) | - |
| Single Female/Mother | 16 (57.1%) | 10.75 |
| Total Families | 28 (100.0%) | 7.71 |
Median Household Size in Hood
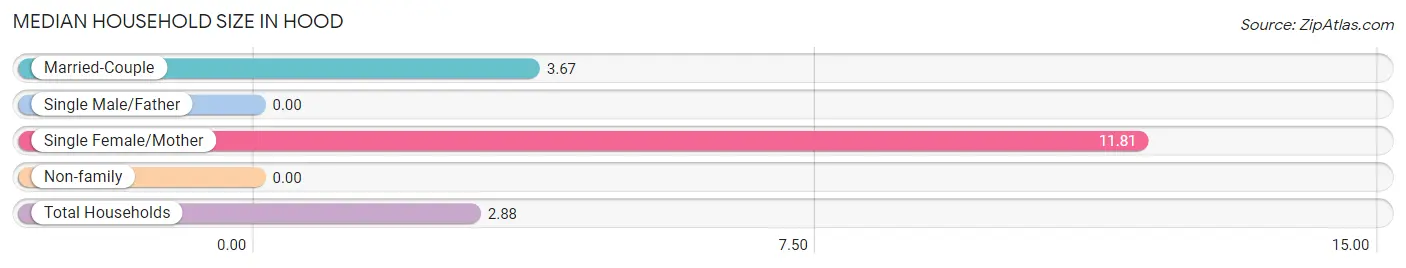
| Household Type | # Households | Household Size |
| Married-Couple | 12 (11.0%) | 3.67 |
| Single Male/Father | 0 (0.0%) | - |
| Single Female/Mother | 16 (14.7%) | 11.81 |
| Non-family | 81 (74.3%) | - |
| Total Households | 109 (100.0%) | 2.88 |
Household Size by Marriage Status in Hood
Out of a total of 109 households in Hood, 28 (25.7%) are family households, while 81 (74.3%) are nonfamily households. The most numerous type of family households are 7+ person households, comprising 16, and the most common type of nonfamily households are 1-person households, comprising 81.
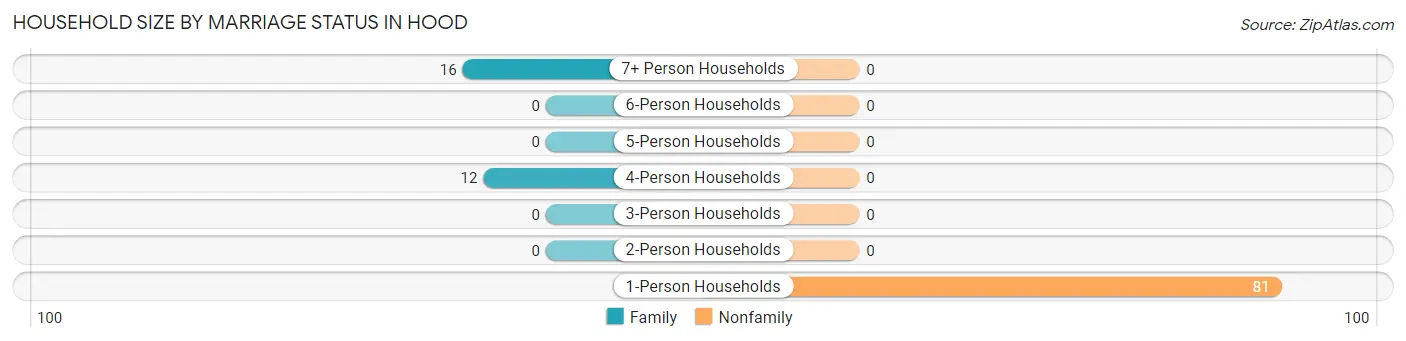
| Household Size | Family Households | Nonfamily Households |
| 1-Person Households | - | 81 (74.3%) |
| 2-Person Households | 0 (0.0%) | 0 (0.0%) |
| 3-Person Households | 0 (0.0%) | 0 (0.0%) |
| 4-Person Households | 12 (11.0%) | 0 (0.0%) |
| 5-Person Households | 0 (0.0%) | 0 (0.0%) |
| 6-Person Households | 0 (0.0%) | 0 (0.0%) |
| 7+ Person Households | 16 (14.7%) | 0 (0.0%) |
| Total | 28 (25.7%) | 81 (74.3%) |
Female Fertility in Hood
Fertility by Age in Hood
Average fertility rate in Hood is 183.0 births per 1,000 women. Women in the age bracket of 20 to 34 years have the highest fertility rate with 1,000.0 births per 1,000 women. Women in the age bracket of 20 to 34 years acount for 100.0% of all women with births.
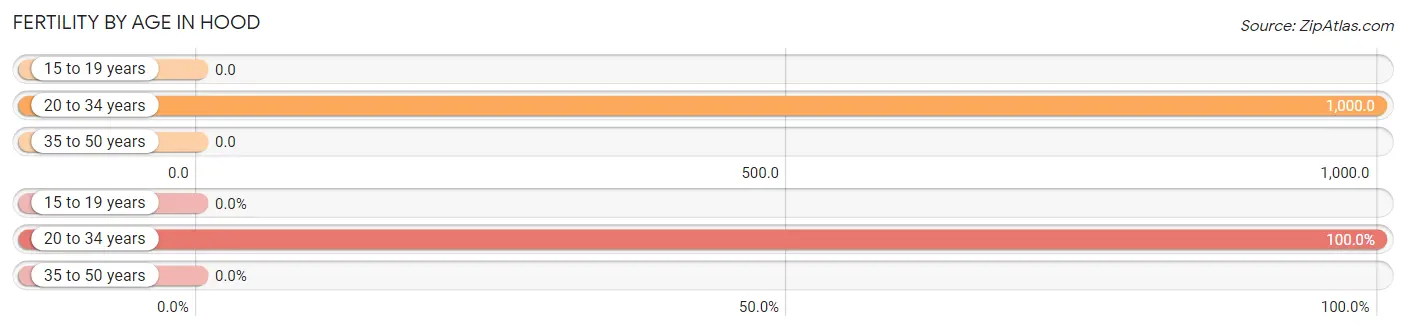
| Age Bracket | Women with Births | Births / 1,000 Women |
| 15 to 19 years | 0 (0.0%) | 0.0 |
| 20 to 34 years | 22 (100.0%) | 1,000.0 |
| 35 to 50 years | 0 (0.0%) | 0.0 |
| Total | 22 (100.0%) | 183.0 |
Fertility by Age by Marriage Status in Hood
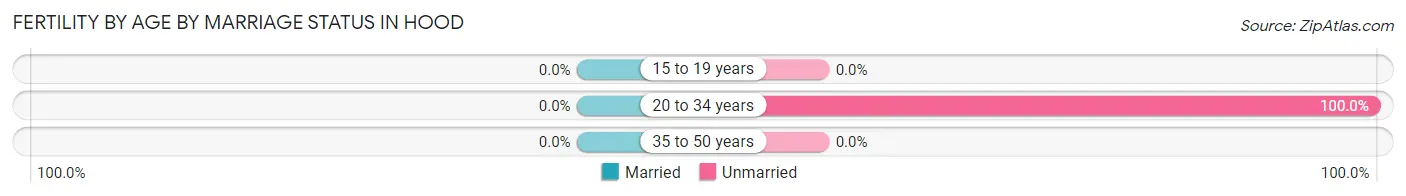
| Age Bracket | Married | Unmarried |
| 15 to 19 years | 0 (0.0%) | 0 (0.0%) |
| 20 to 34 years | 0 (0.0%) | 22 (100.0%) |
| 35 to 50 years | 0 (0.0%) | 0 (0.0%) |
| Total | 0 (0.0%) | 22 (100.0%) |
Fertility by Education in Hood
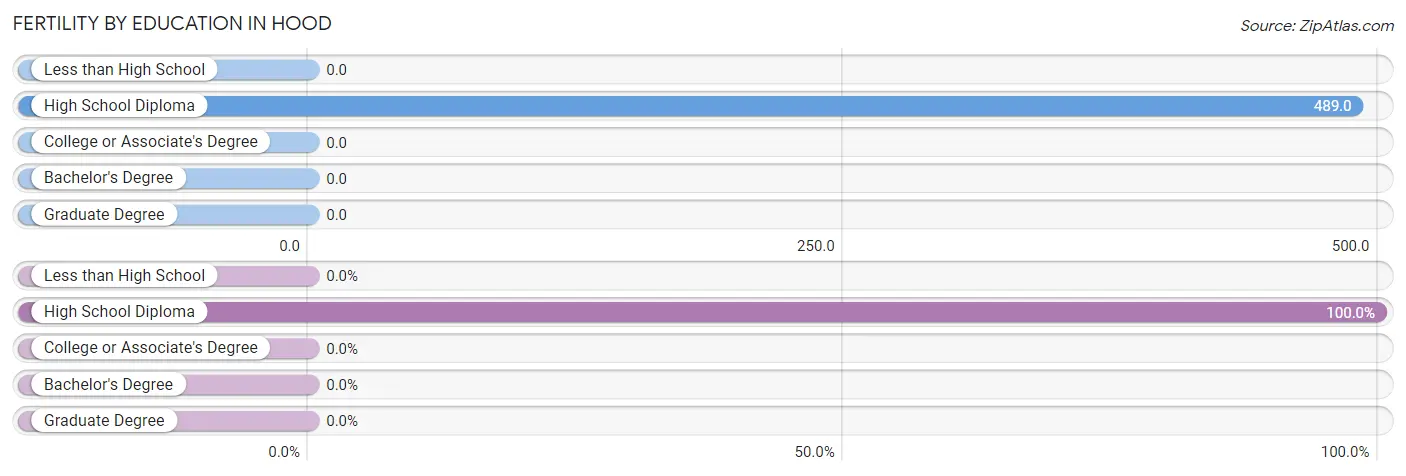
| Educational Attainment | Women with Births | Births / 1,000 Women |
| Less than High School | 0 (0.0%) | 0.0 |
| High School Diploma | 22 (100.0%) | 489.0 |
| College or Associate's Degree | 0 (0.0%) | 0.0 |
| Bachelor's Degree | 0 (0.0%) | 0.0 |
| Graduate Degree | 0 (0.0%) | 0.0 |
| Total | 22 (100.0%) | 183.0 |
Fertility by Education by Marriage Status in Hood
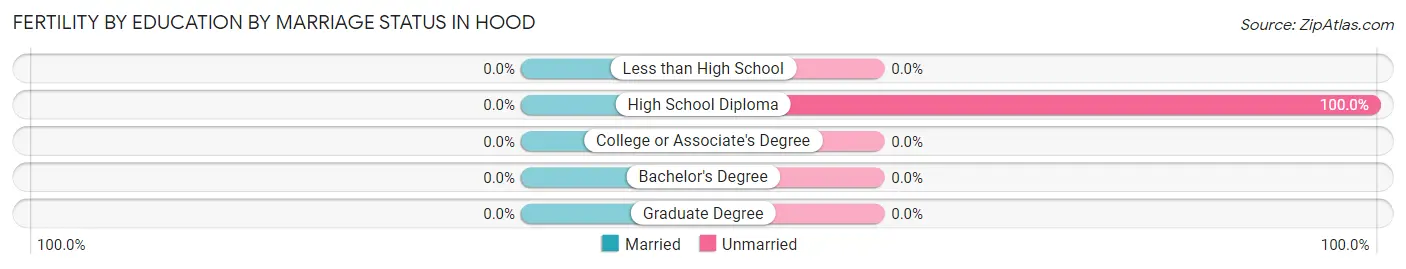
| Educational Attainment | Married | Unmarried |
| Less than High School | 0 (0.0%) | 0 (0.0%) |
| High School Diploma | 0 (0.0%) | 22 (100.0%) |
| College or Associate's Degree | 0 (0.0%) | 0 (0.0%) |
| Bachelor's Degree | 0 (0.0%) | 0 (0.0%) |
| Graduate Degree | 0 (0.0%) | 0 (0.0%) |
| Total | 0 (0.0%) | 22 (100.0%) |
Employment Characteristics in Hood
Employment by Class of Employer in Hood
Among the 109 employed individuals in Hood, private company employees (37 | 33.9%), self-employed (not incorporated) (30 | 27.5%), and self-employed (incorporated) (26 | 23.8%) make up the most common classes of employment.
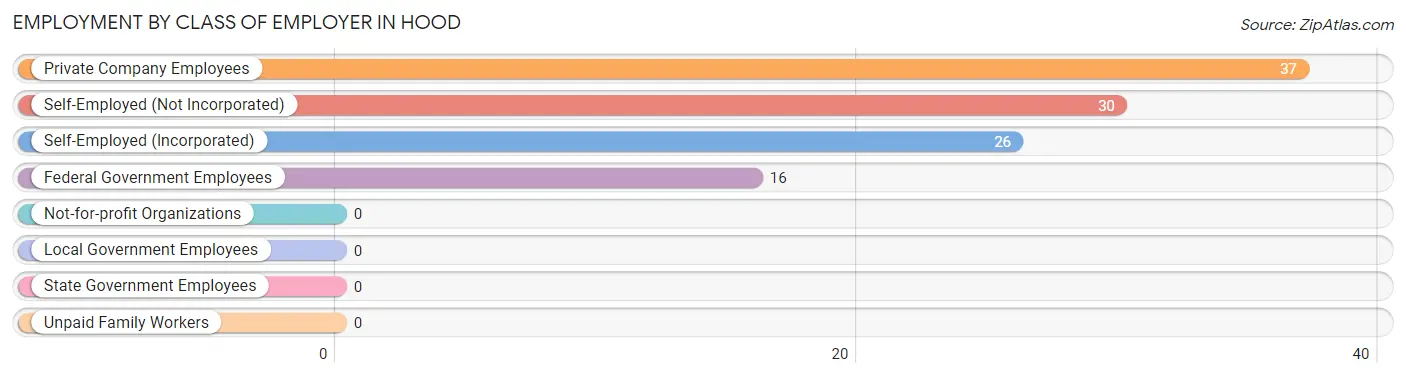
| Employer Class | # Employees | % Employees |
| Private Company Employees | 37 | 33.9% |
| Self-Employed (Incorporated) | 26 | 23.8% |
| Self-Employed (Not Incorporated) | 30 | 27.5% |
| Not-for-profit Organizations | 0 | 0.0% |
| Local Government Employees | 0 | 0.0% |
| State Government Employees | 0 | 0.0% |
| Federal Government Employees | 16 | 14.7% |
| Unpaid Family Workers | 0 | 0.0% |
| Total | 109 | 100.0% |
Employment Status by Age in Hood
According to the labor force statistics for Hood, out of the total population over 16 years of age (268), 55.2% or 148 individuals are in the labor force, with 11.5% or 17 of them unemployed. The age group with the highest labor force participation rate is 60 to 64 years, with 100.0% or 16 individuals in the labor force. Within the labor force, the 20 to 24 years age range has the highest percentage of unemployed individuals, with 43.6% or 17 of them being unemployed.
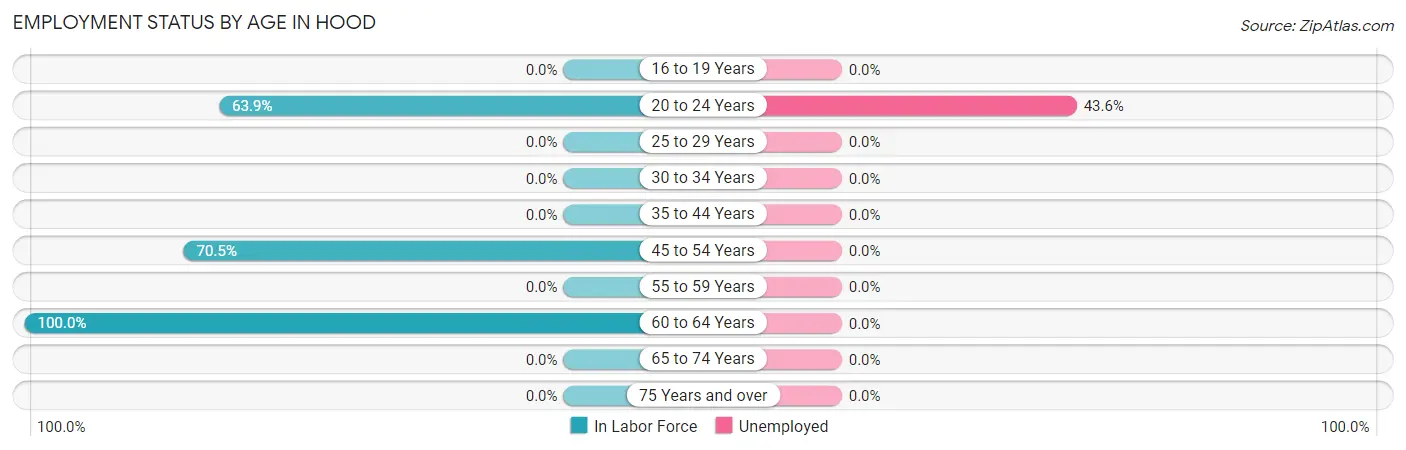
| Age Bracket | In Labor Force | Unemployed |
| 16 to 19 Years | 0 (0.0%) | 0 (0.0%) |
| 20 to 24 Years | 39 (63.9%) | 17 (43.6%) |
| 25 to 29 Years | 0 (0.0%) | 0 (0.0%) |
| 30 to 34 Years | 0 (0.0%) | 0 (0.0%) |
| 35 to 44 Years | 0 (0.0%) | 0 (0.0%) |
| 45 to 54 Years | 93 (70.5%) | 0 (0.0%) |
| 55 to 59 Years | 0 (0.0%) | 0 (0.0%) |
| 60 to 64 Years | 16 (100.0%) | 0 (0.0%) |
| 65 to 74 Years | 0 (0.0%) | 0 (0.0%) |
| 75 Years and over | 0 (0.0%) | 0 (0.0%) |
| Total | 148 (55.2%) | 17 (11.5%) |
Employment Status by Educational Attainment in Hood
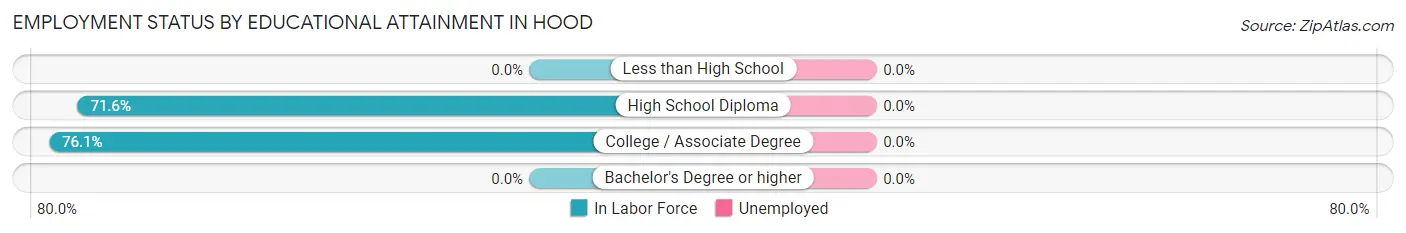
| Educational Attainment | In Labor Force | Unemployed |
| Less than High School | 0 (0.0%) | 0 (0.0%) |
| High School Diploma | 58 (71.6%) | 0 (0.0%) |
| College / Associate Degree | 51 (76.1%) | 0 (0.0%) |
| Bachelor's Degree or higher | 0 (0.0%) | 0 (0.0%) |
| Total | 109 (73.6%) | 0 (0.0%) |
Employment Occupations by Sex in Hood
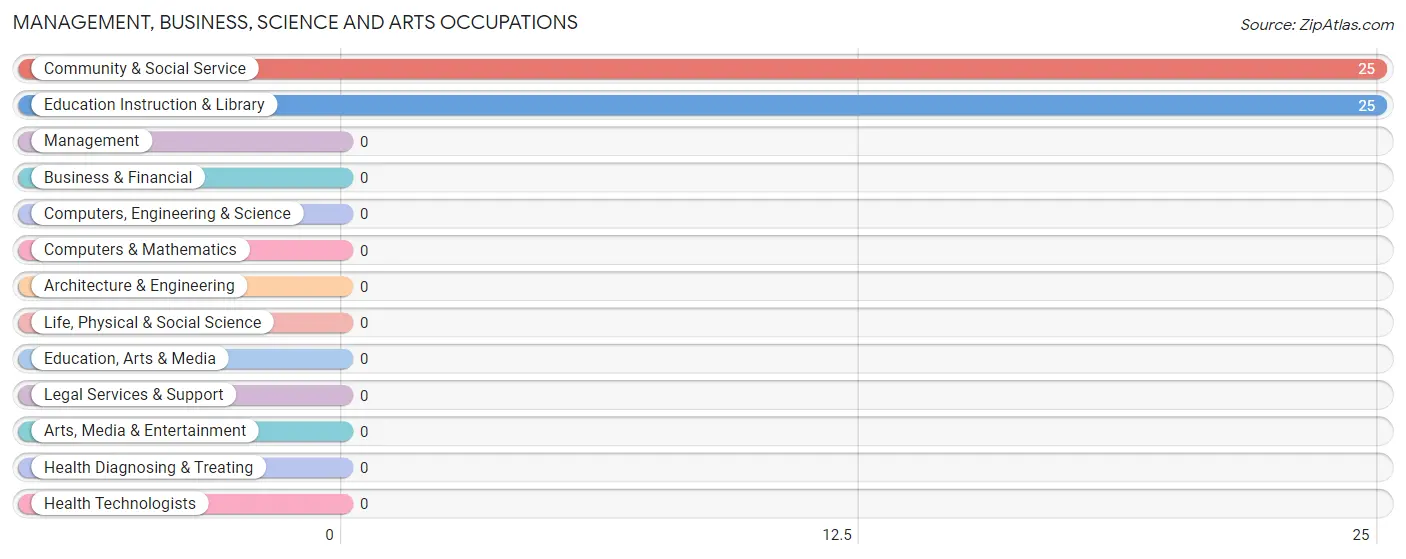
Management, Business, Science and Arts Occupations
The most common Management, Business, Science and Arts occupations in Hood are Community & Social Service (25 | 19.1%), and Education Instruction & Library (25 | 19.1%).
Management, Business, Science and Arts Occupations by Sex
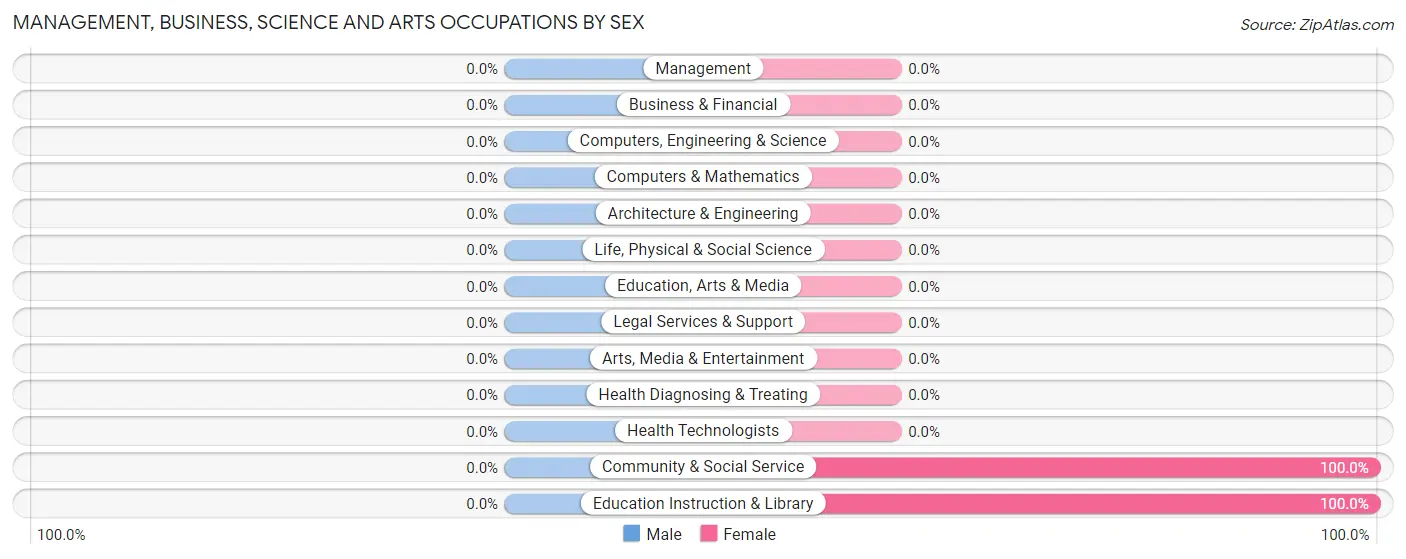
| Occupation | Male | Female |
| Management | 0 (0.0%) | 0 (0.0%) |
| Business & Financial | 0 (0.0%) | 0 (0.0%) |
| Computers, Engineering & Science | 0 (0.0%) | 0 (0.0%) |
| Computers & Mathematics | 0 (0.0%) | 0 (0.0%) |
| Architecture & Engineering | 0 (0.0%) | 0 (0.0%) |
| Life, Physical & Social Science | 0 (0.0%) | 0 (0.0%) |
| Community & Social Service | 0 (0.0%) | 25 (100.0%) |
| Education, Arts & Media | 0 (0.0%) | 0 (0.0%) |
| Legal Services & Support | 0 (0.0%) | 0 (0.0%) |
| Education Instruction & Library | 0 (0.0%) | 25 (100.0%) |
| Arts, Media & Entertainment | 0 (0.0%) | 0 (0.0%) |
| Health Diagnosing & Treating | 0 (0.0%) | 0 (0.0%) |
| Health Technologists | 0 (0.0%) | 0 (0.0%) |
| Total (Category) | 0 (0.0%) | 25 (100.0%) |
| Total (Overall) | 68 (51.9%) | 63 (48.1%) |
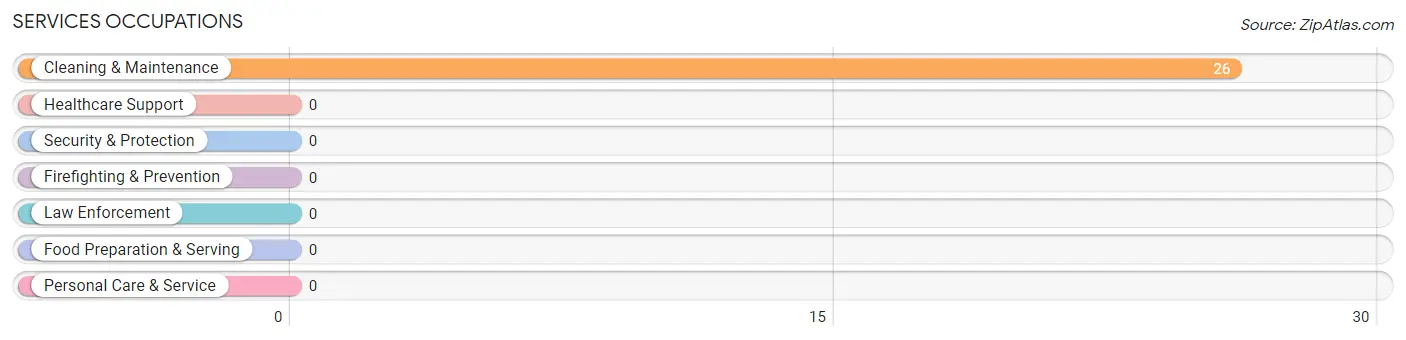
Services Occupations
The most common Services occupations in Hood are , and Cleaning & Maintenance (26 | 19.9%).
Services Occupations by Sex
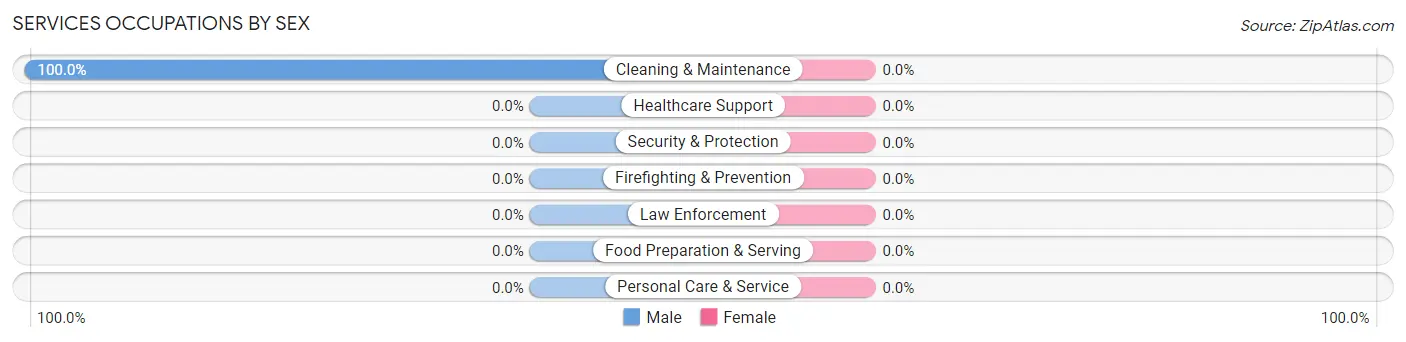
| Occupation | Male | Female |
| Healthcare Support | 0 (0.0%) | 0 (0.0%) |
| Security & Protection | 0 (0.0%) | 0 (0.0%) |
| Firefighting & Prevention | 0 (0.0%) | 0 (0.0%) |
| Law Enforcement | 0 (0.0%) | 0 (0.0%) |
| Food Preparation & Serving | 0 (0.0%) | 0 (0.0%) |
| Cleaning & Maintenance | 26 (100.0%) | 0 (0.0%) |
| Personal Care & Service | 0 (0.0%) | 0 (0.0%) |
| Total (Category) | 26 (100.0%) | 0 (0.0%) |
| Total (Overall) | 68 (51.9%) | 63 (48.1%) |
Sales and Office Occupations
The most common Sales and Office occupations in Hood are Sales & Related (22 | 16.8%), and Office & Administration (16 | 12.2%).
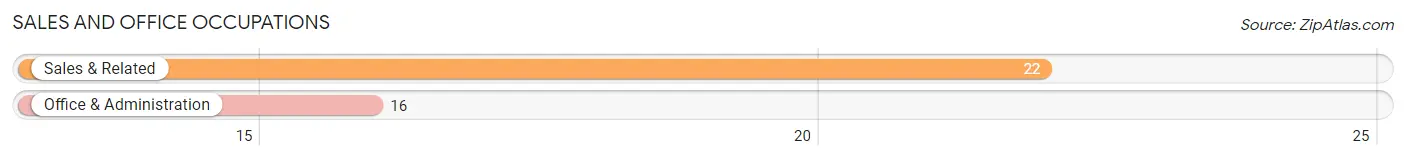
Sales and Office Occupations by Sex
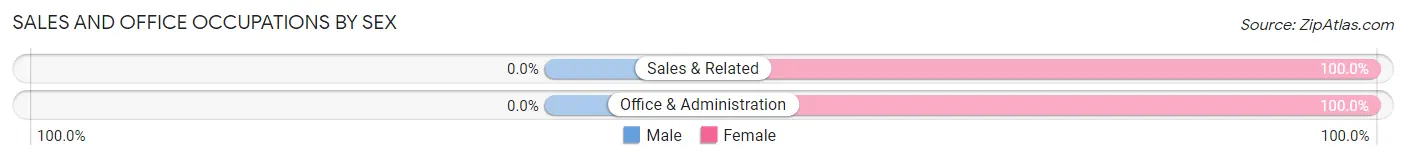
| Occupation | Male | Female |
| Sales & Related | 0 (0.0%) | 22 (100.0%) |
| Office & Administration | 0 (0.0%) | 16 (100.0%) |
| Total (Category) | 0 (0.0%) | 38 (100.0%) |
| Total (Overall) | 68 (51.9%) | 63 (48.1%) |
Natural Resources, Construction and Maintenance Occupations
The most common Natural Resources, Construction and Maintenance occupations in Hood are , and Construction & Extraction (30 | 22.9%).
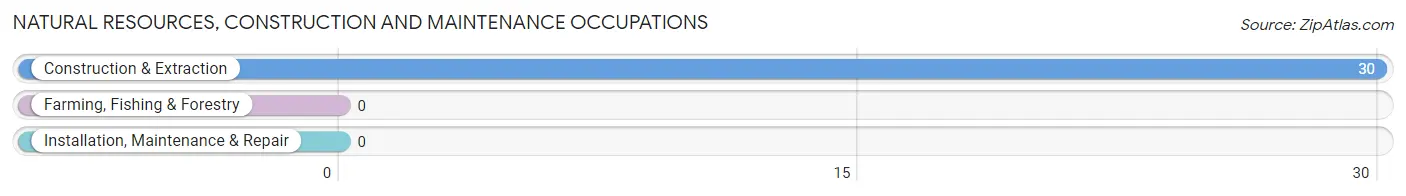
Natural Resources, Construction and Maintenance Occupations by Sex
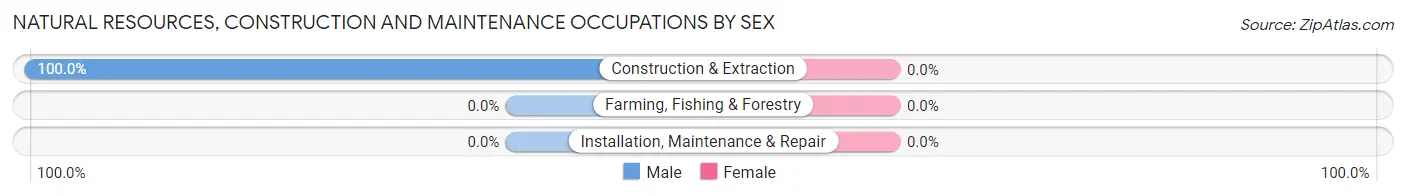
| Occupation | Male | Female |
| Farming, Fishing & Forestry | 0 (0.0%) | 0 (0.0%) |
| Construction & Extraction | 30 (100.0%) | 0 (0.0%) |
| Installation, Maintenance & Repair | 0 (0.0%) | 0 (0.0%) |
| Total (Category) | 30 (100.0%) | 0 (0.0%) |
| Total (Overall) | 68 (51.9%) | 63 (48.1%) |
Production, Transportation and Moving Occupations
The most common Production, Transportation and Moving occupations in Hood are , and Material Moving (12 | 9.2%).
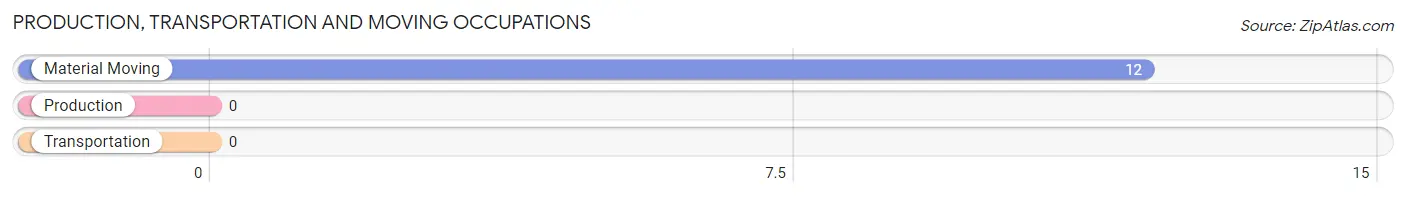
Production, Transportation and Moving Occupations by Sex
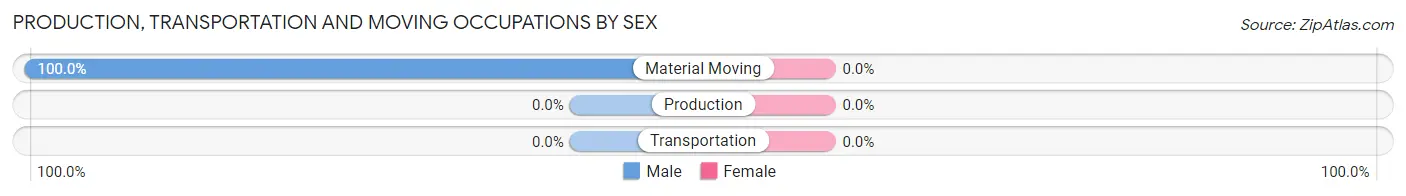
| Occupation | Male | Female |
| Production | 0 (0.0%) | 0 (0.0%) |
| Transportation | 0 (0.0%) | 0 (0.0%) |
| Material Moving | 12 (100.0%) | 0 (0.0%) |
| Total (Category) | 12 (100.0%) | 0 (0.0%) |
| Total (Overall) | 68 (51.9%) | 63 (48.1%) |
Employment Industries by Sex in Hood
Employment Industries in Hood
The major employment industries in Hood include Construction (30 | 22.9%), Administrative & Support (26 | 19.9%), Health Care & Social Assistance (25 | 19.1%), Information (22 | 16.8%), and Transportation & Warehousing (16 | 12.2%).
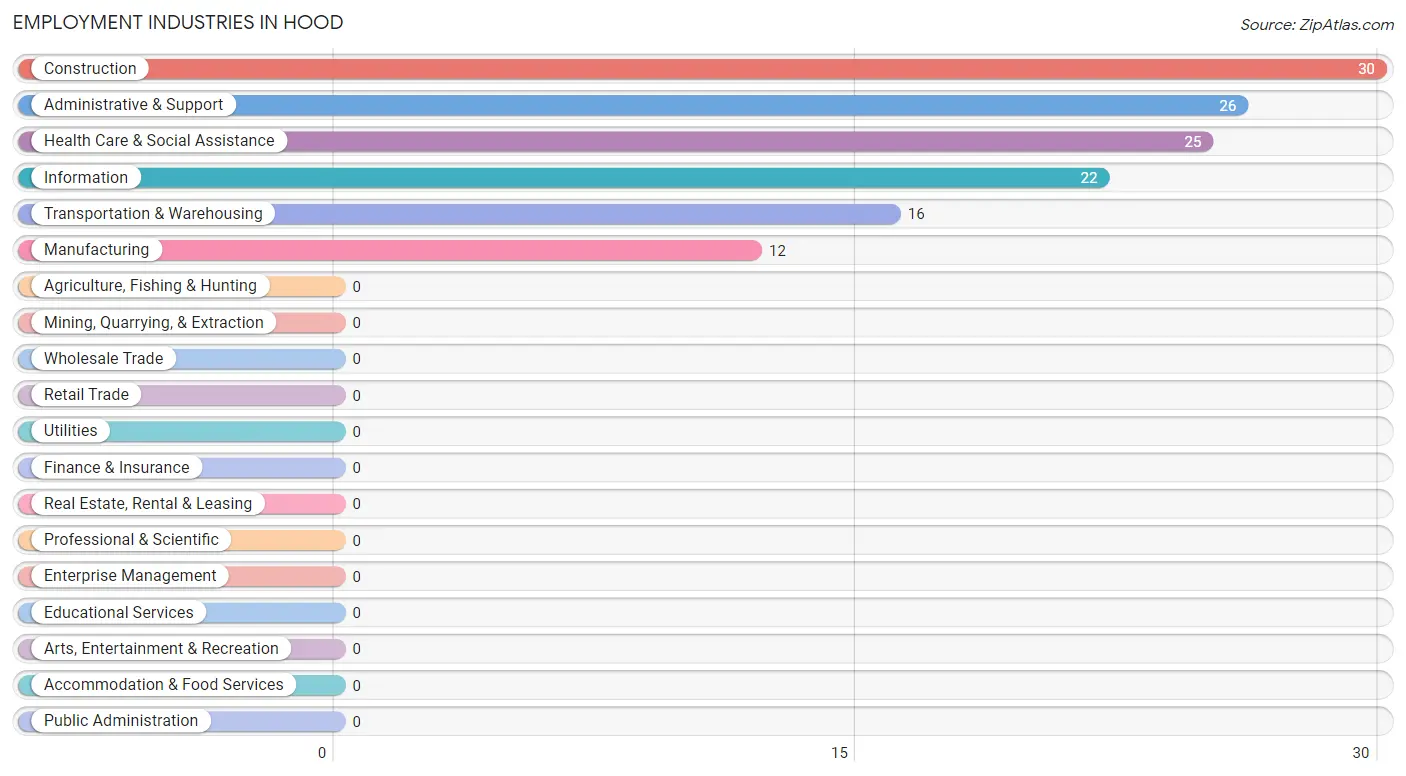
Employment Industries by Sex in Hood
The Hood industries that see more men than women are Construction (100.0%), Manufacturing (100.0%), and Administrative & Support (100.0%), whereas the industries that tend to have a higher number of women are Transportation & Warehousing (100.0%), Information (100.0%), and Health Care & Social Assistance (100.0%).
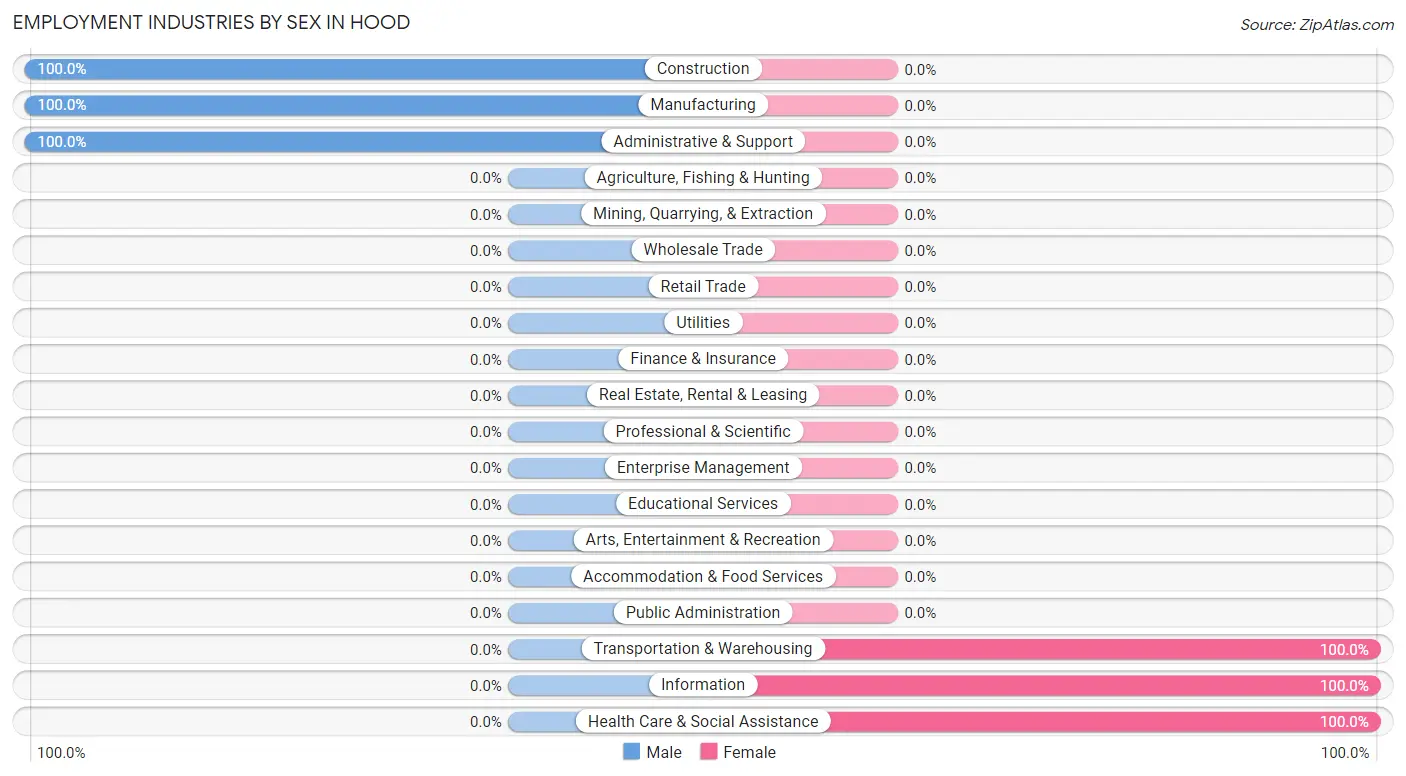
| Industry | Male | Female |
| Agriculture, Fishing & Hunting | 0 (0.0%) | 0 (0.0%) |
| Mining, Quarrying, & Extraction | 0 (0.0%) | 0 (0.0%) |
| Construction | 30 (100.0%) | 0 (0.0%) |
| Manufacturing | 12 (100.0%) | 0 (0.0%) |
| Wholesale Trade | 0 (0.0%) | 0 (0.0%) |
| Retail Trade | 0 (0.0%) | 0 (0.0%) |
| Transportation & Warehousing | 0 (0.0%) | 16 (100.0%) |
| Utilities | 0 (0.0%) | 0 (0.0%) |
| Information | 0 (0.0%) | 22 (100.0%) |
| Finance & Insurance | 0 (0.0%) | 0 (0.0%) |
| Real Estate, Rental & Leasing | 0 (0.0%) | 0 (0.0%) |
| Professional & Scientific | 0 (0.0%) | 0 (0.0%) |
| Enterprise Management | 0 (0.0%) | 0 (0.0%) |
| Administrative & Support | 26 (100.0%) | 0 (0.0%) |
| Educational Services | 0 (0.0%) | 0 (0.0%) |
| Health Care & Social Assistance | 0 (0.0%) | 25 (100.0%) |
| Arts, Entertainment & Recreation | 0 (0.0%) | 0 (0.0%) |
| Accommodation & Food Services | 0 (0.0%) | 0 (0.0%) |
| Public Administration | 0 (0.0%) | 0 (0.0%) |
| Total | 68 (51.9%) | 63 (48.1%) |
Education in Hood
School Enrollment in Hood
The most common levels of schooling among the 62 students in Hood are high school (40 | 64.5%), and college / undergraduate (22 | 35.5%).
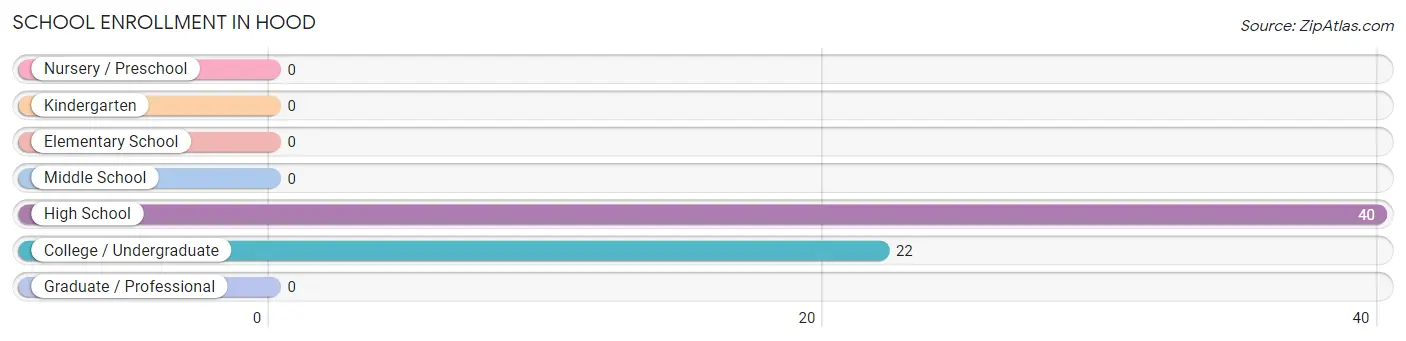
| School Level | # Students | % Students |
| Nursery / Preschool | 0 | 0.0% |
| Kindergarten | 0 | 0.0% |
| Elementary School | 0 | 0.0% |
| Middle School | 0 | 0.0% |
| High School | 40 | 64.5% |
| College / Undergraduate | 22 | 35.5% |
| Graduate / Professional | 0 | 0.0% |
| Total | 62 | 100.0% |
School Enrollment by Age by Funding Source in Hood
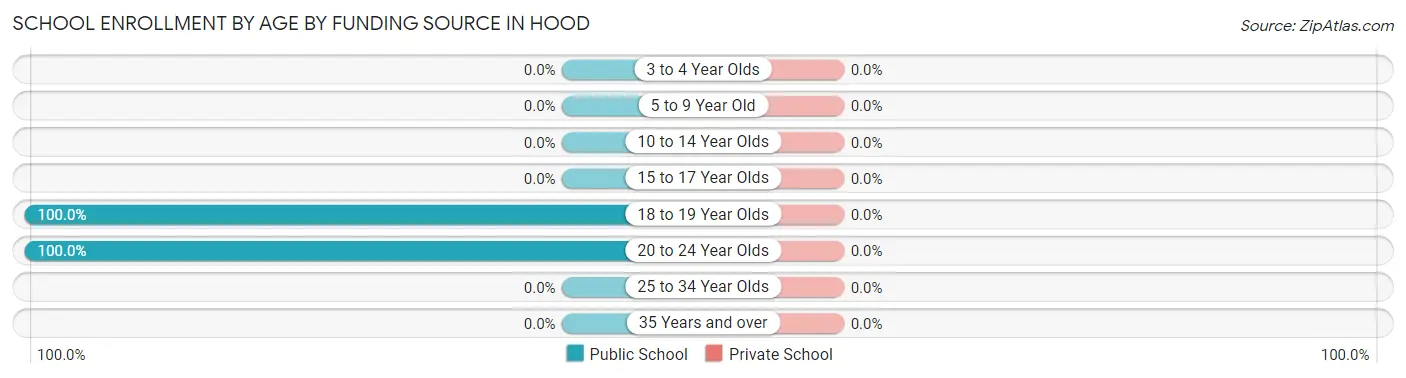
| Age Bracket | Public School | Private School |
| 3 to 4 Year Olds | 0 (0.0%) | 0 (0.0%) |
| 5 to 9 Year Old | 0 (0.0%) | 0 (0.0%) |
| 10 to 14 Year Olds | 0 (0.0%) | 0 (0.0%) |
| 15 to 17 Year Olds | 0 (0.0%) | 0 (0.0%) |
| 18 to 19 Year Olds | 40 (100.0%) | 0 (0.0%) |
| 20 to 24 Year Olds | 22 (100.0%) | 0 (0.0%) |
| 25 to 34 Year Olds | 0 (0.0%) | 0 (0.0%) |
| 35 Years and over | 0 (0.0%) | 0 (0.0%) |
| Total | 62 (100.0%) | 0 (0.0%) |
Educational Attainment by Field of Study in Hood
| Field of Study | # Graduates | % Graduates |
| Computers & Mathematics | 0 | 0.0% |
| Bio, Nature & Agricultural | 0 | 0.0% |
| Physical & Health Sciences | 0 | 0.0% |
| Psychology | 0 | 0.0% |
| Social Sciences | 0 | 0.0% |
| Engineering | 0 | 0.0% |
| Multidisciplinary Studies | 0 | 0.0% |
| Science & Technology | 0 | 0.0% |
| Business | 0 | 0.0% |
| Education | 0 | 0.0% |
| Literature & Languages | 0 | 0.0% |
| Liberal Arts & History | 0 | 0.0% |
| Visual & Performing Arts | 0 | 0.0% |
| Communications | 0 | 0.0% |
| Arts & Humanities | 0 | 0.0% |
| Total | 0 | 0.0% |
Transportation & Commute in Hood
Vehicle Availability by Sex in Hood
The most prevalent vehicle ownership categories in Hood are males with 2 vehicles (56, accounting for 82.4%) and females with 2 vehicles (41, making up 136.6%).
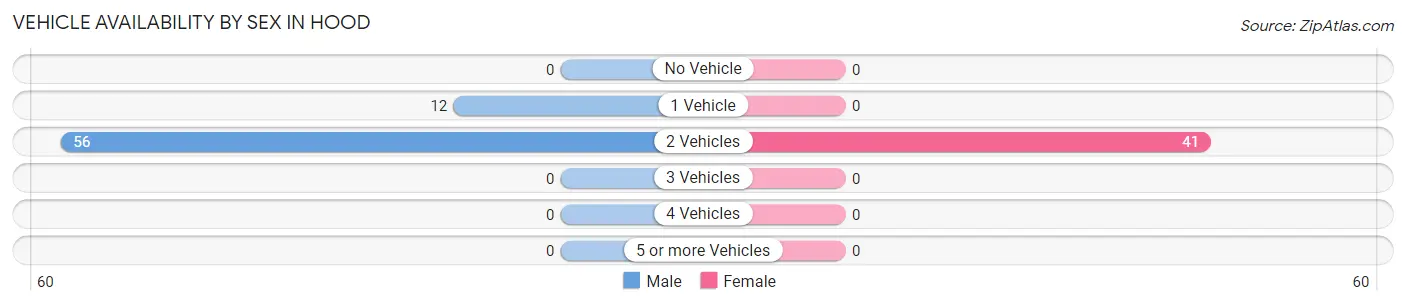
| Vehicles Available | Male | Female |
| No Vehicle | 0 (0.0%) | 0 (0.0%) |
| 1 Vehicle | 12 (17.6%) | 0 (0.0%) |
| 2 Vehicles | 56 (82.4%) | 41 (100.0%) |
| 3 Vehicles | 0 (0.0%) | 0 (0.0%) |
| 4 Vehicles | 0 (0.0%) | 0 (0.0%) |
| 5 or more Vehicles | 0 (0.0%) | 0 (0.0%) |
| Total | 68 (100.0%) | 41 (100.0%) |
Commute Time in Hood
The most frequently occuring commute durations in Hood are 20 to 24 minutes (51 commuters, 46.8%), less than 5 minutes (46 commuters, 42.2%), and 15 to 19 minutes (12 commuters, 11.0%).
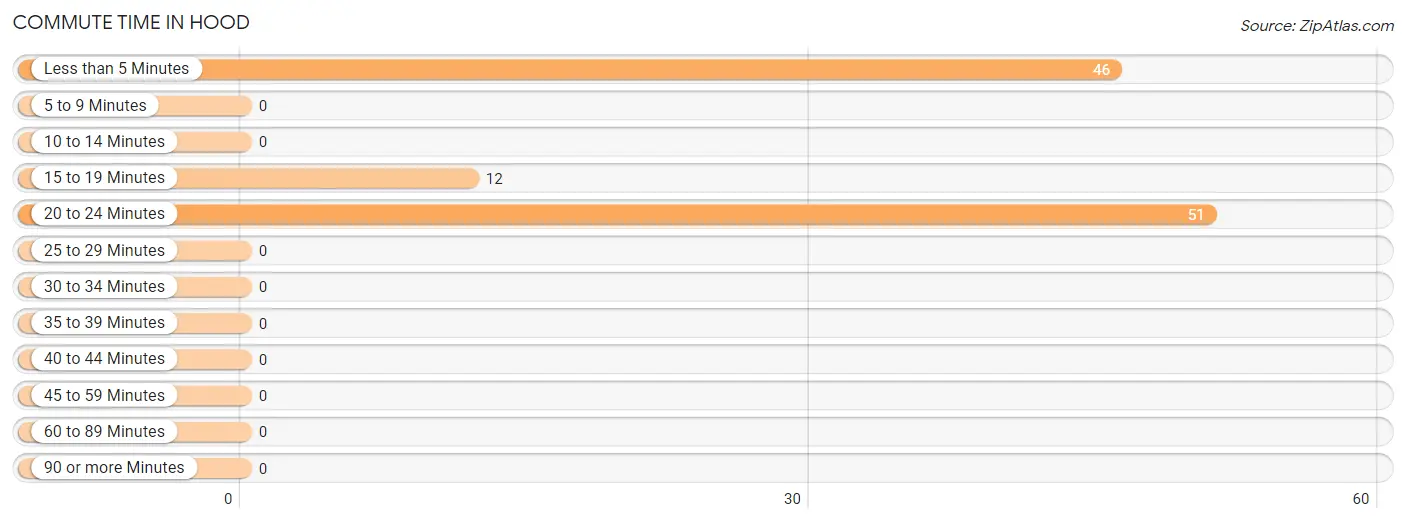
| Commute Time | # Commuters | % Commuters |
| Less than 5 Minutes | 46 | 42.2% |
| 5 to 9 Minutes | 0 | 0.0% |
| 10 to 14 Minutes | 0 | 0.0% |
| 15 to 19 Minutes | 12 | 11.0% |
| 20 to 24 Minutes | 51 | 46.8% |
| 25 to 29 Minutes | 0 | 0.0% |
| 30 to 34 Minutes | 0 | 0.0% |
| 35 to 39 Minutes | 0 | 0.0% |
| 40 to 44 Minutes | 0 | 0.0% |
| 45 to 59 Minutes | 0 | 0.0% |
| 60 to 89 Minutes | 0 | 0.0% |
| 90 or more Minutes | 0 | 0.0% |
Commute Time by Sex in Hood
The most common commute times in Hood are less than 5 minutes (30 commuters, 44.1%) for males and 20 to 24 minutes (25 commuters, 61.0%) for females.
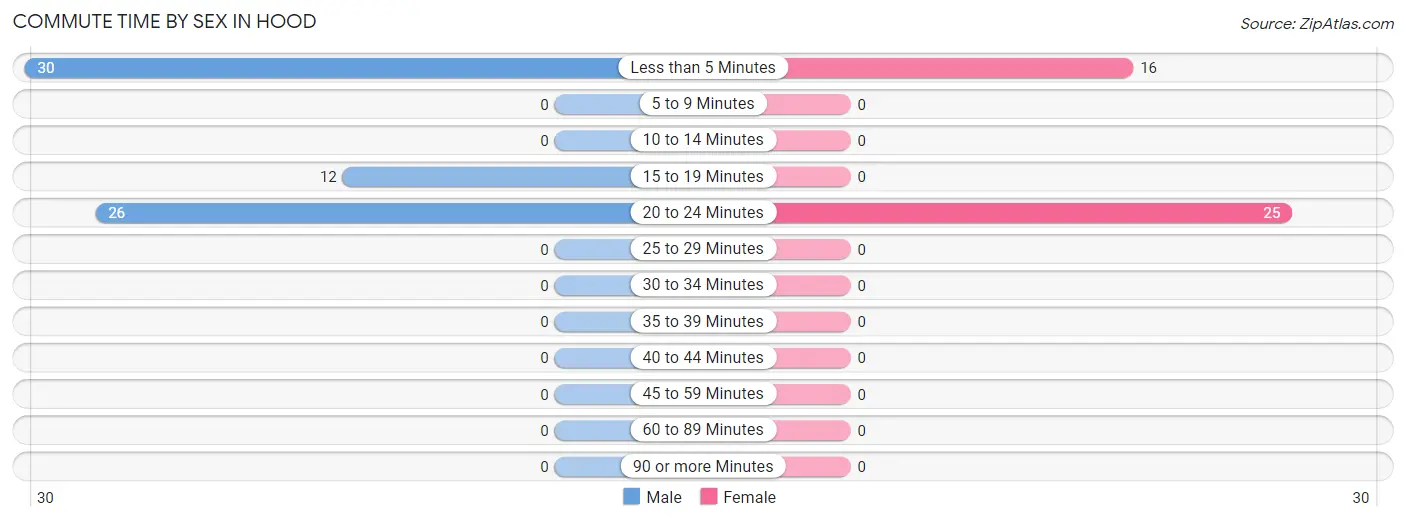
| Commute Time | Male | Female |
| Less than 5 Minutes | 30 (44.1%) | 16 (39.0%) |
| 5 to 9 Minutes | 0 (0.0%) | 0 (0.0%) |
| 10 to 14 Minutes | 0 (0.0%) | 0 (0.0%) |
| 15 to 19 Minutes | 12 (17.6%) | 0 (0.0%) |
| 20 to 24 Minutes | 26 (38.2%) | 25 (61.0%) |
| 25 to 29 Minutes | 0 (0.0%) | 0 (0.0%) |
| 30 to 34 Minutes | 0 (0.0%) | 0 (0.0%) |
| 35 to 39 Minutes | 0 (0.0%) | 0 (0.0%) |
| 40 to 44 Minutes | 0 (0.0%) | 0 (0.0%) |
| 45 to 59 Minutes | 0 (0.0%) | 0 (0.0%) |
| 60 to 89 Minutes | 0 (0.0%) | 0 (0.0%) |
| 90 or more Minutes | 0 (0.0%) | 0 (0.0%) |
Time of Departure to Work by Sex in Hood
The most frequent times of departure to work in Hood are 7:00 AM to 7:29 AM (42, 61.8%) for males and 8:00 AM to 8:29 AM (25, 61.0%) for females.
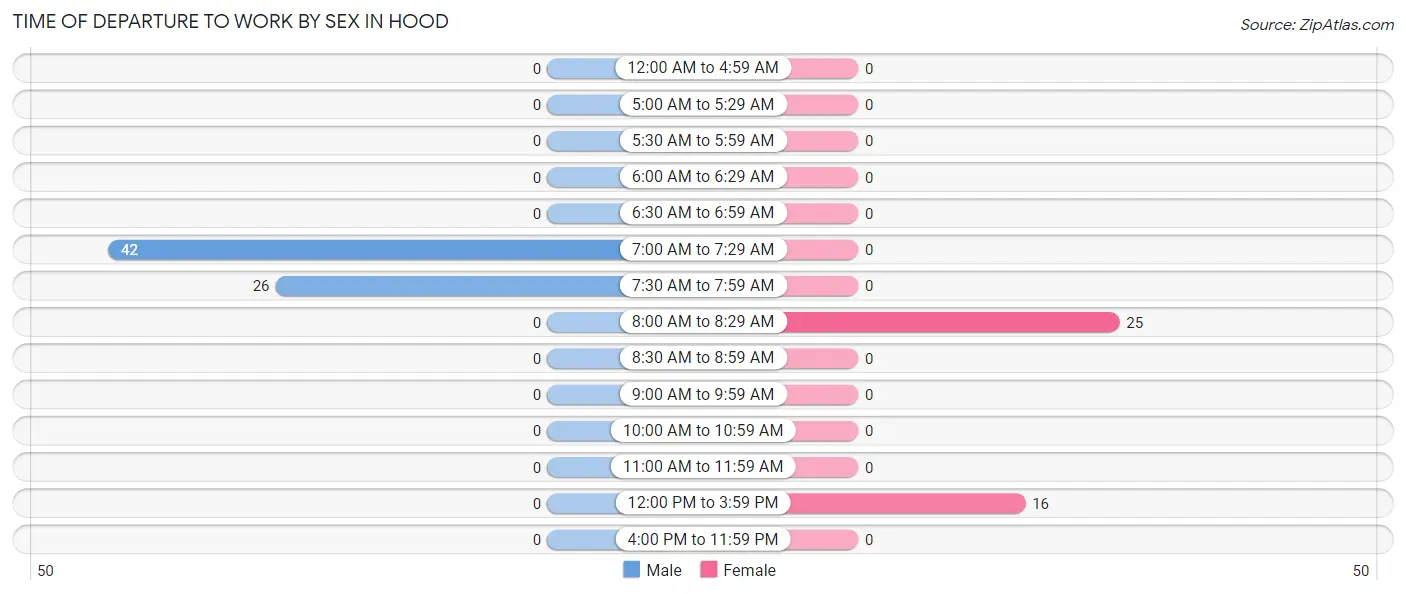
| Time of Departure | Male | Female |
| 12:00 AM to 4:59 AM | 0 (0.0%) | 0 (0.0%) |
| 5:00 AM to 5:29 AM | 0 (0.0%) | 0 (0.0%) |
| 5:30 AM to 5:59 AM | 0 (0.0%) | 0 (0.0%) |
| 6:00 AM to 6:29 AM | 0 (0.0%) | 0 (0.0%) |
| 6:30 AM to 6:59 AM | 0 (0.0%) | 0 (0.0%) |
| 7:00 AM to 7:29 AM | 42 (61.8%) | 0 (0.0%) |
| 7:30 AM to 7:59 AM | 26 (38.2%) | 0 (0.0%) |
| 8:00 AM to 8:29 AM | 0 (0.0%) | 25 (61.0%) |
| 8:30 AM to 8:59 AM | 0 (0.0%) | 0 (0.0%) |
| 9:00 AM to 9:59 AM | 0 (0.0%) | 0 (0.0%) |
| 10:00 AM to 10:59 AM | 0 (0.0%) | 0 (0.0%) |
| 11:00 AM to 11:59 AM | 0 (0.0%) | 0 (0.0%) |
| 12:00 PM to 3:59 PM | 0 (0.0%) | 16 (39.0%) |
| 4:00 PM to 11:59 PM | 0 (0.0%) | 0 (0.0%) |
| Total | 68 (100.0%) | 41 (100.0%) |
Housing Occupancy in Hood
Occupancy by Ownership in Hood
Of the total 109 dwellings in Hood, owner-occupied units account for 61 (56.0%), while renter-occupied units make up 48 (44.0%).
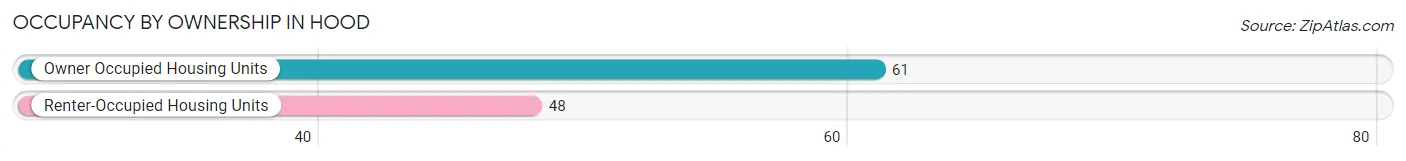
| Occupancy | # Housing Units | % Housing Units |
| Owner Occupied Housing Units | 61 | 56.0% |
| Renter-Occupied Housing Units | 48 | 44.0% |
| Total Occupied Housing Units | 109 | 100.0% |
Occupancy by Household Size in Hood
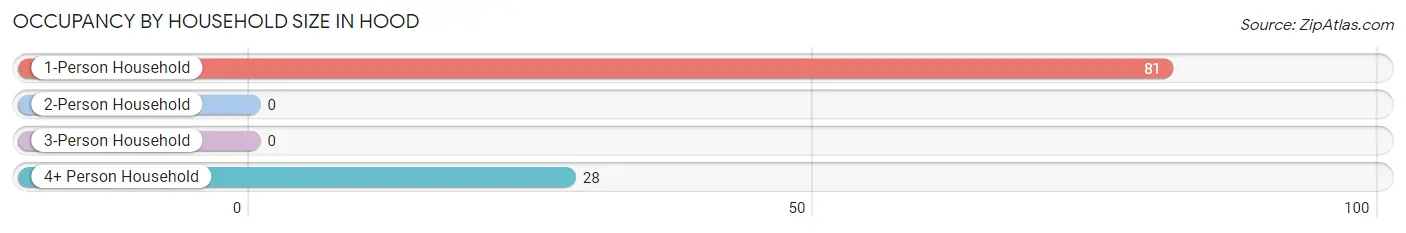
| Household Size | # Housing Units | % Housing Units |
| 1-Person Household | 81 | 74.3% |
| 2-Person Household | 0 | 0.0% |
| 3-Person Household | 0 | 0.0% |
| 4+ Person Household | 28 | 25.7% |
| Total Housing Units | 109 | 100.0% |
Occupancy by Ownership by Household Size in Hood
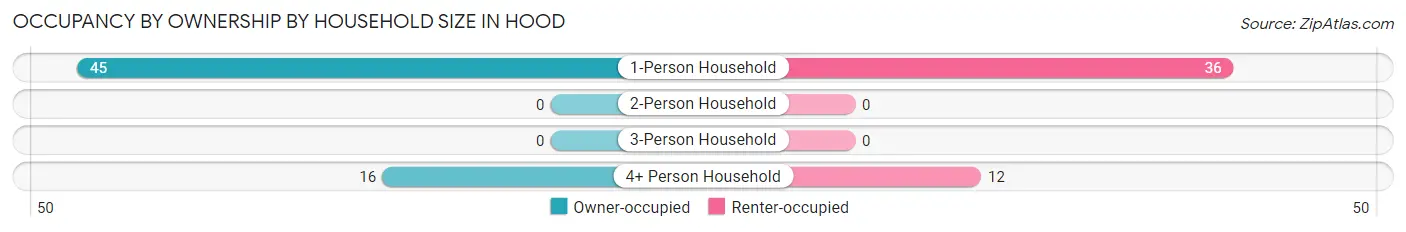
| Household Size | Owner-occupied | Renter-occupied |
| 1-Person Household | 45 (55.6%) | 36 (44.4%) |
| 2-Person Household | 0 (0.0%) | 0 (0.0%) |
| 3-Person Household | 0 (0.0%) | 0 (0.0%) |
| 4+ Person Household | 16 (57.1%) | 12 (42.9%) |
| Total Housing Units | 61 (56.0%) | 48 (44.0%) |
Occupancy by Educational Attainment in Hood
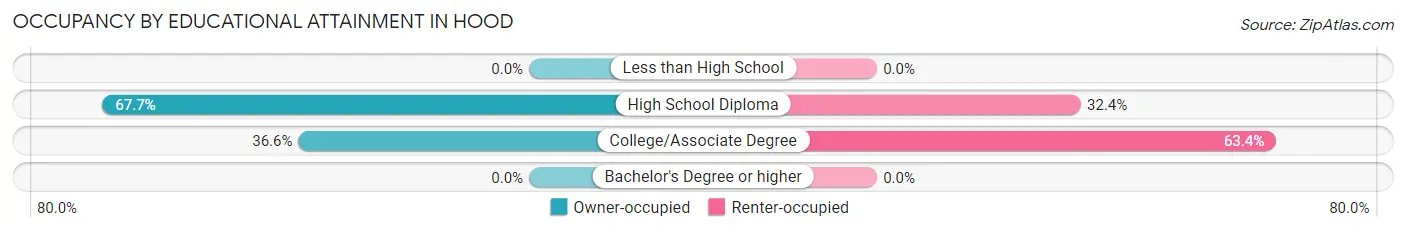
| Household Size | Owner-occupied | Renter-occupied |
| Less than High School | 0 (0.0%) | 0 (0.0%) |
| High School Diploma | 46 (67.6%) | 22 (32.4%) |
| College/Associate Degree | 15 (36.6%) | 26 (63.4%) |
| Bachelor's Degree or higher | 0 (0.0%) | 0 (0.0%) |
Occupancy by Age of Householder in Hood
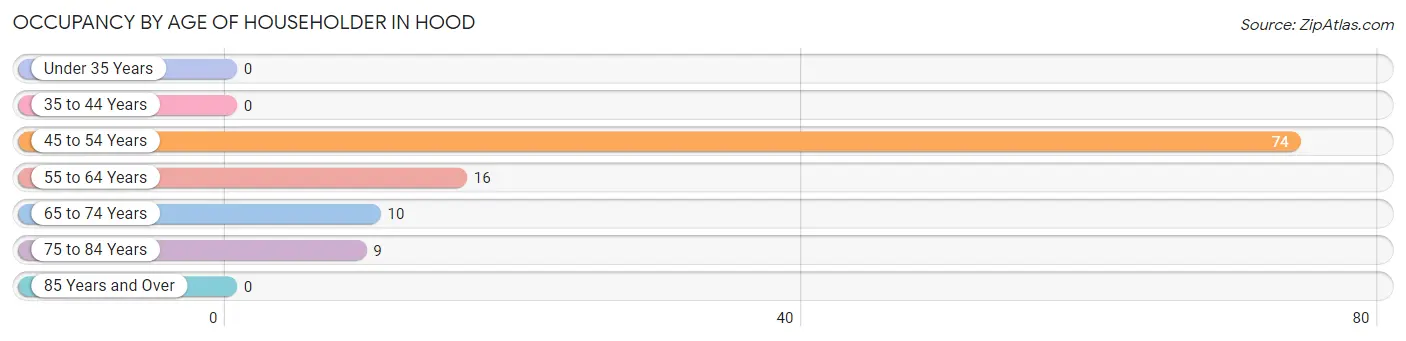
| Age Bracket | # Households | % Households |
| Under 35 Years | 0 | 0.0% |
| 35 to 44 Years | 0 | 0.0% |
| 45 to 54 Years | 74 | 67.9% |
| 55 to 64 Years | 16 | 14.7% |
| 65 to 74 Years | 10 | 9.2% |
| 75 to 84 Years | 9 | 8.3% |
| 85 Years and Over | 0 | 0.0% |
| Total | 109 | 100.0% |
Housing Finances in Hood
Median Income by Occupancy in Hood
| Occupancy Type | # Households | Median Income |
| Owner-Occupied | 61 (56.0%) | $0 |
| Renter-Occupied | 48 (44.0%) | $0 |
| Average | 109 (100.0%) | $0 |
Occupancy by Householder Income Bracket in Hood
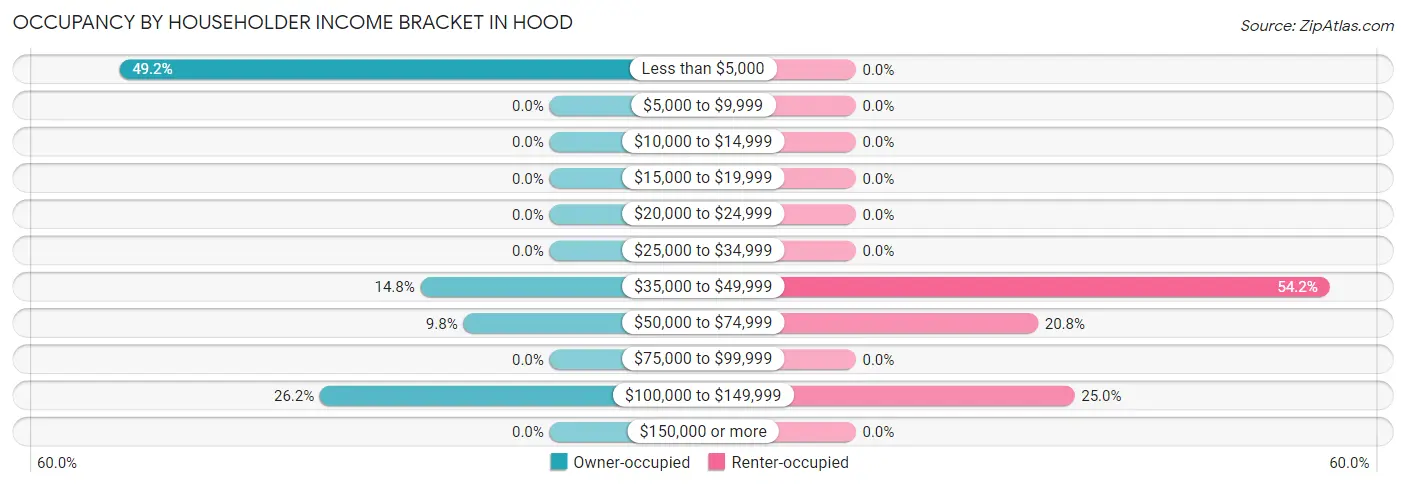
| Income Bracket | Owner-occupied | Renter-occupied |
| Less than $5,000 | 30 (49.2%) | 0 (0.0%) |
| $5,000 to $9,999 | 0 (0.0%) | 0 (0.0%) |
| $10,000 to $14,999 | 0 (0.0%) | 0 (0.0%) |
| $15,000 to $19,999 | 0 (0.0%) | 0 (0.0%) |
| $20,000 to $24,999 | 0 (0.0%) | 0 (0.0%) |
| $25,000 to $34,999 | 0 (0.0%) | 0 (0.0%) |
| $35,000 to $49,999 | 9 (14.7%) | 26 (54.2%) |
| $50,000 to $74,999 | 6 (9.8%) | 10 (20.8%) |
| $75,000 to $99,999 | 0 (0.0%) | 0 (0.0%) |
| $100,000 to $149,999 | 16 (26.2%) | 12 (25.0%) |
| $150,000 or more | 0 (0.0%) | 0 (0.0%) |
| Total | 61 (100.0%) | 48 (100.0%) |
Monthly Housing Cost Tiers in Hood
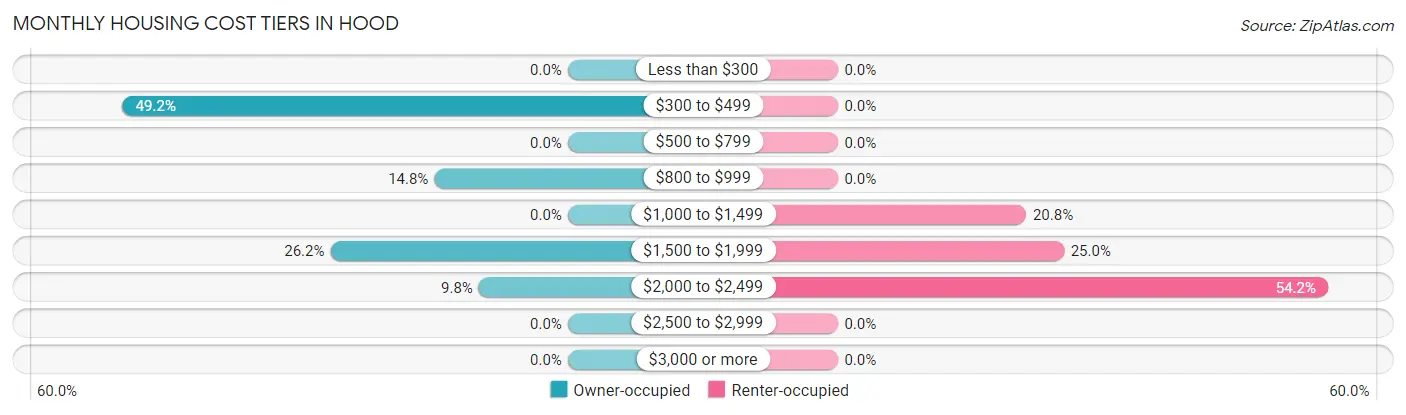
| Monthly Cost | Owner-occupied | Renter-occupied |
| Less than $300 | 0 (0.0%) | 0 (0.0%) |
| $300 to $499 | 30 (49.2%) | 0 (0.0%) |
| $500 to $799 | 0 (0.0%) | 0 (0.0%) |
| $800 to $999 | 9 (14.7%) | 0 (0.0%) |
| $1,000 to $1,499 | 0 (0.0%) | 10 (20.8%) |
| $1,500 to $1,999 | 16 (26.2%) | 12 (25.0%) |
| $2,000 to $2,499 | 6 (9.8%) | 26 (54.2%) |
| $2,500 to $2,999 | 0 (0.0%) | 0 (0.0%) |
| $3,000 or more | 0 (0.0%) | 0 (0.0%) |
| Total | 61 (100.0%) | 48 (100.0%) |
Physical Housing Characteristics in Hood
Housing Structures in Hood
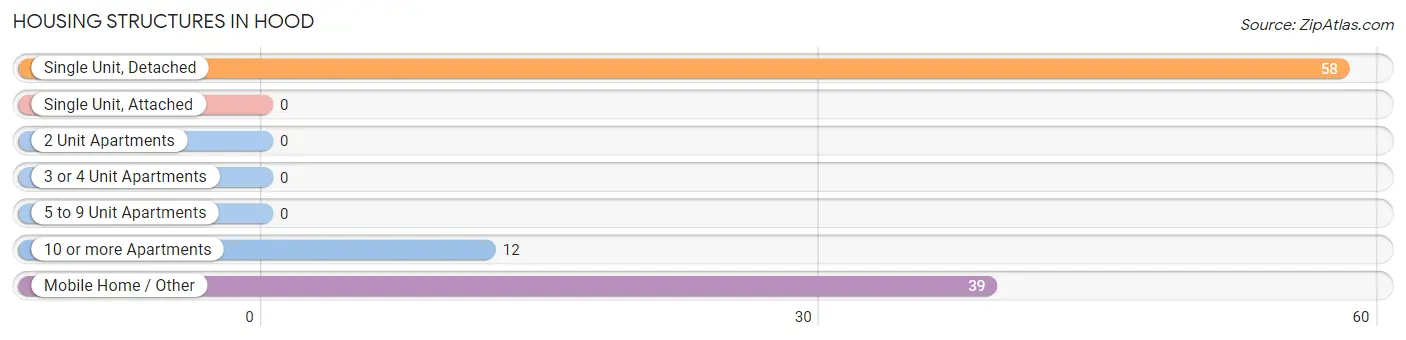
| Structure Type | # Housing Units | % Housing Units |
| Single Unit, Detached | 58 | 53.2% |
| Single Unit, Attached | 0 | 0.0% |
| 2 Unit Apartments | 0 | 0.0% |
| 3 or 4 Unit Apartments | 0 | 0.0% |
| 5 to 9 Unit Apartments | 0 | 0.0% |
| 10 or more Apartments | 12 | 11.0% |
| Mobile Home / Other | 39 | 35.8% |
| Total | 109 | 100.0% |
Housing Structures by Occupancy in Hood
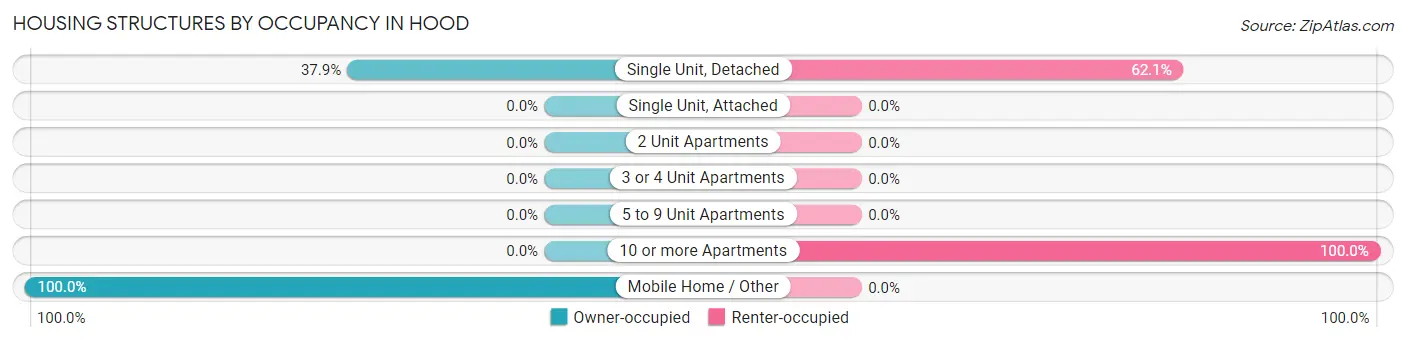
| Structure Type | Owner-occupied | Renter-occupied |
| Single Unit, Detached | 22 (37.9%) | 36 (62.1%) |
| Single Unit, Attached | 0 (0.0%) | 0 (0.0%) |
| 2 Unit Apartments | 0 (0.0%) | 0 (0.0%) |
| 3 or 4 Unit Apartments | 0 (0.0%) | 0 (0.0%) |
| 5 to 9 Unit Apartments | 0 (0.0%) | 0 (0.0%) |
| 10 or more Apartments | 0 (0.0%) | 12 (100.0%) |
| Mobile Home / Other | 39 (100.0%) | 0 (0.0%) |
| Total | 61 (56.0%) | 48 (44.0%) |
Housing Structures by Number of Rooms in Hood
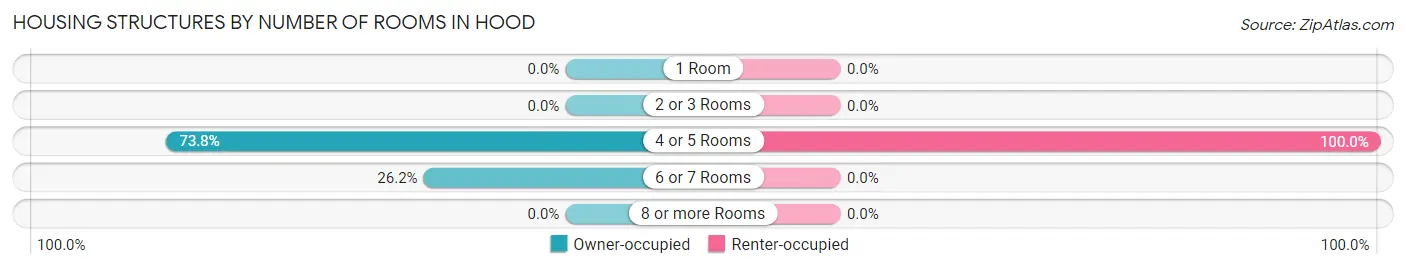
| Number of Rooms | Owner-occupied | Renter-occupied |
| 1 Room | 0 (0.0%) | 0 (0.0%) |
| 2 or 3 Rooms | 0 (0.0%) | 0 (0.0%) |
| 4 or 5 Rooms | 45 (73.8%) | 48 (100.0%) |
| 6 or 7 Rooms | 16 (26.2%) | 0 (0.0%) |
| 8 or more Rooms | 0 (0.0%) | 0 (0.0%) |
| Total | 61 (100.0%) | 48 (100.0%) |
Housing Structure by Heating Type in Hood
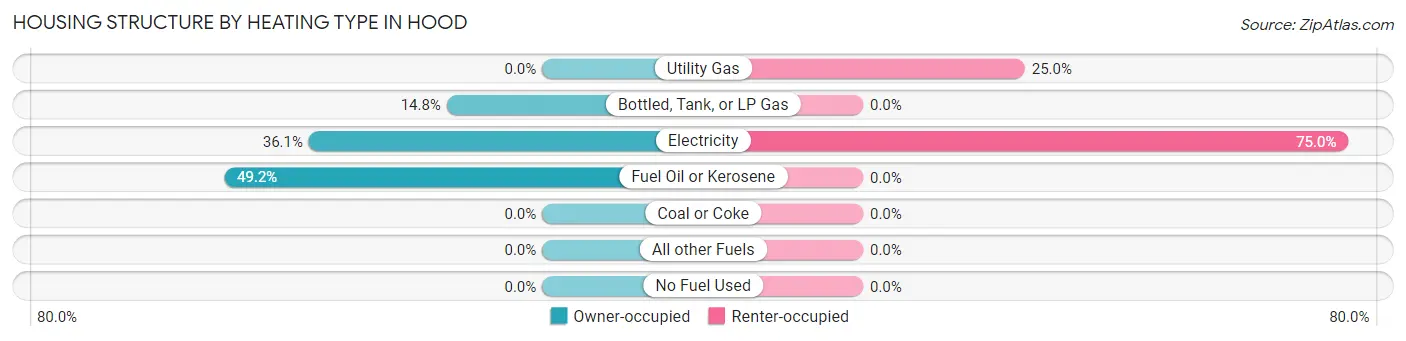
| Heating Type | Owner-occupied | Renter-occupied |
| Utility Gas | 0 (0.0%) | 12 (25.0%) |
| Bottled, Tank, or LP Gas | 9 (14.7%) | 0 (0.0%) |
| Electricity | 22 (36.1%) | 36 (75.0%) |
| Fuel Oil or Kerosene | 30 (49.2%) | 0 (0.0%) |
| Coal or Coke | 0 (0.0%) | 0 (0.0%) |
| All other Fuels | 0 (0.0%) | 0 (0.0%) |
| No Fuel Used | 0 (0.0%) | 0 (0.0%) |
| Total | 61 (100.0%) | 48 (100.0%) |
Household Vehicle Usage in Hood
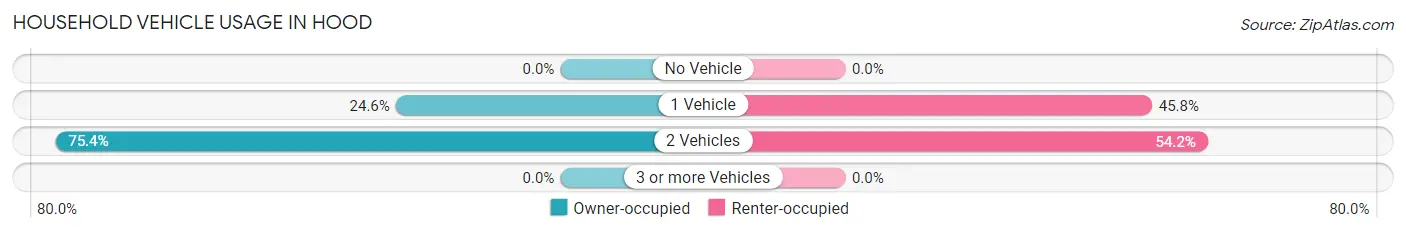
| Vehicles per Household | Owner-occupied | Renter-occupied |
| No Vehicle | 0 (0.0%) | 0 (0.0%) |
| 1 Vehicle | 15 (24.6%) | 22 (45.8%) |
| 2 Vehicles | 46 (75.4%) | 26 (54.2%) |
| 3 or more Vehicles | 0 (0.0%) | 0 (0.0%) |
| Total | 61 (100.0%) | 48 (100.0%) |
Real Estate & Mortgages in Hood
Real Estate and Mortgage Overview in Hood
| Characteristic | Without Mortgage | With Mortgage |
| Housing Units | 55 | 6 |
| Median Property Value | - | - |
| Median Household Income | - | - |
| Monthly Housing Costs | - | - |
| Real Estate Taxes | - | - |
Property Value by Mortgage Status in Hood
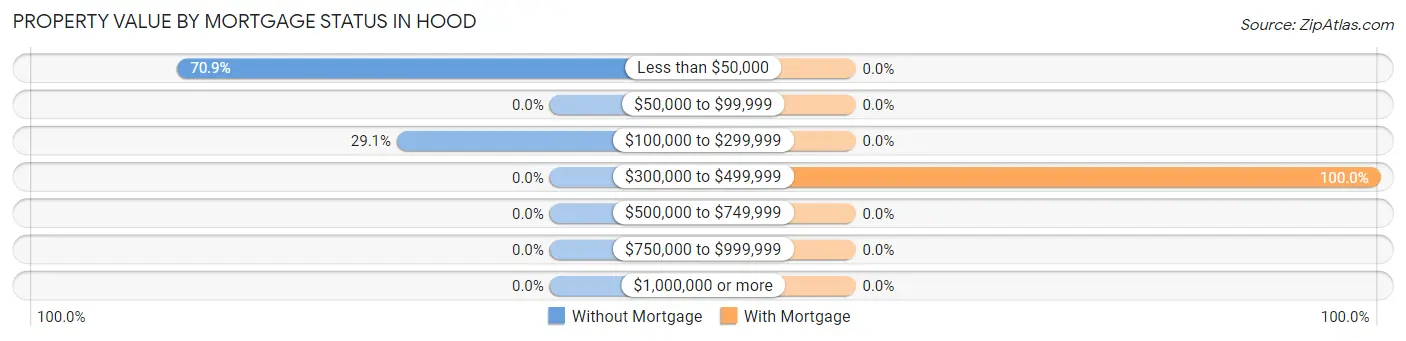
| Property Value | Without Mortgage | With Mortgage |
| Less than $50,000 | 39 (70.9%) | 0 (0.0%) |
| $50,000 to $99,999 | 0 (0.0%) | 0 (0.0%) |
| $100,000 to $299,999 | 16 (29.1%) | 0 (0.0%) |
| $300,000 to $499,999 | 0 (0.0%) | 6 (100.0%) |
| $500,000 to $749,999 | 0 (0.0%) | 0 (0.0%) |
| $750,000 to $999,999 | 0 (0.0%) | 0 (0.0%) |
| $1,000,000 or more | 0 (0.0%) | 0 (0.0%) |
| Total | 55 (100.0%) | 6 (100.0%) |
Household Income by Mortgage Status in Hood
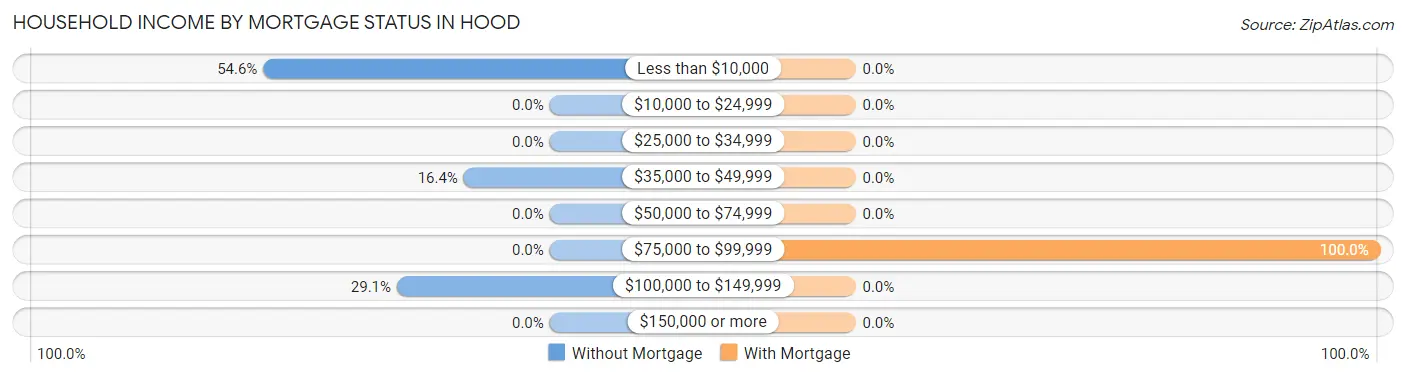
| Household Income | Without Mortgage | With Mortgage |
| Less than $10,000 | 30 (54.5%) | 0 (0.0%) |
| $10,000 to $24,999 | 0 (0.0%) | 0 (0.0%) |
| $25,000 to $34,999 | 0 (0.0%) | 0 (0.0%) |
| $35,000 to $49,999 | 9 (16.4%) | 0 (0.0%) |
| $50,000 to $74,999 | 0 (0.0%) | 0 (0.0%) |
| $75,000 to $99,999 | 0 (0.0%) | 6 (100.0%) |
| $100,000 to $149,999 | 16 (29.1%) | 0 (0.0%) |
| $150,000 or more | 0 (0.0%) | 0 (0.0%) |
| Total | 55 (100.0%) | 6 (100.0%) |
Property Value to Household Income Ratio in Hood
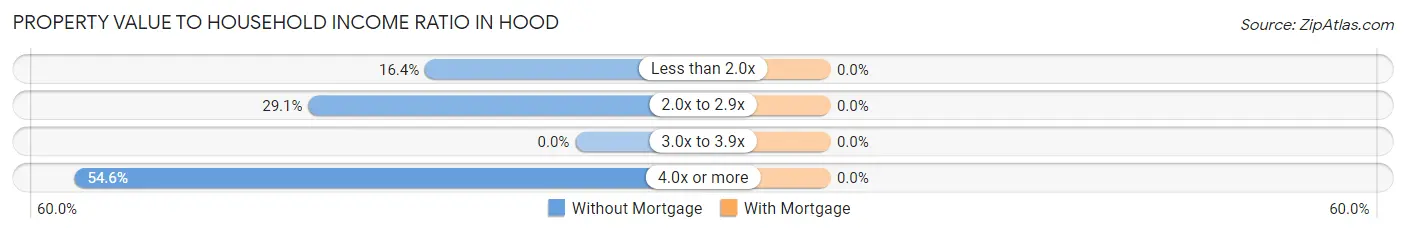
| Value-to-Income Ratio | Without Mortgage | With Mortgage |
| Less than 2.0x | 9 (16.4%) | 0 (0.0%) |
| 2.0x to 2.9x | 16 (29.1%) | 0 (0.0%) |
| 3.0x to 3.9x | 0 (0.0%) | 0 (0.0%) |
| 4.0x or more | 30 (54.5%) | 0 (0.0%) |
| Total | 55 (100.0%) | 6 (100.0%) |
Real Estate Taxes by Mortgage Status in Hood
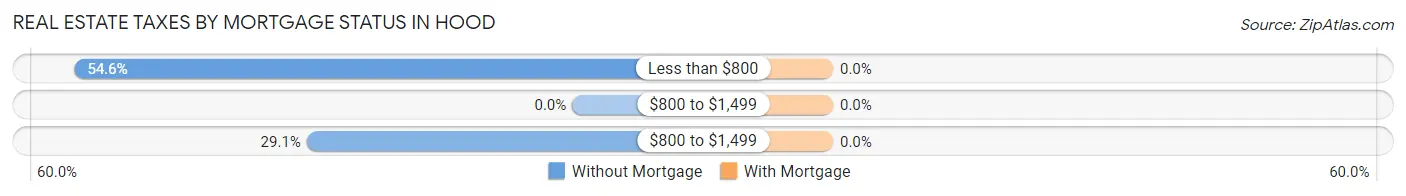
| Property Taxes | Without Mortgage | With Mortgage |
| Less than $800 | 30 (54.5%) | 0 (0.0%) |
| $800 to $1,499 | 0 (0.0%) | 0 (0.0%) |
| $800 to $1,499 | 16 (29.1%) | 0 (0.0%) |
| Total | 55 (100.0%) | 6 (100.0%) |
Health & Disability in Hood
Health Insurance Coverage by Age in Hood
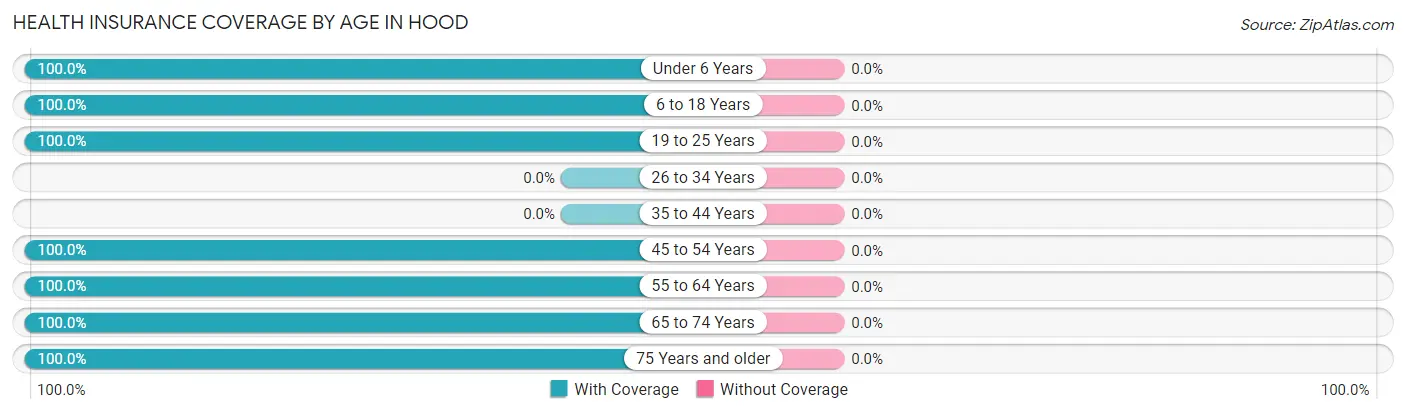
| Age Bracket | With Coverage | Without Coverage |
| Under 6 Years | 46 (100.0%) | 0 (0.0%) |
| 6 to 18 Years | 40 (100.0%) | 0 (0.0%) |
| 19 to 25 Years | 61 (100.0%) | 0 (0.0%) |
| 26 to 34 Years | 0 (0.0%) | 0 (0.0%) |
| 35 to 44 Years | 0 (0.0%) | 0 (0.0%) |
| 45 to 54 Years | 132 (100.0%) | 0 (0.0%) |
| 55 to 64 Years | 16 (100.0%) | 0 (0.0%) |
| 65 to 74 Years | 10 (100.0%) | 0 (0.0%) |
| 75 Years and older | 9 (100.0%) | 0 (0.0%) |
| Total | 314 (100.0%) | 0 (0.0%) |
Health Insurance Coverage by Citizenship Status in Hood
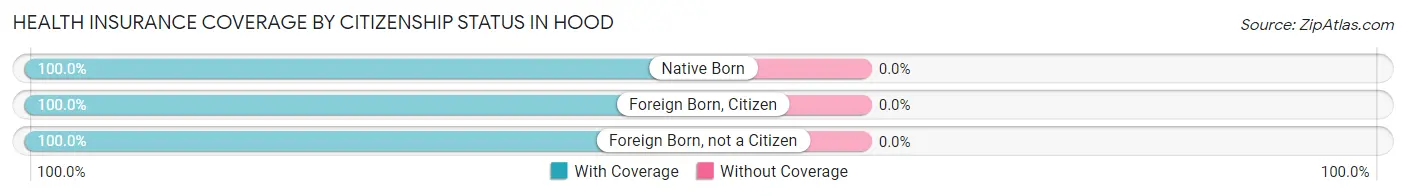
| Citizenship Status | With Coverage | Without Coverage |
| Native Born | 46 (100.0%) | 0 (0.0%) |
| Foreign Born, Citizen | 40 (100.0%) | 0 (0.0%) |
| Foreign Born, not a Citizen | 61 (100.0%) | 0 (0.0%) |
Health Insurance Coverage by Household Income in Hood
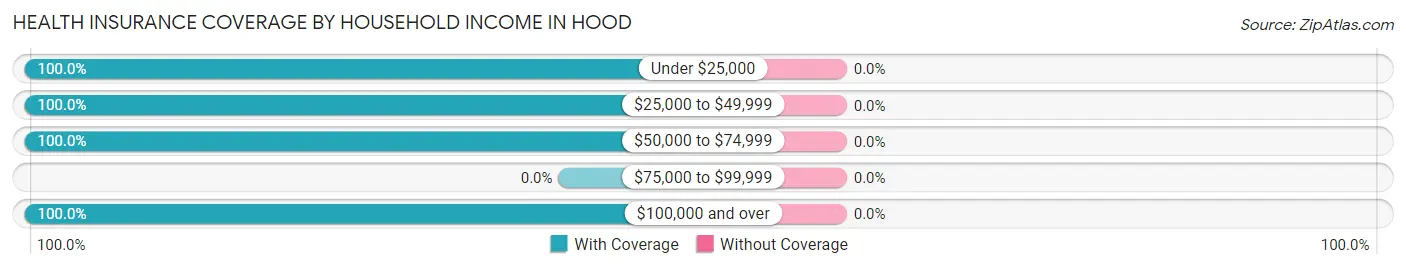
| Household Income | With Coverage | Without Coverage |
| Under $25,000 | 30 (100.0%) | 0 (0.0%) |
| $25,000 to $49,999 | 35 (100.0%) | 0 (0.0%) |
| $50,000 to $74,999 | 16 (100.0%) | 0 (0.0%) |
| $75,000 to $99,999 | 0 (0.0%) | 0 (0.0%) |
| $100,000 and over | 233 (100.0%) | 0 (0.0%) |
Public vs Private Health Insurance Coverage by Age in Hood
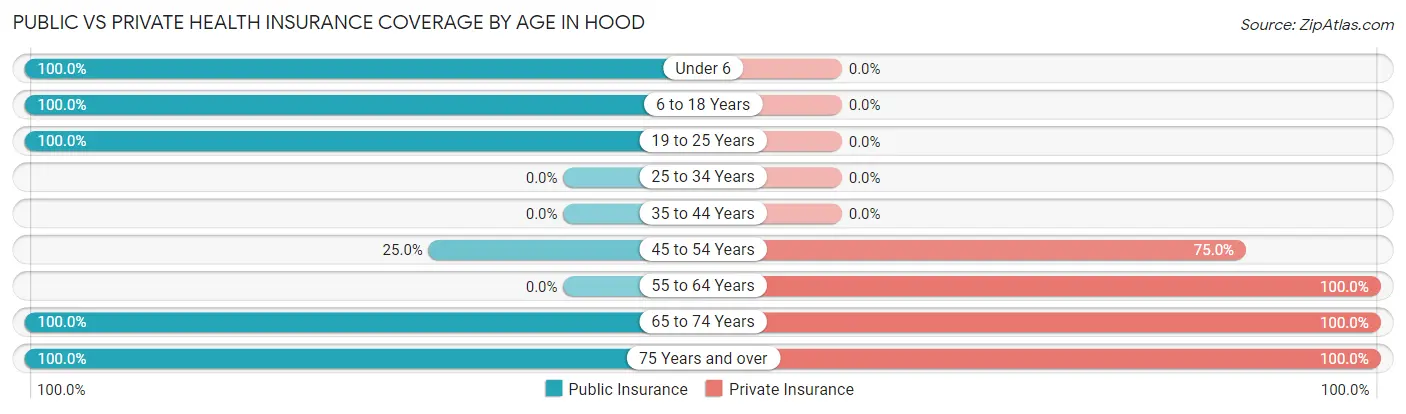
| Age Bracket | Public Insurance | Private Insurance |
| Under 6 | 46 (100.0%) | 0 (0.0%) |
| 6 to 18 Years | 40 (100.0%) | 0 (0.0%) |
| 19 to 25 Years | 61 (100.0%) | 0 (0.0%) |
| 25 to 34 Years | 0 (0.0%) | 0 (0.0%) |
| 35 to 44 Years | 0 (0.0%) | 0 (0.0%) |
| 45 to 54 Years | 33 (25.0%) | 99 (75.0%) |
| 55 to 64 Years | 0 (0.0%) | 16 (100.0%) |
| 65 to 74 Years | 10 (100.0%) | 10 (100.0%) |
| 75 Years and over | 9 (100.0%) | 9 (100.0%) |
| Total | 199 (63.4%) | 134 (42.7%) |
Disability Status by Sex by Age in Hood
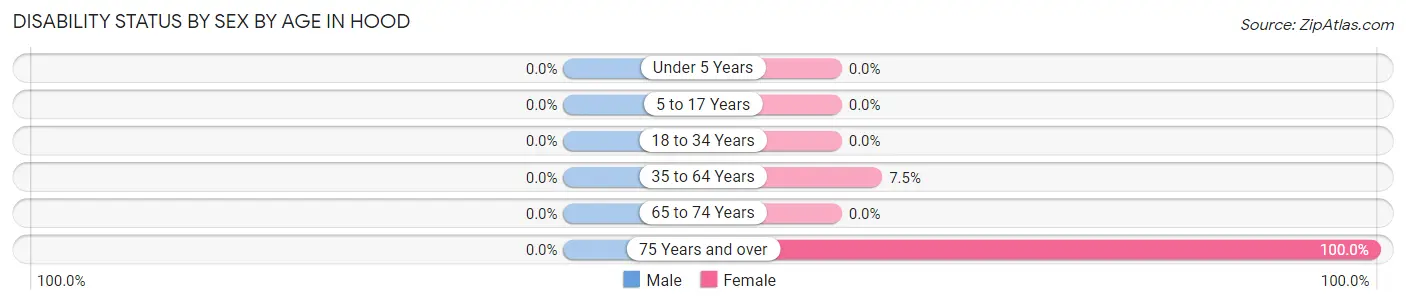
| Age Bracket | Male | Female |
| Under 5 Years | 0 (0.0%) | 0 (0.0%) |
| 5 to 17 Years | 0 (0.0%) | 0 (0.0%) |
| 18 to 34 Years | 0 (0.0%) | 0 (0.0%) |
| 35 to 64 Years | 0 (0.0%) | 6 (7.5%) |
| 65 to 74 Years | 0 (0.0%) | 0 (0.0%) |
| 75 Years and over | 0 (0.0%) | 9 (100.0%) |
Disability Class by Sex by Age in Hood
Disability Class: Hearing Difficulty
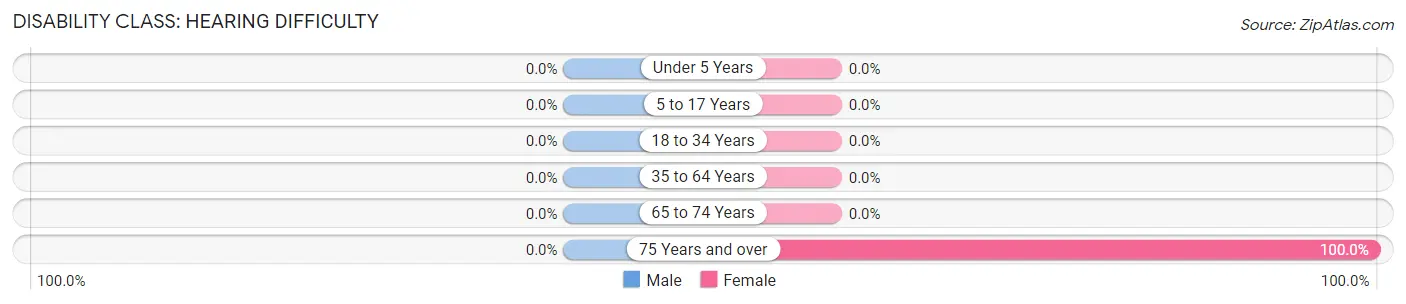
| Age Bracket | Male | Female |
| Under 5 Years | 0 (0.0%) | 0 (0.0%) |
| 5 to 17 Years | 0 (0.0%) | 0 (0.0%) |
| 18 to 34 Years | 0 (0.0%) | 0 (0.0%) |
| 35 to 64 Years | 0 (0.0%) | 0 (0.0%) |
| 65 to 74 Years | 0 (0.0%) | 0 (0.0%) |
| 75 Years and over | 0 (0.0%) | 9 (100.0%) |
Disability Class: Vision Difficulty
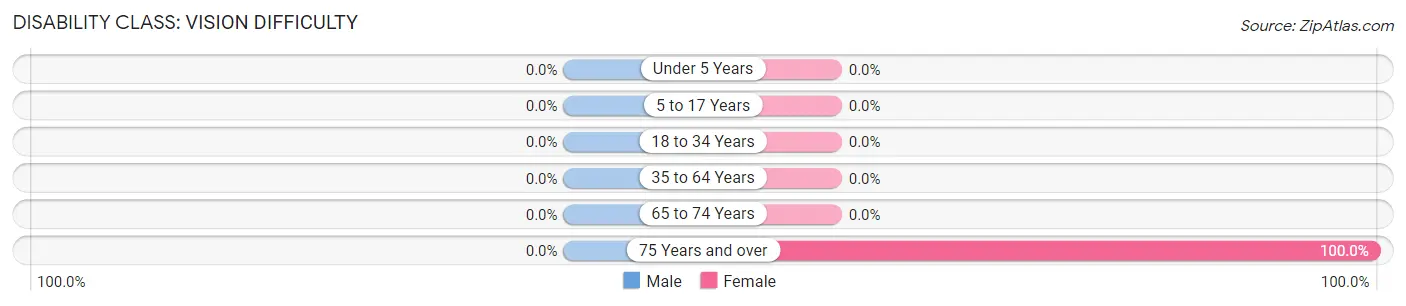
| Age Bracket | Male | Female |
| Under 5 Years | 0 (0.0%) | 0 (0.0%) |
| 5 to 17 Years | 0 (0.0%) | 0 (0.0%) |
| 18 to 34 Years | 0 (0.0%) | 0 (0.0%) |
| 35 to 64 Years | 0 (0.0%) | 0 (0.0%) |
| 65 to 74 Years | 0 (0.0%) | 0 (0.0%) |
| 75 Years and over | 0 (0.0%) | 9 (100.0%) |
Disability Class: Cognitive Difficulty
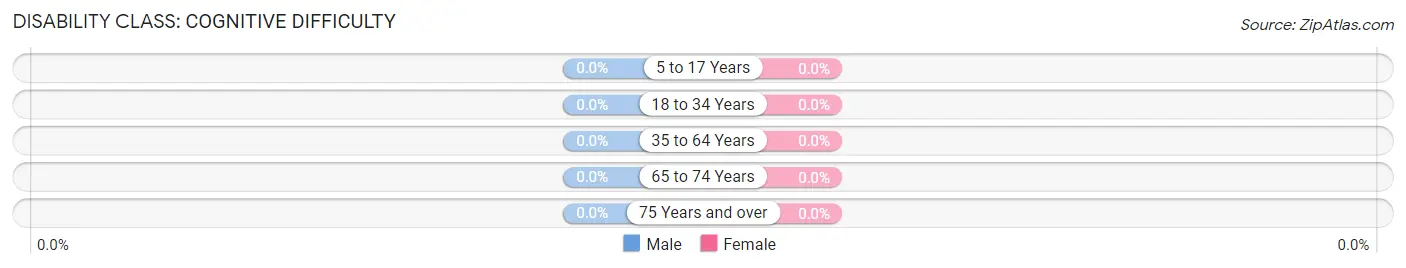
| Age Bracket | Male | Female |
| 5 to 17 Years | 0 (0.0%) | 0 (0.0%) |
| 18 to 34 Years | 0 (0.0%) | 0 (0.0%) |
| 35 to 64 Years | 0 (0.0%) | 0 (0.0%) |
| 65 to 74 Years | 0 (0.0%) | 0 (0.0%) |
| 75 Years and over | 0 (0.0%) | 0 (0.0%) |
Disability Class: Ambulatory Difficulty
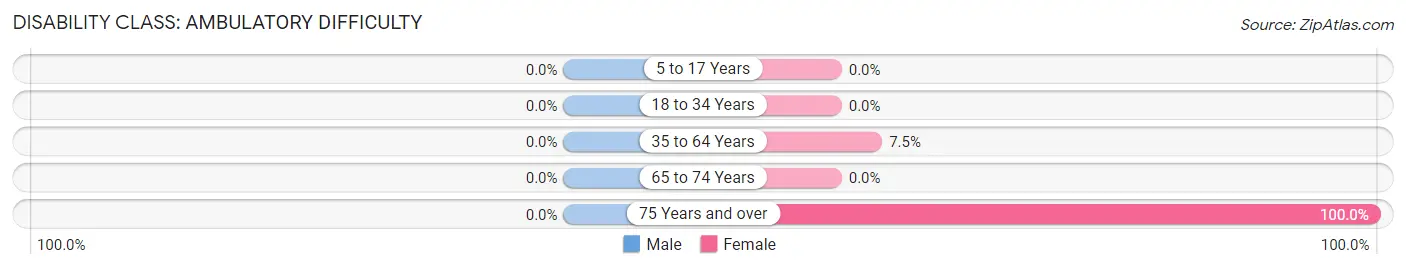
| Age Bracket | Male | Female |
| 5 to 17 Years | 0 (0.0%) | 0 (0.0%) |
| 18 to 34 Years | 0 (0.0%) | 0 (0.0%) |
| 35 to 64 Years | 0 (0.0%) | 6 (7.5%) |
| 65 to 74 Years | 0 (0.0%) | 0 (0.0%) |
| 75 Years and over | 0 (0.0%) | 9 (100.0%) |
Disability Class: Self-Care Difficulty
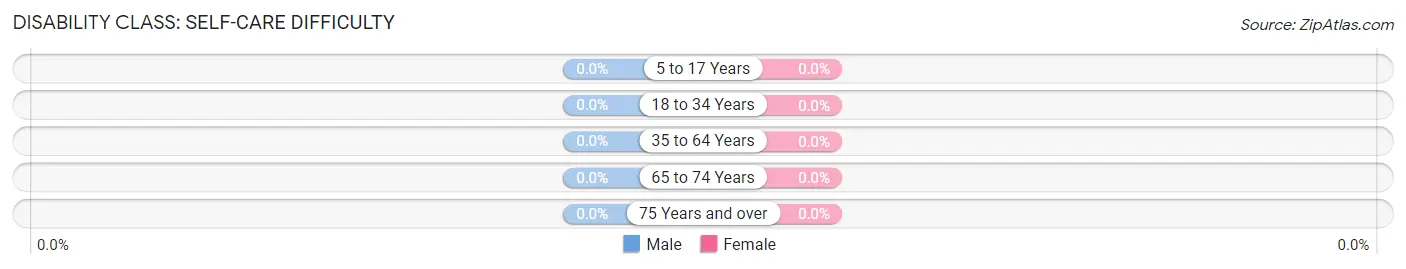
| Age Bracket | Male | Female |
| 5 to 17 Years | 0 (0.0%) | 0 (0.0%) |
| 18 to 34 Years | 0 (0.0%) | 0 (0.0%) |
| 35 to 64 Years | 0 (0.0%) | 0 (0.0%) |
| 65 to 74 Years | 0 (0.0%) | 0 (0.0%) |
| 75 Years and over | 0 (0.0%) | 0 (0.0%) |
Technology Access in Hood
Computing Device Access in Hood
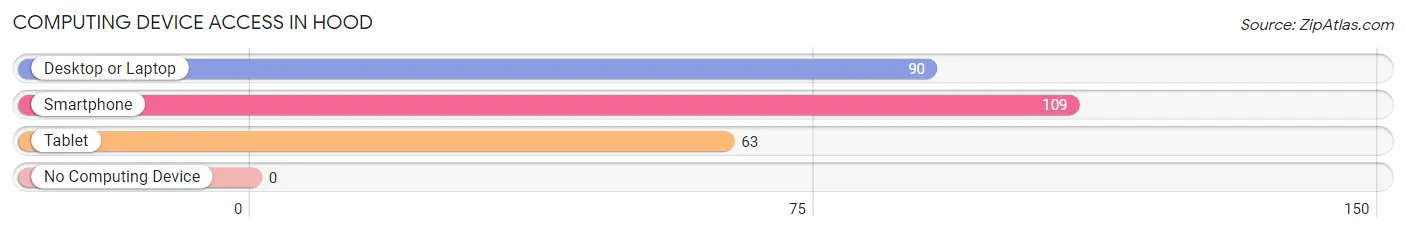
| Device Type | # Households | % Households |
| Desktop or Laptop | 90 | 82.6% |
| Smartphone | 109 | 100.0% |
| Tablet | 63 | 57.8% |
| No Computing Device | 0 | 0.0% |
| Total | 109 | 100.0% |
Internet Access in Hood
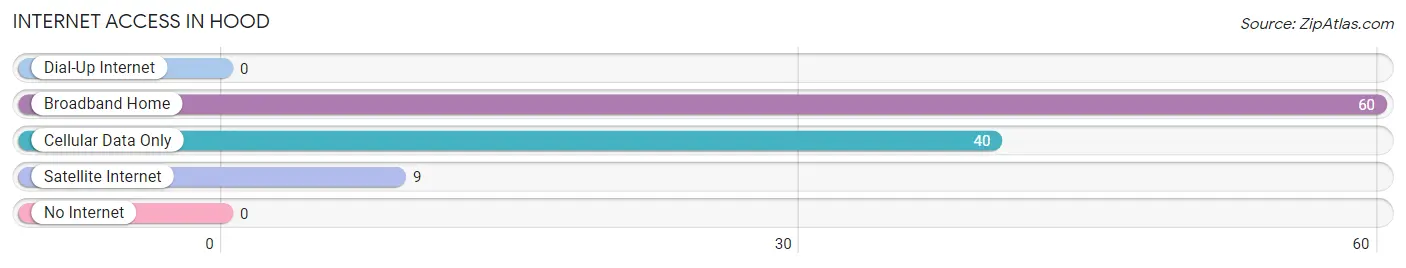
| Internet Type | # Households | % Households |
| Dial-Up Internet | 0 | 0.0% |
| Broadband Home | 60 | 55.0% |
| Cellular Data Only | 40 | 36.7% |
| Satellite Internet | 9 | 8.3% |
| No Internet | 0 | 0.0% |
| Total | 109 | 100.0% |
Hood Summary
Hood, California is a small unincorporated community located in the Sierra Nevada foothills of El Dorado County, California. It is situated at an elevation of 2,845 feet (867 m) and is located approximately 25 miles (40 km) east of Placerville and 40 miles (64 km) northeast of Sacramento. The population of Hood is estimated to be around 1,000 people.
Geography
Hood is located in the Sierra Nevada foothills of El Dorado County, California. It is situated at an elevation of 2,845 feet (867 m) and is located approximately 25 miles (40 km) east of Placerville and 40 miles (64 km) northeast of Sacramento. The community is surrounded by rolling hills and is situated in a valley between the North and Middle Forks of the Cosumnes River. The area is known for its oak woodlands, grasslands, and chaparral.
History
Hood was originally inhabited by the Miwok and Maidu Native American tribes. The first European settlers arrived in the area in the mid-1800s and the town was officially founded in 1854. The town was named after the Hood family, who were among the first settlers in the area.
The town was initially a mining community, with gold being the primary mineral mined. The town also had a lumber mill and a brickyard. In the early 1900s, the town began to transition to an agricultural community, with the primary crops being apples, pears, and walnuts.
Economy
Hood’s economy is primarily based on agriculture and tourism. The town is home to several wineries, as well as a number of apple orchards and other fruit farms. The town also has a number of small businesses, including restaurants, shops, and galleries.
Demographics
As of the 2010 census, the population of Hood was estimated to be 1,000 people. The racial makeup of the town was 94.2% White, 0.7% African American, 0.7% Native American, 0.7% Asian, 0.7% Pacific Islander, and 2.7% from other races. The median household income was $50,000 and the median family income was $54,000.
Conclusion
Hood, California is a small unincorporated community located in the Sierra Nevada foothills of El Dorado County, California. It is situated at an elevation of 2,845 feet (867 m) and is located approximately 25 miles (40 km) east of Placerville and 40 miles (64 km) northeast of Sacramento. The population of Hood is estimated to be around 1,000 people. The town’s economy is primarily based on agriculture and tourism, with the primary crops being apples, pears, and walnuts. The racial makeup of the town is 94.2% White, 0.7% African American, 0.7% Native American, 0.7% Asian, 0.7% Pacific Islander, and 2.7% from other races. The median household income was $50,000 and the median family income was $54,000.
Common Questions
What is Per Capita Income in Hood?
Per Capita income in Hood is $19,061.
What is Inequality or Gini Index in Hood?
Inequality or Gini Index in Hood is 0.44.
What is the Total Population of Hood?
Total Population of Hood is 314.
What is the Total Male Population of Hood?
Total Male Population of Hood is 127.
What is the Total Female Population of Hood?
Total Female Population of Hood is 187.
What is the Ratio of Males per 100 Females in Hood?
There are 67.91 Males per 100 Females in Hood.
What is the Ratio of Females per 100 Males in Hood?
There are 147.24 Females per 100 Males in Hood.
What is the Median Population Age in Hood?
Median Population Age in Hood is 45.2 Years.
What is the Average Family Size in Hood
Average Family Size in Hood is 7.7 People.
What is the Average Household Size in Hood
Average Household Size in Hood is 2.9 People.
How Large is the Labor Force in Hood?
There are 148 People in the Labor Forcein in Hood.
What is the Percentage of People in the Labor Force in Hood?
55.2% of People are in the Labor Force in Hood.
What is the Unemployment Rate in Hood?
Unemployment Rate in Hood is 11.5%.