Cities with the Highest Unemployment Rate Amomg Youth Under the Age of 25 in Florida
RELATED REPORTS & OPTIONS
Highest Unemployment | Youth < 25
Florida
Compare Cities
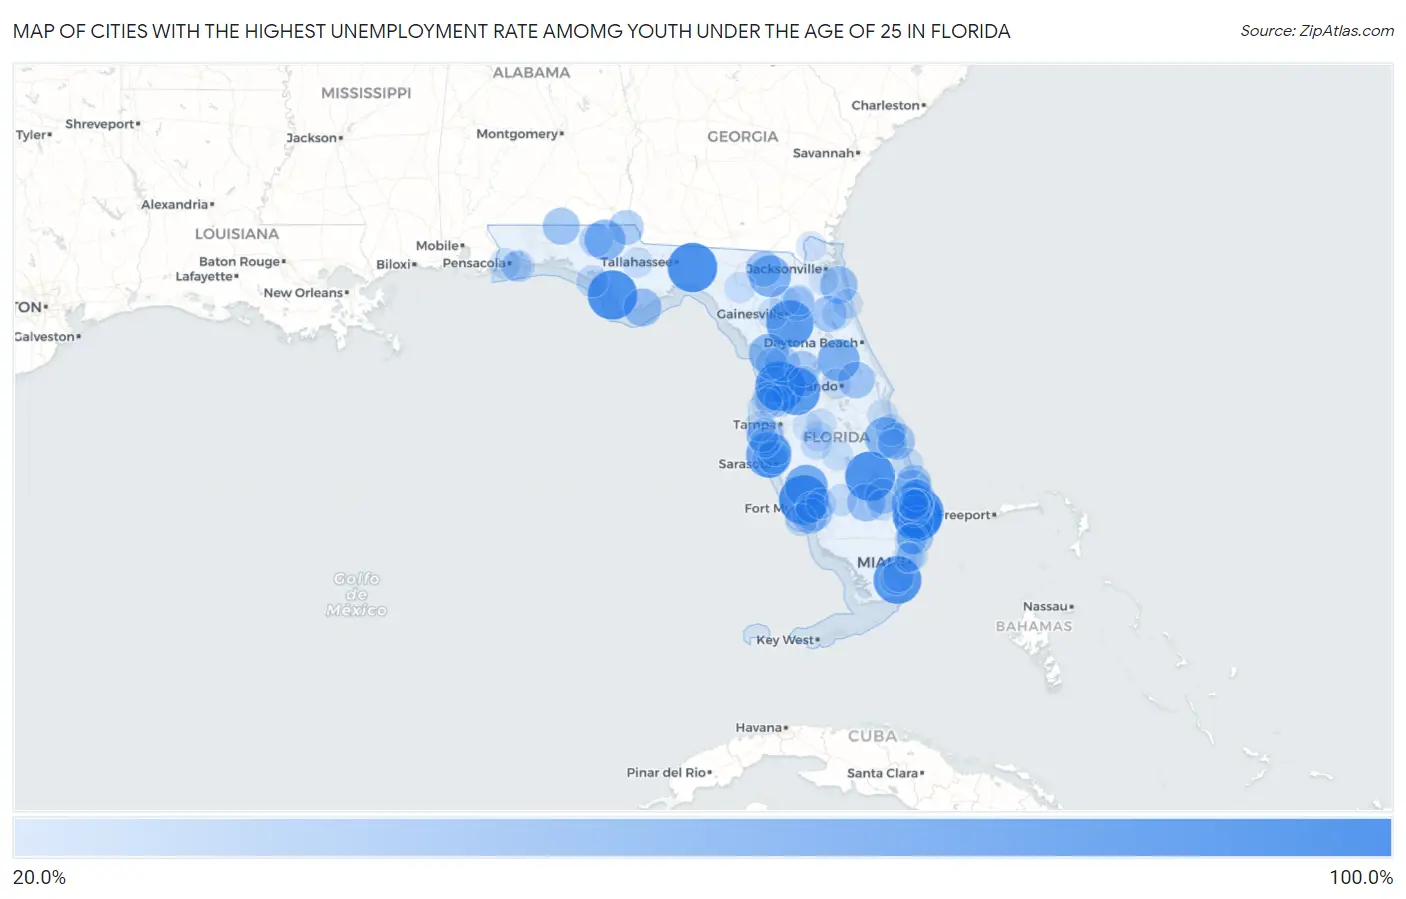
Map of Cities with the Highest Unemployment Rate Amomg Youth Under the Age of 25 in Florida
0.0%
100.0%
Cities with the Highest Unemployment Rate Amomg Youth Under the Age of 25 in Florida
| City | Youth Unemployment | vs State | vs National | |
| 1. | Manalapan | 100.0% | 10.4%(+89.6)#1 | 10.9%(+89.1)#15 |
| 2. | Burnt Store Marina | 100.0% | 10.4%(+89.6)#2 | 10.9%(+89.1)#39 |
| 3. | Mexico Beach | 100.0% | 10.4%(+89.6)#3 | 10.9%(+89.1)#59 |
| 4. | Buckhead Ridge | 100.0% | 10.4%(+89.6)#4 | 10.9%(+89.1)#60 |
| 5. | Briny Breezes | 100.0% | 10.4%(+89.6)#5 | 10.9%(+89.1)#93 |
| 6. | Wacissa | 100.0% | 10.4%(+89.6)#6 | 10.9%(+89.1)#138 |
| 7. | West Canaveral Groves | 100.0% | 10.4%(+89.6)#7 | 10.9%(+89.1)#211 |
| 8. | Wiscon | 99.9% | 10.4%(+89.5)#8 | 10.9%(+89.0)#345 |
| 9. | Homestead Base | 93.3% | 10.4%(+82.9)#9 | 10.9%(+82.4)#392 |
| 10. | Lacoochee | 92.5% | 10.4%(+82.1)#10 | 10.9%(+81.6)#394 |
| 11. | Micanopy | 90.4% | 10.4%(+80.0)#11 | 10.9%(+79.5)#401 |
| 12. | Cortez | 82.9% | 10.4%(+72.5)#12 | 10.9%(+72.0)#439 |
| 13. | Harbour Heights | 73.5% | 10.4%(+63.1)#13 | 10.9%(+62.6)#539 |
| 14. | Pine Lakes | 69.9% | 10.4%(+59.5)#14 | 10.9%(+59.0)#586 |
| 15. | Five Points | 69.4% | 10.4%(+59.0)#15 | 10.9%(+58.5)#594 |
| 16. | Plantation Mobile Home Park | 68.1% | 10.4%(+57.7)#16 | 10.9%(+57.2)#613 |
| 17. | Chipley | 64.4% | 10.4%(+54.0)#17 | 10.9%(+53.5)#679 |
| 18. | Fellsmere | 64.3% | 10.4%(+53.9)#18 | 10.9%(+53.4)#682 |
| 19. | Inglis | 62.1% | 10.4%(+51.7)#19 | 10.9%(+51.2)#728 |
| 20. | Eastpoint | 53.8% | 10.4%(+43.4)#20 | 10.9%(+42.9)#957 |
| 21. | Harlem | 53.5% | 10.4%(+43.1)#21 | 10.9%(+42.6)#971 |
| 22. | Nocatee | 52.9% | 10.4%(+42.5)#22 | 10.9%(+42.0)#993 |
| 23. | Limestone Creek | 52.1% | 10.4%(+41.7)#23 | 10.9%(+41.2)#1,019 |
| 24. | Lake Park | 51.8% | 10.4%(+41.4)#24 | 10.9%(+40.9)#1,029 |
| 25. | Gifford | 50.7% | 10.4%(+40.3)#25 | 10.9%(+39.8)#1,064 |
| 26. | Page Park | 50.7% | 10.4%(+40.3)#26 | 10.9%(+39.8)#1,068 |
| 27. | Paxton | 50.0% | 10.4%(+39.6)#27 | 10.9%(+39.1)#1,094 |
| 28. | Sea Ranch Lakes | 50.0% | 10.4%(+39.6)#28 | 10.9%(+39.1)#1,098 |
| 29. | Bear Creek | 49.5% | 10.4%(+39.1)#29 | 10.9%(+38.6)#1,194 |
| 30. | Chuluota | 48.9% | 10.4%(+38.5)#30 | 10.9%(+38.0)#1,210 |
| 31. | High Point | 47.8% | 10.4%(+37.4)#31 | 10.9%(+36.9)#1,247 |
| 32. | Longboat Key | 47.0% | 10.4%(+36.6)#32 | 10.9%(+36.1)#1,265 |
| 33. | East Palatka | 46.1% | 10.4%(+35.7)#33 | 10.9%(+35.2)#1,302 |
| 34. | White Springs | 46.1% | 10.4%(+35.7)#34 | 10.9%(+35.2)#1,304 |
| 35. | Coleman | 44.8% | 10.4%(+34.4)#35 | 10.9%(+33.9)#1,376 |
| 36. | Harlem Heights | 43.7% | 10.4%(+33.3)#36 | 10.9%(+32.8)#1,430 |
| 37. | Pahokee | 43.5% | 10.4%(+33.1)#37 | 10.9%(+32.6)#1,451 |
| 38. | Citrus Hills | 43.1% | 10.4%(+32.7)#38 | 10.9%(+32.2)#1,481 |
| 39. | Malone | 42.7% | 10.4%(+32.3)#39 | 10.9%(+31.8)#1,527 |
| 40. | Jupiter Island | 42.5% | 10.4%(+32.1)#40 | 10.9%(+31.6)#1,541 |
| 41. | Glen Ridge | 41.6% | 10.4%(+31.2)#41 | 10.9%(+30.7)#1,604 |
| 42. | Waldo | 38.3% | 10.4%(+27.9)#42 | 10.9%(+27.4)#1,831 |
| 43. | Bonifay | 37.8% | 10.4%(+27.4)#43 | 10.9%(+26.9)#1,864 |
| 44. | Bayshore Gardens | 36.6% | 10.4%(+26.2)#44 | 10.9%(+25.7)#1,962 |
| 45. | Miccosukee | 36.1% | 10.4%(+25.7)#45 | 10.9%(+25.2)#2,008 |
| 46. | Moon Lake | 36.0% | 10.4%(+25.6)#46 | 10.9%(+25.1)#2,010 |
| 47. | Highland Beach | 35.5% | 10.4%(+25.1)#47 | 10.9%(+24.6)#2,055 |
| 48. | Naranja | 33.9% | 10.4%(+23.5)#48 | 10.9%(+23.0)#2,203 |
| 49. | Memphis | 33.2% | 10.4%(+22.8)#49 | 10.9%(+22.3)#2,349 |
| 50. | Lower Grand Lagoon | 32.3% | 10.4%(+21.9)#50 | 10.9%(+21.4)#2,413 |
| 51. | Crystal River | 31.9% | 10.4%(+21.5)#51 | 10.9%(+21.0)#2,455 |
| 52. | Sanibel | 31.8% | 10.4%(+21.4)#52 | 10.9%(+20.9)#2,463 |
| 53. | Tiger Point | 31.0% | 10.4%(+20.6)#53 | 10.9%(+20.1)#2,565 |
| 54. | Palm Beach | 30.6% | 10.4%(+20.2)#54 | 10.9%(+19.7)#2,609 |
| 55. | Port Labelle | 30.4% | 10.4%(+20.0)#55 | 10.9%(+19.5)#2,628 |
| 56. | Goulds | 30.2% | 10.4%(+19.8)#56 | 10.9%(+19.3)#2,649 |
| 57. | Liberty Triangle | 30.1% | 10.4%(+19.7)#57 | 10.9%(+19.2)#2,661 |
| 58. | Seminole Manor | 30.0% | 10.4%(+19.6)#58 | 10.9%(+19.1)#2,674 |
| 59. | Washington Park | 29.8% | 10.4%(+19.4)#59 | 10.9%(+18.9)#2,719 |
| 60. | Micco | 29.5% | 10.4%(+19.1)#60 | 10.9%(+18.6)#2,746 |
| 61. | Bowling Green | 29.5% | 10.4%(+19.1)#61 | 10.9%(+18.6)#2,751 |
| 62. | Hutchinson Island South | 29.4% | 10.4%(+19.0)#62 | 10.9%(+18.5)#2,761 |
| 63. | Myrtle Grove | 29.3% | 10.4%(+18.9)#63 | 10.9%(+18.4)#2,775 |
| 64. | Connerton | 29.2% | 10.4%(+18.8)#64 | 10.9%(+18.3)#2,782 |
| 65. | New Port Richey East | 29.0% | 10.4%(+18.6)#65 | 10.9%(+18.1)#2,813 |
| 66. | Flagler Estates | 29.0% | 10.4%(+18.6)#66 | 10.9%(+18.1)#2,816 |
| 67. | Treasure Island | 28.6% | 10.4%(+18.2)#67 | 10.9%(+17.7)#2,853 |
| 68. | Juno Ridge | 28.0% | 10.4%(+17.6)#68 | 10.9%(+17.1)#2,963 |
| 69. | Sebring | 27.7% | 10.4%(+17.3)#69 | 10.9%(+16.8)#2,994 |
| 70. | Bal Harbour | 27.6% | 10.4%(+17.2)#70 | 10.9%(+16.7)#3,023 |
| 71. | Mayo | 27.6% | 10.4%(+17.2)#71 | 10.9%(+16.7)#3,025 |
| 72. | Belle Glade | 27.2% | 10.4%(+16.8)#72 | 10.9%(+16.3)#3,063 |
| 73. | Wilton Manors | 27.2% | 10.4%(+16.8)#73 | 10.9%(+16.3)#3,064 |
| 74. | Lochmoor Waterway Estates | 26.7% | 10.4%(+16.3)#74 | 10.9%(+15.8)#3,155 |
| 75. | Stacey Street | 26.7% | 10.4%(+16.3)#75 | 10.9%(+15.8)#3,162 |
| 76. | Newberry | 26.6% | 10.4%(+16.2)#76 | 10.9%(+15.7)#3,167 |
| 77. | La Crosse | 26.6% | 10.4%(+16.2)#77 | 10.9%(+15.7)#3,193 |
| 78. | Hudson | 26.5% | 10.4%(+16.1)#78 | 10.9%(+15.6)#3,201 |
| 79. | Belleair Bluffs | 26.4% | 10.4%(+16.0)#79 | 10.9%(+15.5)#3,219 |
| 80. | Haverhill | 26.3% | 10.4%(+15.9)#80 | 10.9%(+15.4)#3,237 |
| 81. | Melbourne Village | 26.3% | 10.4%(+15.9)#81 | 10.9%(+15.4)#3,245 |
| 82. | Fort Meade | 26.2% | 10.4%(+15.8)#82 | 10.9%(+15.3)#3,268 |
| 83. | Bristol | 26.1% | 10.4%(+15.7)#83 | 10.9%(+15.2)#3,287 |
| 84. | Fort Myers Shores | 26.0% | 10.4%(+15.6)#84 | 10.9%(+15.1)#3,299 |
| 85. | Hampton | 26.0% | 10.4%(+15.6)#85 | 10.9%(+15.1)#3,310 |
| 86. | Butler Beach | 25.6% | 10.4%(+15.2)#86 | 10.9%(+14.7)#3,376 |
| 87. | Pine Hills | 25.4% | 10.4%(+15.0)#87 | 10.9%(+14.5)#3,397 |
| 88. | Webster | 25.4% | 10.4%(+15.0)#88 | 10.9%(+14.5)#3,406 |
| 89. | North Merritt Island | 25.2% | 10.4%(+14.8)#89 | 10.9%(+14.3)#3,431 |
| 90. | Hilliard | 25.2% | 10.4%(+14.8)#90 | 10.9%(+14.3)#3,437 |
| 91. | West Little River | 25.1% | 10.4%(+14.7)#91 | 10.9%(+14.2)#3,441 |
| 92. | Oriole Beach | 25.0% | 10.4%(+14.6)#92 | 10.9%(+14.1)#3,463 |
| 93. | Wahneta | 24.7% | 10.4%(+14.3)#93 | 10.9%(+13.8)#3,565 |
| 94. | Silver Springs | 24.6% | 10.4%(+14.2)#94 | 10.9%(+13.7)#3,585 |
| 95. | Mulberry | 24.3% | 10.4%(+13.9)#95 | 10.9%(+13.4)#3,643 |
| 96. | Lake Kerr | 24.3% | 10.4%(+13.9)#96 | 10.9%(+13.4)#3,645 |
| 97. | West Vero Corridor | 23.8% | 10.4%(+13.4)#97 | 10.9%(+12.9)#3,730 |
| 98. | Tierra Verde | 23.8% | 10.4%(+13.4)#98 | 10.9%(+12.9)#3,733 |
| 99. | Miami Shores | 23.7% | 10.4%(+13.3)#99 | 10.9%(+12.8)#3,762 |
| 100. | Orange Park | 23.7% | 10.4%(+13.3)#100 | 10.9%(+12.8)#3,766 |
Common Questions
What are the Top 10 Cities with the Highest Unemployment Rate Amomg Youth Under the Age of 25 in Florida?
Top 10 Cities with the Highest Unemployment Rate Amomg Youth Under the Age of 25 in Florida are:
#1
100.0%
#2
100.0%
#3
100.0%
#4
100.0%
#5
100.0%
#6
100.0%
#7
99.9%
#8
93.3%
#9
92.5%
#10
90.4%
What city has the Highest Unemployment Rate Amomg Youth Under the Age of 25 in Florida?
Manalapan has the Highest Unemployment Rate Amomg Youth Under the Age of 25 in Florida with 100.0%.
What is the Unemployment Rate Amomg Youth Under the Age of 25 in the State of Florida?
Unemployment Rate Amomg Youth Under the Age of 25 in Florida is 10.4%.
What is the Unemployment Rate Amomg Youth Under the Age of 25 in the United States?
Unemployment Rate Amomg Youth Under the Age of 25 in the United States is 10.9%.