Cities with the Highest Unemployment Rate Amomg Youth Under the Age of 25 in Massachusetts
RELATED REPORTS & OPTIONS
Highest Unemployment | Youth < 25
Massachusetts
Compare Cities
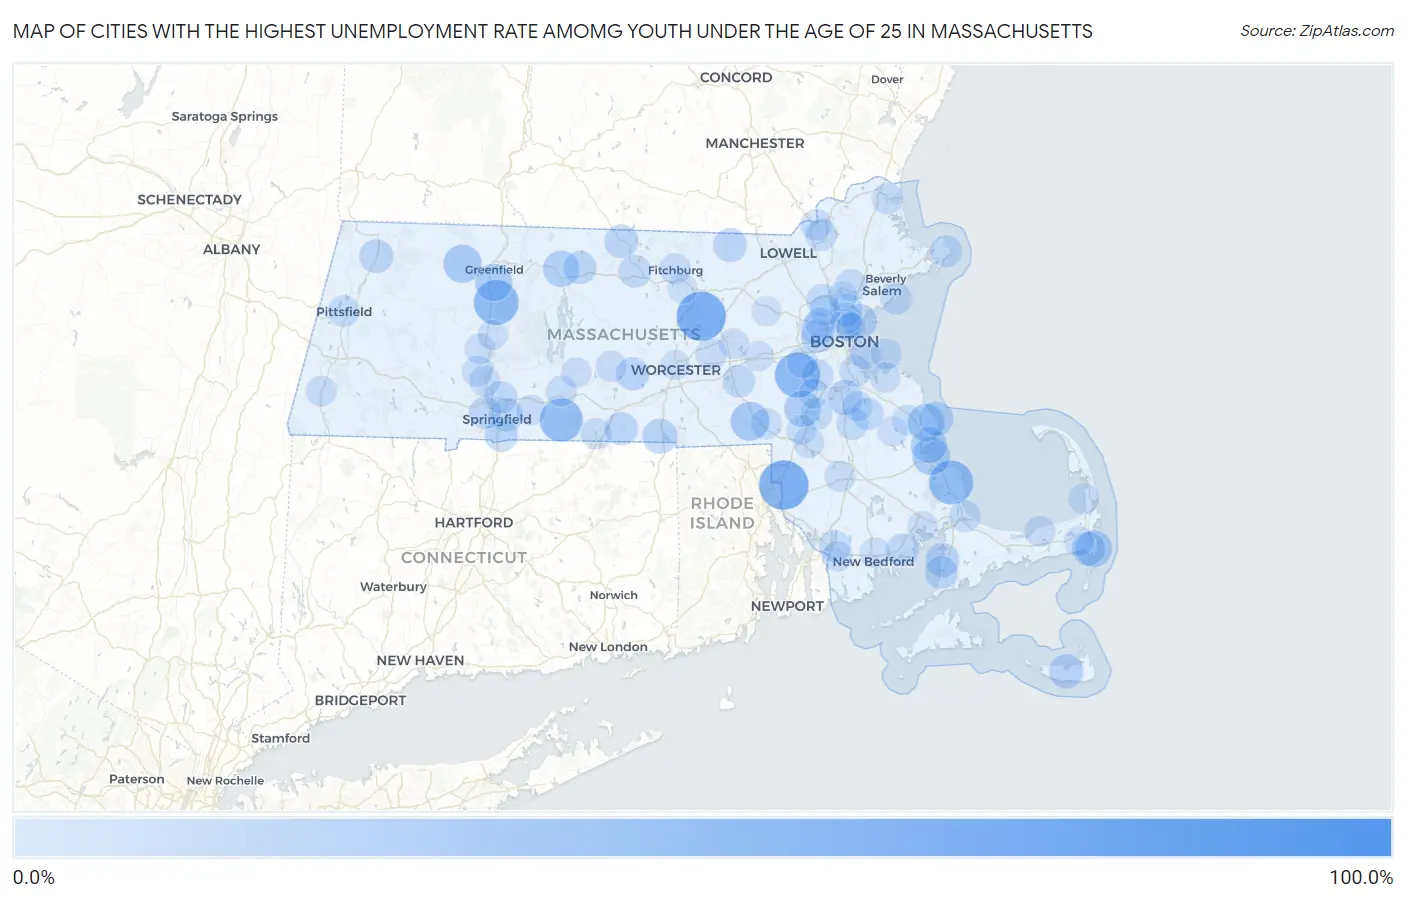
Map of Cities with the Highest Unemployment Rate Amomg Youth Under the Age of 25 in Massachusetts
0.0%
100.0%
Cities with the Highest Unemployment Rate Amomg Youth Under the Age of 25 in Massachusetts
| City | Youth Unemployment | vs State | vs National | |
| 1. | Lenox Dale | 100.0% | 10.8%(+89.2)#1 | 10.9%(+89.1)#161 |
| 2. | North Seekonk | 64.1% | 10.8%(+53.3)#2 | 10.9%(+53.2)#684 |
| 3. | South Lancaster | 63.4% | 10.8%(+52.6)#3 | 10.9%(+52.5)#702 |
| 4. | West Warren | 60.7% | 10.8%(+49.9)#4 | 10.9%(+49.8)#756 |
| 5. | Dover | 51.7% | 10.8%(+40.9)#5 | 10.9%(+40.8)#1,038 |
| 6. | South Deerfield | 50.7% | 10.8%(+39.9)#6 | 10.9%(+39.8)#1,066 |
| 7. | The Pinehills | 48.5% | 10.8%(+37.7)#7 | 10.9%(+37.6)#1,224 |
| 8. | Monson Center | 46.0% | 10.8%(+35.2)#8 | 10.9%(+35.1)#1,316 |
| 9. | Bellingham | 33.8% | 10.8%(+23.0)#9 | 10.9%(+22.9)#2,214 |
| 10. | Shelburne Falls | 32.1% | 10.8%(+21.3)#10 | 10.9%(+21.2)#2,435 |
| 11. | North Plymouth | 31.1% | 10.8%(+20.3)#11 | 10.9%(+20.2)#2,554 |
| 12. | Deerfield | 29.4% | 10.8%(+18.6)#12 | 10.9%(+18.5)#2,771 |
| 13. | Marshfield | 29.2% | 10.8%(+18.4)#13 | 10.9%(+18.3)#2,786 |
| 14. | Chatham | 28.3% | 10.8%(+17.5)#14 | 10.9%(+17.4)#2,925 |
| 15. | Walpole | 27.6% | 10.8%(+16.8)#15 | 10.9%(+16.7)#3,019 |
| 16. | Cedar Crest | 27.5% | 10.8%(+16.7)#16 | 10.9%(+16.6)#3,033 |
| 17. | North Attleborough | 27.3% | 10.8%(+16.5)#17 | 10.9%(+16.4)#3,056 |
| 18. | Orange | 26.9% | 10.8%(+16.1)#18 | 10.9%(+16.0)#3,131 |
| 19. | South Duxbury | 26.7% | 10.8%(+15.9)#19 | 10.9%(+15.8)#3,157 |
| 20. | Randolph Town | 23.5% | 10.8%(+12.7)#20 | 10.9%(+12.6)#3,801 |
| 21. | Webster | 23.5% | 10.8%(+12.7)#21 | 10.9%(+12.6)#3,802 |
| 22. | Nantucket | 22.0% | 10.8%(+11.2)#22 | 10.9%(+11.1)#4,190 |
| 23. | Ocean Bluff Brant Rock | 21.5% | 10.8%(+10.7)#23 | 10.9%(+10.6)#4,302 |
| 24. | Revere | 21.1% | 10.8%(+10.3)#24 | 10.9%(+10.2)#4,398 |
| 25. | North Falmouth | 21.0% | 10.8%(+10.2)#25 | 10.9%(+10.1)#4,435 |
| 26. | East Pepperell | 20.2% | 10.8%(+9.40)#26 | 10.9%(+9.30)#4,654 |
| 27. | Adams | 20.0% | 10.8%(+9.20)#27 | 10.9%(+9.10)#4,687 |
| 28. | Winchendon | 19.5% | 10.8%(+8.70)#28 | 10.9%(+8.60)#4,871 |
| 29. | West Chatham | 19.4% | 10.8%(+8.60)#29 | 10.9%(+8.50)#4,910 |
| 30. | Springfield | 18.9% | 10.8%(+8.10)#30 | 10.9%(+8.00)#5,057 |
| 31. | Longmeadow | 18.9% | 10.8%(+8.10)#31 | 10.9%(+8.00)#5,061 |
| 32. | Spencer | 18.9% | 10.8%(+8.10)#32 | 10.9%(+8.00)#5,068 |
| 33. | Belmont | 18.6% | 10.8%(+7.80)#33 | 10.9%(+7.70)#5,164 |
| 34. | Southbridge Town | 18.4% | 10.8%(+7.60)#34 | 10.9%(+7.50)#5,222 |
| 35. | Athol | 18.4% | 10.8%(+7.60)#35 | 10.9%(+7.50)#5,226 |
| 36. | Watertown Town | 18.0% | 10.8%(+7.20)#36 | 10.9%(+7.10)#5,370 |
| 37. | West Falmouth | 18.0% | 10.8%(+7.20)#37 | 10.9%(+7.10)#5,385 |
| 38. | Mattapoisett Center | 17.5% | 10.8%(+6.70)#38 | 10.9%(+6.60)#5,611 |
| 39. | Gardner | 17.3% | 10.8%(+6.50)#39 | 10.9%(+6.40)#5,668 |
| 40. | Hopkinton | 16.8% | 10.8%(+6.00)#40 | 10.9%(+5.90)#5,872 |
| 41. | Melrose | 16.6% | 10.8%(+5.80)#41 | 10.9%(+5.70)#5,921 |
| 42. | West Springfield Town | 16.6% | 10.8%(+5.80)#42 | 10.9%(+5.70)#5,922 |
| 43. | Chicopee | 16.5% | 10.8%(+5.70)#43 | 10.9%(+5.60)#6,021 |
| 44. | Sharon | 16.0% | 10.8%(+5.20)#44 | 10.9%(+5.10)#6,205 |
| 45. | Brockton | 15.7% | 10.8%(+4.90)#45 | 10.9%(+4.80)#6,325 |
| 46. | Rockport | 15.7% | 10.8%(+4.90)#46 | 10.9%(+4.80)#6,346 |
| 47. | Woburn | 15.4% | 10.8%(+4.60)#47 | 10.9%(+4.50)#6,470 |
| 48. | Abington | 15.4% | 10.8%(+4.60)#48 | 10.9%(+4.50)#6,478 |
| 49. | Marblehead | 15.1% | 10.8%(+4.30)#49 | 10.9%(+4.20)#6,609 |
| 50. | Lynnfield | 15.0% | 10.8%(+4.20)#50 | 10.9%(+4.10)#6,663 |
| 51. | Lawrence | 14.9% | 10.8%(+4.10)#51 | 10.9%(+4.00)#6,703 |
| 52. | Fall River | 14.7% | 10.8%(+3.90)#52 | 10.9%(+3.80)#6,820 |
| 53. | Dedham | 14.7% | 10.8%(+3.90)#53 | 10.9%(+3.80)#6,824 |
| 54. | Sagamore | 14.6% | 10.8%(+3.80)#54 | 10.9%(+3.70)#6,884 |
| 55. | Quincy | 14.3% | 10.8%(+3.50)#55 | 10.9%(+3.40)#6,988 |
| 56. | Malden | 14.3% | 10.8%(+3.50)#56 | 10.9%(+3.40)#6,991 |
| 57. | Pittsfield | 13.8% | 10.8%(+3.00)#57 | 10.9%(+2.90)#7,296 |
| 58. | Methuen Town | 13.7% | 10.8%(+2.90)#58 | 10.9%(+2.80)#7,365 |
| 59. | Everett | 13.7% | 10.8%(+2.90)#59 | 10.9%(+2.80)#7,366 |
| 60. | Newburyport | 13.6% | 10.8%(+2.80)#60 | 10.9%(+2.70)#7,451 |
| 61. | Franklin Town | 13.3% | 10.8%(+2.50)#61 | 10.9%(+2.40)#7,607 |
| 62. | Northborough | 13.2% | 10.8%(+2.40)#62 | 10.9%(+2.30)#7,701 |
| 63. | Amherst | 13.0% | 10.8%(+2.20)#63 | 10.9%(+2.10)#7,788 |
| 64. | North Brookfield | 13.0% | 10.8%(+2.20)#64 | 10.9%(+2.10)#7,823 |
| 65. | Holland | 13.0% | 10.8%(+2.20)#65 | 10.9%(+2.10)#7,829 |
| 66. | Fitchburg | 12.9% | 10.8%(+2.10)#66 | 10.9%(+2.00)#7,852 |
| 67. | Dennis | 12.8% | 10.8%(+2.00)#67 | 10.9%(+1.90)#7,936 |
| 68. | Boston | 12.7% | 10.8%(+1.90)#68 | 10.9%(+1.80)#7,951 |
| 69. | Needham | 12.7% | 10.8%(+1.90)#69 | 10.9%(+1.80)#7,963 |
| 70. | Mansfield Center | 12.5% | 10.8%(+1.70)#70 | 10.9%(+1.60)#8,101 |
| 71. | Winchester | 12.4% | 10.8%(+1.60)#71 | 10.9%(+1.50)#8,169 |
| 72. | Palmer Town | 12.4% | 10.8%(+1.60)#72 | 10.9%(+1.50)#8,178 |
| 73. | Hull | 12.3% | 10.8%(+1.50)#73 | 10.9%(+1.40)#8,242 |
| 74. | Holyoke | 12.2% | 10.8%(+1.40)#74 | 10.9%(+1.30)#8,276 |
| 75. | Easthampton Town | 12.2% | 10.8%(+1.40)#75 | 10.9%(+1.30)#8,295 |
| 76. | Taunton | 12.0% | 10.8%(+1.20)#76 | 10.9%(+1.10)#8,382 |
| 77. | Hingham | 12.0% | 10.8%(+1.20)#77 | 10.9%(+1.10)#8,409 |
| 78. | Great Barrington | 12.0% | 10.8%(+1.20)#78 | 10.9%(+1.10)#8,426 |
| 79. | Northampton | 11.8% | 10.8%(+1.000)#79 | 10.9%(+0.900)#8,517 |
| 80. | North Eastham | 11.8% | 10.8%(+1.000)#80 | 10.9%(+0.900)#8,544 |
| 81. | Marlborough | 11.4% | 10.8%(+0.600)#81 | 10.9%(+0.500)#8,773 |
| 82. | North Pembroke | 11.4% | 10.8%(+0.600)#82 | 10.9%(+0.500)#8,800 |
| 83. | Arlington | 11.2% | 10.8%(+0.400)#83 | 10.9%(+0.300)#8,890 |
| 84. | Ware | 11.2% | 10.8%(+0.400)#84 | 10.9%(+0.300)#8,914 |
| 85. | East Harwich | 11.2% | 10.8%(+0.400)#85 | 10.9%(+0.300)#8,919 |
| 86. | Holbrook | 10.9% | 10.8%(+0.100)#86 | 10.9%(=0.000)#9,128 |
| 87. | Wilbraham | 10.9% | 10.8%(+0.100)#87 | 10.9%(=0.000)#9,139 |
| 88. | North Westport | 10.6% | 10.8%(-0.200)#88 | 10.9%(-0.300)#9,345 |
| 89. | Wareham Center | 10.6% | 10.8%(-0.200)#89 | 10.9%(-0.300)#9,352 |
| 90. | New Bedford | 10.5% | 10.8%(-0.300)#90 | 10.9%(-0.400)#9,376 |
| 91. | Hanson | 10.4% | 10.8%(-0.400)#91 | 10.9%(-0.500)#9,520 |
| 92. | Hatfield | 10.3% | 10.8%(-0.500)#92 | 10.9%(-0.600)#9,607 |
| 93. | Worcester | 10.1% | 10.8%(-0.700)#93 | 10.9%(-0.800)#9,697 |
| 94. | Leominster | 10.0% | 10.8%(-0.800)#94 | 10.9%(-0.900)#9,779 |
| 95. | Framingham | 9.8% | 10.8%(-1.00)#95 | 10.9%(-1.10)#9,948 |
| 96. | Wakefield | 9.8% | 10.8%(-1.00)#96 | 10.9%(-1.10)#9,956 |
| 97. | West Concord | 9.8% | 10.8%(-1.00)#97 | 10.9%(-1.10)#9,971 |
| 98. | Foxborough | 9.8% | 10.8%(-1.00)#98 | 10.9%(-1.10)#9,972 |
| 99. | Chelsea | 9.7% | 10.8%(-1.10)#99 | 10.9%(-1.20)#10,022 |
| 100. | Norwood | 9.7% | 10.8%(-1.10)#100 | 10.9%(-1.20)#10,026 |
1
2Common Questions
What are the Top 10 Cities with the Highest Unemployment Rate Amomg Youth Under the Age of 25 in Massachusetts?
Top 10 Cities with the Highest Unemployment Rate Amomg Youth Under the Age of 25 in Massachusetts are:
#1
64.1%
#2
63.4%
#3
51.7%
#4
50.7%
#5
48.5%
#6
46.0%
#7
33.8%
#8
32.1%
#9
31.1%
#10
29.4%
What city has the Highest Unemployment Rate Amomg Youth Under the Age of 25 in Massachusetts?
North Seekonk has the Highest Unemployment Rate Amomg Youth Under the Age of 25 in Massachusetts with 64.1%.
What is the Unemployment Rate Amomg Youth Under the Age of 25 in the State of Massachusetts?
Unemployment Rate Amomg Youth Under the Age of 25 in Massachusetts is 10.8%.
What is the Unemployment Rate Amomg Youth Under the Age of 25 in the United States?
Unemployment Rate Amomg Youth Under the Age of 25 in the United States is 10.9%.