Cities with the Highest Unemployment Rate Amomg Youth Under the Age of 25 in Montana
RELATED REPORTS & OPTIONS
Highest Unemployment | Youth < 25
Montana
Compare Cities
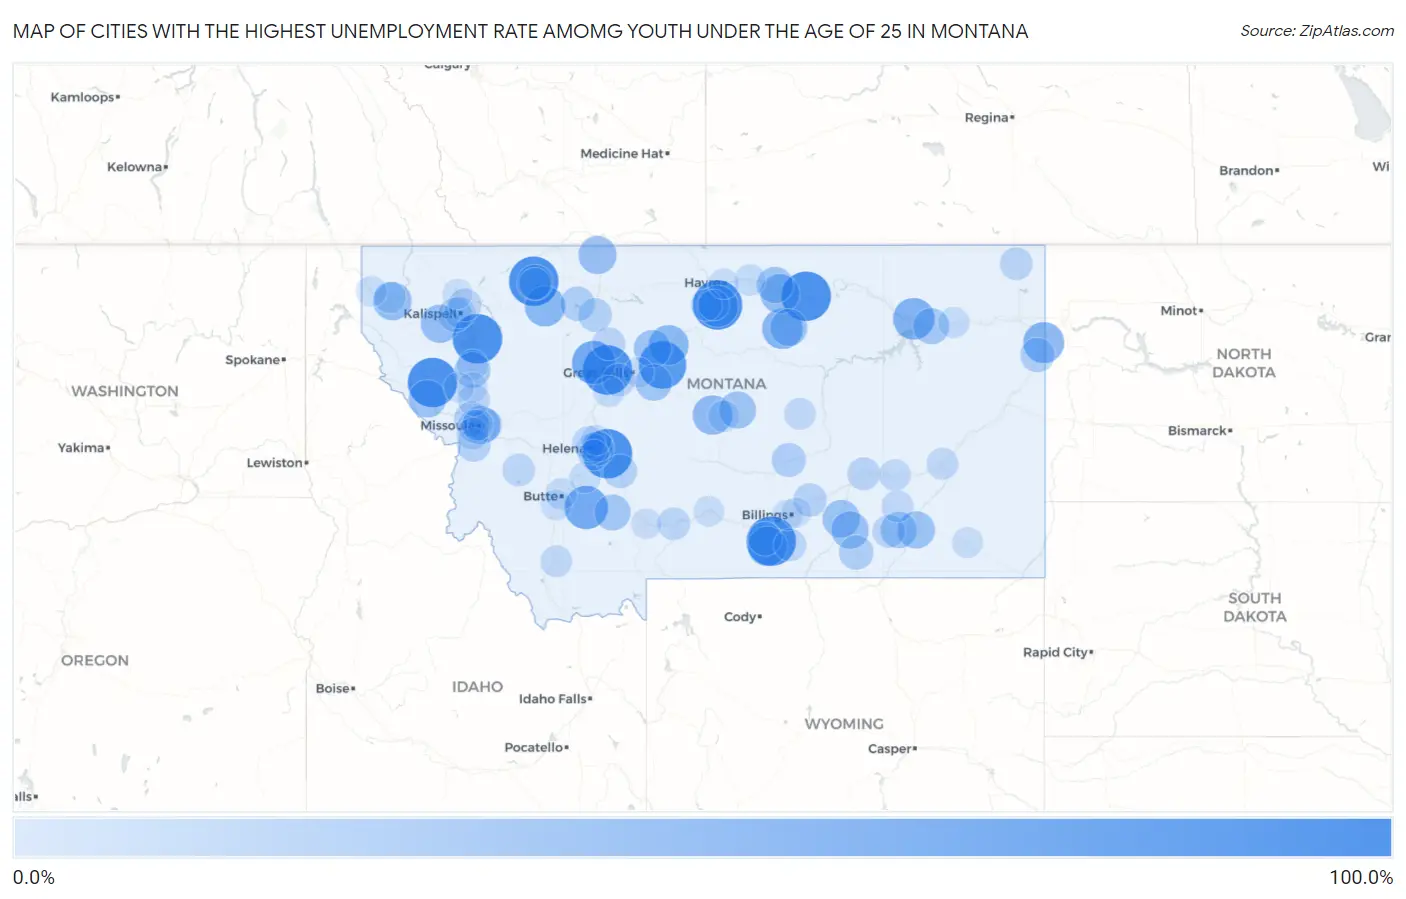
Map of Cities with the Highest Unemployment Rate Amomg Youth Under the Age of 25 in Montana
0.0%
100.0%
Cities with the Highest Unemployment Rate Amomg Youth Under the Age of 25 in Montana
| City | Youth Unemployment | vs State | vs National | |
| 1. | Spokane Creek | 100.0% | 8.8%(+91.2)#1 | 10.9%(+89.1)#103 |
| 2. | Azure | 100.0% | 8.8%(+91.2)#2 | 10.9%(+89.1)#122 |
| 3. | Bear Dance | 100.0% | 8.8%(+91.2)#3 | 10.9%(+89.1)#168 |
| 4. | Paradise | 100.0% | 8.8%(+91.2)#4 | 10.9%(+89.1)#239 |
| 5. | Dodson | 100.0% | 8.8%(+91.2)#5 | 10.9%(+89.1)#242 |
| 6. | Edgar | 100.0% | 8.8%(+91.2)#6 | 10.9%(+89.1)#261 |
| 7. | Acton | 100.0% | 8.8%(+91.2)#7 | 10.9%(+89.1)#287 |
| 8. | Sun River | 100.0% | 8.8%(+91.2)#8 | 10.9%(+89.1)#301 |
| 9. | North Browning | 99.9% | 8.8%(+91.1)#9 | 10.9%(+89.0)#322 |
| 10. | Highwood | 89.9% | 8.8%(+81.1)#10 | 10.9%(+79.0)#406 |
| 11. | Whitehall | 69.5% | 8.8%(+60.7)#11 | 10.9%(+58.6)#592 |
| 12. | Fairfield | 69.2% | 8.8%(+60.4)#12 | 10.9%(+58.3)#596 |
| 13. | Nashua | 60.0% | 8.8%(+51.2)#13 | 10.9%(+49.1)#771 |
| 14. | Sangrey | 58.8% | 8.8%(+50.0)#14 | 10.9%(+47.9)#806 |
| 15. | Fairview | 57.1% | 8.8%(+48.3)#15 | 10.9%(+46.2)#847 |
| 16. | Hays | 55.4% | 8.8%(+46.6)#16 | 10.9%(+44.5)#914 |
| 17. | Heart Butte | 54.1% | 8.8%(+45.3)#17 | 10.9%(+43.2)#949 |
| 18. | Fort Benton | 51.9% | 8.8%(+43.1)#18 | 10.9%(+41.0)#1,026 |
| 19. | Fromberg | 50.0% | 8.8%(+41.2)#19 | 10.9%(+39.1)#1,100 |
| 20. | Hobson | 49.9% | 8.8%(+41.1)#20 | 10.9%(+39.0)#1,181 |
| 21. | Fort Belknap Agency | 48.1% | 8.8%(+39.3)#21 | 10.9%(+37.2)#1,238 |
| 22. | Marion | 45.1% | 8.8%(+36.3)#22 | 10.9%(+34.2)#1,356 |
| 23. | White Haven | 43.9% | 8.8%(+35.1)#23 | 10.9%(+33.0)#1,422 |
| 24. | Sunburst | 42.8% | 8.8%(+34.0)#24 | 10.9%(+31.9)#1,511 |
| 25. | East Missoula | 42.5% | 8.8%(+33.7)#25 | 10.9%(+31.6)#1,535 |
| 26. | Superior | 40.4% | 8.8%(+31.6)#26 | 10.9%(+29.5)#1,670 |
| 27. | Hardin | 40.2% | 8.8%(+31.4)#27 | 10.9%(+29.3)#1,677 |
| 28. | Carter | 40.0% | 8.8%(+31.2)#28 | 10.9%(+29.1)#1,714 |
| 29. | Crow Agency | 39.8% | 8.8%(+31.0)#29 | 10.9%(+28.9)#1,738 |
| 30. | Ashland | 39.4% | 8.8%(+30.6)#30 | 10.9%(+28.5)#1,756 |
| 31. | Lodge Pole | 38.4% | 8.8%(+29.6)#31 | 10.9%(+27.5)#1,820 |
| 32. | Hillside Colony | 37.7% | 8.8%(+28.9)#32 | 10.9%(+26.8)#1,877 |
| 33. | Lewistown | 37.6% | 8.8%(+28.8)#33 | 10.9%(+26.7)#1,878 |
| 34. | Harlem | 34.9% | 8.8%(+26.1)#34 | 10.9%(+24.0)#2,123 |
| 35. | Belt | 34.9% | 8.8%(+26.1)#35 | 10.9%(+24.0)#2,125 |
| 36. | Lame Deer | 34.0% | 8.8%(+25.2)#36 | 10.9%(+23.1)#2,196 |
| 37. | Frazer | 33.3% | 8.8%(+24.5)#37 | 10.9%(+22.4)#2,285 |
| 38. | Willow Creek | 33.3% | 8.8%(+24.5)#38 | 10.9%(+22.4)#2,314 |
| 39. | Ronan | 31.9% | 8.8%(+23.1)#39 | 10.9%(+21.0)#2,459 |
| 40. | Browning | 31.0% | 8.8%(+22.2)#40 | 10.9%(+20.1)#2,571 |
| 41. | Valier | 25.6% | 8.8%(+16.8)#41 | 10.9%(+14.7)#3,383 |
| 42. | Sidney | 25.3% | 8.8%(+16.5)#42 | 10.9%(+14.4)#3,418 |
| 43. | Lodge Grass | 24.9% | 8.8%(+16.1)#43 | 10.9%(+14.0)#3,538 |
| 44. | Roundup | 24.0% | 8.8%(+15.2)#44 | 10.9%(+13.1)#3,701 |
| 45. | Wye | 23.8% | 8.8%(+15.0)#45 | 10.9%(+12.9)#3,746 |
| 46. | Batavia | 22.9% | 8.8%(+14.1)#46 | 10.9%(+12.0)#3,974 |
| 47. | Townsend | 22.4% | 8.8%(+13.6)#47 | 10.9%(+11.5)#4,071 |
| 48. | Joliet | 22.2% | 8.8%(+13.4)#48 | 10.9%(+11.3)#4,146 |
| 49. | Conrad | 22.0% | 8.8%(+13.2)#49 | 10.9%(+11.1)#4,196 |
| 50. | East Helena | 21.5% | 8.8%(+12.7)#50 | 10.9%(+10.6)#4,313 |
| 51. | Bonner West Riverside | 21.5% | 8.8%(+12.7)#51 | 10.9%(+10.6)#4,315 |
| 52. | Florence | 21.4% | 8.8%(+12.6)#52 | 10.9%(+10.5)#4,342 |
| 53. | Worden | 20.0% | 8.8%(+11.2)#53 | 10.9%(+9.10)#4,706 |
| 54. | Ulm | 18.1% | 8.8%(+9.30)#54 | 10.9%(+7.20)#5,327 |
| 55. | Dutton | 17.8% | 8.8%(+9.00)#55 | 10.9%(+6.90)#5,471 |
| 56. | Hysham | 17.6% | 8.8%(+8.80)#56 | 10.9%(+6.70)#5,586 |
| 57. | Helena Flats | 17.4% | 8.8%(+8.60)#57 | 10.9%(+6.50)#5,657 |
| 58. | Plentywood | 16.9% | 8.8%(+8.10)#58 | 10.9%(+6.00)#5,842 |
| 59. | Orchard Homes | 16.8% | 8.8%(+8.00)#59 | 10.9%(+5.90)#5,864 |
| 60. | Muddy | 16.8% | 8.8%(+8.00)#60 | 10.9%(+5.90)#5,887 |
| 61. | Livingston | 16.6% | 8.8%(+7.80)#61 | 10.9%(+5.70)#5,930 |
| 62. | Philipsburg | 16.6% | 8.8%(+7.80)#62 | 10.9%(+5.70)#5,954 |
| 63. | Helena Valley West Central | 16.0% | 8.8%(+7.20)#63 | 10.9%(+5.10)#6,201 |
| 64. | Pryor | 15.6% | 8.8%(+6.80)#64 | 10.9%(+4.70)#6,410 |
| 65. | Arlee | 14.2% | 8.8%(+5.40)#65 | 10.9%(+3.30)#7,088 |
| 66. | Lolo | 13.3% | 8.8%(+4.50)#66 | 10.9%(+2.40)#7,629 |
| 67. | Miles City | 13.1% | 8.8%(+4.30)#67 | 10.9%(+2.20)#7,748 |
| 68. | Colstrip | 12.9% | 8.8%(+4.10)#68 | 10.9%(+2.00)#7,882 |
| 69. | Winnett | 12.5% | 8.8%(+3.70)#69 | 10.9%(+1.60)#8,148 |
| 70. | Forsyth | 12.3% | 8.8%(+3.50)#70 | 10.9%(+1.40)#8,262 |
| 71. | Dillon | 12.2% | 8.8%(+3.40)#71 | 10.9%(+1.30)#8,312 |
| 72. | Libby | 11.9% | 8.8%(+3.10)#72 | 10.9%(+1.00)#8,483 |
| 73. | South Browning | 11.6% | 8.8%(+2.80)#73 | 10.9%(+0.700)#8,680 |
| 74. | Kalispell | 11.1% | 8.8%(+2.30)#74 | 10.9%(+0.200)#8,957 |
| 75. | Rocky Boy West | 11.1% | 8.8%(+2.30)#75 | 10.9%(+0.200)#9,016 |
| 76. | Walkerville | 11.1% | 8.8%(+2.30)#76 | 10.9%(+0.200)#9,025 |
| 77. | Moore | 11.1% | 8.8%(+2.30)#77 | 10.9%(+0.200)#9,054 |
| 78. | Helena | 10.2% | 8.8%(+1.40)#78 | 10.9%(-0.700)#9,639 |
| 79. | Chinook | 10.1% | 8.8%(+1.30)#79 | 10.9%(-0.800)#9,752 |
| 80. | Cascade | 10.0% | 8.8%(+1.20)#80 | 10.9%(-0.900)#9,841 |
| 81. | Wolf Point | 9.8% | 8.8%(+1.000)#81 | 10.9%(-1.10)#9,988 |
| 82. | Boulder | 9.8% | 8.8%(+1.000)#82 | 10.9%(-1.10)#9,996 |
| 83. | Missoula | 8.7% | 8.8%(-0.100)#83 | 10.9%(-2.20)#10,821 |
| 84. | Pablo | 8.3% | 8.8%(-0.500)#84 | 10.9%(-2.60)#11,214 |
| 85. | Billings | 8.1% | 8.8%(-0.700)#85 | 10.9%(-2.80)#11,311 |
| 86. | Broadus | 8.1% | 8.8%(-0.700)#86 | 10.9%(-2.80)#11,386 |
| 87. | Helena Valley Southeast | 8.0% | 8.8%(-0.800)#87 | 10.9%(-2.90)#11,420 |
| 88. | Butte Silver Bow Balance | 7.9% | 8.8%(-0.900)#88 | 10.9%(-3.00)#11,459 |
| 89. | Big Timber | 7.8% | 8.8%(-1.00)#89 | 10.9%(-3.10)#11,590 |
| 90. | Troy | 7.2% | 8.8%(-1.60)#90 | 10.9%(-3.70)#12,086 |
| 91. | Helena Valley Northeast | 6.9% | 8.8%(-1.90)#91 | 10.9%(-4.00)#12,273 |
| 92. | Boneau | 6.9% | 8.8%(-1.90)#92 | 10.9%(-4.00)#12,298 |
| 93. | Havre | 6.8% | 8.8%(-2.00)#93 | 10.9%(-4.10)#12,333 |
| 94. | Montana City | 6.7% | 8.8%(-2.10)#94 | 10.9%(-4.20)#12,443 |
| 95. | St Ignatius | 6.5% | 8.8%(-2.30)#95 | 10.9%(-4.40)#12,608 |
| 96. | Bozeman | 6.2% | 8.8%(-2.60)#96 | 10.9%(-4.70)#12,777 |
| 97. | Malmstrom Afb | 5.8% | 8.8%(-3.00)#97 | 10.9%(-5.10)#13,137 |
| 98. | Whitefish | 5.6% | 8.8%(-3.20)#98 | 10.9%(-5.30)#13,288 |
| 99. | Dixon | 5.2% | 8.8%(-3.60)#99 | 10.9%(-5.70)#13,662 |
| 100. | Lockwood | 4.9% | 8.8%(-3.90)#100 | 10.9%(-6.00)#13,814 |
1
2Common Questions
What are the Top 10 Cities with the Highest Unemployment Rate Amomg Youth Under the Age of 25 in Montana?
Top 10 Cities with the Highest Unemployment Rate Amomg Youth Under the Age of 25 in Montana are:
#1
100.0%
#2
100.0%
#3
100.0%
#4
100.0%
#5
100.0%
#6
100.0%
#7
100.0%
#8
99.9%
#9
89.9%
#10
69.5%
What city has the Highest Unemployment Rate Amomg Youth Under the Age of 25 in Montana?
Spokane Creek has the Highest Unemployment Rate Amomg Youth Under the Age of 25 in Montana with 100.0%.
What is the Unemployment Rate Amomg Youth Under the Age of 25 in the State of Montana?
Unemployment Rate Amomg Youth Under the Age of 25 in Montana is 8.8%.
What is the Unemployment Rate Amomg Youth Under the Age of 25 in the United States?
Unemployment Rate Amomg Youth Under the Age of 25 in the United States is 10.9%.