Cities with the Highest Unemployment Rate Amomg Youth Under the Age of 25 in Tennessee
RELATED REPORTS & OPTIONS
Highest Unemployment | Youth < 25
Tennessee
Compare Cities
Map of Cities with the Highest Unemployment Rate Amomg Youth Under the Age of 25 in Tennessee
0.0%
100.0%
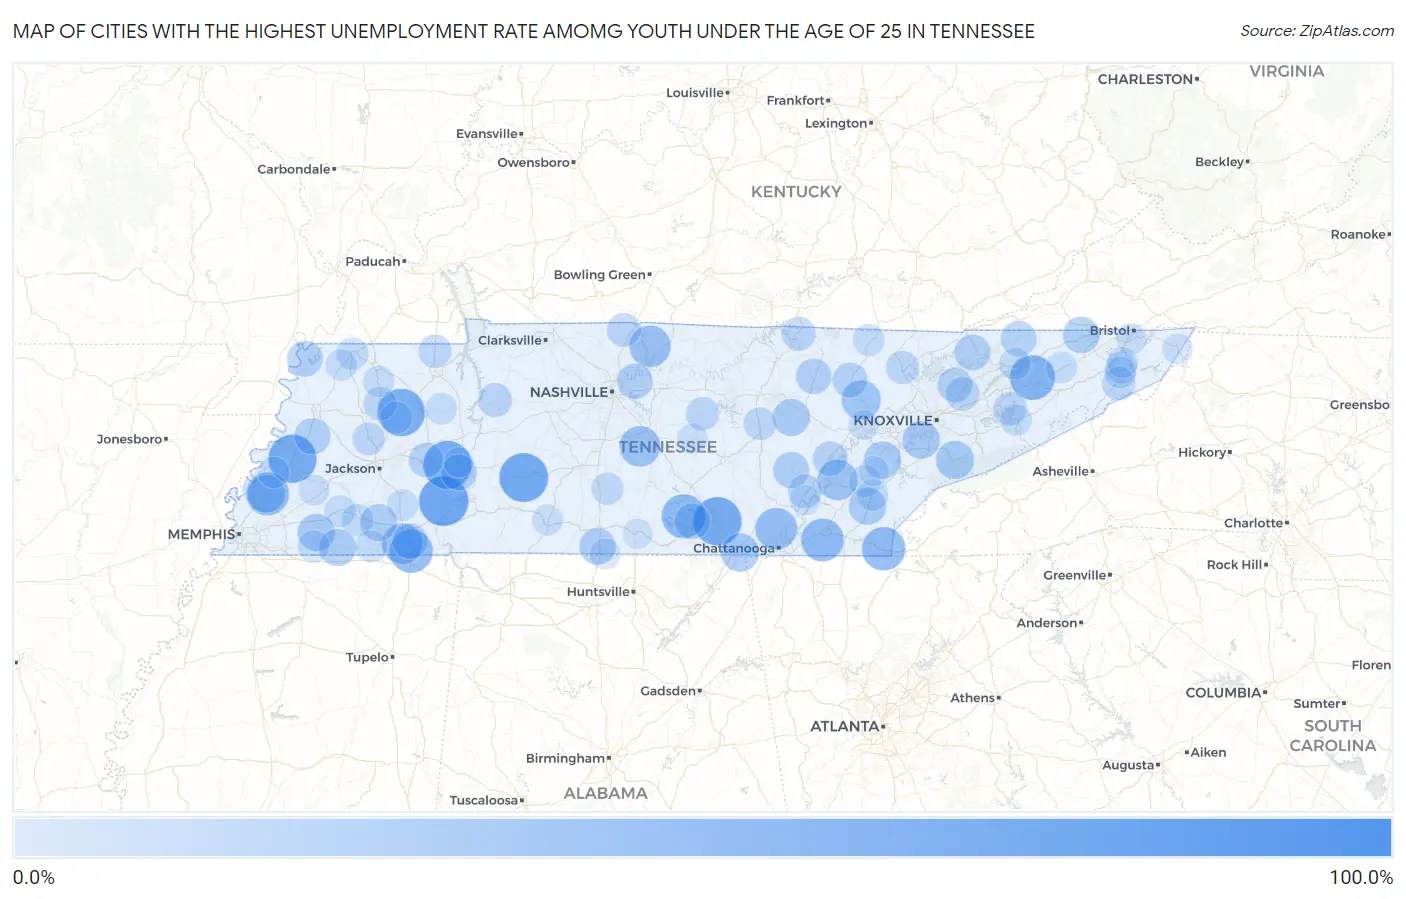
Cities with the Highest Unemployment Rate Amomg Youth Under the Age of 25 in Tennessee
| City | Youth Unemployment | vs State | vs National | |
| 1. | Leoma | 100.0% | 10.5%(+89.5)#1 | 10.9%(+89.1)#169 |
| 2. | Randolph | 100.0% | 10.5%(+89.5)#2 | 10.9%(+89.1)#193 |
| 3. | Wildersville | 100.0% | 10.5%(+89.5)#3 | 10.9%(+89.1)#212 |
| 4. | Mayland | 99.9% | 10.5%(+89.4)#4 | 10.9%(+89.0)#352 |
| 5. | Saltillo | 76.5% | 10.5%(+66.0)#5 | 10.9%(+65.6)#491 |
| 6. | Hohenwald | 74.8% | 10.5%(+64.3)#6 | 10.9%(+63.9)#523 |
| 7. | Darden | 73.1% | 10.5%(+62.6)#7 | 10.9%(+62.2)#541 |
| 8. | Monteagle | 73.0% | 10.5%(+62.5)#8 | 10.9%(+62.1)#542 |
| 9. | Henning | 72.9% | 10.5%(+62.4)#9 | 10.9%(+62.0)#545 |
| 10. | Trezevant | 70.8% | 10.5%(+60.3)#10 | 10.9%(+59.9)#575 |
| 11. | Bulls Gap | 63.1% | 10.5%(+52.6)#11 | 10.9%(+52.2)#712 |
| 12. | Ocoee | 62.5% | 10.5%(+52.0)#12 | 10.9%(+51.6)#719 |
| 13. | Estill Springs | 60.1% | 10.5%(+49.6)#13 | 10.9%(+49.2)#764 |
| 14. | Briceville | 60.0% | 10.5%(+49.5)#14 | 10.9%(+49.1)#770 |
| 15. | Ducktown | 58.3% | 10.5%(+47.8)#15 | 10.9%(+47.4)#816 |
| 16. | Guys | 57.4% | 10.5%(+46.9)#16 | 10.9%(+46.5)#842 |
| 17. | Atoka | 57.3% | 10.5%(+46.8)#17 | 10.9%(+46.4)#843 |
| 18. | South Cleveland | 56.2% | 10.5%(+45.7)#18 | 10.9%(+45.3)#878 |
| 19. | Fairmount | 53.3% | 10.5%(+42.8)#19 | 10.9%(+42.4)#980 |
| 20. | Karns | 53.1% | 10.5%(+42.6)#20 | 10.9%(+42.2)#988 |
| 21. | Graball | 51.8% | 10.5%(+41.3)#21 | 10.9%(+40.9)#1,036 |
| 22. | Rockvale | 50.0% | 10.5%(+39.5)#22 | 10.9%(+39.1)#1,085 |
| 23. | Ramer | 50.0% | 10.5%(+39.5)#23 | 10.9%(+39.1)#1,103 |
| 24. | Norene | 50.0% | 10.5%(+39.5)#24 | 10.9%(+39.1)#1,111 |
| 25. | Orebank | 49.9% | 10.5%(+39.4)#25 | 10.9%(+39.0)#1,164 |
| 26. | Decatur | 49.2% | 10.5%(+38.7)#26 | 10.9%(+38.3)#1,204 |
| 27. | Wartburg | 45.9% | 10.5%(+35.4)#27 | 10.9%(+35.0)#1,321 |
| 28. | New Hope | 42.8% | 10.5%(+32.3)#28 | 10.9%(+31.9)#1,500 |
| 29. | Munford | 42.1% | 10.5%(+31.6)#29 | 10.9%(+31.2)#1,549 |
| 30. | Townsend | 42.1% | 10.5%(+31.6)#30 | 10.9%(+31.2)#1,553 |
| 31. | Louisville | 40.7% | 10.5%(+30.2)#31 | 10.9%(+29.8)#1,653 |
| 32. | Etowah | 40.0% | 10.5%(+29.5)#32 | 10.9%(+29.1)#1,686 |
| 33. | Williston | 39.9% | 10.5%(+29.4)#33 | 10.9%(+29.0)#1,724 |
| 34. | Philadelphia | 39.5% | 10.5%(+29.0)#34 | 10.9%(+28.6)#1,749 |
| 35. | Pleasant Hill | 39.4% | 10.5%(+28.9)#35 | 10.9%(+28.5)#1,757 |
| 36. | Grand Junction | 39.0% | 10.5%(+28.5)#36 | 10.9%(+28.1)#1,787 |
| 37. | Hampton | 38.8% | 10.5%(+28.3)#37 | 10.9%(+27.9)#1,795 |
| 38. | Hornsby | 38.4% | 10.5%(+27.9)#38 | 10.9%(+27.5)#1,819 |
| 39. | Mount Carmel | 37.8% | 10.5%(+27.3)#39 | 10.9%(+26.9)#1,862 |
| 40. | Elkton | 37.3% | 10.5%(+26.8)#40 | 10.9%(+26.4)#1,920 |
| 41. | Gates | 36.6% | 10.5%(+26.1)#41 | 10.9%(+25.7)#1,966 |
| 42. | Pikeville | 36.3% | 10.5%(+25.8)#42 | 10.9%(+25.4)#1,975 |
| 43. | Decaturville | 36.3% | 10.5%(+25.8)#43 | 10.9%(+25.4)#1,979 |
| 44. | New Tazewell | 35.6% | 10.5%(+25.1)#44 | 10.9%(+24.7)#2,048 |
| 45. | Decherd | 35.4% | 10.5%(+24.9)#45 | 10.9%(+24.5)#2,067 |
| 46. | Tiptonville | 35.3% | 10.5%(+24.8)#46 | 10.9%(+24.4)#2,074 |
| 47. | Grimsley | 34.8% | 10.5%(+24.3)#47 | 10.9%(+23.9)#2,129 |
| 48. | Eastview | 34.7% | 10.5%(+24.2)#48 | 10.9%(+23.8)#2,133 |
| 49. | Green Hill | 34.5% | 10.5%(+24.0)#49 | 10.9%(+23.6)#2,151 |
| 50. | Sneedville | 34.4% | 10.5%(+23.9)#50 | 10.9%(+23.5)#2,162 |
| 51. | Sunbright | 33.3% | 10.5%(+22.8)#51 | 10.9%(+22.4)#2,259 |
| 52. | Luttrell | 32.4% | 10.5%(+21.9)#52 | 10.9%(+21.5)#2,410 |
| 53. | Lexington | 32.1% | 10.5%(+21.6)#53 | 10.9%(+21.2)#2,432 |
| 54. | Spring City | 32.0% | 10.5%(+21.5)#54 | 10.9%(+21.1)#2,449 |
| 55. | Byrdstown | 30.2% | 10.5%(+19.7)#55 | 10.9%(+19.3)#2,658 |
| 56. | Blaine | 29.9% | 10.5%(+19.4)#56 | 10.9%(+19.0)#2,695 |
| 57. | Graysville | 29.9% | 10.5%(+19.4)#57 | 10.9%(+19.0)#2,699 |
| 58. | Waverly | 29.8% | 10.5%(+19.3)#58 | 10.9%(+18.9)#2,714 |
| 59. | Orlinda | 29.4% | 10.5%(+18.9)#59 | 10.9%(+18.5)#2,766 |
| 60. | Baneberry | 28.7% | 10.5%(+18.2)#60 | 10.9%(+17.8)#2,850 |
| 61. | Bradford | 28.5% | 10.5%(+18.0)#61 | 10.9%(+17.6)#2,871 |
| 62. | Liberty | 28.3% | 10.5%(+17.8)#62 | 10.9%(+17.4)#2,931 |
| 63. | Rocky Top | 28.2% | 10.5%(+17.7)#63 | 10.9%(+17.3)#2,937 |
| 64. | Puryear | 28.0% | 10.5%(+17.5)#64 | 10.9%(+17.1)#2,964 |
| 65. | Caryville | 27.7% | 10.5%(+17.2)#65 | 10.9%(+16.8)#3,004 |
| 66. | Unicoi | 27.5% | 10.5%(+17.0)#66 | 10.9%(+16.6)#3,030 |
| 67. | Humboldt | 26.5% | 10.5%(+16.0)#67 | 10.9%(+15.6)#3,202 |
| 68. | Sparta | 26.5% | 10.5%(+16.0)#68 | 10.9%(+15.6)#3,204 |
| 69. | Lewisburg | 25.2% | 10.5%(+14.7)#69 | 10.9%(+14.3)#3,429 |
| 70. | Union City | 24.7% | 10.5%(+14.2)#70 | 10.9%(+13.8)#3,562 |
| 71. | Bolivar | 24.4% | 10.5%(+13.9)#71 | 10.9%(+13.5)#3,620 |
| 72. | Whiteville | 24.4% | 10.5%(+13.9)#72 | 10.9%(+13.5)#3,621 |
| 73. | Middleton | 24.2% | 10.5%(+13.7)#73 | 10.9%(+13.3)#3,667 |
| 74. | Oneida | 24.1% | 10.5%(+13.6)#74 | 10.9%(+13.2)#3,682 |
| 75. | Atwood | 24.1% | 10.5%(+13.6)#75 | 10.9%(+13.2)#3,685 |
| 76. | Central | 23.8% | 10.5%(+13.3)#76 | 10.9%(+12.9)#3,739 |
| 77. | Niota | 23.8% | 10.5%(+13.3)#77 | 10.9%(+12.9)#3,751 |
| 78. | Moscow | 23.6% | 10.5%(+13.1)#78 | 10.9%(+12.7)#3,798 |
| 79. | Hollow Rock | 23.4% | 10.5%(+12.9)#79 | 10.9%(+12.5)#3,841 |
| 80. | Troy | 23.3% | 10.5%(+12.8)#80 | 10.9%(+12.4)#3,852 |
| 81. | Englewood | 23.3% | 10.5%(+12.8)#81 | 10.9%(+12.4)#3,857 |
| 82. | Mooresburg | 23.2% | 10.5%(+12.7)#82 | 10.9%(+12.3)#3,884 |
| 83. | Pine Crest | 23.0% | 10.5%(+12.5)#83 | 10.9%(+12.1)#3,925 |
| 84. | Garland | 23.0% | 10.5%(+12.5)#84 | 10.9%(+12.1)#3,946 |
| 85. | Baileyton | 22.8% | 10.5%(+12.3)#85 | 10.9%(+11.9)#3,995 |
| 86. | Finger | 22.7% | 10.5%(+12.2)#86 | 10.9%(+11.8)#4,012 |
| 87. | Newport | 22.4% | 10.5%(+11.9)#87 | 10.9%(+11.5)#4,064 |
| 88. | Sharon | 22.3% | 10.5%(+11.8)#88 | 10.9%(+11.4)#4,105 |
| 89. | Lawrenceburg | 21.6% | 10.5%(+11.1)#89 | 10.9%(+10.7)#4,271 |
| 90. | Stanton | 21.6% | 10.5%(+11.1)#90 | 10.9%(+10.7)#4,290 |
| 91. | Bristol | 21.5% | 10.5%(+11.0)#91 | 10.9%(+10.6)#4,294 |
| 92. | Watauga | 21.2% | 10.5%(+10.7)#92 | 10.9%(+10.3)#4,394 |
| 93. | Ardmore | 20.6% | 10.5%(+10.1)#93 | 10.9%(+9.70)#4,548 |
| 94. | Woodbury | 20.4% | 10.5%(+9.90)#94 | 10.9%(+9.50)#4,593 |
| 95. | Mountain City | 20.2% | 10.5%(+9.70)#95 | 10.9%(+9.30)#4,651 |
| 96. | Sweetwater | 19.5% | 10.5%(+9.00)#96 | 10.9%(+8.60)#4,867 |
| 97. | Sale Creek | 19.3% | 10.5%(+8.80)#97 | 10.9%(+8.40)#4,935 |
| 98. | Fayetteville | 19.1% | 10.5%(+8.60)#98 | 10.9%(+8.20)#4,998 |
| 99. | Harriman | 19.1% | 10.5%(+8.60)#99 | 10.9%(+8.20)#5,002 |
| 100. | Parsons | 18.9% | 10.5%(+8.40)#100 | 10.9%(+8.00)#5,075 |
Common Questions
What are the Top 10 Cities with the Highest Unemployment Rate Amomg Youth Under the Age of 25 in Tennessee?
Top 10 Cities with the Highest Unemployment Rate Amomg Youth Under the Age of 25 in Tennessee are:
What city has the Highest Unemployment Rate Amomg Youth Under the Age of 25 in Tennessee?
Saltillo has the Highest Unemployment Rate Amomg Youth Under the Age of 25 in Tennessee with 76.5%.
What is the Unemployment Rate Amomg Youth Under the Age of 25 in the State of Tennessee?
Unemployment Rate Amomg Youth Under the Age of 25 in Tennessee is 10.5%.
What is the Unemployment Rate Amomg Youth Under the Age of 25 in the United States?
Unemployment Rate Amomg Youth Under the Age of 25 in the United States is 10.9%.