Cities with the Highest Unemployment Rate Amomg Youth Under the Age of 25 in Ohio
RELATED REPORTS & OPTIONS
Highest Unemployment | Youth < 25
Ohio
Compare Cities
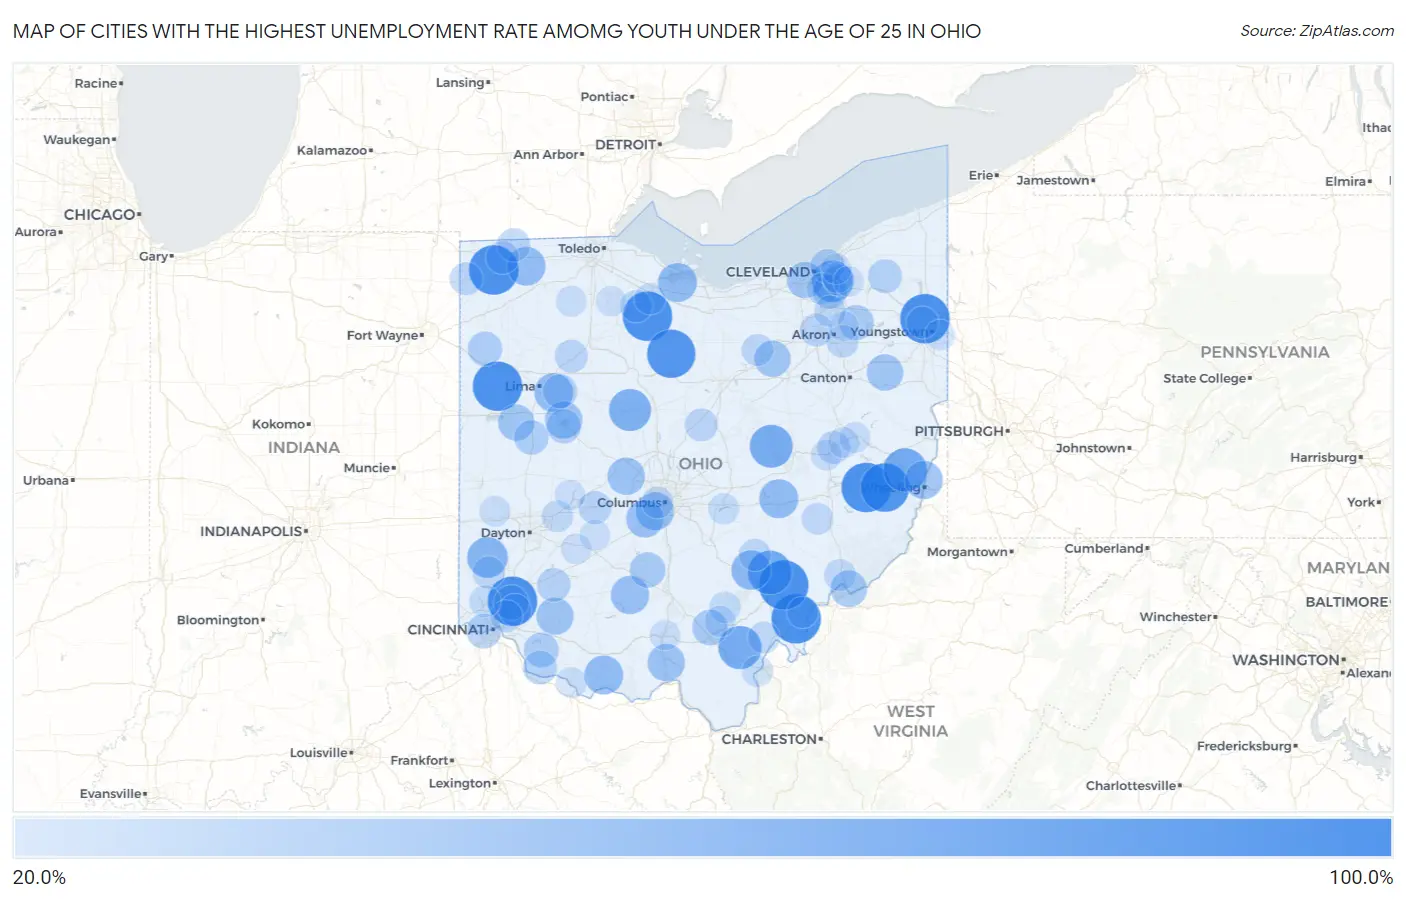
Map of Cities with the Highest Unemployment Rate Amomg Youth Under the Age of 25 in Ohio
0.0%
100.0%
Cities with the Highest Unemployment Rate Amomg Youth Under the Age of 25 in Ohio
| City | Youth Unemployment | vs State | vs National | |
| 1. | Pulaski | 100.0% | 9.9%(+90.1)#1 | 10.9%(+89.1)#27 |
| 2. | Mckinley Heights | 100.0% | 9.9%(+90.1)#2 | 10.9%(+89.1)#66 |
| 3. | Highpoint | 100.0% | 9.9%(+90.1)#3 | 10.9%(+89.1)#71 |
| 4. | Tuppers Plains | 100.0% | 9.9%(+90.1)#4 | 10.9%(+89.1)#116 |
| 5. | Amesville | 100.0% | 9.9%(+90.1)#5 | 10.9%(+89.1)#218 |
| 6. | Fort Seneca | 100.0% | 9.9%(+90.1)#6 | 10.9%(+89.1)#245 |
| 7. | Elgin | 100.0% | 9.9%(+90.1)#7 | 10.9%(+89.1)#257 |
| 8. | Fairview | 100.0% | 9.9%(+90.1)#8 | 10.9%(+89.1)#310 |
| 9. | Morristown | 96.1% | 9.9%(+86.2)#9 | 10.9%(+85.2)#381 |
| 10. | Chatfield | 95.4% | 9.9%(+85.5)#10 | 10.9%(+84.5)#383 |
| 11. | Trimble | 78.9% | 9.9%(+69.0)#11 | 10.9%(+68.0)#472 |
| 12. | Harrisville | 76.8% | 9.9%(+66.9)#12 | 10.9%(+65.9)#489 |
| 13. | Vinton | 75.9% | 9.9%(+66.0)#13 | 10.9%(+65.0)#499 |
| 14. | Nellie | 74.9% | 9.9%(+65.0)#14 | 10.9%(+64.0)#520 |
| 15. | New Bloomington | 71.4% | 9.9%(+61.5)#15 | 10.9%(+60.5)#565 |
| 16. | North Randall | 70.0% | 9.9%(+60.1)#16 | 10.9%(+59.1)#583 |
| 17. | West Elkton | 66.6% | 9.9%(+56.7)#17 | 10.9%(+55.7)#648 |
| 18. | Carbon Hill | 62.4% | 9.9%(+52.5)#18 | 10.9%(+51.5)#724 |
| 19. | North Zanesville | 60.2% | 9.9%(+50.3)#19 | 10.9%(+49.3)#763 |
| 20. | West Union | 59.9% | 9.9%(+50.0)#20 | 10.9%(+49.0)#779 |
| 21. | Whites Landing | 59.8% | 9.9%(+49.9)#21 | 10.9%(+48.9)#787 |
| 22. | Westminster | 59.1% | 9.9%(+49.2)#22 | 10.9%(+48.2)#800 |
| 23. | Pettisville | 58.6% | 9.9%(+48.7)#23 | 10.9%(+47.7)#810 |
| 24. | South Salem | 57.1% | 9.9%(+47.2)#24 | 10.9%(+46.2)#859 |
| 25. | Martins Ferry | 56.4% | 9.9%(+46.5)#25 | 10.9%(+45.5)#876 |
| 26. | Urbancrest | 56.4% | 9.9%(+46.5)#26 | 10.9%(+45.5)#877 |
| 27. | Darbydale | 55.0% | 9.9%(+45.1)#27 | 10.9%(+44.1)#930 |
| 28. | Chippewa Park | 54.2% | 9.9%(+44.3)#28 | 10.9%(+43.3)#947 |
| 29. | Unionville Center | 54.0% | 9.9%(+44.1)#29 | 10.9%(+43.1)#955 |
| 30. | Lucasville | 53.7% | 9.9%(+43.8)#30 | 10.9%(+42.8)#963 |
| 31. | Lake Lorelei | 53.0% | 9.9%(+43.1)#31 | 10.9%(+42.1)#992 |
| 32. | Reno | 51.0% | 9.9%(+41.1)#32 | 10.9%(+40.1)#1,057 |
| 33. | Homeworth | 50.8% | 9.9%(+40.9)#33 | 10.9%(+39.9)#1,061 |
| 34. | New Knoxville | 50.0% | 9.9%(+40.1)#34 | 10.9%(+39.1)#1,088 |
| 35. | Linndale | 50.0% | 9.9%(+40.1)#35 | 10.9%(+39.1)#1,110 |
| 36. | Congress | 50.0% | 9.9%(+40.1)#36 | 10.9%(+39.1)#1,143 |
| 37. | Ridgewood | 49.0% | 9.9%(+39.1)#37 | 10.9%(+38.1)#1,208 |
| 38. | Coalton | 47.0% | 9.9%(+37.1)#38 | 10.9%(+36.1)#1,269 |
| 39. | Clarksburg | 46.6% | 9.9%(+36.7)#39 | 10.9%(+35.7)#1,278 |
| 40. | Brady Lake | 45.5% | 9.9%(+35.6)#40 | 10.9%(+34.6)#1,335 |
| 41. | Bethel | 44.2% | 9.9%(+34.3)#41 | 10.9%(+33.3)#1,406 |
| 42. | Walton Hills | 44.2% | 9.9%(+34.3)#42 | 10.9%(+33.3)#1,407 |
| 43. | Brecon | 43.8% | 9.9%(+33.9)#43 | 10.9%(+32.9)#1,428 |
| 44. | Anna | 43.6% | 9.9%(+33.7)#44 | 10.9%(+32.7)#1,443 |
| 45. | Delshire | 43.5% | 9.9%(+33.6)#45 | 10.9%(+32.6)#1,452 |
| 46. | Scott | 43.4% | 9.9%(+33.5)#46 | 10.9%(+32.5)#1,466 |
| 47. | Russells Point | 42.5% | 9.9%(+32.6)#47 | 10.9%(+31.6)#1,538 |
| 48. | Harrod | 42.2% | 9.9%(+32.3)#48 | 10.9%(+31.3)#1,547 |
| 49. | East Cleveland | 42.0% | 9.9%(+32.1)#49 | 10.9%(+31.1)#1,559 |
| 50. | Felicity | 41.0% | 9.9%(+31.1)#50 | 10.9%(+30.1)#1,646 |
| 51. | Middlefield | 40.9% | 9.9%(+31.0)#51 | 10.9%(+30.0)#1,648 |
| 52. | Clarksville | 39.9% | 9.9%(+30.0)#52 | 10.9%(+29.0)#1,726 |
| 53. | Fayette | 39.1% | 9.9%(+29.2)#53 | 10.9%(+28.2)#1,770 |
| 54. | Saybrook-On-The-Lake | 38.5% | 9.9%(+28.6)#54 | 10.9%(+27.6)#1,809 |
| 55. | South Vienna | 38.0% | 9.9%(+28.1)#55 | 10.9%(+27.1)#1,853 |
| 56. | Port Washington | 37.8% | 9.9%(+27.9)#56 | 10.9%(+26.9)#1,867 |
| 57. | West Unity | 37.7% | 9.9%(+27.8)#57 | 10.9%(+26.8)#1,872 |
| 58. | Edgerton | 37.5% | 9.9%(+27.6)#58 | 10.9%(+26.6)#1,884 |
| 59. | Chesterville | 37.5% | 9.9%(+27.6)#59 | 10.9%(+26.6)#1,901 |
| 60. | Mount Cory | 37.4% | 9.9%(+27.5)#60 | 10.9%(+26.5)#1,911 |
| 61. | Pigeon Creek | 37.1% | 9.9%(+27.2)#61 | 10.9%(+26.2)#1,930 |
| 62. | Sawyerwood | 35.8% | 9.9%(+25.9)#62 | 10.9%(+24.9)#2,031 |
| 63. | Remington | 35.5% | 9.9%(+25.6)#63 | 10.9%(+24.6)#2,061 |
| 64. | Shawnee | 35.2% | 9.9%(+25.3)#64 | 10.9%(+24.3)#2,094 |
| 65. | Burgoon | 35.2% | 9.9%(+25.3)#65 | 10.9%(+24.3)#2,098 |
| 66. | Seven Mile | 35.1% | 9.9%(+25.2)#66 | 10.9%(+24.2)#2,104 |
| 67. | Silverton | 34.9% | 9.9%(+25.0)#67 | 10.9%(+24.0)#2,118 |
| 68. | Cinnamon Lake | 34.4% | 9.9%(+24.5)#68 | 10.9%(+23.5)#2,163 |
| 69. | Devola | 34.0% | 9.9%(+24.1)#69 | 10.9%(+23.1)#2,194 |
| 70. | Hilltop | 34.0% | 9.9%(+24.1)#70 | 10.9%(+23.1)#2,201 |
| 71. | Green Meadows | 33.5% | 9.9%(+23.6)#71 | 10.9%(+22.6)#2,233 |
| 72. | Valley View | 33.3% | 9.9%(+23.4)#72 | 10.9%(+22.4)#2,248 |
| 73. | Rutland | 33.3% | 9.9%(+23.4)#73 | 10.9%(+22.4)#2,258 |
| 74. | Valleyview | 33.3% | 9.9%(+23.4)#74 | 10.9%(+22.4)#2,263 |
| 75. | Peninsula | 33.3% | 9.9%(+23.4)#75 | 10.9%(+22.4)#2,266 |
| 76. | Cumberland | 33.3% | 9.9%(+23.4)#76 | 10.9%(+22.4)#2,293 |
| 77. | Mcarthur | 32.9% | 9.9%(+23.0)#77 | 10.9%(+22.0)#2,364 |
| 78. | Pleasant Run | 32.8% | 9.9%(+22.9)#78 | 10.9%(+21.9)#2,368 |
| 79. | Ballville | 31.9% | 9.9%(+22.0)#79 | 10.9%(+21.0)#2,454 |
| 80. | Orange | 31.8% | 9.9%(+21.9)#80 | 10.9%(+20.9)#2,465 |
| 81. | Gallipolis | 31.6% | 9.9%(+21.7)#81 | 10.9%(+20.7)#2,492 |
| 82. | Fairfield Beach | 31.2% | 9.9%(+21.3)#82 | 10.9%(+20.3)#2,539 |
| 83. | Coolville | 31.2% | 9.9%(+21.3)#83 | 10.9%(+20.3)#2,543 |
| 84. | Hamden | 31.1% | 9.9%(+21.2)#84 | 10.9%(+20.2)#2,560 |
| 85. | Verona | 30.7% | 9.9%(+20.8)#85 | 10.9%(+19.8)#2,600 |
| 86. | Newcomerstown | 30.0% | 9.9%(+20.1)#86 | 10.9%(+19.1)#2,670 |
| 87. | Ripley | 30.0% | 9.9%(+20.1)#87 | 10.9%(+19.1)#2,675 |
| 88. | Milton Center | 30.0% | 9.9%(+20.1)#88 | 10.9%(+19.1)#2,682 |
| 89. | Dennison | 29.9% | 9.9%(+20.0)#89 | 10.9%(+19.0)#2,694 |
| 90. | Gnadenhutten | 29.9% | 9.9%(+20.0)#90 | 10.9%(+19.0)#2,701 |
| 91. | Woodmere | 29.2% | 9.9%(+19.3)#91 | 10.9%(+18.3)#2,795 |
| 92. | Campbell | 29.1% | 9.9%(+19.2)#92 | 10.9%(+18.2)#2,796 |
| 93. | South Solon | 29.1% | 9.9%(+19.2)#93 | 10.9%(+18.2)#2,808 |
| 94. | Lyndhurst | 29.0% | 9.9%(+19.1)#94 | 10.9%(+18.1)#2,812 |
| 95. | Shawnee Hills | 29.0% | 9.9%(+19.1)#95 | 10.9%(+18.1)#2,817 |
| 96. | Wayne | 28.9% | 9.9%(+19.0)#96 | 10.9%(+18.0)#2,826 |
| 97. | Chagrin Falls | 28.6% | 9.9%(+18.7)#97 | 10.9%(+17.7)#2,855 |
| 98. | Piketon | 28.6% | 9.9%(+18.7)#98 | 10.9%(+17.7)#2,858 |
| 99. | Tremont City | 28.5% | 9.9%(+18.6)#99 | 10.9%(+17.6)#2,887 |
| 100. | Munroe Falls | 27.7% | 9.9%(+17.8)#100 | 10.9%(+16.8)#2,999 |
Common Questions
What are the Top 10 Cities with the Highest Unemployment Rate Amomg Youth Under the Age of 25 in Ohio?
Top 10 Cities with the Highest Unemployment Rate Amomg Youth Under the Age of 25 in Ohio are:
#1
100.0%
#2
100.0%
#3
100.0%
#4
100.0%
#5
100.0%
#6
100.0%
#7
100.0%
#8
100.0%
#9
96.1%
#10
95.4%
What city has the Highest Unemployment Rate Amomg Youth Under the Age of 25 in Ohio?
Pulaski has the Highest Unemployment Rate Amomg Youth Under the Age of 25 in Ohio with 100.0%.
What is the Unemployment Rate Amomg Youth Under the Age of 25 in the State of Ohio?
Unemployment Rate Amomg Youth Under the Age of 25 in Ohio is 9.9%.
What is the Unemployment Rate Amomg Youth Under the Age of 25 in the United States?
Unemployment Rate Amomg Youth Under the Age of 25 in the United States is 10.9%.