Cities with the Highest Unemployment Rate Amomg Youth Under the Age of 25 in Alaska
RELATED REPORTS & OPTIONS
Highest Unemployment | Youth < 25
Alaska
Compare Cities
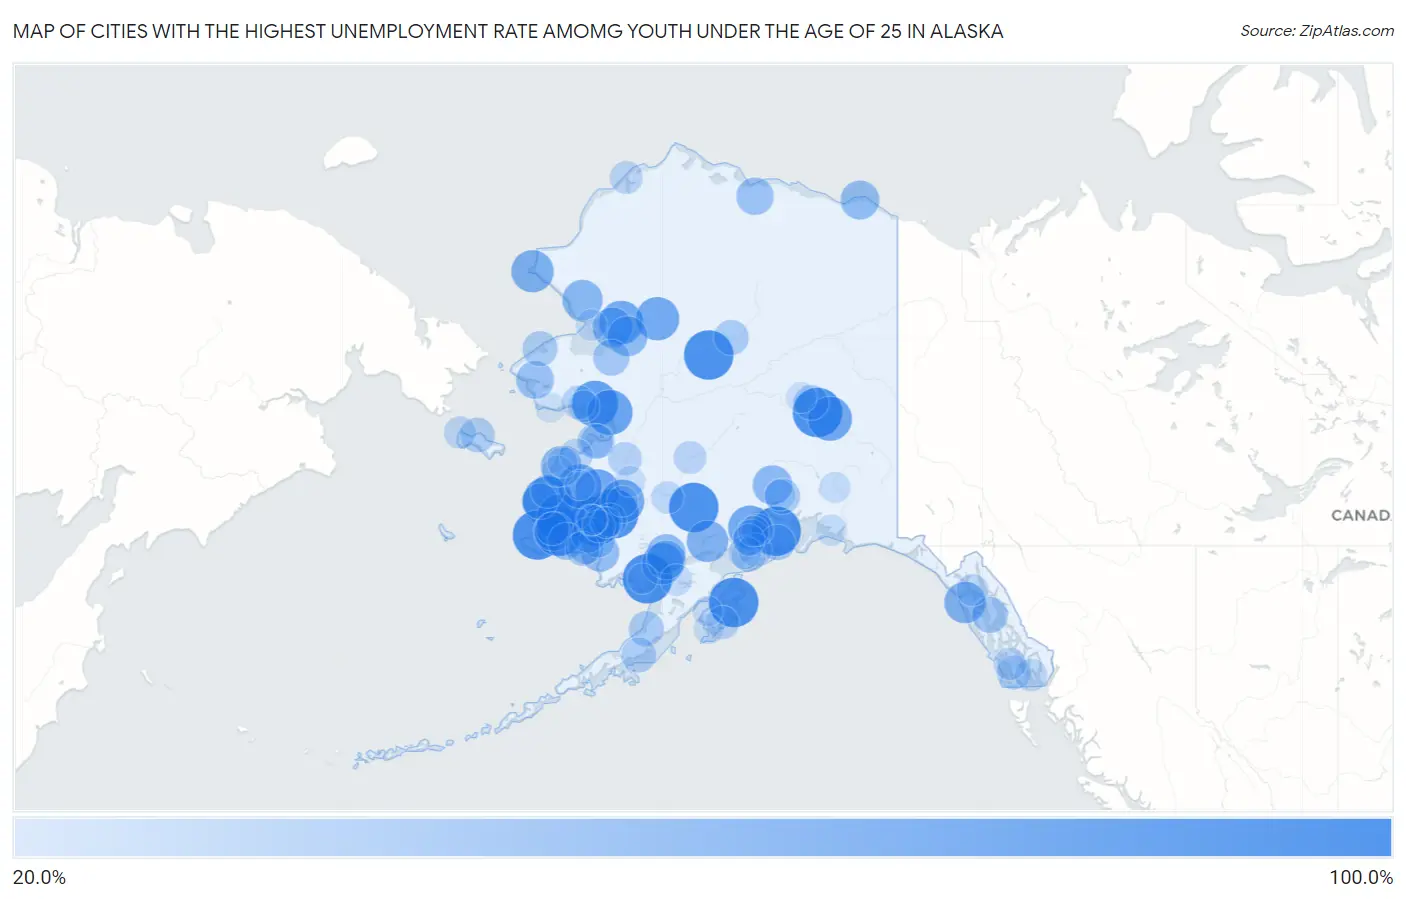
Map of Cities with the Highest Unemployment Rate Amomg Youth Under the Age of 25 in Alaska
0.0%
100.0%
Cities with the Highest Unemployment Rate Amomg Youth Under the Age of 25 in Alaska
| City | Youth Unemployment | vs State | vs National | |
| 1. | Moose Pass | 100.0% | 12.6%(+87.4)#1 | 10.9%(+89.1)#21 |
| 2. | Tuluksak | 100.0% | 12.6%(+87.4)#2 | 10.9%(+89.1)#114 |
| 3. | Chevak | 100.0% | 12.6%(+87.4)#3 | 10.9%(+89.1)#117 |
| 4. | Mekoryuk | 100.0% | 12.6%(+87.4)#4 | 10.9%(+89.1)#144 |
| 5. | Harding Birch Lakes | 100.0% | 12.6%(+87.4)#5 | 10.9%(+89.1)#155 |
| 6. | Ouzinkie | 100.0% | 12.6%(+87.4)#6 | 10.9%(+89.1)#276 |
| 7. | Hughes | 100.0% | 12.6%(+87.4)#7 | 10.9%(+89.1)#315 |
| 8. | Atmautluak | 100.0% | 12.6%(+87.4)#8 | 10.9%(+89.1)#316 |
| 9. | Clark S Point | 100.0% | 12.6%(+87.4)#9 | 10.9%(+89.1)#317 |
| 10. | Lime Village | 100.0% | 12.6%(+87.4)#10 | 10.9%(+89.1)#321 |
| 11. | Nightmute | 99.9% | 12.6%(+87.3)#11 | 10.9%(+89.0)#365 |
| 12. | Newtok | 99.8% | 12.6%(+87.2)#12 | 10.9%(+88.9)#376 |
| 13. | Elim | 85.7% | 12.6%(+73.1)#13 | 10.9%(+74.8)#425 |
| 14. | Shaktoolik | 81.8% | 12.6%(+69.2)#14 | 10.9%(+70.9)#447 |
| 15. | Big Delta | 77.5% | 12.6%(+64.9)#15 | 10.9%(+66.6)#483 |
| 16. | Marshall | 76.9% | 12.6%(+64.3)#16 | 10.9%(+66.0)#487 |
| 17. | Pitkas Point | 76.4% | 12.6%(+63.8)#17 | 10.9%(+65.5)#492 |
| 18. | Salamatof | 75.6% | 12.6%(+63.0)#18 | 10.9%(+64.7)#503 |
| 19. | Kiana | 75.0% | 12.6%(+62.4)#19 | 10.9%(+64.1)#508 |
| 20. | Ambler | 74.9% | 12.6%(+62.3)#20 | 10.9%(+64.0)#521 |
| 21. | Lower Kalskag | 74.9% | 12.6%(+62.3)#21 | 10.9%(+64.0)#522 |
| 22. | Point Hope | 69.9% | 12.6%(+57.3)#22 | 10.9%(+59.0)#587 |
| 23. | Port Alsworth | 66.6% | 12.6%(+54.0)#23 | 10.9%(+55.7)#646 |
| 24. | Pelican | 66.6% | 12.6%(+54.0)#24 | 10.9%(+55.7)#654 |
| 25. | Ekwok | 66.6% | 12.6%(+54.0)#25 | 10.9%(+55.7)#655 |
| 26. | Alakanuk | 62.7% | 12.6%(+50.1)#26 | 10.9%(+51.8)#716 |
| 27. | Noatak | 61.5% | 12.6%(+48.9)#27 | 10.9%(+50.6)#736 |
| 28. | Noorvik | 59.9% | 12.6%(+47.3)#28 | 10.9%(+49.0)#780 |
| 29. | Selawik | 59.9% | 12.6%(+47.3)#29 | 10.9%(+49.0)#781 |
| 30. | Susitna North | 58.3% | 12.6%(+45.7)#30 | 10.9%(+47.4)#814 |
| 31. | Toksook Bay | 57.5% | 12.6%(+44.9)#31 | 10.9%(+46.6)#840 |
| 32. | Koliganek | 56.2% | 12.6%(+43.6)#32 | 10.9%(+45.3)#882 |
| 33. | New Stuyahok | 55.5% | 12.6%(+42.9)#33 | 10.9%(+44.6)#900 |
| 34. | Kaktovik | 55.5% | 12.6%(+42.9)#34 | 10.9%(+44.6)#908 |
| 35. | Mill Bay | 55.3% | 12.6%(+42.7)#35 | 10.9%(+44.4)#915 |
| 36. | Quinhagak | 53.6% | 12.6%(+41.0)#36 | 10.9%(+42.7)#970 |
| 37. | Brevig Mission | 51.3% | 12.6%(+38.7)#37 | 10.9%(+40.4)#1,049 |
| 38. | Napaskiak | 49.9% | 12.6%(+37.3)#38 | 10.9%(+39.0)#1,168 |
| 39. | Nuiqsut | 49.3% | 12.6%(+36.7)#39 | 10.9%(+38.4)#1,202 |
| 40. | Chefornak | 48.3% | 12.6%(+35.7)#40 | 10.9%(+37.4)#1,231 |
| 41. | Buckland | 44.7% | 12.6%(+32.1)#41 | 10.9%(+33.8)#1,381 |
| 42. | Angoon | 44.0% | 12.6%(+31.4)#42 | 10.9%(+33.1)#1,416 |
| 43. | Cohoe | 42.8% | 12.6%(+30.2)#43 | 10.9%(+31.9)#1,497 |
| 44. | Hooper Bay | 42.8% | 12.6%(+30.2)#44 | 10.9%(+31.9)#1,501 |
| 45. | Kongiganak | 42.8% | 12.6%(+30.2)#45 | 10.9%(+31.9)#1,514 |
| 46. | Seward | 41.7% | 12.6%(+29.1)#46 | 10.9%(+30.8)#1,582 |
| 47. | Buffalo Soapstone | 41.1% | 12.6%(+28.5)#47 | 10.9%(+30.2)#1,632 |
| 48. | Stebbins | 40.6% | 12.6%(+28.0)#48 | 10.9%(+29.7)#1,664 |
| 49. | Shishmaref | 40.0% | 12.6%(+27.4)#49 | 10.9%(+29.1)#1,690 |
| 50. | Allakaket | 40.0% | 12.6%(+27.4)#50 | 10.9%(+29.1)#1,698 |
| 51. | Port Heiden | 40.0% | 12.6%(+27.4)#51 | 10.9%(+29.1)#1,716 |
| 52. | Eek | 39.9% | 12.6%(+27.3)#52 | 10.9%(+29.0)#1,729 |
| 53. | Tuntutuliak | 39.6% | 12.6%(+27.0)#53 | 10.9%(+28.7)#1,743 |
| 54. | Eielson Afb | 39.0% | 12.6%(+26.4)#54 | 10.9%(+28.1)#1,777 |
| 55. | Savoonga | 39.0% | 12.6%(+26.4)#55 | 10.9%(+28.1)#1,784 |
| 56. | Perryville | 38.4% | 12.6%(+25.8)#56 | 10.9%(+27.5)#1,822 |
| 57. | Kwigillingok | 36.6% | 12.6%(+24.0)#57 | 10.9%(+25.7)#1,967 |
| 58. | St Michael | 36.6% | 12.6%(+24.0)#58 | 10.9%(+25.7)#1,969 |
| 59. | Hydaburg | 36.3% | 12.6%(+23.7)#59 | 10.9%(+25.4)#1,989 |
| 60. | White Mountain | 35.0% | 12.6%(+22.4)#60 | 10.9%(+24.1)#2,115 |
| 61. | Kachemak | 34.5% | 12.6%(+21.9)#61 | 10.9%(+23.6)#2,155 |
| 62. | Scammon Bay | 34.0% | 12.6%(+21.4)#62 | 10.9%(+23.1)#2,202 |
| 63. | Akiak | 33.3% | 12.6%(+20.7)#63 | 10.9%(+22.4)#2,300 |
| 64. | Grayling | 33.3% | 12.6%(+20.7)#64 | 10.9%(+22.4)#2,316 |
| 65. | Old Harbor | 33.3% | 12.6%(+20.7)#65 | 10.9%(+22.4)#2,326 |
| 66. | Fox River | 32.8% | 12.6%(+20.2)#66 | 10.9%(+21.9)#2,373 |
| 67. | Tununak | 31.6% | 12.6%(+19.0)#67 | 10.9%(+20.7)#2,495 |
| 68. | Anchor Point | 31.3% | 12.6%(+18.7)#68 | 10.9%(+20.4)#2,532 |
| 69. | Wainwright | 31.2% | 12.6%(+18.6)#69 | 10.9%(+20.3)#2,542 |
| 70. | Mcgrath | 31.2% | 12.6%(+18.6)#70 | 10.9%(+20.3)#2,550 |
| 71. | Kotlik | 31.1% | 12.6%(+18.5)#71 | 10.9%(+20.2)#2,557 |
| 72. | Metlakatla | 29.7% | 12.6%(+17.1)#72 | 10.9%(+18.8)#2,730 |
| 73. | Klawock | 29.2% | 12.6%(+16.6)#73 | 10.9%(+18.3)#2,794 |
| 74. | Gambell | 28.9% | 12.6%(+16.3)#74 | 10.9%(+18.0)#2,827 |
| 75. | Napakiak | 28.5% | 12.6%(+15.9)#75 | 10.9%(+17.6)#2,875 |
| 76. | Sleetmute | 28.5% | 12.6%(+15.9)#76 | 10.9%(+17.6)#2,902 |
| 77. | Gustavus | 27.7% | 12.6%(+15.1)#77 | 10.9%(+16.8)#3,011 |
| 78. | Sterling | 27.5% | 12.6%(+14.9)#78 | 10.9%(+16.6)#3,029 |
| 79. | Clam Gulch | 26.3% | 12.6%(+13.7)#79 | 10.9%(+15.4)#3,255 |
| 80. | Golovin | 26.0% | 12.6%(+13.4)#80 | 10.9%(+15.1)#3,314 |
| 81. | King Salmon | 25.9% | 12.6%(+13.3)#81 | 10.9%(+15.0)#3,330 |
| 82. | Nunam Iqua | 25.0% | 12.6%(+12.4)#82 | 10.9%(+14.1)#3,513 |
| 83. | Kasigluk | 24.9% | 12.6%(+12.3)#83 | 10.9%(+14.0)#3,540 |
| 84. | Kotzebue | 24.8% | 12.6%(+12.2)#84 | 10.9%(+13.9)#3,557 |
| 85. | Cordova | 24.7% | 12.6%(+12.1)#85 | 10.9%(+13.8)#3,572 |
| 86. | Fishhook | 23.9% | 12.6%(+11.3)#86 | 10.9%(+13.0)#3,709 |
| 87. | Copper Center | 23.8% | 12.6%(+11.2)#87 | 10.9%(+12.9)#3,757 |
| 88. | Kwethluk | 23.7% | 12.6%(+11.1)#88 | 10.9%(+12.8)#3,775 |
| 89. | Utqiagvik | 23.5% | 12.6%(+10.9)#89 | 10.9%(+12.6)#3,807 |
| 90. | South Van Horn | 23.0% | 12.6%(+10.4)#90 | 10.9%(+12.1)#3,939 |
| 91. | Holy Cross | 23.0% | 12.6%(+10.4)#91 | 10.9%(+12.1)#3,947 |
| 92. | Upper Kalskag | 23.0% | 12.6%(+10.4)#92 | 10.9%(+12.1)#3,950 |
| 93. | Akhiok | 22.2% | 12.6%(+9.60)#93 | 10.9%(+11.3)#4,173 |
| 94. | Soldotna | 21.5% | 12.6%(+8.90)#94 | 10.9%(+10.6)#4,303 |
| 95. | Karluk | 21.4% | 12.6%(+8.80)#95 | 10.9%(+10.5)#4,356 |
| 96. | Emmonak | 20.6% | 12.6%(+8.00)#96 | 10.9%(+9.70)#4,549 |
| 97. | Manokotak | 20.6% | 12.6%(+8.00)#97 | 10.9%(+9.70)#4,553 |
| 98. | St Mary S | 20.3% | 12.6%(+7.70)#98 | 10.9%(+9.40)#4,630 |
| 99. | Nunapitchuk | 20.3% | 12.6%(+7.70)#99 | 10.9%(+9.40)#4,632 |
| 100. | Nome | 20.2% | 12.6%(+7.60)#100 | 10.9%(+9.30)#4,647 |
1
2Common Questions
What are the Top 10 Cities with the Highest Unemployment Rate Amomg Youth Under the Age of 25 in Alaska?
Top 10 Cities with the Highest Unemployment Rate Amomg Youth Under the Age of 25 in Alaska are:
#1
100.0%
#2
100.0%
#3
100.0%
#4
100.0%
#5
100.0%
#6
100.0%
#7
100.0%
#8
100.0%
#9
100.0%
#10
100.0%
What city has the Highest Unemployment Rate Amomg Youth Under the Age of 25 in Alaska?
Moose Pass has the Highest Unemployment Rate Amomg Youth Under the Age of 25 in Alaska with 100.0%.
What is the Unemployment Rate Amomg Youth Under the Age of 25 in the State of Alaska?
Unemployment Rate Amomg Youth Under the Age of 25 in Alaska is 12.6%.
What is the Unemployment Rate Amomg Youth Under the Age of 25 in the United States?
Unemployment Rate Amomg Youth Under the Age of 25 in the United States is 10.9%.