Cedarville, CA Map & Demographics
Cedarville Map
Cedarville Overview
$27,402
PER CAPITA INCOME
$45,568
AVG HOUSEHOLD INCOME
0.42
INEQUALITY / GINI INDEX
783
TOTAL POPULATION
330
MALE POPULATION
453
FEMALE POPULATION
72.85
MALES / 100 FEMALES
137.27
FEMALES / 100 MALES
45.3
MEDIAN AGE
2.8
AVG FAMILY SIZE
2.3
AVG HOUSEHOLD SIZE
330
LABOR FORCE [ PEOPLE ]
53.2%
PERCENT IN LABOR FORCE
10.6%
UNEMPLOYMENT RATE
Cedarville Zip Codes
Cedarville Area Codes
Income in Cedarville
Income Overview in Cedarville
| Characteristic | Number | Measure |
| Per Capita Income | 783 | $27,402 |
| Median Family Income | 220 | $0 |
| Mean Family Income | 220 | $79,688 |
| Median Household Income | 330 | $45,568 |
| Mean Household Income | 330 | $63,860 |
| Income Deficit | 220 | $0 |
| Wage / Income Gap (%) | 783 | 0.00% |
| Wage / Income Gap ($) | 783 | 100.00¢ per $1 |
| Gini / Inequality Index | 783 | 0.42 |
Earnings by Sex in Cedarville
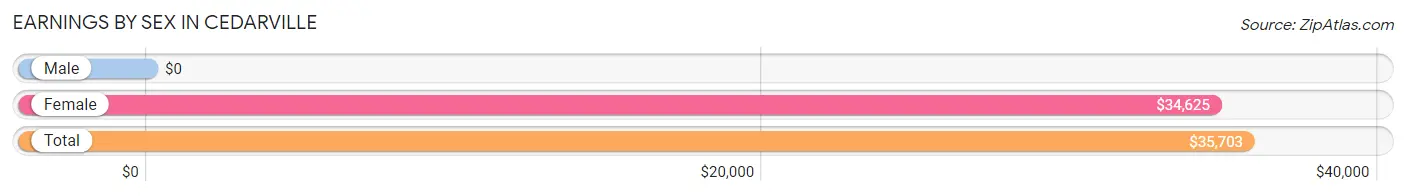
| Sex | Number | Average Earnings |
| Male | 136 (39.7%) | $0 |
| Female | 207 (60.4%) | $34,625 |
| Total | 343 (100.0%) | $35,703 |
Earnings by Sex by Income Bracket in Cedarville
The most common earnings brackets in Cedarville are $10,000 to $12,499 for men (37 | 27.2%) and $40,000 to $44,999 for women (38 | 18.4%).
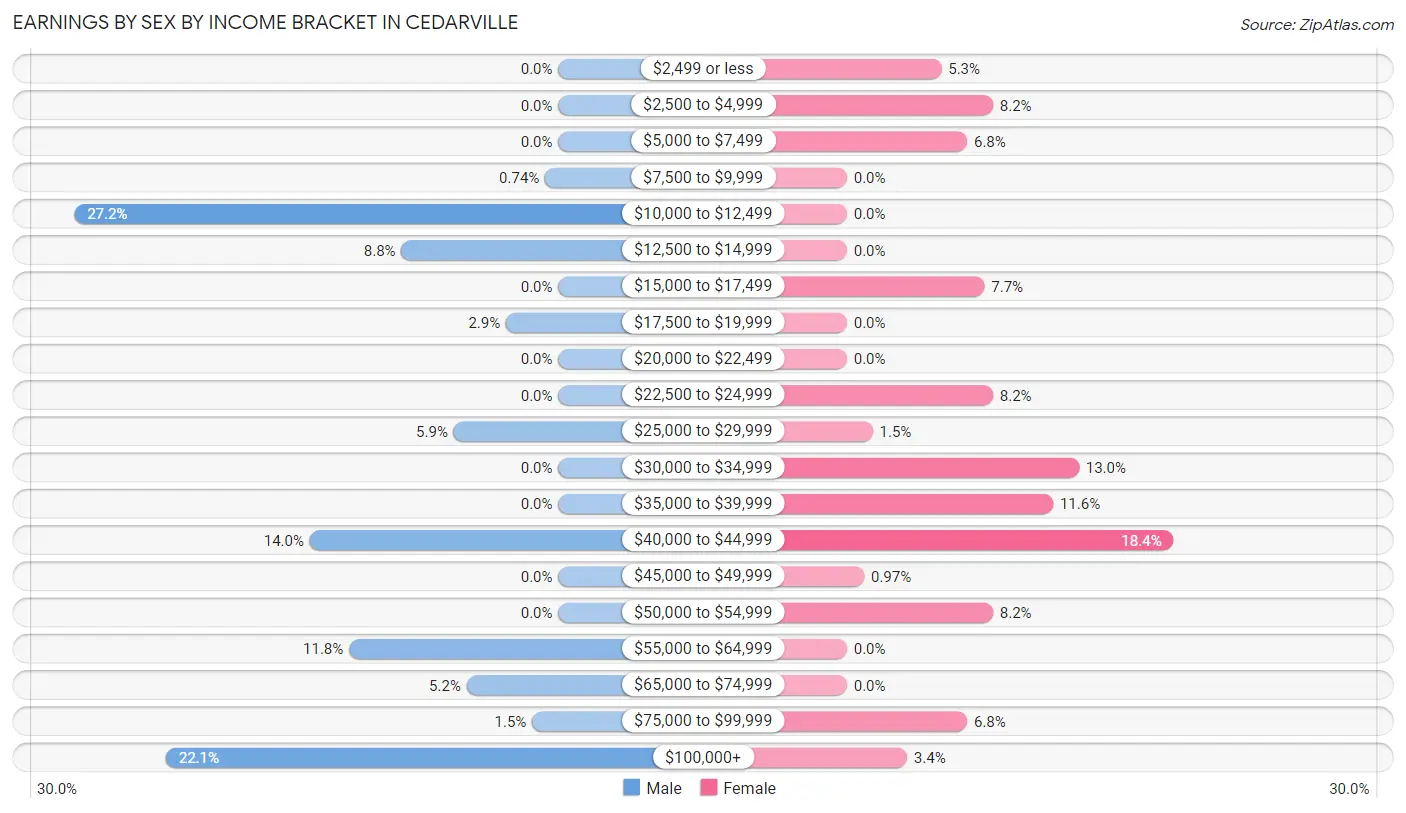
| Income | Male | Female |
| $2,499 or less | 0 (0.0%) | 11 (5.3%) |
| $2,500 to $4,999 | 0 (0.0%) | 17 (8.2%) |
| $5,000 to $7,499 | 0 (0.0%) | 14 (6.8%) |
| $7,500 to $9,999 | 1 (0.7%) | 0 (0.0%) |
| $10,000 to $12,499 | 37 (27.2%) | 0 (0.0%) |
| $12,500 to $14,999 | 12 (8.8%) | 0 (0.0%) |
| $15,000 to $17,499 | 0 (0.0%) | 16 (7.7%) |
| $17,500 to $19,999 | 4 (2.9%) | 0 (0.0%) |
| $20,000 to $22,499 | 0 (0.0%) | 0 (0.0%) |
| $22,500 to $24,999 | 0 (0.0%) | 17 (8.2%) |
| $25,000 to $29,999 | 8 (5.9%) | 3 (1.5%) |
| $30,000 to $34,999 | 0 (0.0%) | 27 (13.0%) |
| $35,000 to $39,999 | 0 (0.0%) | 24 (11.6%) |
| $40,000 to $44,999 | 19 (14.0%) | 38 (18.4%) |
| $45,000 to $49,999 | 0 (0.0%) | 2 (1.0%) |
| $50,000 to $54,999 | 0 (0.0%) | 17 (8.2%) |
| $55,000 to $64,999 | 16 (11.8%) | 0 (0.0%) |
| $65,000 to $74,999 | 7 (5.1%) | 0 (0.0%) |
| $75,000 to $99,999 | 2 (1.5%) | 14 (6.8%) |
| $100,000+ | 30 (22.1%) | 7 (3.4%) |
| Total | 136 (100.0%) | 207 (100.0%) |
Earnings by Sex by Educational Attainment in Cedarville
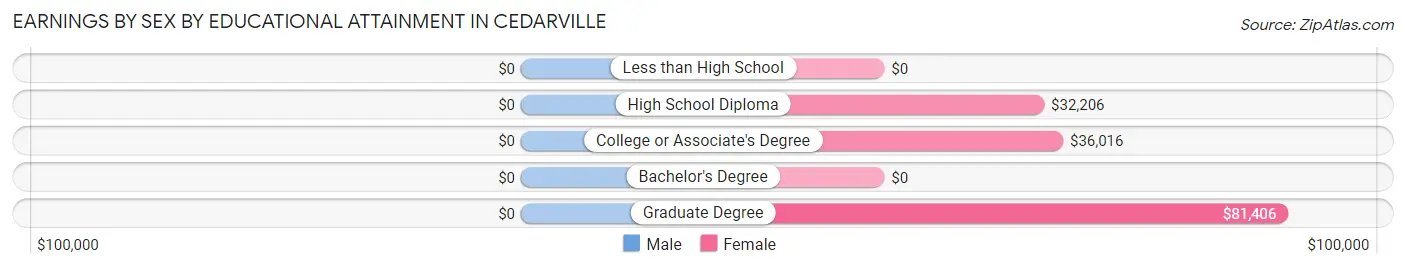
| Educational Attainment | Male Income | Female Income |
| Less than High School | - | - |
| High School Diploma | - | - |
| College or Associate's Degree | - | - |
| Bachelor's Degree | - | - |
| Graduate Degree | - | - |
| Total | - | - |
Family Income in Cedarville
Family Income Brackets in Cedarville
According to the Cedarville family income data, there are 80 families falling into the $35,000 to $49,999 income range, which is the most common income bracket and makes up 36.4% of all families.
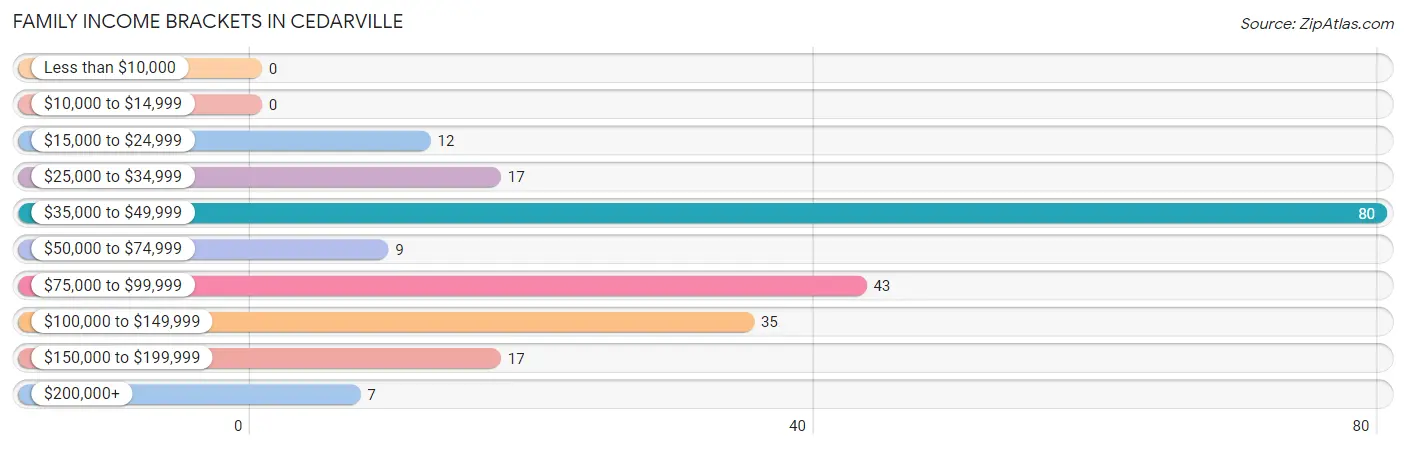
| Income Bracket | # Families | % Families |
| Less than $10,000 | 0 | 0.0% |
| $10,000 to $14,999 | 0 | 0.0% |
| $15,000 to $24,999 | 12 | 5.5% |
| $25,000 to $34,999 | 17 | 7.7% |
| $35,000 to $49,999 | 80 | 36.4% |
| $50,000 to $74,999 | 9 | 4.1% |
| $75,000 to $99,999 | 43 | 19.5% |
| $100,000 to $149,999 | 35 | 15.9% |
| $150,000 to $199,999 | 17 | 7.7% |
| $200,000+ | 7 | 3.2% |
Family Income by Famaliy Size in Cedarville
3-person families (33 | 15.0%) account for the highest median family income in Cedarville with $41,375 per family, while 3-person families (33 | 15.0%) have the highest median income of $13,792 per family member.
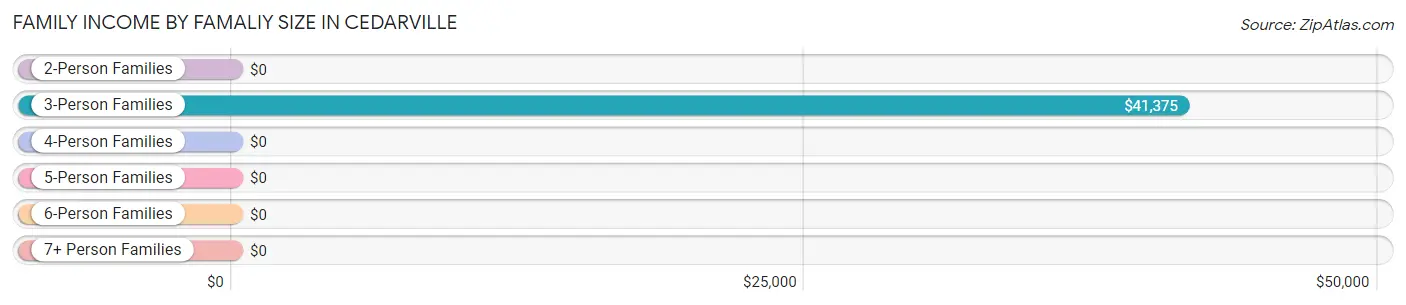
| Income Bracket | # Families | Median Income |
| 2-Person Families | 118 (53.6%) | $0 |
| 3-Person Families | 33 (15.0%) | $41,375 |
| 4-Person Families | 54 (24.5%) | $0 |
| 5-Person Families | 0 (0.0%) | $0 |
| 6-Person Families | 15 (6.8%) | $0 |
| 7+ Person Families | 0 (0.0%) | $0 |
| Total | 220 (100.0%) | $0 |
Family Income by Number of Earners in Cedarville
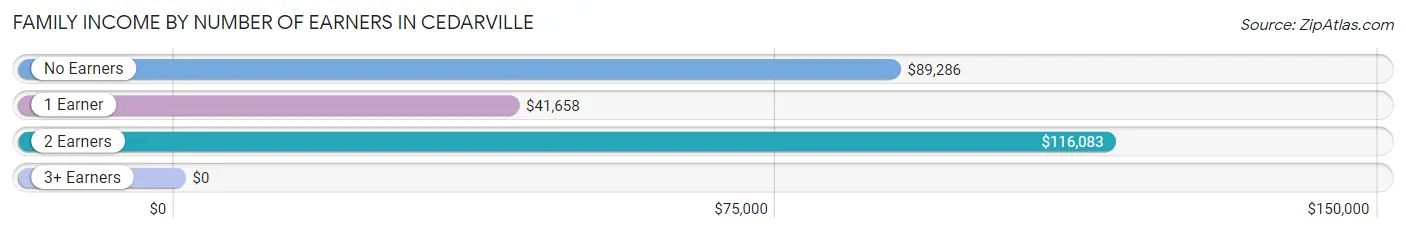
| Number of Earners | # Families | Median Income |
| No Earners | 62 (28.2%) | $89,286 |
| 1 Earner | 65 (29.5%) | $41,658 |
| 2 Earners | 93 (42.3%) | $116,083 |
| 3+ Earners | 0 (0.0%) | $0 |
| Total | 220 (100.0%) | $0 |
Household Income in Cedarville
Household Income Brackets in Cedarville
With 85 households falling in the category, the $35,000 to $49,999 income range is the most frequent in Cedarville, accounting for 25.8% of all households.
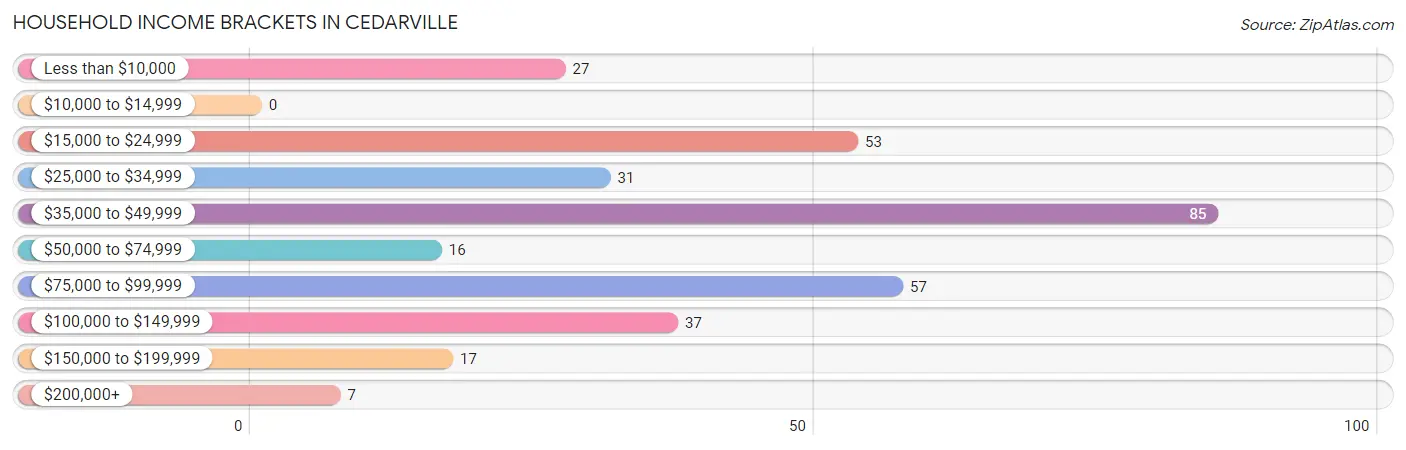
| Income Bracket | # Households | % Households |
| Less than $10,000 | 27 | 8.2% |
| $10,000 to $14,999 | 0 | 0.0% |
| $15,000 to $24,999 | 53 | 16.1% |
| $25,000 to $34,999 | 31 | 9.4% |
| $35,000 to $49,999 | 85 | 25.8% |
| $50,000 to $74,999 | 16 | 4.8% |
| $75,000 to $99,999 | 57 | 17.3% |
| $100,000 to $149,999 | 37 | 11.2% |
| $150,000 to $199,999 | 17 | 5.2% |
| $200,000+ | 7 | 2.1% |
Household Income by Householder Age in Cedarville
The median household income in Cedarville is $45,568, with the highest median household income of $116,750 found in the 25 to 44 years age bracket for the primary householder. A total of 71 households (21.5%) fall into this category. Meanwhile, the 15 to 24 years age bracket for the primary householder has the lowest median household income of $0, with 6 households (1.8%) in this group.
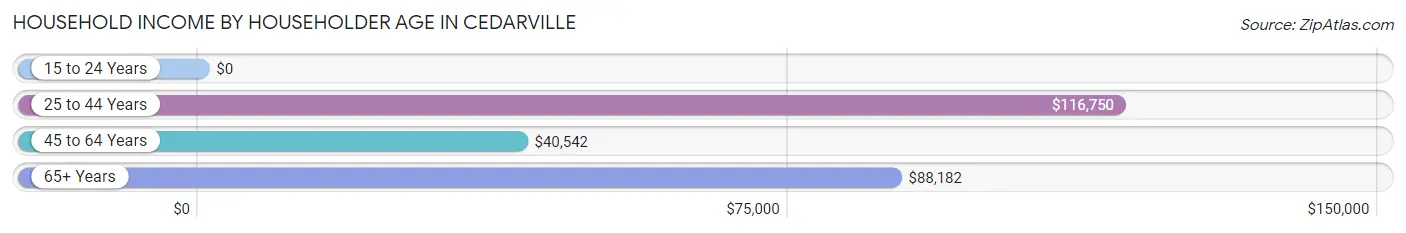
| Income Bracket | # Households | Median Income |
| 15 to 24 Years | 6 (1.8%) | $0 |
| 25 to 44 Years | 71 (21.5%) | $116,750 |
| 45 to 64 Years | 151 (45.8%) | $40,542 |
| 65+ Years | 102 (30.9%) | $88,182 |
| Total | 330 (100.0%) | $45,568 |
Poverty in Cedarville
Income Below Poverty by Sex and Age in Cedarville
With 11.3% poverty level for males and 7.6% for females among the residents of Cedarville, 55 to 64 year old males and 18 to 24 year old females are the most vulnerable to poverty, with 37 males (58.7%) and 7 females (53.8%) in their respective age groups living below the poverty level.
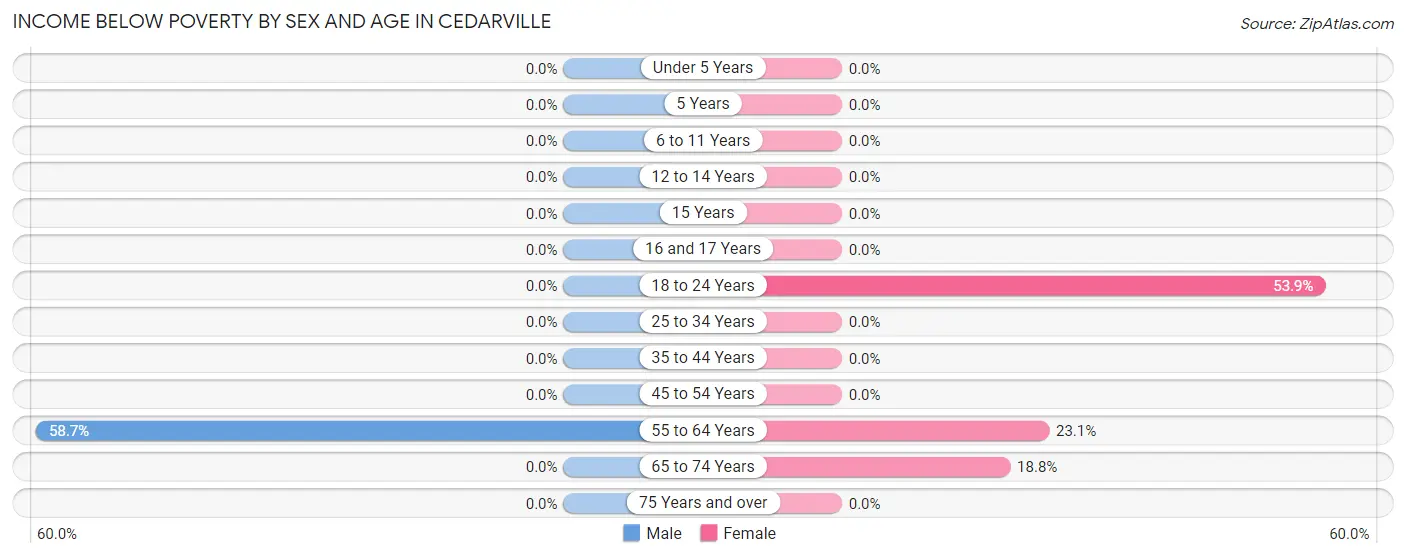
| Age Bracket | Male | Female |
| Under 5 Years | 0 (0.0%) | 0 (0.0%) |
| 5 Years | 0 (0.0%) | 0 (0.0%) |
| 6 to 11 Years | 0 (0.0%) | 0 (0.0%) |
| 12 to 14 Years | 0 (0.0%) | 0 (0.0%) |
| 15 Years | 0 (0.0%) | 0 (0.0%) |
| 16 and 17 Years | 0 (0.0%) | 0 (0.0%) |
| 18 to 24 Years | 0 (0.0%) | 7 (53.8%) |
| 25 to 34 Years | 0 (0.0%) | 0 (0.0%) |
| 35 to 44 Years | 0 (0.0%) | 0 (0.0%) |
| 45 to 54 Years | 0 (0.0%) | 0 (0.0%) |
| 55 to 64 Years | 37 (58.7%) | 18 (23.1%) |
| 65 to 74 Years | 0 (0.0%) | 9 (18.8%) |
| 75 Years and over | 0 (0.0%) | 0 (0.0%) |
| Total | 37 (11.3%) | 34 (7.6%) |
Income Above Poverty by Sex and Age in Cedarville
According to the poverty statistics in Cedarville, males aged under 5 years and females aged under 5 years are the age groups that are most secure financially, with 100.0% of males and 100.0% of females in these age groups living above the poverty line.
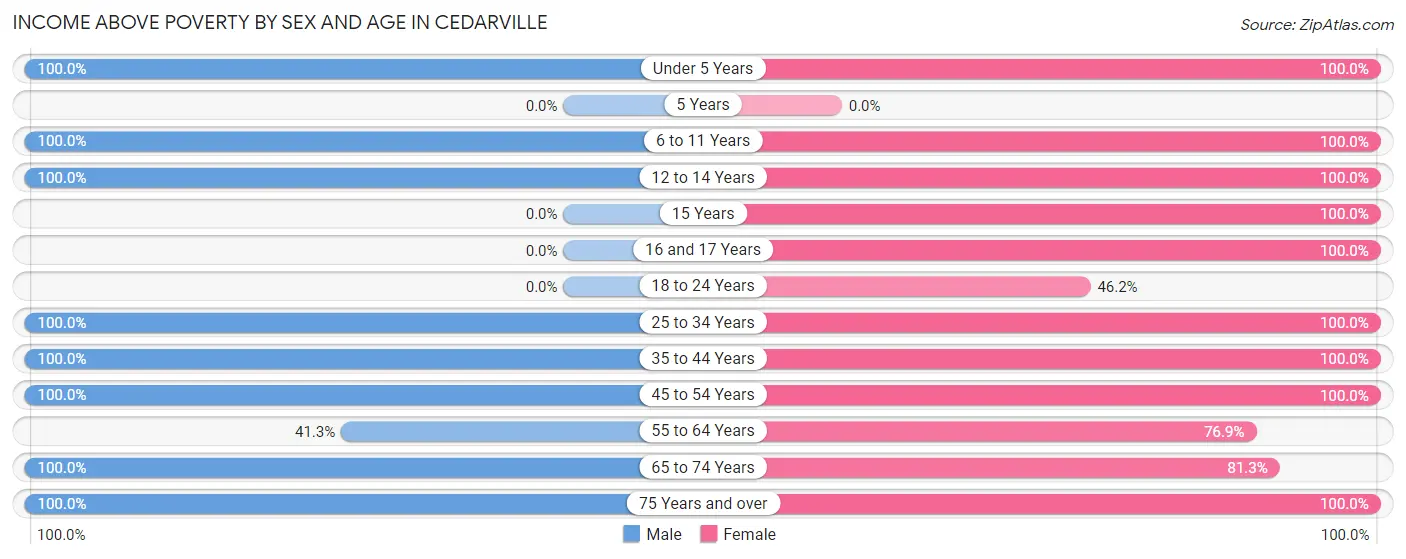
| Age Bracket | Male | Female |
| Under 5 Years | 8 (100.0%) | 15 (100.0%) |
| 5 Years | 0 (0.0%) | 0 (0.0%) |
| 6 to 11 Years | 67 (100.0%) | 14 (100.0%) |
| 12 to 14 Years | 2 (100.0%) | 37 (100.0%) |
| 15 Years | 0 (0.0%) | 20 (100.0%) |
| 16 and 17 Years | 0 (0.0%) | 52 (100.0%) |
| 18 to 24 Years | 0 (0.0%) | 6 (46.2%) |
| 25 to 34 Years | 18 (100.0%) | 3 (100.0%) |
| 35 to 44 Years | 68 (100.0%) | 63 (100.0%) |
| 45 to 54 Years | 43 (100.0%) | 70 (100.0%) |
| 55 to 64 Years | 26 (41.3%) | 60 (76.9%) |
| 65 to 74 Years | 46 (100.0%) | 39 (81.2%) |
| 75 Years and over | 14 (100.0%) | 37 (100.0%) |
| Total | 292 (88.7%) | 416 (92.4%) |
Income Below Poverty Among Married-Couple Families in Cedarville
| Children | Above Poverty | Below Poverty |
| No Children | 72 (100.0%) | 0 (0.0%) |
| 1 or 2 Children | 46 (100.0%) | 0 (0.0%) |
| 3 or 4 Children | 15 (100.0%) | 0 (0.0%) |
| 5 or more Children | 0 (0.0%) | 0 (0.0%) |
| Total | 133 (100.0%) | 0 (0.0%) |
Income Below Poverty Among Single-Parent Households in Cedarville
| Children | Single Father | Single Mother |
| No Children | 0 (0.0%) | 0 (0.0%) |
| 1 or 2 Children | 0 (0.0%) | 0 (0.0%) |
| 3 or 4 Children | 0 (0.0%) | 0 (0.0%) |
| 5 or more Children | 0 (0.0%) | 0 (0.0%) |
| Total | 0 (0.0%) | 0 (0.0%) |
Income Below Poverty Among Married-Couple vs Single-Parent Households in Cedarville
| Children | Married-Couple Families | Single-Parent Households |
| No Children | 0 (0.0%) | 0 (0.0%) |
| 1 or 2 Children | 0 (0.0%) | 0 (0.0%) |
| 3 or 4 Children | 0 (0.0%) | 0 (0.0%) |
| 5 or more Children | 0 (0.0%) | 0 (0.0%) |
| Total | 0 (0.0%) | 0 (0.0%) |
Race in Cedarville
The most populous races in Cedarville are White / Caucasian (692 | 88.4%), Hispanic or Latino (96 | 12.3%), and Some other Race (55 | 7.0%).
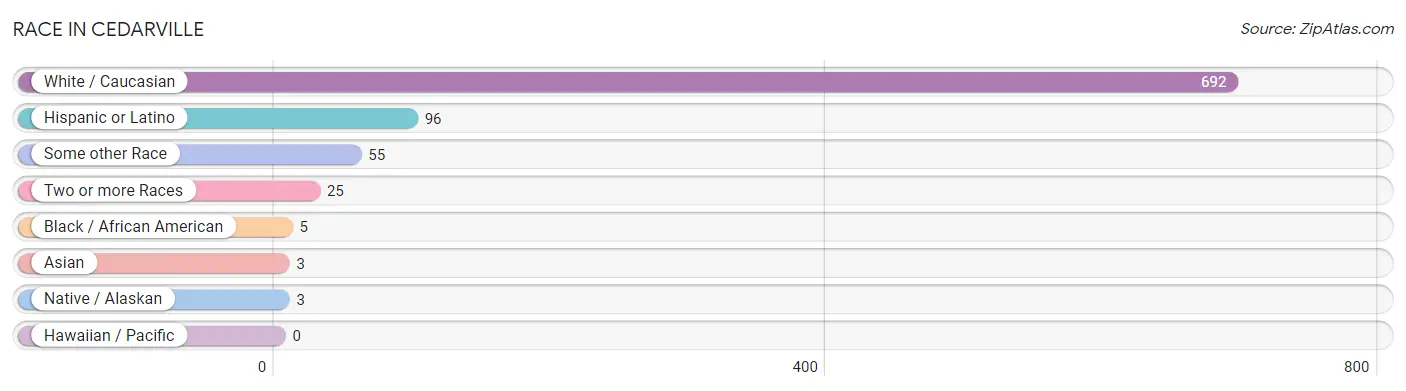
| Race | # Population | % Population |
| Asian | 3 | 0.4% |
| Black / African American | 5 | 0.6% |
| Hawaiian / Pacific | 0 | 0.0% |
| Hispanic or Latino | 96 | 12.3% |
| Native / Alaskan | 3 | 0.4% |
| White / Caucasian | 692 | 88.4% |
| Two or more Races | 25 | 3.2% |
| Some other Race | 55 | 7.0% |
| Total | 783 | 100.0% |
Ancestry in Cedarville
The most populous ancestries reported in Cedarville are Irish (210 | 26.8%), German (198 | 25.3%), Mexican (83 | 10.6%), English (80 | 10.2%), and Italian (51 | 6.5%), together accounting for 79.4% of all Cedarville residents.
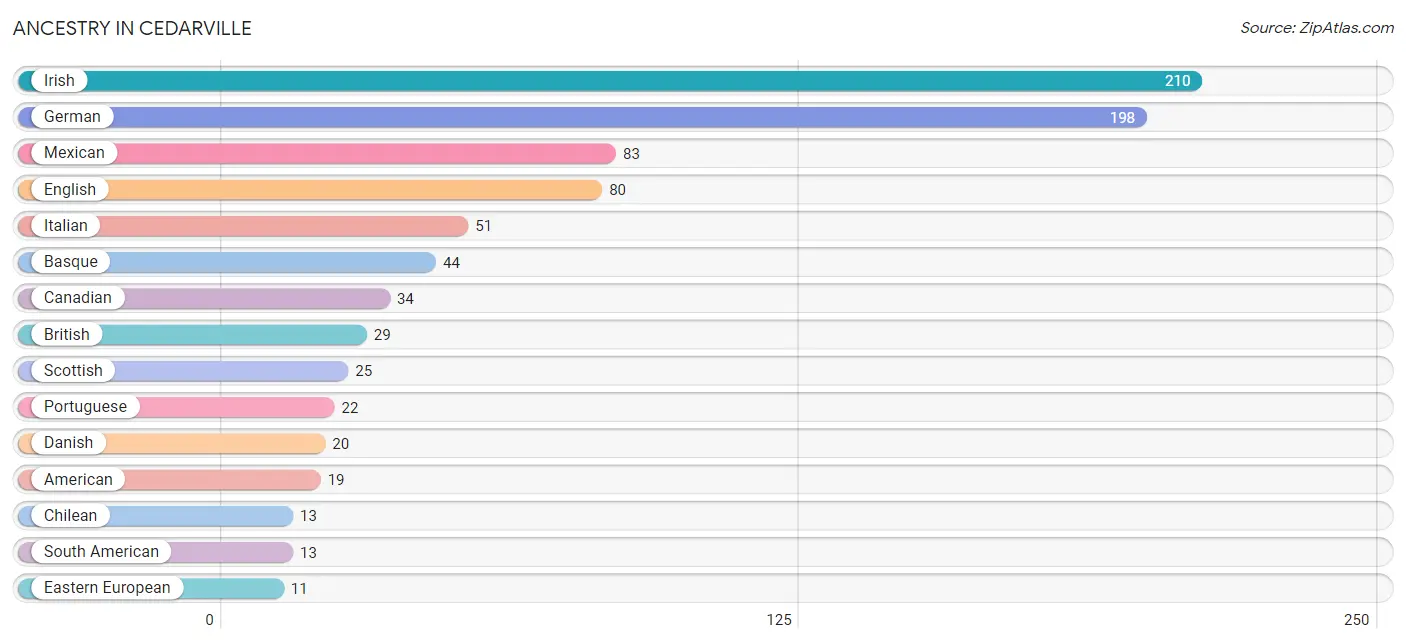
| Ancestry | # Population | % Population |
| American | 19 | 2.4% |
| Basque | 44 | 5.6% |
| British | 29 | 3.7% |
| Canadian | 34 | 4.3% |
| Chilean | 13 | 1.7% |
| Danish | 20 | 2.5% |
| Dutch | 9 | 1.1% |
| Eastern European | 11 | 1.4% |
| English | 80 | 10.2% |
| French | 2 | 0.3% |
| French Canadian | 8 | 1.0% |
| German | 198 | 25.3% |
| Irish | 210 | 26.8% |
| Italian | 51 | 6.5% |
| Kenyan | 1 | 0.1% |
| Mexican | 83 | 10.6% |
| Paiute | 8 | 1.0% |
| Portuguese | 22 | 2.8% |
| Scandinavian | 2 | 0.3% |
| Scotch-Irish | 9 | 1.1% |
| Scottish | 25 | 3.2% |
| South American | 13 | 1.7% |
| Sri Lankan | 3 | 0.4% |
| Subsaharan African | 1 | 0.1% | View All 24 Rows |
Immigrants in Cedarville
The most numerous immigrant groups reported in Cedarville came from Latin America (53 | 6.8%), Central America (49 | 6.3%), Mexico (48 | 6.1%), Chile (4 | 0.5%), and South America (4 | 0.5%), together accounting for 20.2% of all Cedarville residents.
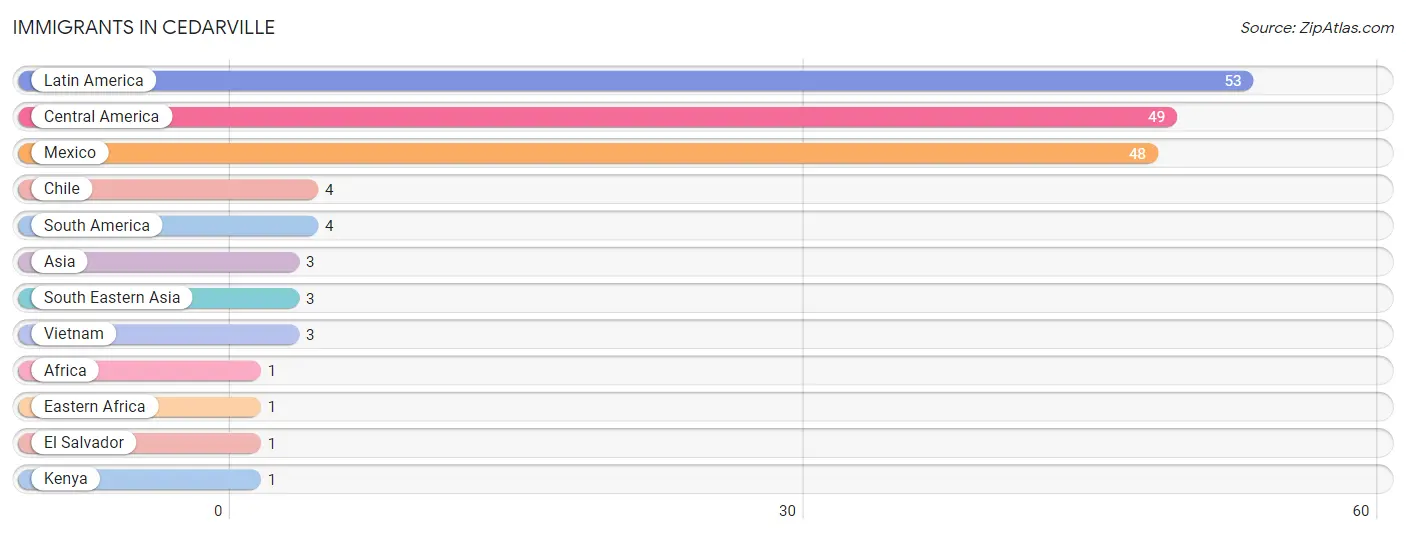
| Immigration Origin | # Population | % Population |
| Africa | 1 | 0.1% |
| Asia | 3 | 0.4% |
| Central America | 49 | 6.3% |
| Chile | 4 | 0.5% |
| Eastern Africa | 1 | 0.1% |
| El Salvador | 1 | 0.1% |
| Kenya | 1 | 0.1% |
| Latin America | 53 | 6.8% |
| Mexico | 48 | 6.1% |
| South America | 4 | 0.5% |
| South Eastern Asia | 3 | 0.4% |
| Vietnam | 3 | 0.4% | View All 12 Rows |
Sex and Age in Cedarville
Sex and Age in Cedarville
The most populous age groups in Cedarville are 60 to 64 Years (63 | 19.1%) for men and 15 to 19 Years (74 | 16.3%) for women.
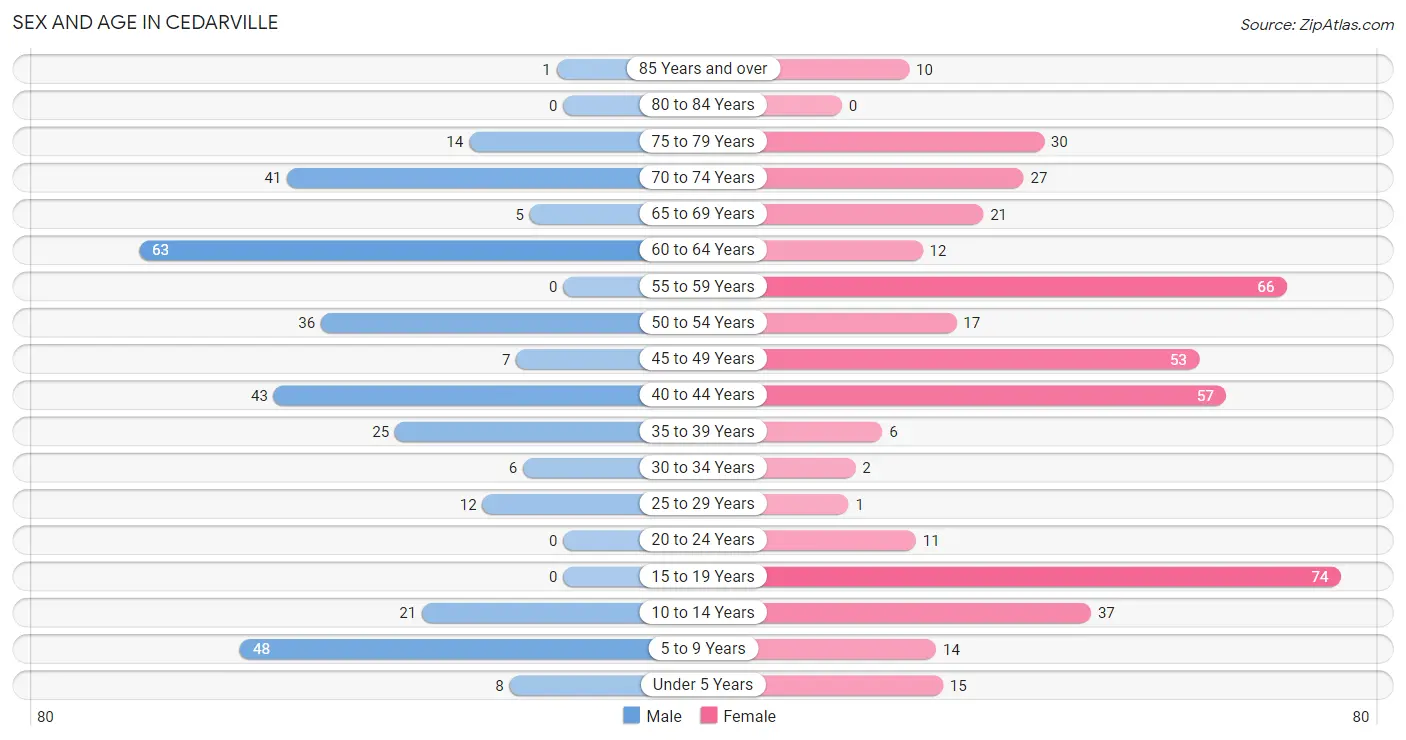
| Age Bracket | Male | Female |
| Under 5 Years | 8 (2.4%) | 15 (3.3%) |
| 5 to 9 Years | 48 (14.5%) | 14 (3.1%) |
| 10 to 14 Years | 21 (6.4%) | 37 (8.2%) |
| 15 to 19 Years | 0 (0.0%) | 74 (16.3%) |
| 20 to 24 Years | 0 (0.0%) | 11 (2.4%) |
| 25 to 29 Years | 12 (3.6%) | 1 (0.2%) |
| 30 to 34 Years | 6 (1.8%) | 2 (0.4%) |
| 35 to 39 Years | 25 (7.6%) | 6 (1.3%) |
| 40 to 44 Years | 43 (13.0%) | 57 (12.6%) |
| 45 to 49 Years | 7 (2.1%) | 53 (11.7%) |
| 50 to 54 Years | 36 (10.9%) | 17 (3.7%) |
| 55 to 59 Years | 0 (0.0%) | 66 (14.6%) |
| 60 to 64 Years | 63 (19.1%) | 12 (2.6%) |
| 65 to 69 Years | 5 (1.5%) | 21 (4.6%) |
| 70 to 74 Years | 41 (12.4%) | 27 (6.0%) |
| 75 to 79 Years | 14 (4.2%) | 30 (6.6%) |
| 80 to 84 Years | 0 (0.0%) | 0 (0.0%) |
| 85 Years and over | 1 (0.3%) | 10 (2.2%) |
| Total | 330 (100.0%) | 453 (100.0%) |
Families and Households in Cedarville
Median Family Size in Cedarville
The median family size in Cedarville is 2.77 persons per family, with married-couple families (133 | 60.5%) accounting for the largest median family size of 2.87 persons per family. On the other hand, single male/father families (14 | 6.4%) represent the smallest median family size with 2.14 persons per family.
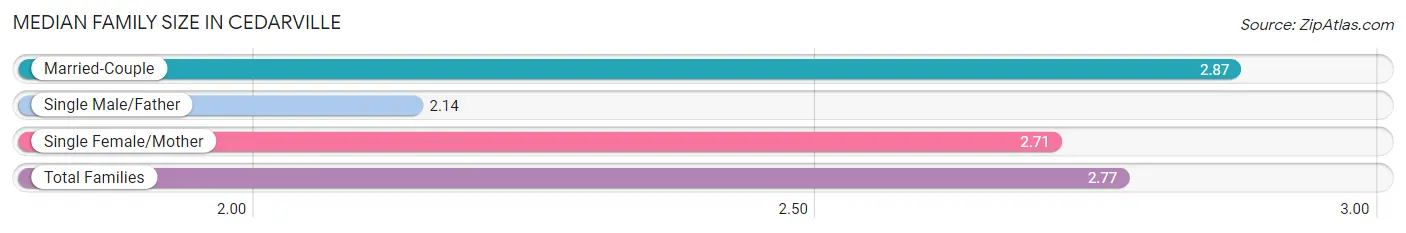
| Family Type | # Families | Family Size |
| Married-Couple | 133 (60.5%) | 2.87 |
| Single Male/Father | 14 (6.4%) | 2.14 |
| Single Female/Mother | 73 (33.2%) | 2.71 |
| Total Families | 220 (100.0%) | 2.77 |
Median Household Size in Cedarville
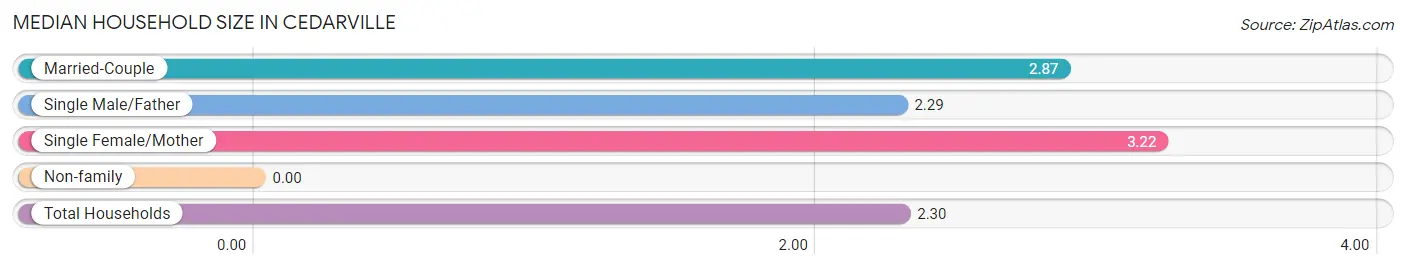
| Household Type | # Households | Household Size |
| Married-Couple | 133 (40.3%) | 2.87 |
| Single Male/Father | 14 (4.2%) | 2.29 |
| Single Female/Mother | 73 (22.1%) | 3.22 |
| Non-family | 110 (33.3%) | - |
| Total Households | 330 (100.0%) | 2.30 |
Household Size by Marriage Status in Cedarville
Out of a total of 330 households in Cedarville, 220 (66.7%) are family households, while 110 (33.3%) are nonfamily households. The most numerous type of family households are 2-person households, comprising 111, and the most common type of nonfamily households are 1-person households, comprising 110.
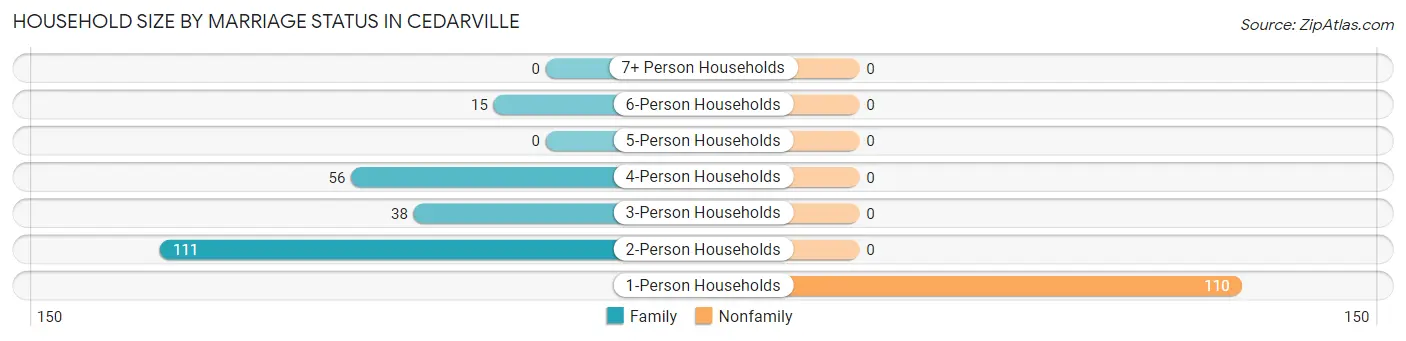
| Household Size | Family Households | Nonfamily Households |
| 1-Person Households | - | 110 (33.3%) |
| 2-Person Households | 111 (33.6%) | 0 (0.0%) |
| 3-Person Households | 38 (11.5%) | 0 (0.0%) |
| 4-Person Households | 56 (17.0%) | 0 (0.0%) |
| 5-Person Households | 0 (0.0%) | 0 (0.0%) |
| 6-Person Households | 15 (4.5%) | 0 (0.0%) |
| 7+ Person Households | 0 (0.0%) | 0 (0.0%) |
| Total | 220 (66.7%) | 110 (33.3%) |
Female Fertility in Cedarville
Fertility by Age in Cedarville
Average fertility rate in Cedarville is 25.0 births per 1,000 women. Women in the age bracket of 20 to 34 years have the highest fertility rate with 357.0 births per 1,000 women. Women in the age bracket of 20 to 34 years acount for 100.0% of all women with births.
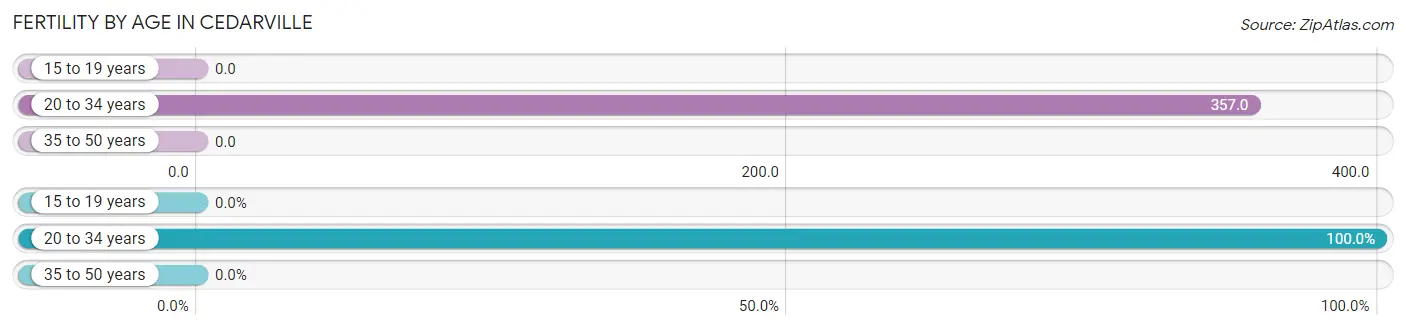
| Age Bracket | Women with Births | Births / 1,000 Women |
| 15 to 19 years | 0 (0.0%) | 0.0 |
| 20 to 34 years | 5 (100.0%) | 357.0 |
| 35 to 50 years | 0 (0.0%) | 0.0 |
| Total | 5 (100.0%) | 25.0 |
Fertility by Age by Marriage Status in Cedarville
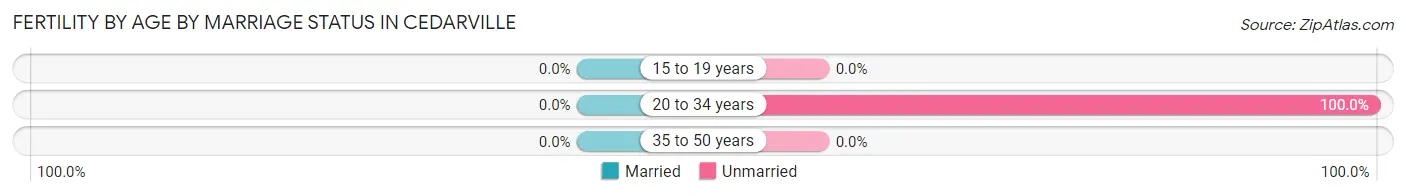
| Age Bracket | Married | Unmarried |
| 15 to 19 years | 0 (0.0%) | 0 (0.0%) |
| 20 to 34 years | 0 (0.0%) | 5 (100.0%) |
| 35 to 50 years | 0 (0.0%) | 0 (0.0%) |
| Total | 0 (0.0%) | 5 (100.0%) |
Fertility by Education in Cedarville
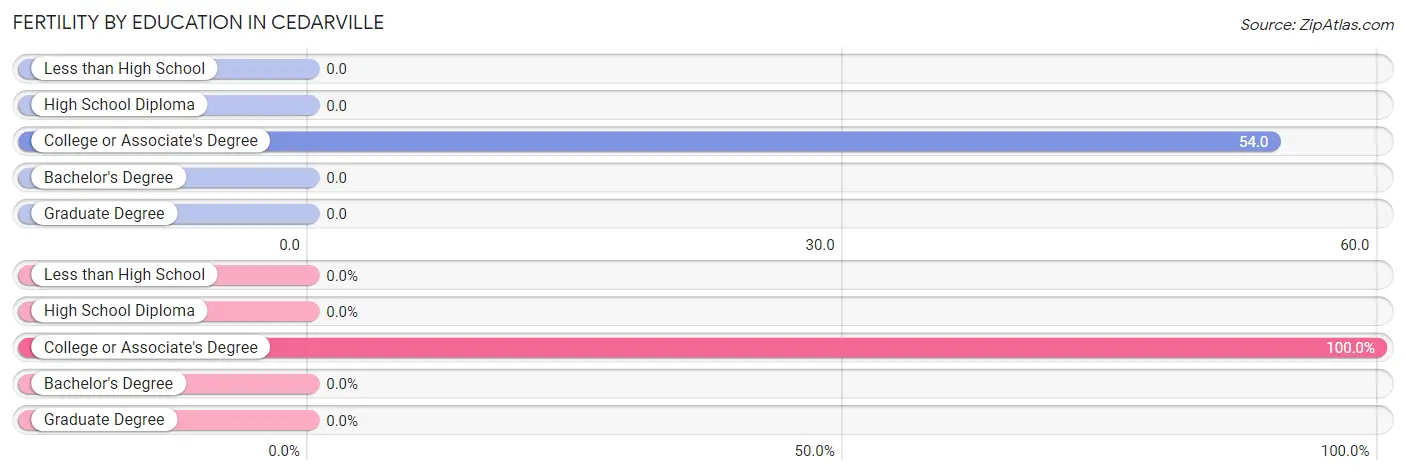
| Educational Attainment | Women with Births | Births / 1,000 Women |
| Less than High School | 0 (0.0%) | 0.0 |
| High School Diploma | 0 (0.0%) | 0.0 |
| College or Associate's Degree | 5 (100.0%) | 54.0 |
| Bachelor's Degree | 0 (0.0%) | 0.0 |
| Graduate Degree | 0 (0.0%) | 0.0 |
| Total | 5 (100.0%) | 25.0 |
Fertility by Education by Marriage Status in Cedarville
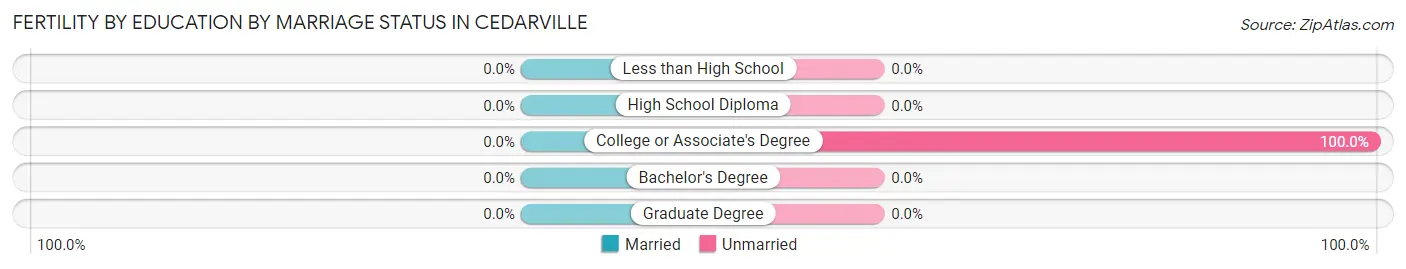
| Educational Attainment | Married | Unmarried |
| Less than High School | 0 (0.0%) | 0 (0.0%) |
| High School Diploma | 0 (0.0%) | 0 (0.0%) |
| College or Associate's Degree | 0 (0.0%) | 5 (100.0%) |
| Bachelor's Degree | 0 (0.0%) | 0 (0.0%) |
| Graduate Degree | 0 (0.0%) | 0 (0.0%) |
| Total | 0 (0.0%) | 5 (100.0%) |
Employment Characteristics in Cedarville
Employment by Class of Employer in Cedarville
Among the 295 employed individuals in Cedarville, self-employed (not incorporated) (79 | 26.8%), private company employees (77 | 26.1%), and state government employees (69 | 23.4%) make up the most common classes of employment.
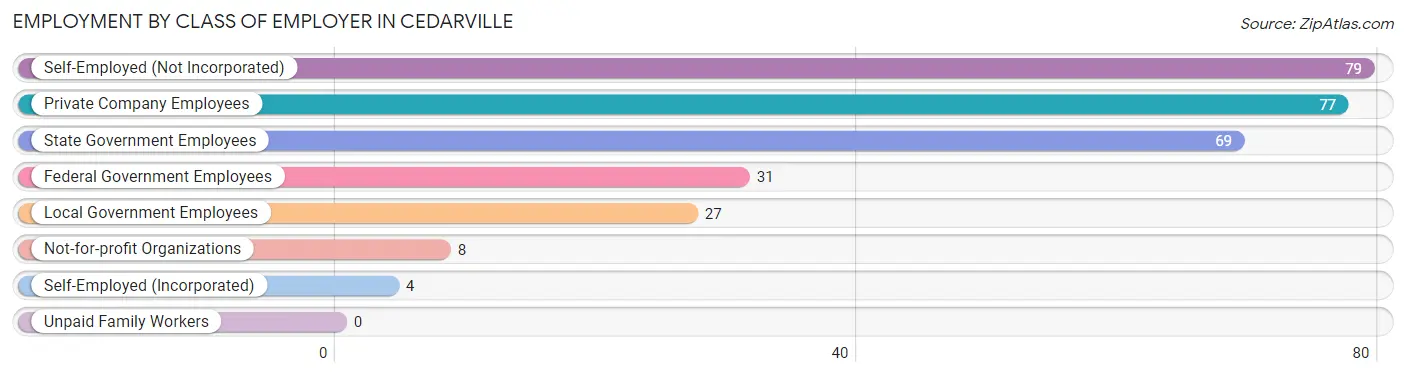
| Employer Class | # Employees | % Employees |
| Private Company Employees | 77 | 26.1% |
| Self-Employed (Incorporated) | 4 | 1.4% |
| Self-Employed (Not Incorporated) | 79 | 26.8% |
| Not-for-profit Organizations | 8 | 2.7% |
| Local Government Employees | 27 | 9.1% |
| State Government Employees | 69 | 23.4% |
| Federal Government Employees | 31 | 10.5% |
| Unpaid Family Workers | 0 | 0.0% |
| Total | 295 | 100.0% |
Employment Status by Age in Cedarville
According to the labor force statistics for Cedarville, out of the total population over 16 years of age (620), 53.2% or 330 individuals are in the labor force, with 10.6% or 35 of them unemployed. The age group with the highest labor force participation rate is 25 to 29 years, with 100.0% or 13 individuals in the labor force. Within the labor force, the 16 to 19 years age range has the highest percentage of unemployed individuals, with 54.8% or 17 of them being unemployed.
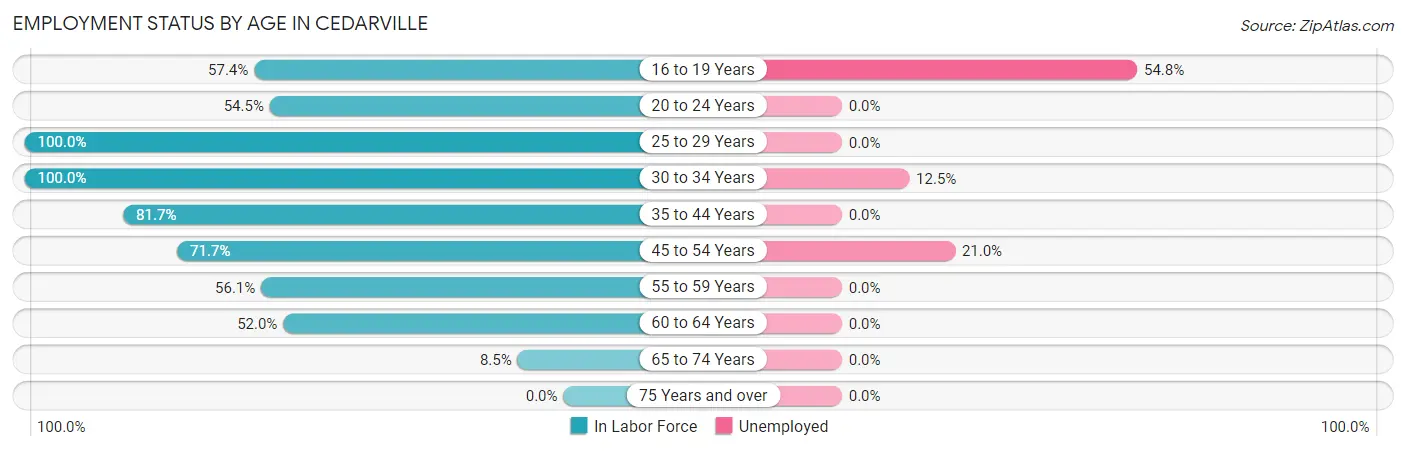
| Age Bracket | In Labor Force | Unemployed |
| 16 to 19 Years | 31 (57.4%) | 17 (54.8%) |
| 20 to 24 Years | 6 (54.5%) | 0 (0.0%) |
| 25 to 29 Years | 13 (100.0%) | 0 (0.0%) |
| 30 to 34 Years | 8 (100.0%) | 1 (12.5%) |
| 35 to 44 Years | 107 (81.7%) | 0 (0.0%) |
| 45 to 54 Years | 81 (71.7%) | 17 (21.0%) |
| 55 to 59 Years | 37 (56.1%) | 0 (0.0%) |
| 60 to 64 Years | 39 (52.0%) | 0 (0.0%) |
| 65 to 74 Years | 8 (8.5%) | 0 (0.0%) |
| 75 Years and over | 0 (0.0%) | 0 (0.0%) |
| Total | 330 (53.2%) | 35 (10.6%) |
Employment Status by Educational Attainment in Cedarville
According to labor force statistics for Cedarville, 70.2% of individuals (285) out of the total population between 25 and 64 years of age (406) are in the labor force, with 6.3% or 18 of them being unemployed. The group with the highest labor force participation rate are those with the educational attainment of bachelor's degree or higher, with 86.3% or 69 individuals in the labor force. Within the labor force, individuals with high school diploma education have the highest percentage of unemployment, with 32.1% or 17 of them being unemployed.
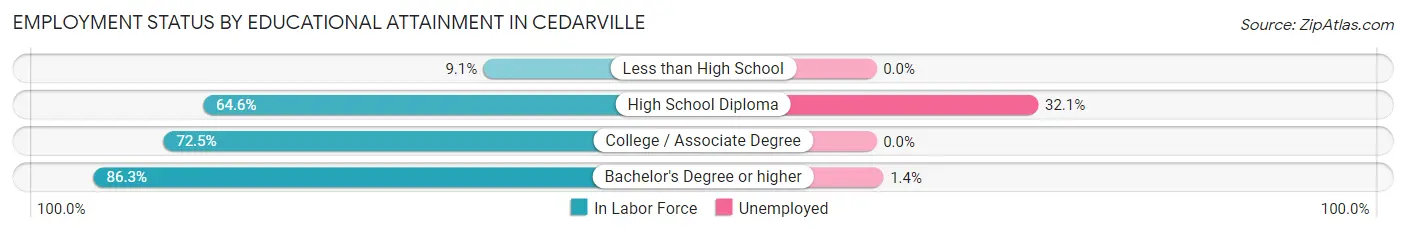
| Educational Attainment | In Labor Force | Unemployed |
| Less than High School | 2 (9.1%) | 0 (0.0%) |
| High School Diploma | 53 (64.6%) | 26 (32.1%) |
| College / Associate Degree | 161 (72.5%) | 0 (0.0%) |
| Bachelor's Degree or higher | 69 (86.3%) | 1 (1.4%) |
| Total | 285 (70.2%) | 26 (6.3%) |
Employment Occupations by Sex in Cedarville
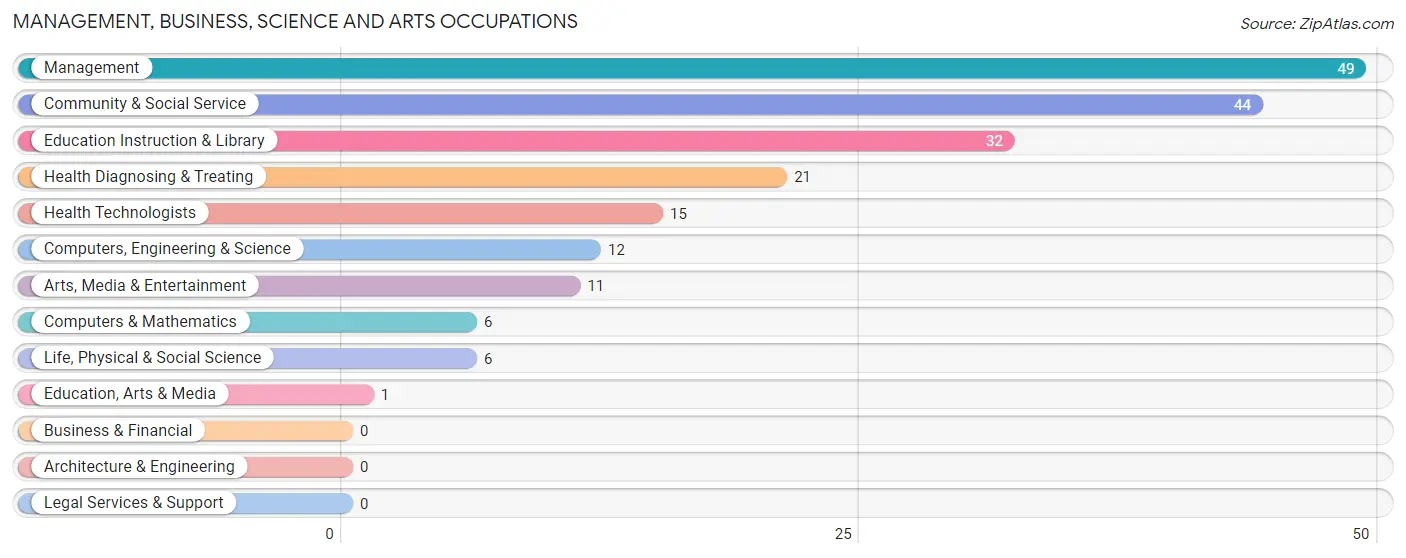
Management, Business, Science and Arts Occupations
The most common Management, Business, Science and Arts occupations in Cedarville are Management (49 | 16.6%), Community & Social Service (44 | 14.9%), Education Instruction & Library (32 | 10.8%), Health Diagnosing & Treating (21 | 7.1%), and Health Technologists (15 | 5.1%).
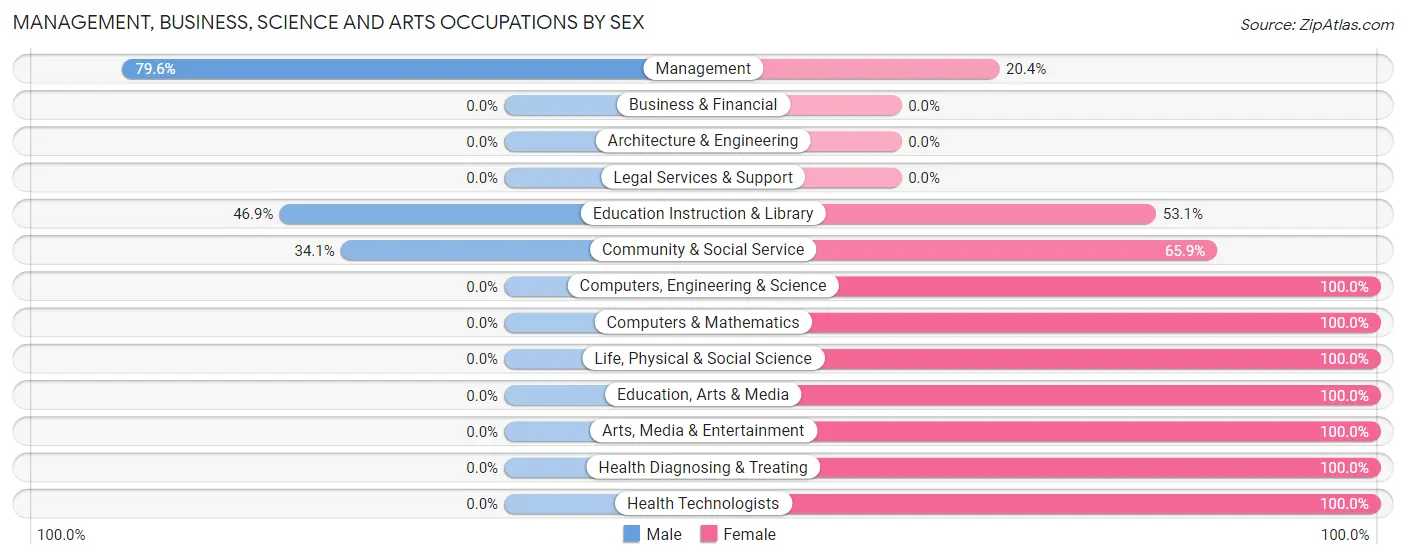
Management, Business, Science and Arts Occupations by Sex
Within the Management, Business, Science and Arts occupations in Cedarville, the most male-oriented occupations are Management (79.6%), Education Instruction & Library (46.9%), and Community & Social Service (34.1%), while the most female-oriented occupations are Computers, Engineering & Science (100.0%), Computers & Mathematics (100.0%), and Life, Physical & Social Science (100.0%).
| Occupation | Male | Female |
| Management | 39 (79.6%) | 10 (20.4%) |
| Business & Financial | 0 (0.0%) | 0 (0.0%) |
| Computers, Engineering & Science | 0 (0.0%) | 12 (100.0%) |
| Computers & Mathematics | 0 (0.0%) | 6 (100.0%) |
| Architecture & Engineering | 0 (0.0%) | 0 (0.0%) |
| Life, Physical & Social Science | 0 (0.0%) | 6 (100.0%) |
| Community & Social Service | 15 (34.1%) | 29 (65.9%) |
| Education, Arts & Media | 0 (0.0%) | 1 (100.0%) |
| Legal Services & Support | 0 (0.0%) | 0 (0.0%) |
| Education Instruction & Library | 15 (46.9%) | 17 (53.1%) |
| Arts, Media & Entertainment | 0 (0.0%) | 11 (100.0%) |
| Health Diagnosing & Treating | 0 (0.0%) | 21 (100.0%) |
| Health Technologists | 0 (0.0%) | 15 (100.0%) |
| Total (Category) | 54 (42.9%) | 72 (57.1%) |
| Total (Overall) | 133 (45.1%) | 162 (54.9%) |
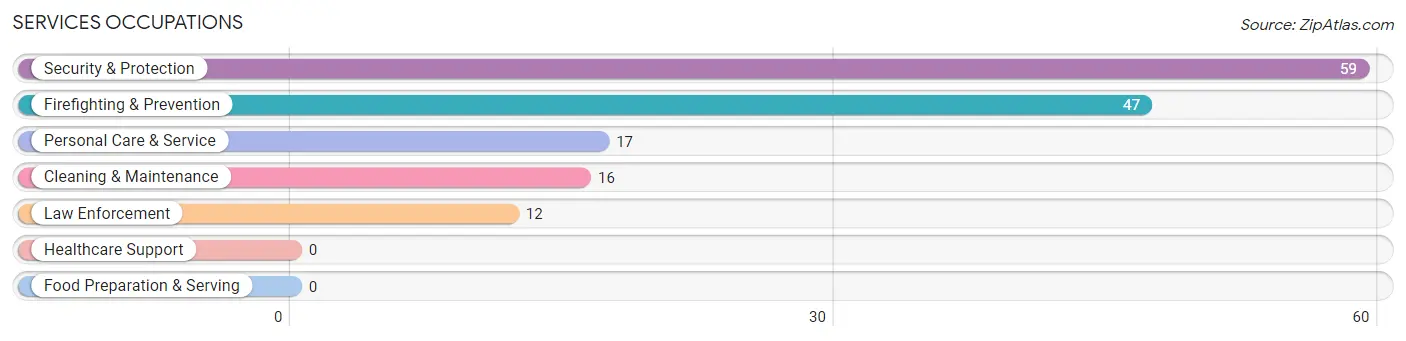
Services Occupations
The most common Services occupations in Cedarville are Security & Protection (59 | 20.0%), Firefighting & Prevention (47 | 15.9%), Personal Care & Service (17 | 5.8%), Cleaning & Maintenance (16 | 5.4%), and Law Enforcement (12 | 4.1%).
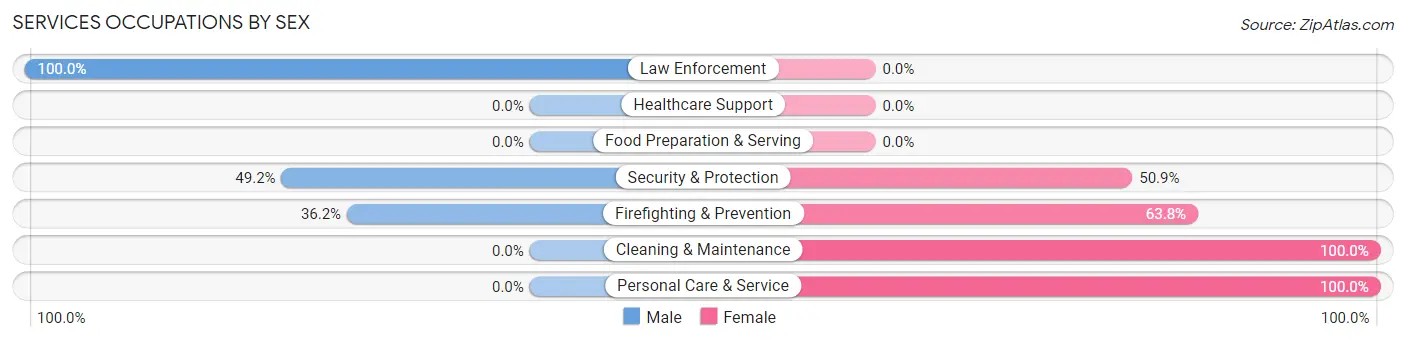
Services Occupations by Sex
Within the Services occupations in Cedarville, the most male-oriented occupations are Law Enforcement (100.0%), Security & Protection (49.1%), and Firefighting & Prevention (36.2%), while the most female-oriented occupations are Cleaning & Maintenance (100.0%), Personal Care & Service (100.0%), and Firefighting & Prevention (63.8%).
| Occupation | Male | Female |
| Healthcare Support | 0 (0.0%) | 0 (0.0%) |
| Security & Protection | 29 (49.1%) | 30 (50.8%) |
| Firefighting & Prevention | 17 (36.2%) | 30 (63.8%) |
| Law Enforcement | 12 (100.0%) | 0 (0.0%) |
| Food Preparation & Serving | 0 (0.0%) | 0 (0.0%) |
| Cleaning & Maintenance | 0 (0.0%) | 16 (100.0%) |
| Personal Care & Service | 0 (0.0%) | 17 (100.0%) |
| Total (Category) | 29 (31.5%) | 63 (68.5%) |
| Total (Overall) | 133 (45.1%) | 162 (54.9%) |
Sales and Office Occupations
The most common Sales and Office occupations in Cedarville are , and Office & Administration (23 | 7.8%).
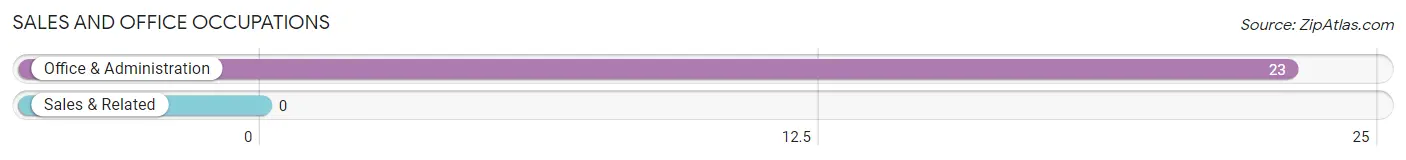
Sales and Office Occupations by Sex

| Occupation | Male | Female |
| Sales & Related | 0 (0.0%) | 0 (0.0%) |
| Office & Administration | 0 (0.0%) | 23 (100.0%) |
| Total (Category) | 0 (0.0%) | 23 (100.0%) |
| Total (Overall) | 133 (45.1%) | 162 (54.9%) |
Natural Resources, Construction and Maintenance Occupations
The most common Natural Resources, Construction and Maintenance occupations in Cedarville are Farming, Fishing & Forestry (25 | 8.5%), Construction & Extraction (19 | 6.4%), and Installation, Maintenance & Repair (7 | 2.4%).
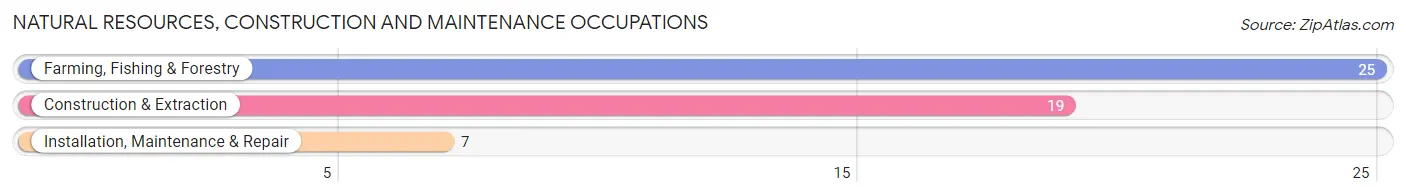
Natural Resources, Construction and Maintenance Occupations by Sex

| Occupation | Male | Female |
| Farming, Fishing & Forestry | 23 (92.0%) | 2 (8.0%) |
| Construction & Extraction | 19 (100.0%) | 0 (0.0%) |
| Installation, Maintenance & Repair | 7 (100.0%) | 0 (0.0%) |
| Total (Category) | 49 (96.1%) | 2 (3.9%) |
| Total (Overall) | 133 (45.1%) | 162 (54.9%) |
Production, Transportation and Moving Occupations
The most common Production, Transportation and Moving occupations in Cedarville are Material Moving (2 | 0.7%), and Transportation (1 | 0.3%).
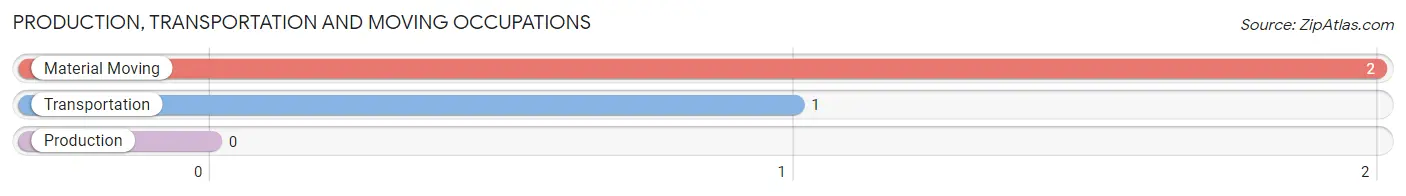
Production, Transportation and Moving Occupations by Sex
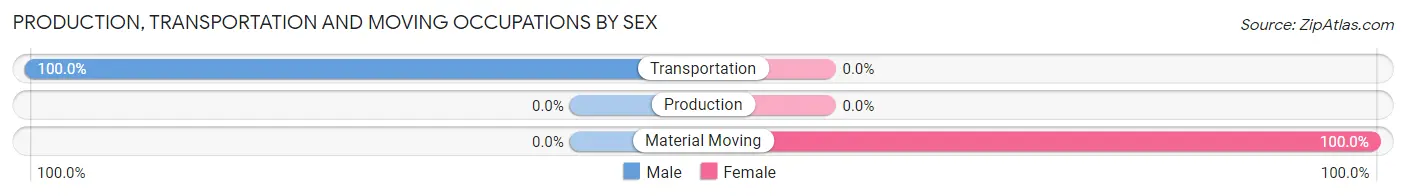
| Occupation | Male | Female |
| Production | 0 (0.0%) | 0 (0.0%) |
| Transportation | 1 (100.0%) | 0 (0.0%) |
| Material Moving | 0 (0.0%) | 2 (100.0%) |
| Total (Category) | 1 (33.3%) | 2 (66.7%) |
| Total (Overall) | 133 (45.1%) | 162 (54.9%) |
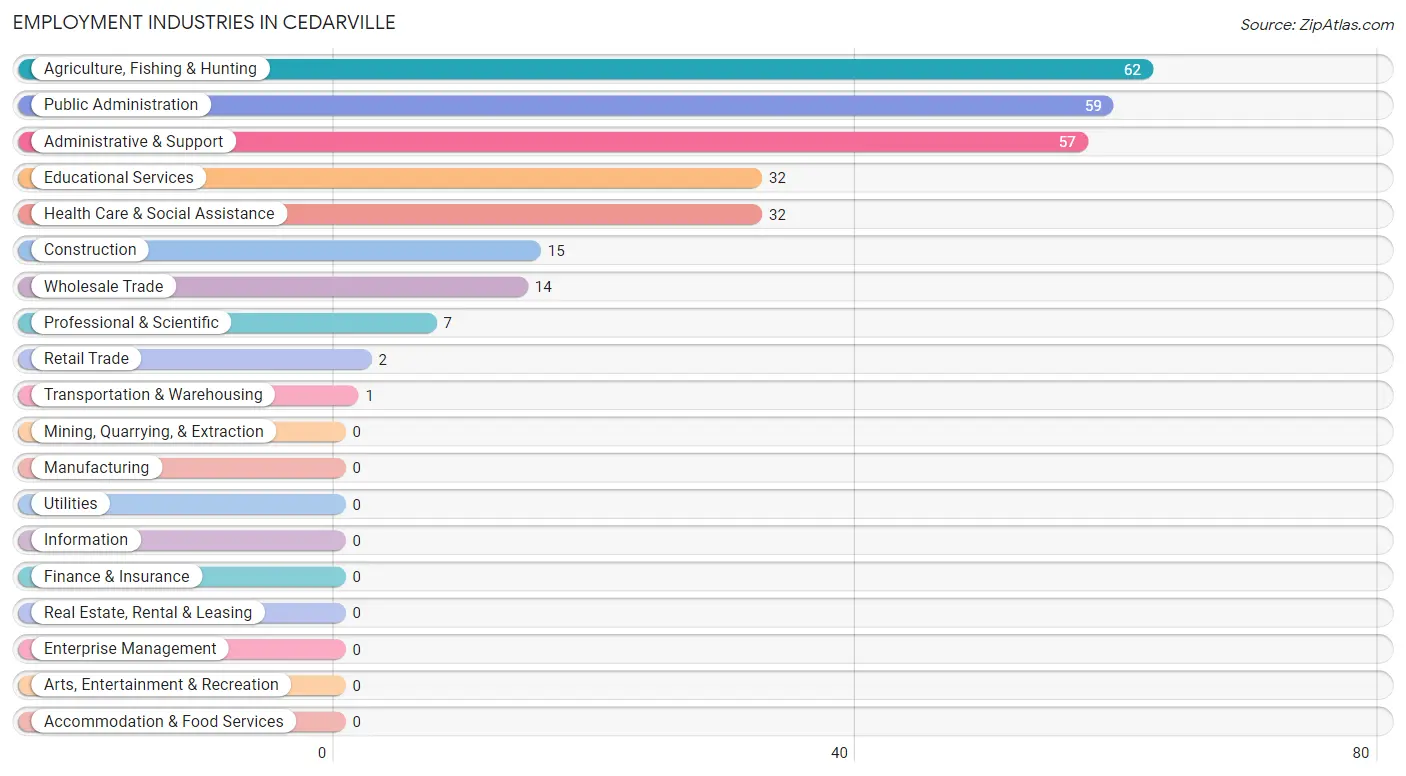
Employment Industries by Sex in Cedarville
Employment Industries in Cedarville
The major employment industries in Cedarville include Agriculture, Fishing & Hunting (62 | 21.0%), Public Administration (59 | 20.0%), Administrative & Support (57 | 19.3%), Educational Services (32 | 10.8%), and Health Care & Social Assistance (32 | 10.8%).
Employment Industries by Sex in Cedarville
The Cedarville industries that see more men than women are Agriculture, Fishing & Hunting (100.0%), Construction (100.0%), and Transportation & Warehousing (100.0%), whereas the industries that tend to have a higher number of women are Wholesale Trade (100.0%), Retail Trade (100.0%), and Administrative & Support (100.0%).
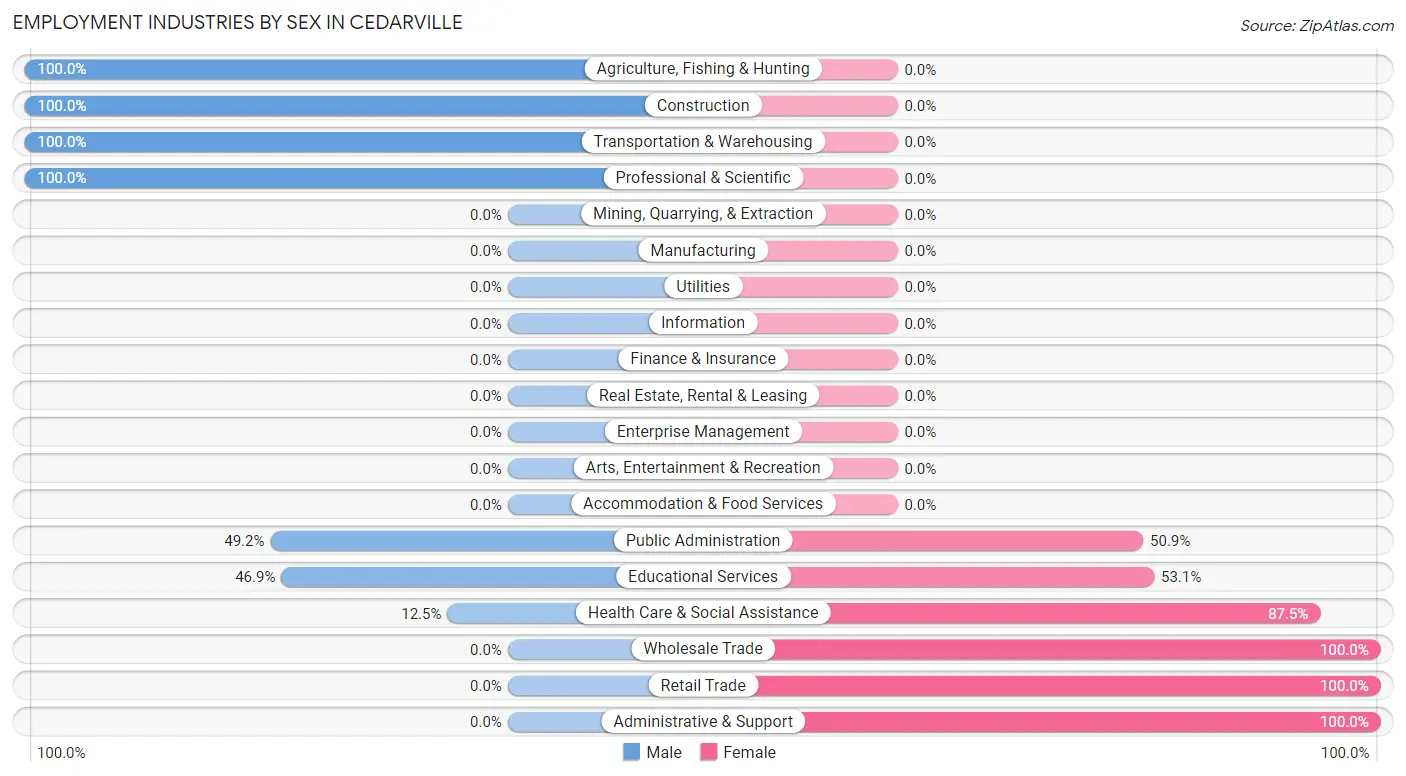
| Industry | Male | Female |
| Agriculture, Fishing & Hunting | 62 (100.0%) | 0 (0.0%) |
| Mining, Quarrying, & Extraction | 0 (0.0%) | 0 (0.0%) |
| Construction | 15 (100.0%) | 0 (0.0%) |
| Manufacturing | 0 (0.0%) | 0 (0.0%) |
| Wholesale Trade | 0 (0.0%) | 14 (100.0%) |
| Retail Trade | 0 (0.0%) | 2 (100.0%) |
| Transportation & Warehousing | 1 (100.0%) | 0 (0.0%) |
| Utilities | 0 (0.0%) | 0 (0.0%) |
| Information | 0 (0.0%) | 0 (0.0%) |
| Finance & Insurance | 0 (0.0%) | 0 (0.0%) |
| Real Estate, Rental & Leasing | 0 (0.0%) | 0 (0.0%) |
| Professional & Scientific | 7 (100.0%) | 0 (0.0%) |
| Enterprise Management | 0 (0.0%) | 0 (0.0%) |
| Administrative & Support | 0 (0.0%) | 57 (100.0%) |
| Educational Services | 15 (46.9%) | 17 (53.1%) |
| Health Care & Social Assistance | 4 (12.5%) | 28 (87.5%) |
| Arts, Entertainment & Recreation | 0 (0.0%) | 0 (0.0%) |
| Accommodation & Food Services | 0 (0.0%) | 0 (0.0%) |
| Public Administration | 29 (49.1%) | 30 (50.8%) |
| Total | 133 (45.1%) | 162 (54.9%) |
Education in Cedarville
School Enrollment in Cedarville
The most common levels of schooling among the 206 students in Cedarville are high school (74 | 35.9%), elementary school (62 | 30.1%), and middle school (58 | 28.2%).
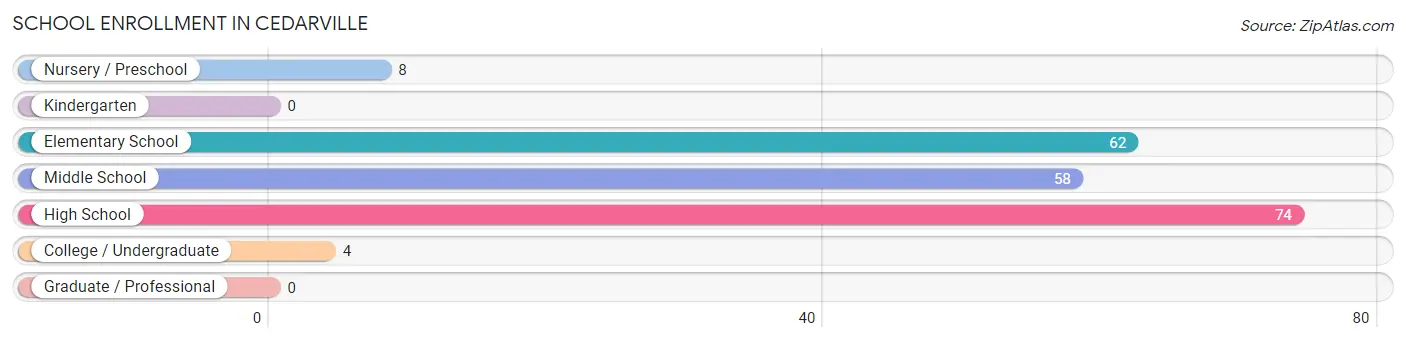
| School Level | # Students | % Students |
| Nursery / Preschool | 8 | 3.9% |
| Kindergarten | 0 | 0.0% |
| Elementary School | 62 | 30.1% |
| Middle School | 58 | 28.2% |
| High School | 74 | 35.9% |
| College / Undergraduate | 4 | 1.9% |
| Graduate / Professional | 0 | 0.0% |
| Total | 206 | 100.0% |
School Enrollment by Age by Funding Source in Cedarville
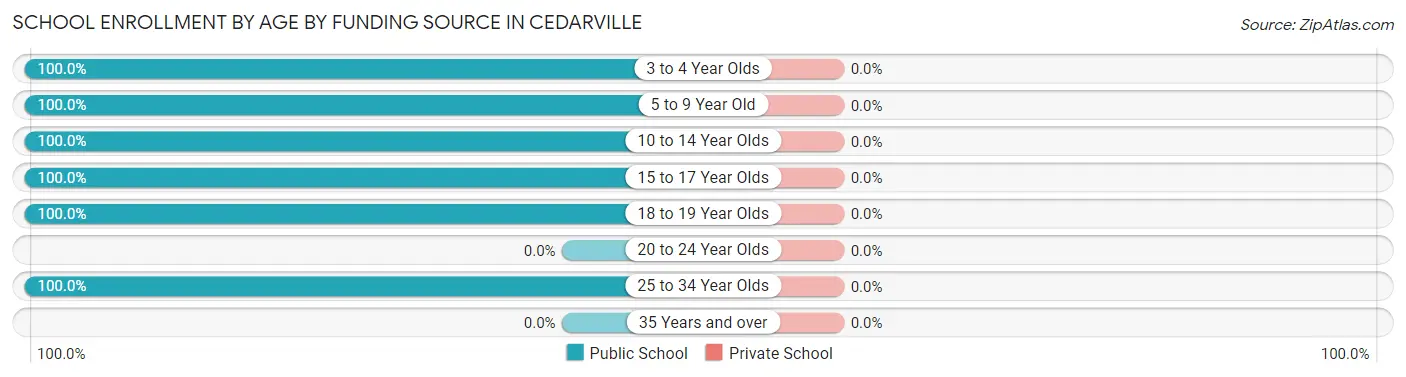
| Age Bracket | Public School | Private School |
| 3 to 4 Year Olds | 8 (100.0%) | 0 (0.0%) |
| 5 to 9 Year Old | 62 (100.0%) | 0 (0.0%) |
| 10 to 14 Year Olds | 58 (100.0%) | 0 (0.0%) |
| 15 to 17 Year Olds | 72 (100.0%) | 0 (0.0%) |
| 18 to 19 Year Olds | 2 (100.0%) | 0 (0.0%) |
| 20 to 24 Year Olds | 0 (0.0%) | 0 (0.0%) |
| 25 to 34 Year Olds | 4 (100.0%) | 0 (0.0%) |
| 35 Years and over | 0 (0.0%) | 0 (0.0%) |
| Total | 206 (100.0%) | 0 (0.0%) |
Educational Attainment by Field of Study in Cedarville
Bio, nature & agricultural (37 | 30.3%), education (35 | 28.7%), liberal arts & history (14 | 11.5%), physical & health sciences (11 | 9.0%), and psychology (8 | 6.6%) are the most common fields of study among 122 individuals in Cedarville who have obtained a bachelor's degree or higher.
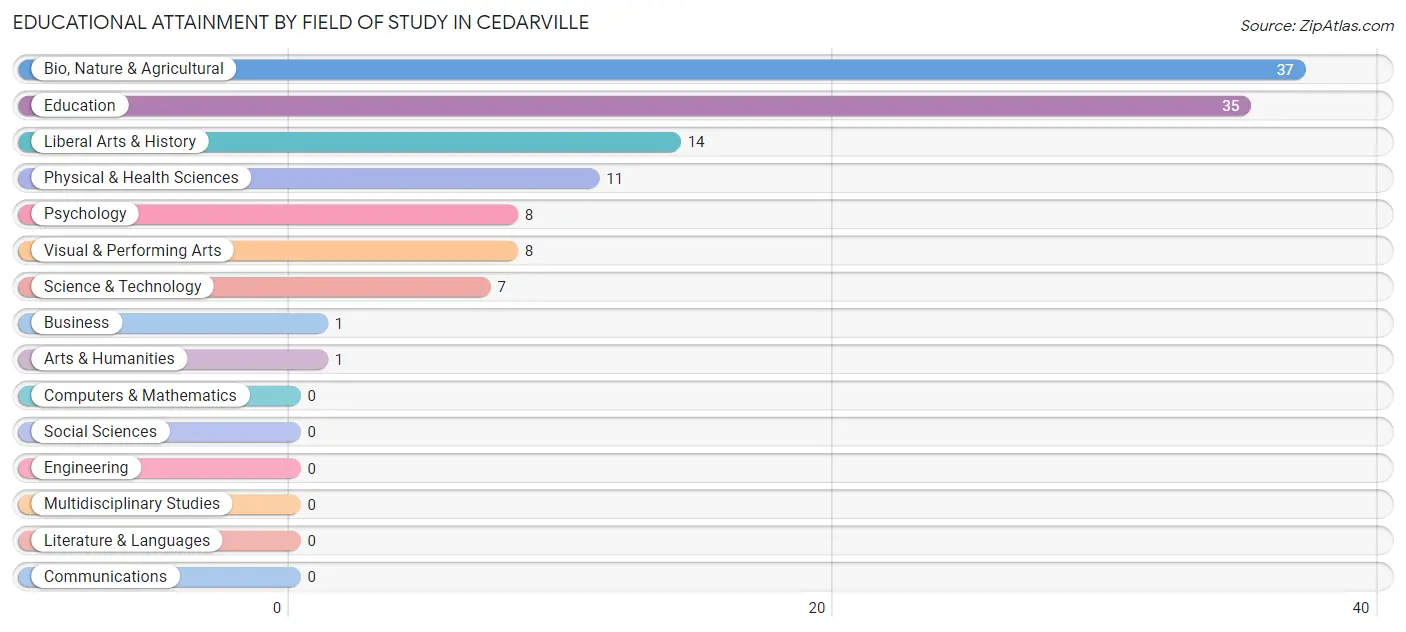
| Field of Study | # Graduates | % Graduates |
| Computers & Mathematics | 0 | 0.0% |
| Bio, Nature & Agricultural | 37 | 30.3% |
| Physical & Health Sciences | 11 | 9.0% |
| Psychology | 8 | 6.6% |
| Social Sciences | 0 | 0.0% |
| Engineering | 0 | 0.0% |
| Multidisciplinary Studies | 0 | 0.0% |
| Science & Technology | 7 | 5.7% |
| Business | 1 | 0.8% |
| Education | 35 | 28.7% |
| Literature & Languages | 0 | 0.0% |
| Liberal Arts & History | 14 | 11.5% |
| Visual & Performing Arts | 8 | 6.6% |
| Communications | 0 | 0.0% |
| Arts & Humanities | 1 | 0.8% |
| Total | 122 | 100.0% |
Transportation & Commute in Cedarville
Vehicle Availability by Sex in Cedarville
The most prevalent vehicle ownership categories in Cedarville are males with 2 vehicles (83, accounting for 66.9%) and females with 2 vehicles (50, making up 52.5%).
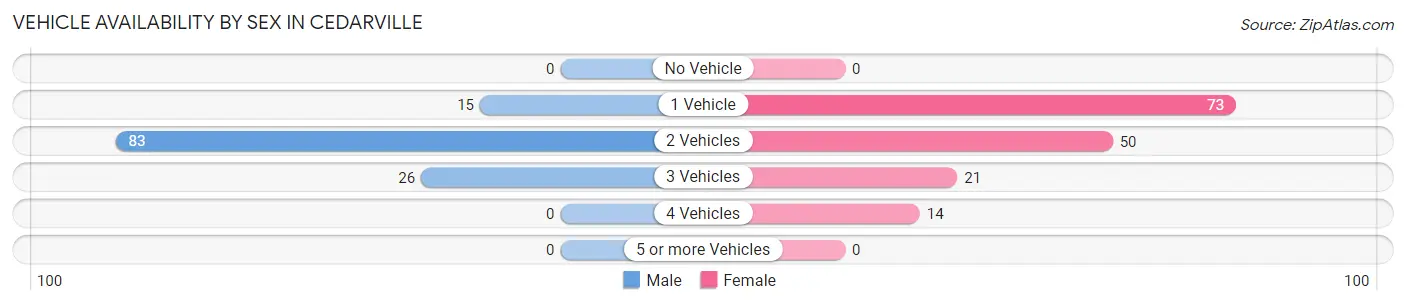
| Vehicles Available | Male | Female |
| No Vehicle | 0 (0.0%) | 0 (0.0%) |
| 1 Vehicle | 15 (12.1%) | 73 (46.2%) |
| 2 Vehicles | 83 (66.9%) | 50 (31.7%) |
| 3 Vehicles | 26 (21.0%) | 21 (13.3%) |
| 4 Vehicles | 0 (0.0%) | 14 (8.9%) |
| 5 or more Vehicles | 0 (0.0%) | 0 (0.0%) |
| Total | 124 (100.0%) | 158 (100.0%) |
Commute Time in Cedarville
The most frequently occuring commute durations in Cedarville are 30 to 34 minutes (74 commuters, 35.2%), 5 to 9 minutes (43 commuters, 20.5%), and 20 to 24 minutes (27 commuters, 12.9%).
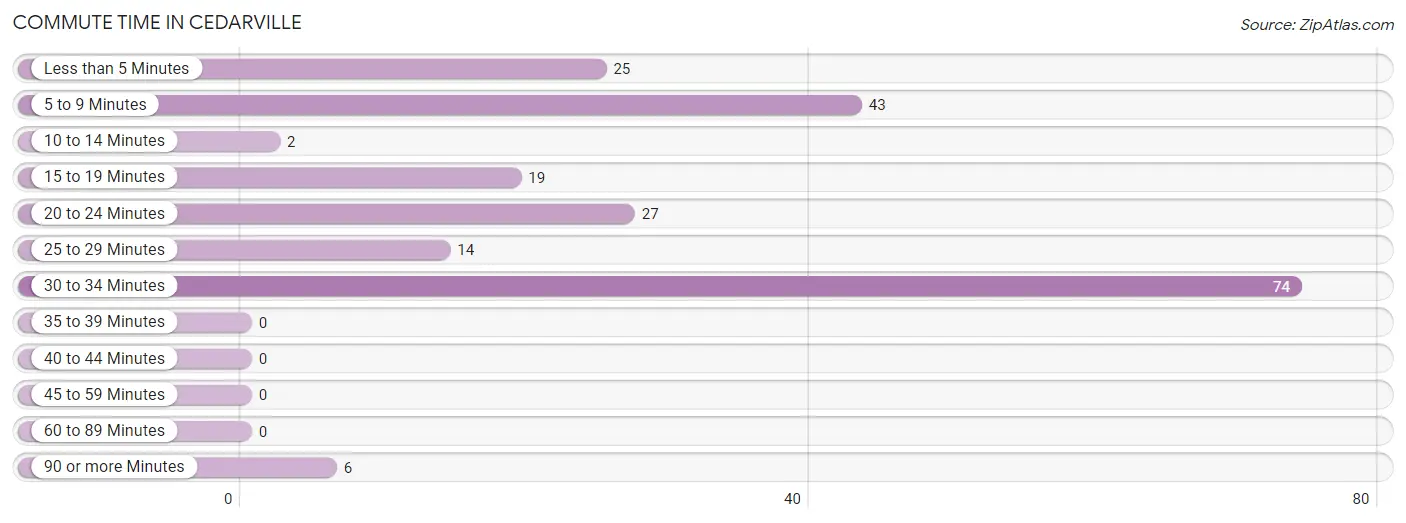
| Commute Time | # Commuters | % Commuters |
| Less than 5 Minutes | 25 | 11.9% |
| 5 to 9 Minutes | 43 | 20.5% |
| 10 to 14 Minutes | 2 | 0.9% |
| 15 to 19 Minutes | 19 | 9.0% |
| 20 to 24 Minutes | 27 | 12.9% |
| 25 to 29 Minutes | 14 | 6.7% |
| 30 to 34 Minutes | 74 | 35.2% |
| 35 to 39 Minutes | 0 | 0.0% |
| 40 to 44 Minutes | 0 | 0.0% |
| 45 to 59 Minutes | 0 | 0.0% |
| 60 to 89 Minutes | 0 | 0.0% |
| 90 or more Minutes | 6 | 2.9% |
Commute Time by Sex in Cedarville
The most common commute times in Cedarville are 30 to 34 minutes (31 commuters, 33.7%) for males and 30 to 34 minutes (43 commuters, 36.4%) for females.
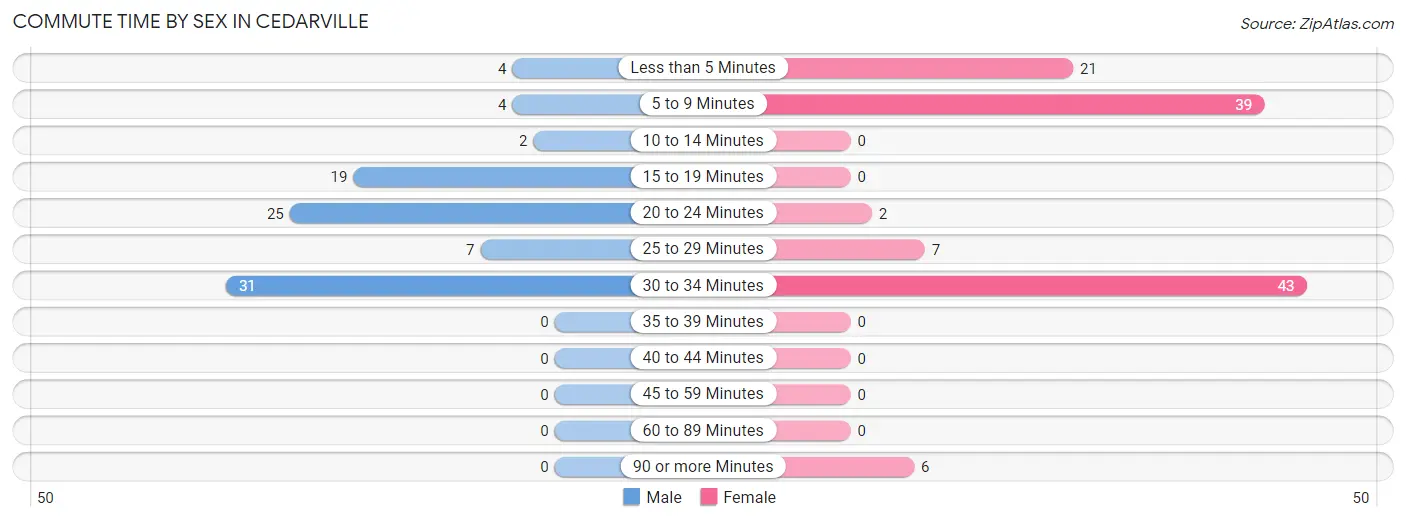
| Commute Time | Male | Female |
| Less than 5 Minutes | 4 (4.3%) | 21 (17.8%) |
| 5 to 9 Minutes | 4 (4.3%) | 39 (33.1%) |
| 10 to 14 Minutes | 2 (2.2%) | 0 (0.0%) |
| 15 to 19 Minutes | 19 (20.6%) | 0 (0.0%) |
| 20 to 24 Minutes | 25 (27.2%) | 2 (1.7%) |
| 25 to 29 Minutes | 7 (7.6%) | 7 (5.9%) |
| 30 to 34 Minutes | 31 (33.7%) | 43 (36.4%) |
| 35 to 39 Minutes | 0 (0.0%) | 0 (0.0%) |
| 40 to 44 Minutes | 0 (0.0%) | 0 (0.0%) |
| 45 to 59 Minutes | 0 (0.0%) | 0 (0.0%) |
| 60 to 89 Minutes | 0 (0.0%) | 0 (0.0%) |
| 90 or more Minutes | 0 (0.0%) | 6 (5.1%) |
Time of Departure to Work by Sex in Cedarville
The most frequent times of departure to work in Cedarville are 7:30 AM to 7:59 AM (38, 41.3%) for males and 7:30 AM to 7:59 AM (31, 26.3%) for females.
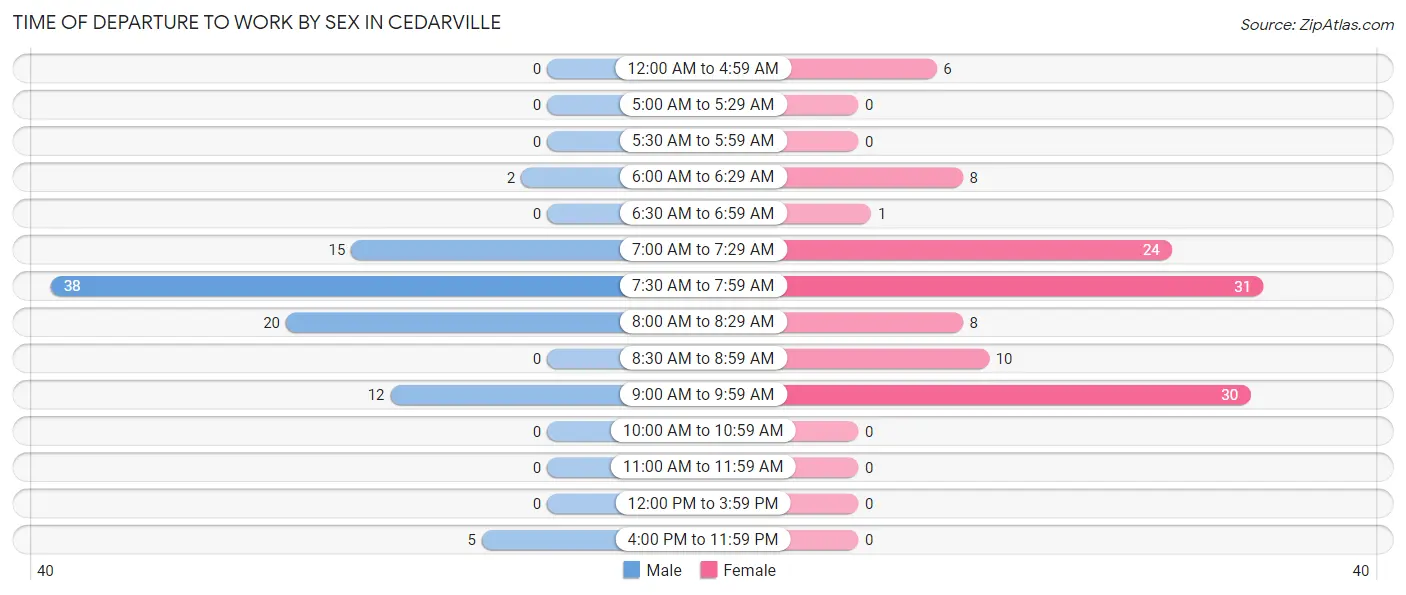
| Time of Departure | Male | Female |
| 12:00 AM to 4:59 AM | 0 (0.0%) | 6 (5.1%) |
| 5:00 AM to 5:29 AM | 0 (0.0%) | 0 (0.0%) |
| 5:30 AM to 5:59 AM | 0 (0.0%) | 0 (0.0%) |
| 6:00 AM to 6:29 AM | 2 (2.2%) | 8 (6.8%) |
| 6:30 AM to 6:59 AM | 0 (0.0%) | 1 (0.9%) |
| 7:00 AM to 7:29 AM | 15 (16.3%) | 24 (20.3%) |
| 7:30 AM to 7:59 AM | 38 (41.3%) | 31 (26.3%) |
| 8:00 AM to 8:29 AM | 20 (21.7%) | 8 (6.8%) |
| 8:30 AM to 8:59 AM | 0 (0.0%) | 10 (8.5%) |
| 9:00 AM to 9:59 AM | 12 (13.0%) | 30 (25.4%) |
| 10:00 AM to 10:59 AM | 0 (0.0%) | 0 (0.0%) |
| 11:00 AM to 11:59 AM | 0 (0.0%) | 0 (0.0%) |
| 12:00 PM to 3:59 PM | 0 (0.0%) | 0 (0.0%) |
| 4:00 PM to 11:59 PM | 5 (5.4%) | 0 (0.0%) |
| Total | 92 (100.0%) | 118 (100.0%) |
Housing Occupancy in Cedarville
Occupancy by Ownership in Cedarville
Of the total 330 dwellings in Cedarville, owner-occupied units account for 220 (66.7%), while renter-occupied units make up 110 (33.3%).
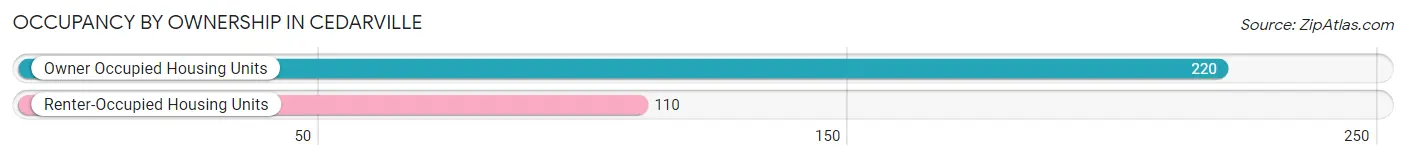
| Occupancy | # Housing Units | % Housing Units |
| Owner Occupied Housing Units | 220 | 66.7% |
| Renter-Occupied Housing Units | 110 | 33.3% |
| Total Occupied Housing Units | 330 | 100.0% |
Occupancy by Household Size in Cedarville
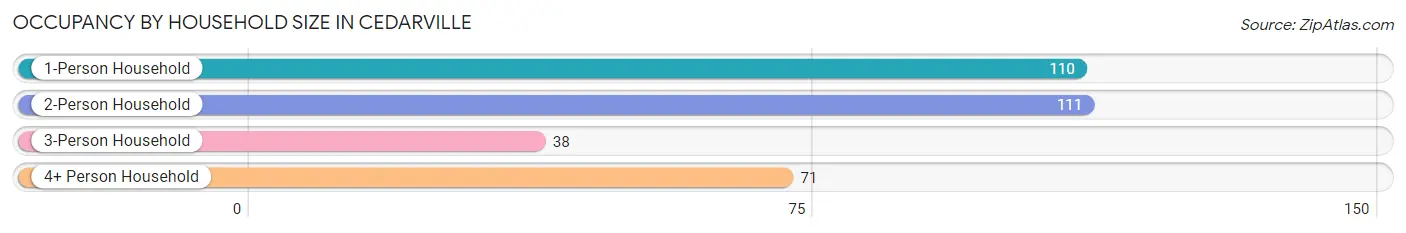
| Household Size | # Housing Units | % Housing Units |
| 1-Person Household | 110 | 33.3% |
| 2-Person Household | 111 | 33.6% |
| 3-Person Household | 38 | 11.5% |
| 4+ Person Household | 71 | 21.5% |
| Total Housing Units | 330 | 100.0% |
Occupancy by Ownership by Household Size in Cedarville
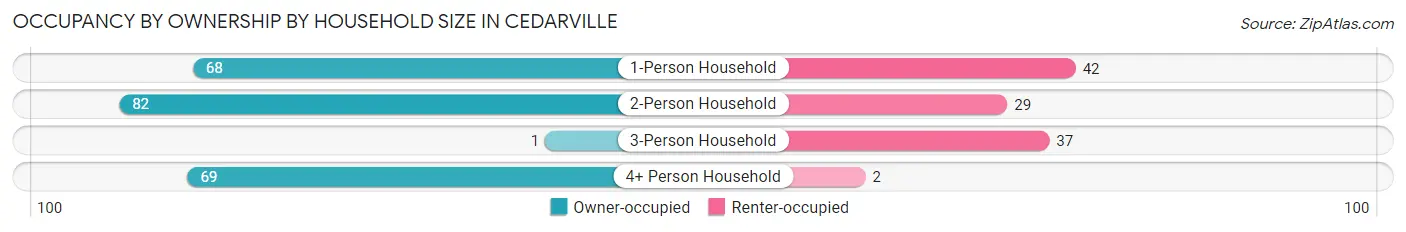
| Household Size | Owner-occupied | Renter-occupied |
| 1-Person Household | 68 (61.8%) | 42 (38.2%) |
| 2-Person Household | 82 (73.9%) | 29 (26.1%) |
| 3-Person Household | 1 (2.6%) | 37 (97.4%) |
| 4+ Person Household | 69 (97.2%) | 2 (2.8%) |
| Total Housing Units | 220 (66.7%) | 110 (33.3%) |
Occupancy by Educational Attainment in Cedarville
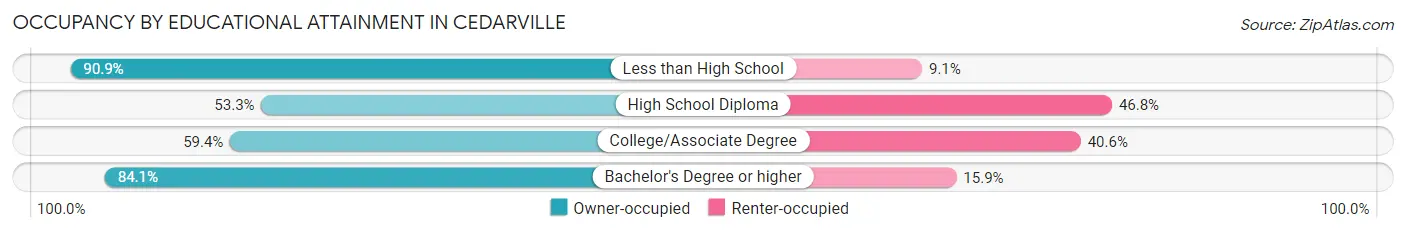
| Household Size | Owner-occupied | Renter-occupied |
| Less than High School | 20 (90.9%) | 2 (9.1%) |
| High School Diploma | 41 (53.2%) | 36 (46.8%) |
| College/Associate Degree | 85 (59.4%) | 58 (40.6%) |
| Bachelor's Degree or higher | 74 (84.1%) | 14 (15.9%) |
Occupancy by Age of Householder in Cedarville
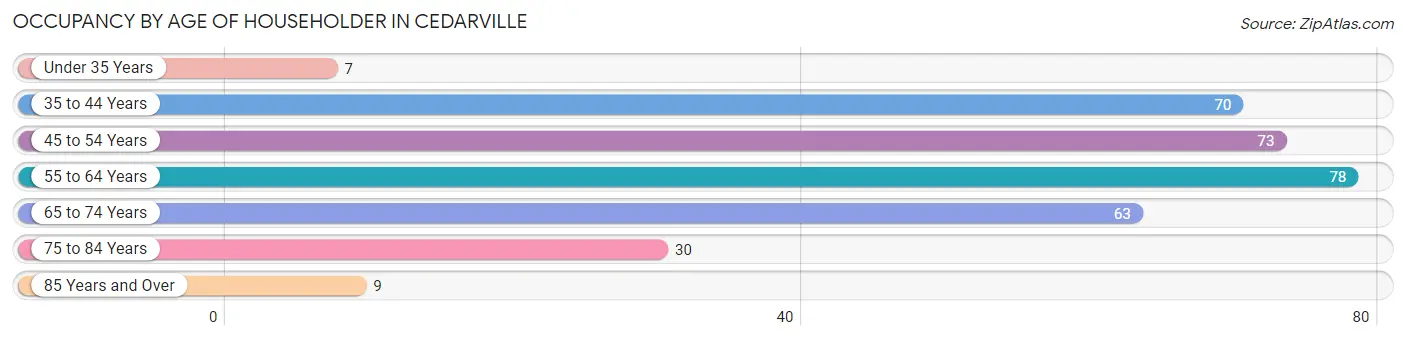
| Age Bracket | # Households | % Households |
| Under 35 Years | 7 | 2.1% |
| 35 to 44 Years | 70 | 21.2% |
| 45 to 54 Years | 73 | 22.1% |
| 55 to 64 Years | 78 | 23.6% |
| 65 to 74 Years | 63 | 19.1% |
| 75 to 84 Years | 30 | 9.1% |
| 85 Years and Over | 9 | 2.7% |
| Total | 330 | 100.0% |
Housing Finances in Cedarville
Median Income by Occupancy in Cedarville
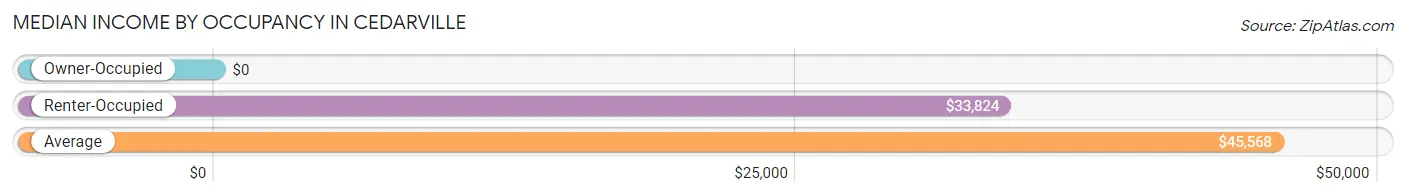
| Occupancy Type | # Households | Median Income |
| Owner-Occupied | 220 (66.7%) | $0 |
| Renter-Occupied | 110 (33.3%) | $33,824 |
| Average | 330 (100.0%) | $45,568 |
Occupancy by Householder Income Bracket in Cedarville
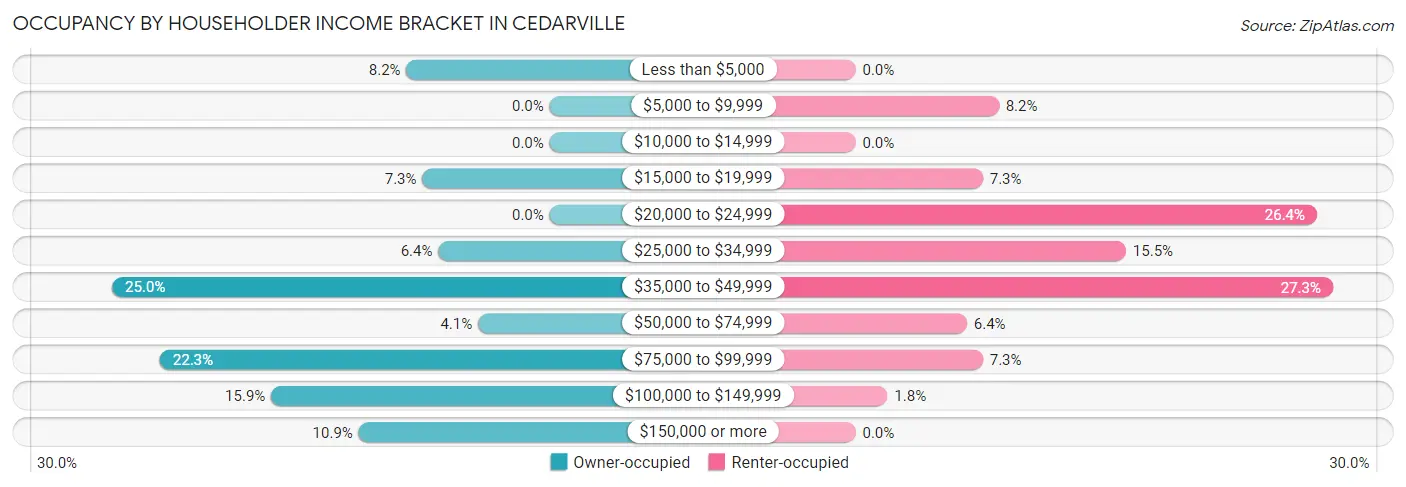
| Income Bracket | Owner-occupied | Renter-occupied |
| Less than $5,000 | 18 (8.2%) | 0 (0.0%) |
| $5,000 to $9,999 | 0 (0.0%) | 9 (8.2%) |
| $10,000 to $14,999 | 0 (0.0%) | 0 (0.0%) |
| $15,000 to $19,999 | 16 (7.3%) | 8 (7.3%) |
| $20,000 to $24,999 | 0 (0.0%) | 29 (26.4%) |
| $25,000 to $34,999 | 14 (6.4%) | 17 (15.4%) |
| $35,000 to $49,999 | 55 (25.0%) | 30 (27.3%) |
| $50,000 to $74,999 | 9 (4.1%) | 7 (6.4%) |
| $75,000 to $99,999 | 49 (22.3%) | 8 (7.3%) |
| $100,000 to $149,999 | 35 (15.9%) | 2 (1.8%) |
| $150,000 or more | 24 (10.9%) | 0 (0.0%) |
| Total | 220 (100.0%) | 110 (100.0%) |
Monthly Housing Cost Tiers in Cedarville
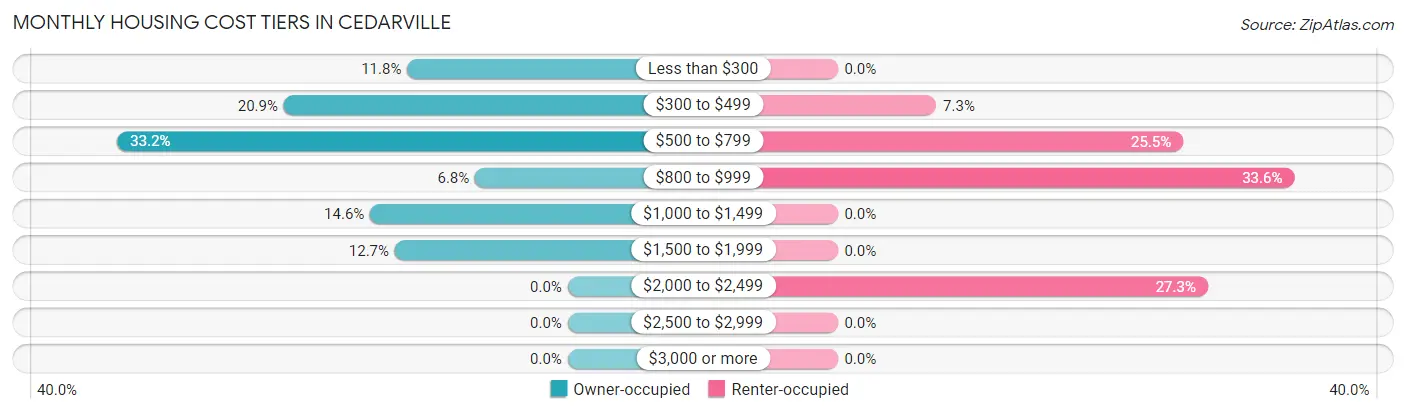
| Monthly Cost | Owner-occupied | Renter-occupied |
| Less than $300 | 26 (11.8%) | 0 (0.0%) |
| $300 to $499 | 46 (20.9%) | 8 (7.3%) |
| $500 to $799 | 73 (33.2%) | 28 (25.5%) |
| $800 to $999 | 15 (6.8%) | 37 (33.6%) |
| $1,000 to $1,499 | 32 (14.5%) | 0 (0.0%) |
| $1,500 to $1,999 | 28 (12.7%) | 0 (0.0%) |
| $2,000 to $2,499 | 0 (0.0%) | 30 (27.3%) |
| $2,500 to $2,999 | 0 (0.0%) | 0 (0.0%) |
| $3,000 or more | 0 (0.0%) | 0 (0.0%) |
| Total | 220 (100.0%) | 110 (100.0%) |
Physical Housing Characteristics in Cedarville
Housing Structures in Cedarville
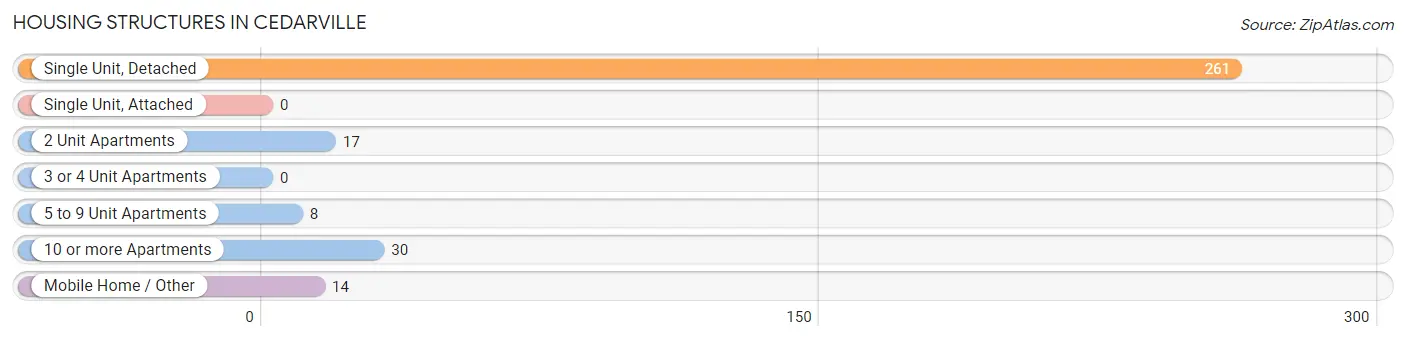
| Structure Type | # Housing Units | % Housing Units |
| Single Unit, Detached | 261 | 79.1% |
| Single Unit, Attached | 0 | 0.0% |
| 2 Unit Apartments | 17 | 5.1% |
| 3 or 4 Unit Apartments | 0 | 0.0% |
| 5 to 9 Unit Apartments | 8 | 2.4% |
| 10 or more Apartments | 30 | 9.1% |
| Mobile Home / Other | 14 | 4.2% |
| Total | 330 | 100.0% |
Housing Structures by Occupancy in Cedarville
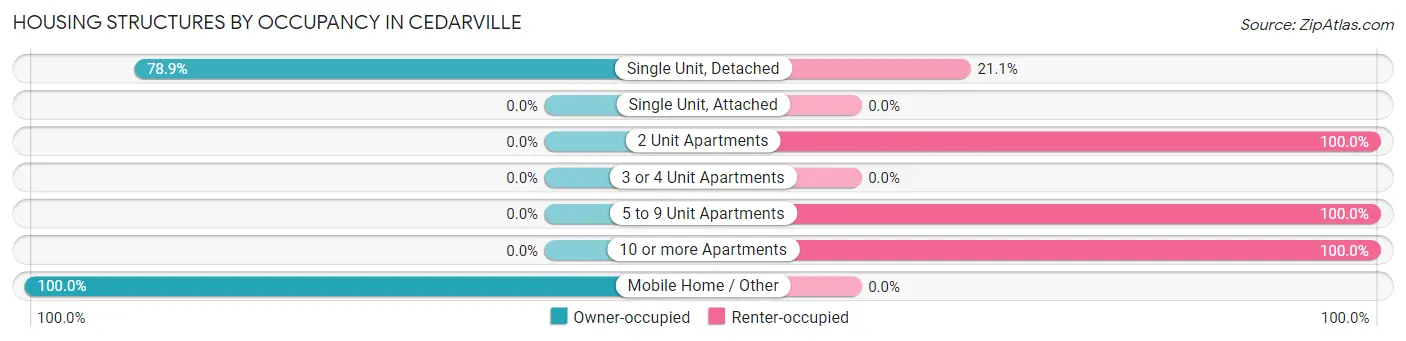
| Structure Type | Owner-occupied | Renter-occupied |
| Single Unit, Detached | 206 (78.9%) | 55 (21.1%) |
| Single Unit, Attached | 0 (0.0%) | 0 (0.0%) |
| 2 Unit Apartments | 0 (0.0%) | 17 (100.0%) |
| 3 or 4 Unit Apartments | 0 (0.0%) | 0 (0.0%) |
| 5 to 9 Unit Apartments | 0 (0.0%) | 8 (100.0%) |
| 10 or more Apartments | 0 (0.0%) | 30 (100.0%) |
| Mobile Home / Other | 14 (100.0%) | 0 (0.0%) |
| Total | 220 (66.7%) | 110 (33.3%) |
Housing Structures by Number of Rooms in Cedarville
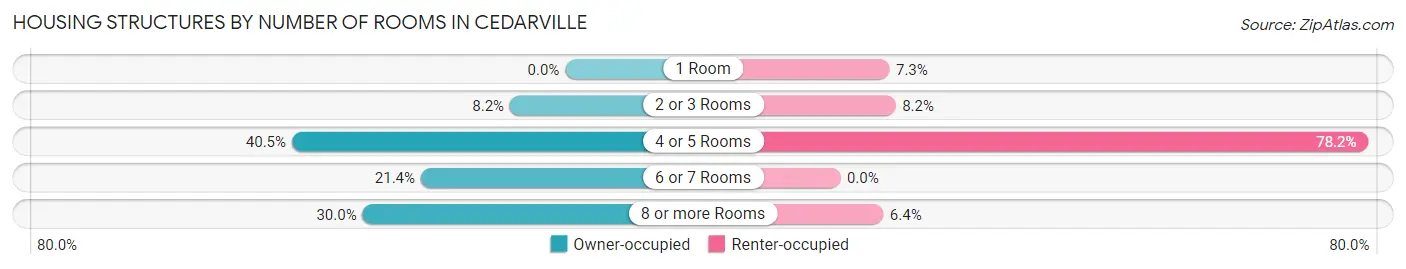
| Number of Rooms | Owner-occupied | Renter-occupied |
| 1 Room | 0 (0.0%) | 8 (7.3%) |
| 2 or 3 Rooms | 18 (8.2%) | 9 (8.2%) |
| 4 or 5 Rooms | 89 (40.5%) | 86 (78.2%) |
| 6 or 7 Rooms | 47 (21.4%) | 0 (0.0%) |
| 8 or more Rooms | 66 (30.0%) | 7 (6.4%) |
| Total | 220 (100.0%) | 110 (100.0%) |
Housing Structure by Heating Type in Cedarville
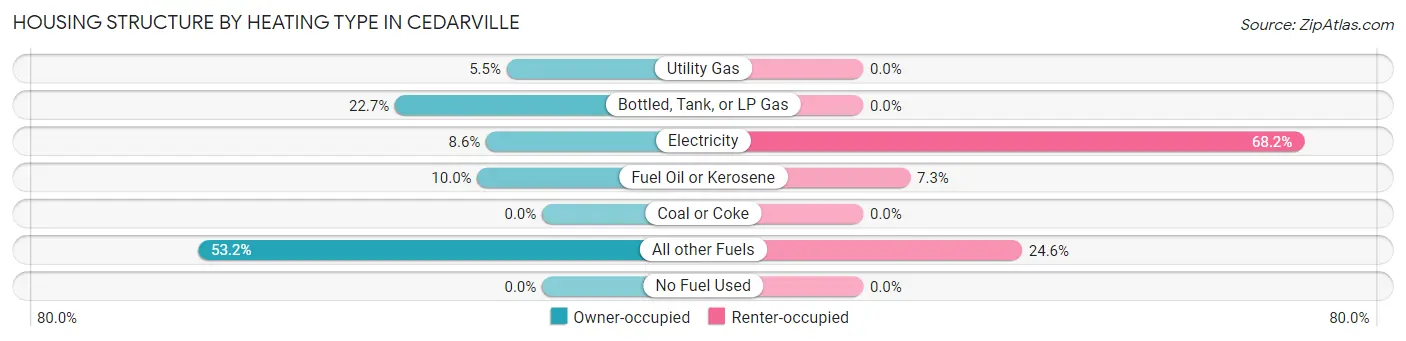
| Heating Type | Owner-occupied | Renter-occupied |
| Utility Gas | 12 (5.4%) | 0 (0.0%) |
| Bottled, Tank, or LP Gas | 50 (22.7%) | 0 (0.0%) |
| Electricity | 19 (8.6%) | 75 (68.2%) |
| Fuel Oil or Kerosene | 22 (10.0%) | 8 (7.3%) |
| Coal or Coke | 0 (0.0%) | 0 (0.0%) |
| All other Fuels | 117 (53.2%) | 27 (24.5%) |
| No Fuel Used | 0 (0.0%) | 0 (0.0%) |
| Total | 220 (100.0%) | 110 (100.0%) |
Household Vehicle Usage in Cedarville
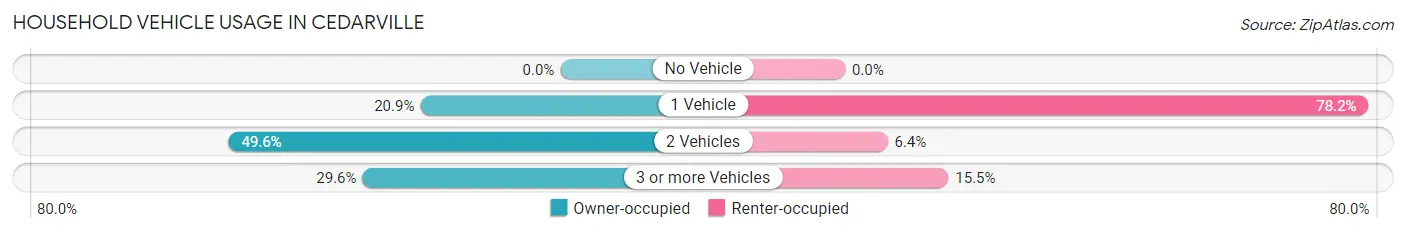
| Vehicles per Household | Owner-occupied | Renter-occupied |
| No Vehicle | 0 (0.0%) | 0 (0.0%) |
| 1 Vehicle | 46 (20.9%) | 86 (78.2%) |
| 2 Vehicles | 109 (49.5%) | 7 (6.4%) |
| 3 or more Vehicles | 65 (29.5%) | 17 (15.4%) |
| Total | 220 (100.0%) | 110 (100.0%) |
Real Estate & Mortgages in Cedarville
Real Estate and Mortgage Overview in Cedarville
| Characteristic | Without Mortgage | With Mortgage |
| Housing Units | 144 | 76 |
| Median Property Value | $192,600 | $162,500 |
| Median Household Income | $47,857 | $22 |
| Monthly Housing Costs | $450 | $0 |
| Real Estate Taxes | $1,139 | $1 |
Property Value by Mortgage Status in Cedarville
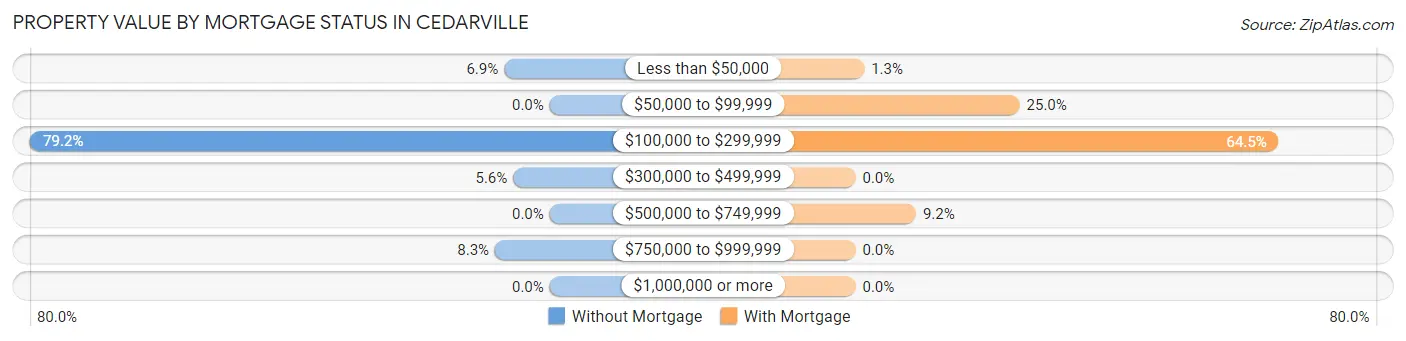
| Property Value | Without Mortgage | With Mortgage |
| Less than $50,000 | 10 (6.9%) | 1 (1.3%) |
| $50,000 to $99,999 | 0 (0.0%) | 19 (25.0%) |
| $100,000 to $299,999 | 114 (79.2%) | 49 (64.5%) |
| $300,000 to $499,999 | 8 (5.6%) | 0 (0.0%) |
| $500,000 to $749,999 | 0 (0.0%) | 7 (9.2%) |
| $750,000 to $999,999 | 12 (8.3%) | 0 (0.0%) |
| $1,000,000 or more | 0 (0.0%) | 0 (0.0%) |
| Total | 144 (100.0%) | 76 (100.0%) |
Household Income by Mortgage Status in Cedarville
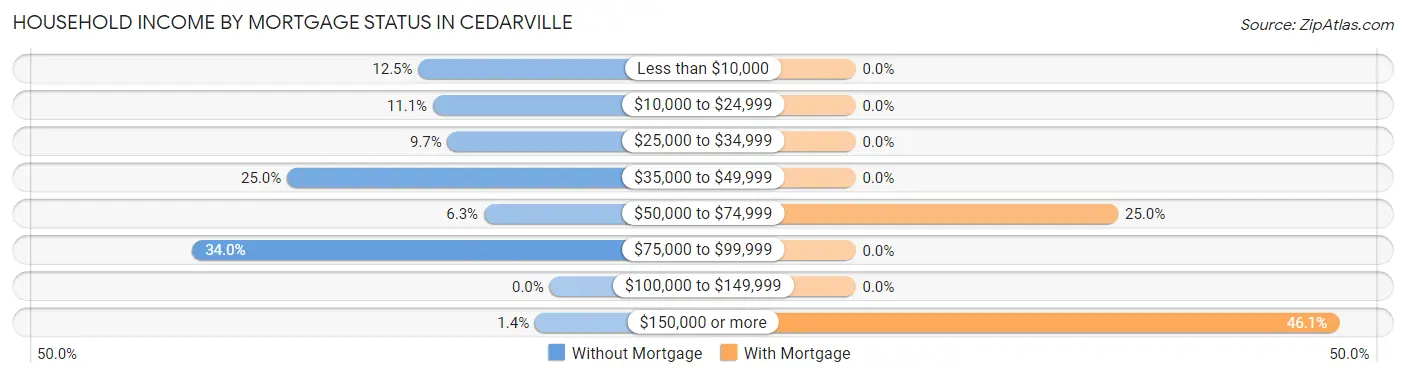
| Household Income | Without Mortgage | With Mortgage |
| Less than $10,000 | 18 (12.5%) | 0 (0.0%) |
| $10,000 to $24,999 | 16 (11.1%) | 0 (0.0%) |
| $25,000 to $34,999 | 14 (9.7%) | 0 (0.0%) |
| $35,000 to $49,999 | 36 (25.0%) | 0 (0.0%) |
| $50,000 to $74,999 | 9 (6.2%) | 19 (25.0%) |
| $75,000 to $99,999 | 49 (34.0%) | 0 (0.0%) |
| $100,000 to $149,999 | 0 (0.0%) | 0 (0.0%) |
| $150,000 or more | 2 (1.4%) | 35 (46.1%) |
| Total | 144 (100.0%) | 76 (100.0%) |
Property Value to Household Income Ratio in Cedarville
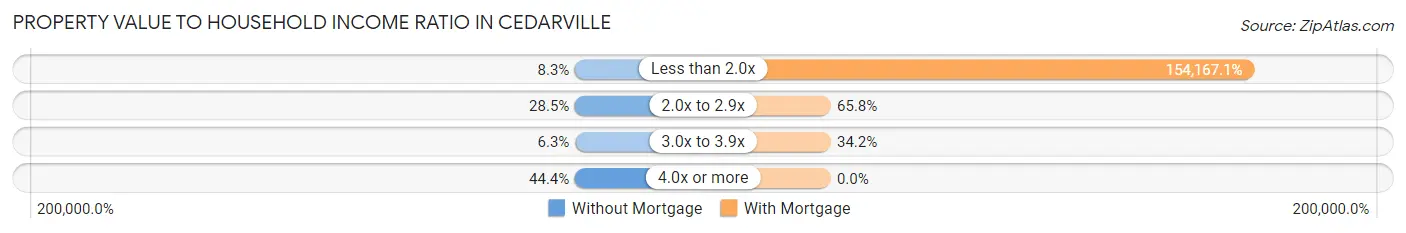
| Value-to-Income Ratio | Without Mortgage | With Mortgage |
| Less than 2.0x | 12 (8.3%) | 117,167 (154,167.1%) |
| 2.0x to 2.9x | 41 (28.5%) | 50 (65.8%) |
| 3.0x to 3.9x | 9 (6.2%) | 26 (34.2%) |
| 4.0x or more | 64 (44.4%) | 0 (0.0%) |
| Total | 144 (100.0%) | 76 (100.0%) |
Real Estate Taxes by Mortgage Status in Cedarville
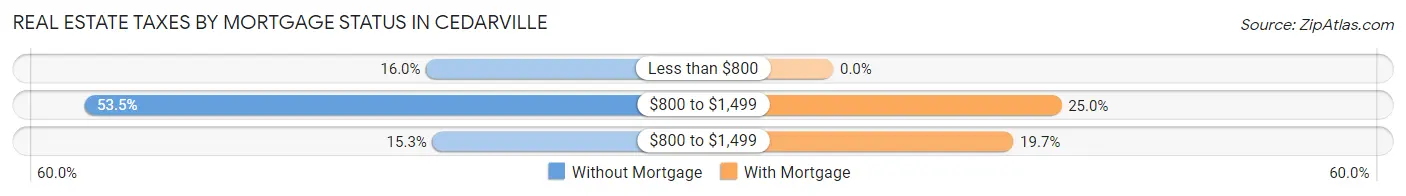
| Property Taxes | Without Mortgage | With Mortgage |
| Less than $800 | 23 (16.0%) | 0 (0.0%) |
| $800 to $1,499 | 77 (53.5%) | 19 (25.0%) |
| $800 to $1,499 | 22 (15.3%) | 15 (19.7%) |
| Total | 144 (100.0%) | 76 (100.0%) |
Health & Disability in Cedarville
Health Insurance Coverage by Age in Cedarville
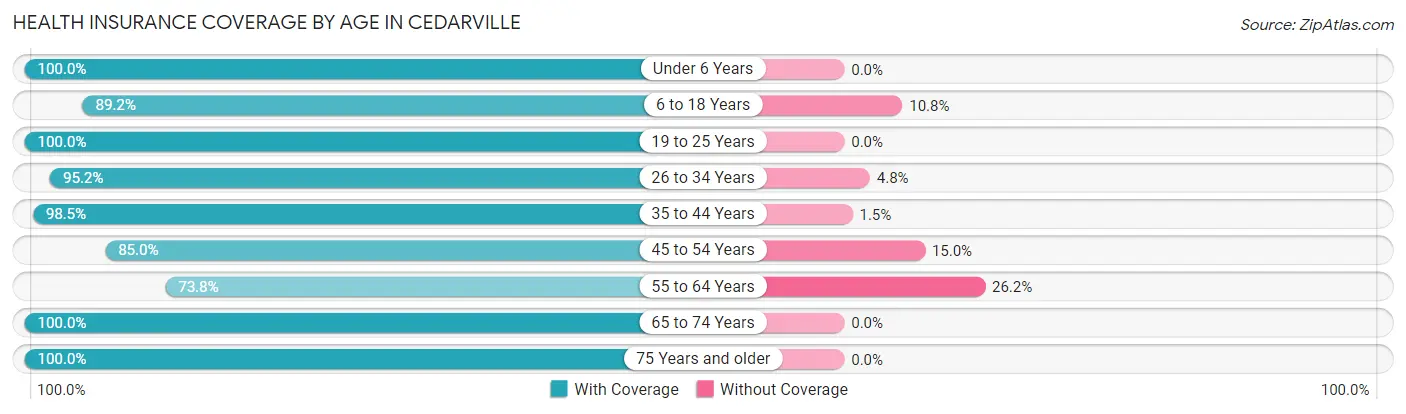
| Age Bracket | With Coverage | Without Coverage |
| Under 6 Years | 23 (100.0%) | 0 (0.0%) |
| 6 to 18 Years | 173 (89.2%) | 21 (10.8%) |
| 19 to 25 Years | 11 (100.0%) | 0 (0.0%) |
| 26 to 34 Years | 20 (95.2%) | 1 (4.8%) |
| 35 to 44 Years | 129 (98.5%) | 2 (1.5%) |
| 45 to 54 Years | 96 (85.0%) | 17 (15.0%) |
| 55 to 64 Years | 104 (73.8%) | 37 (26.2%) |
| 65 to 74 Years | 94 (100.0%) | 0 (0.0%) |
| 75 Years and older | 51 (100.0%) | 0 (0.0%) |
| Total | 701 (90.0%) | 78 (10.0%) |
Health Insurance Coverage by Citizenship Status in Cedarville

| Citizenship Status | With Coverage | Without Coverage |
| Native Born | 23 (100.0%) | 0 (0.0%) |
| Foreign Born, Citizen | 173 (89.2%) | 21 (10.8%) |
| Foreign Born, not a Citizen | 11 (100.0%) | 0 (0.0%) |
Health Insurance Coverage by Household Income in Cedarville
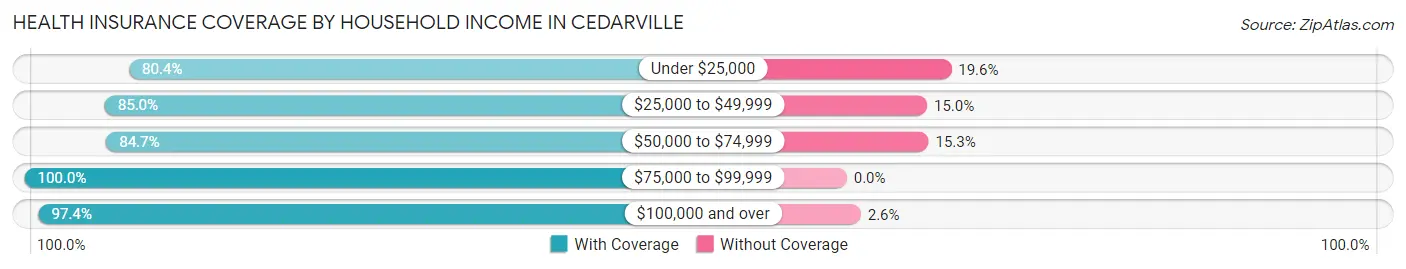
| Household Income | With Coverage | Without Coverage |
| Under $25,000 | 74 (80.4%) | 18 (19.6%) |
| $25,000 to $49,999 | 192 (85.0%) | 34 (15.0%) |
| $50,000 to $74,999 | 105 (84.7%) | 19 (15.3%) |
| $75,000 to $99,999 | 88 (100.0%) | 0 (0.0%) |
| $100,000 and over | 223 (97.4%) | 6 (2.6%) |
Public vs Private Health Insurance Coverage by Age in Cedarville
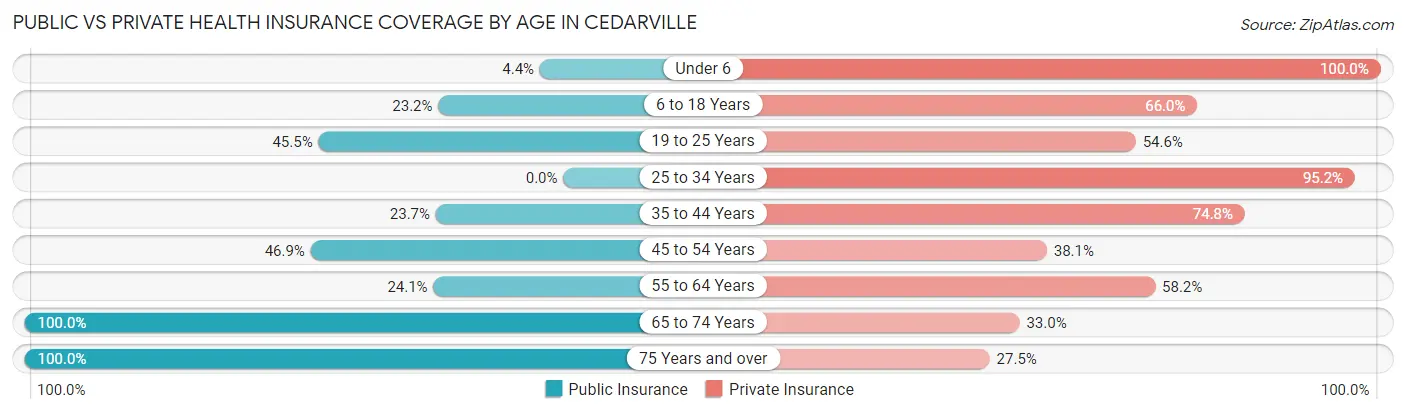
| Age Bracket | Public Insurance | Private Insurance |
| Under 6 | 1 (4.3%) | 23 (100.0%) |
| 6 to 18 Years | 45 (23.2%) | 128 (66.0%) |
| 19 to 25 Years | 5 (45.5%) | 6 (54.5%) |
| 25 to 34 Years | 0 (0.0%) | 20 (95.2%) |
| 35 to 44 Years | 31 (23.7%) | 98 (74.8%) |
| 45 to 54 Years | 53 (46.9%) | 43 (38.1%) |
| 55 to 64 Years | 34 (24.1%) | 82 (58.2%) |
| 65 to 74 Years | 94 (100.0%) | 31 (33.0%) |
| 75 Years and over | 51 (100.0%) | 14 (27.5%) |
| Total | 314 (40.3%) | 445 (57.1%) |
Disability Status by Sex by Age in Cedarville
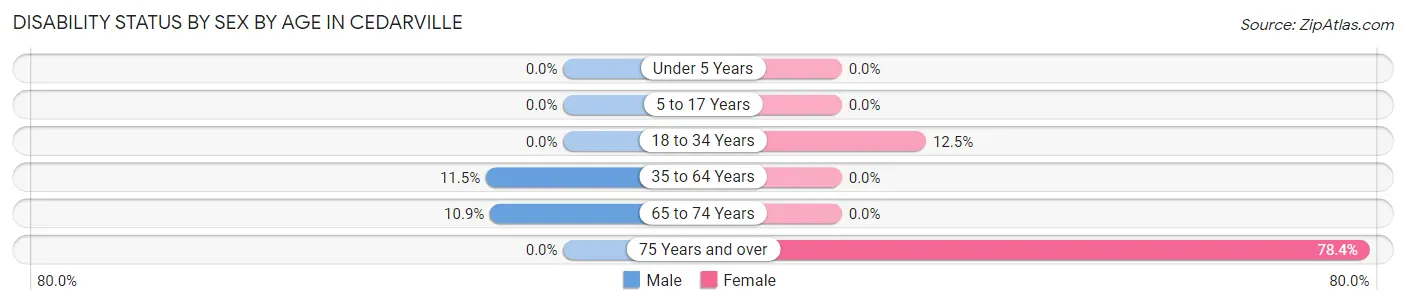
| Age Bracket | Male | Female |
| Under 5 Years | 0 (0.0%) | 0 (0.0%) |
| 5 to 17 Years | 0 (0.0%) | 0 (0.0%) |
| 18 to 34 Years | 0 (0.0%) | 2 (12.5%) |
| 35 to 64 Years | 20 (11.5%) | 0 (0.0%) |
| 65 to 74 Years | 5 (10.9%) | 0 (0.0%) |
| 75 Years and over | 0 (0.0%) | 29 (78.4%) |
Disability Class by Sex by Age in Cedarville
Disability Class: Hearing Difficulty
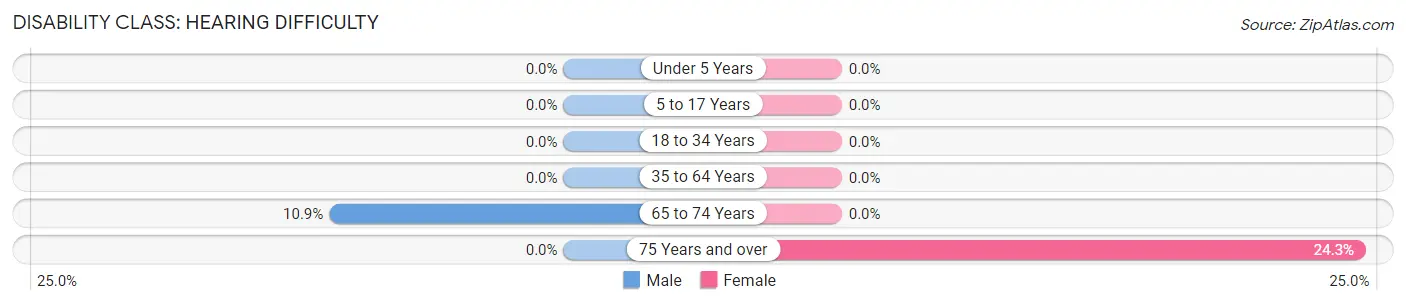
| Age Bracket | Male | Female |
| Under 5 Years | 0 (0.0%) | 0 (0.0%) |
| 5 to 17 Years | 0 (0.0%) | 0 (0.0%) |
| 18 to 34 Years | 0 (0.0%) | 0 (0.0%) |
| 35 to 64 Years | 0 (0.0%) | 0 (0.0%) |
| 65 to 74 Years | 5 (10.9%) | 0 (0.0%) |
| 75 Years and over | 0 (0.0%) | 9 (24.3%) |
Disability Class: Vision Difficulty
| Age Bracket | Male | Female |
| Under 5 Years | 0 (0.0%) | 0 (0.0%) |
| 5 to 17 Years | 0 (0.0%) | 0 (0.0%) |
| 18 to 34 Years | 0 (0.0%) | 0 (0.0%) |
| 35 to 64 Years | 0 (0.0%) | 0 (0.0%) |
| 65 to 74 Years | 0 (0.0%) | 0 (0.0%) |
| 75 Years and over | 0 (0.0%) | 0 (0.0%) |
Disability Class: Cognitive Difficulty
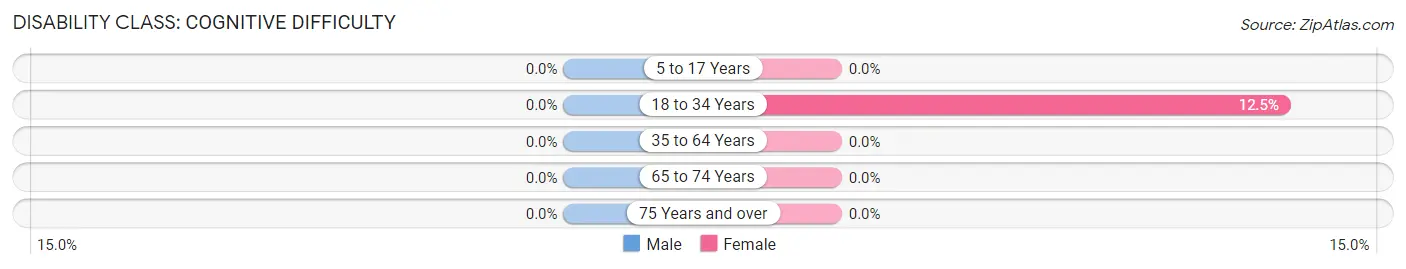
| Age Bracket | Male | Female |
| 5 to 17 Years | 0 (0.0%) | 0 (0.0%) |
| 18 to 34 Years | 0 (0.0%) | 2 (12.5%) |
| 35 to 64 Years | 0 (0.0%) | 0 (0.0%) |
| 65 to 74 Years | 0 (0.0%) | 0 (0.0%) |
| 75 Years and over | 0 (0.0%) | 0 (0.0%) |
Disability Class: Ambulatory Difficulty
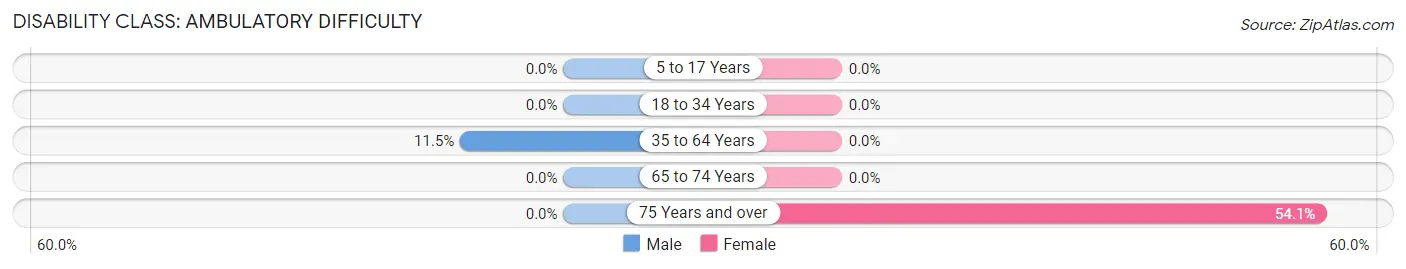
| Age Bracket | Male | Female |
| 5 to 17 Years | 0 (0.0%) | 0 (0.0%) |
| 18 to 34 Years | 0 (0.0%) | 0 (0.0%) |
| 35 to 64 Years | 20 (11.5%) | 0 (0.0%) |
| 65 to 74 Years | 0 (0.0%) | 0 (0.0%) |
| 75 Years and over | 0 (0.0%) | 20 (54.0%) |
Disability Class: Self-Care Difficulty
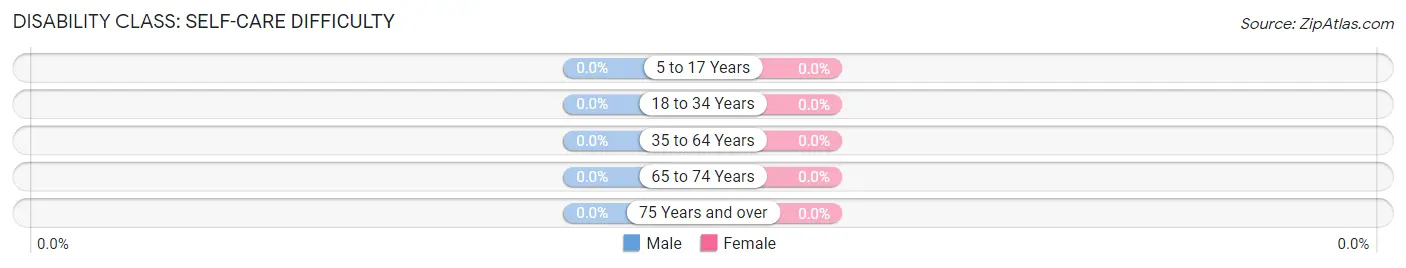
| Age Bracket | Male | Female |
| 5 to 17 Years | 0 (0.0%) | 0 (0.0%) |
| 18 to 34 Years | 0 (0.0%) | 0 (0.0%) |
| 35 to 64 Years | 0 (0.0%) | 0 (0.0%) |
| 65 to 74 Years | 0 (0.0%) | 0 (0.0%) |
| 75 Years and over | 0 (0.0%) | 0 (0.0%) |
Technology Access in Cedarville
Computing Device Access in Cedarville
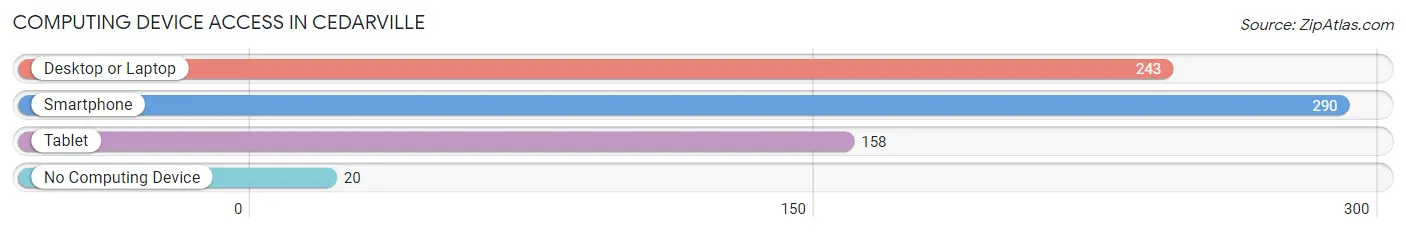
| Device Type | # Households | % Households |
| Desktop or Laptop | 243 | 73.6% |
| Smartphone | 290 | 87.9% |
| Tablet | 158 | 47.9% |
| No Computing Device | 20 | 6.1% |
| Total | 330 | 100.0% |
Internet Access in Cedarville
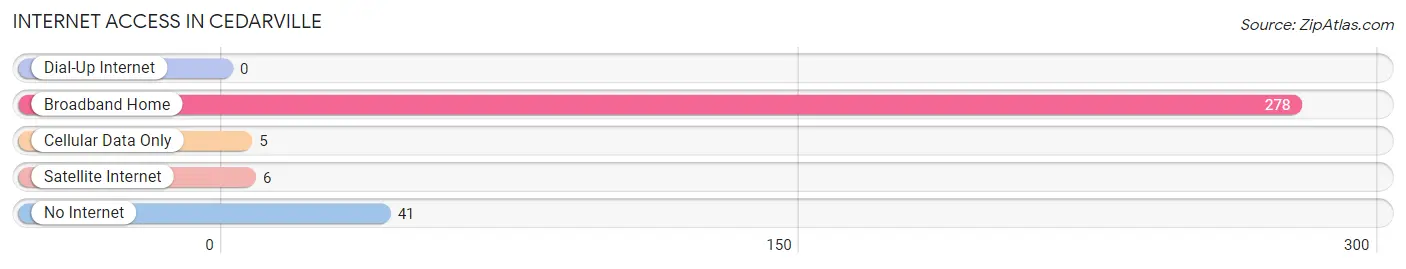
| Internet Type | # Households | % Households |
| Dial-Up Internet | 0 | 0.0% |
| Broadband Home | 278 | 84.2% |
| Cellular Data Only | 5 | 1.5% |
| Satellite Internet | 6 | 1.8% |
| No Internet | 41 | 12.4% |
| Total | 330 | 100.0% |
Cedarville Summary
Cedarville is a small town located in Modoc County, California, United States. It is situated in the Surprise Valley, near the Oregon border. The town is located at an elevation of 4,719 feet (1,438 m) and has a population of approximately 590 people.
History
Cedarville was founded in 1864 by a group of settlers from the Midwest. The town was named after the cedar trees that grew in the area. The settlers were attracted to the area due to its abundance of natural resources, including timber, water, and grazing land.
The town quickly grew and by the late 1800s, it had become a bustling center of commerce. The town was home to several businesses, including a hotel, a general store, a blacksmith shop, and a saloon.
In the early 1900s, the town began to decline due to the depletion of natural resources and the decline of the local economy. By the 1950s, the population had dropped to just over 200 people.
Geography
Cedarville is located in the Surprise Valley, near the Oregon border. The town is situated at an elevation of 4,719 feet (1,438 m). The town is surrounded by the Warner Mountains to the east and the Modoc Plateau to the west.
The climate in Cedarville is semi-arid, with hot summers and cold winters. The average annual temperature is around 50°F (10°C). The average annual precipitation is around 10 inches (25 cm).
Economy
The economy of Cedarville is largely based on agriculture and tourism. The town is home to several farms, which produce a variety of crops, including alfalfa, hay, and wheat.
The town is also home to several tourist attractions, including the Cedarville State Park, the Cedarville Museum, and the Cedarville Rodeo. The town also hosts several events throughout the year, including the Cedarville Days Festival and the Cedarville Rodeo.
Demographics
As of the 2010 census, the population of Cedarville was 590 people. The racial makeup of the town was 95.3% White, 0.2% African American, 0.2% Native American, 0.2% Asian, 0.2% Pacific Islander, 0.2% from other races, and 3.9% from two or more races.
The median household income in Cedarville was $31,250, and the median family income was $37,500. The per capita income was $15,944. About 11.7% of the population was below the poverty line.
Conclusion
Cedarville is a small town located in Modoc County, California. It is situated in the Surprise Valley, near the Oregon border. The town is home to approximately 590 people and is largely based on agriculture and tourism. The town is home to several tourist attractions, including the Cedarville State Park, the Cedarville Museum, and the Cedarville Rodeo. The town also hosts several events throughout the year, including the Cedarville Days Festival and the Cedarville Rodeo. The median household income in Cedarville was $31,250, and the median family income was $37,500. The per capita income was $15,944. About 11.7% of the population was below the poverty line.
Common Questions
What is Per Capita Income in Cedarville?
Per Capita income in Cedarville is $27,402.
What is the Median Household income in Cedarville?
Median Household Income in Cedarville is $45,568.
What is Inequality or Gini Index in Cedarville?
Inequality or Gini Index in Cedarville is 0.42.
What is the Total Population of Cedarville?
Total Population of Cedarville is 783.
What is the Total Male Population of Cedarville?
Total Male Population of Cedarville is 330.
What is the Total Female Population of Cedarville?
Total Female Population of Cedarville is 453.
What is the Ratio of Males per 100 Females in Cedarville?
There are 72.85 Males per 100 Females in Cedarville.
What is the Ratio of Females per 100 Males in Cedarville?
There are 137.27 Females per 100 Males in Cedarville.
What is the Median Population Age in Cedarville?
Median Population Age in Cedarville is 45.3 Years.
What is the Average Family Size in Cedarville
Average Family Size in Cedarville is 2.8 People.
What is the Average Household Size in Cedarville
Average Household Size in Cedarville is 2.3 People.
How Large is the Labor Force in Cedarville?
There are 330 People in the Labor Forcein in Cedarville.
What is the Percentage of People in the Labor Force in Cedarville?
53.2% of People are in the Labor Force in Cedarville.
What is the Unemployment Rate in Cedarville?
Unemployment Rate in Cedarville is 10.6%.