Cities with the Highest Unemployment Rate Amomg Youth Under the Age of 25 in Minnesota
RELATED REPORTS & OPTIONS
Highest Unemployment | Youth < 25
Minnesota
Compare Cities
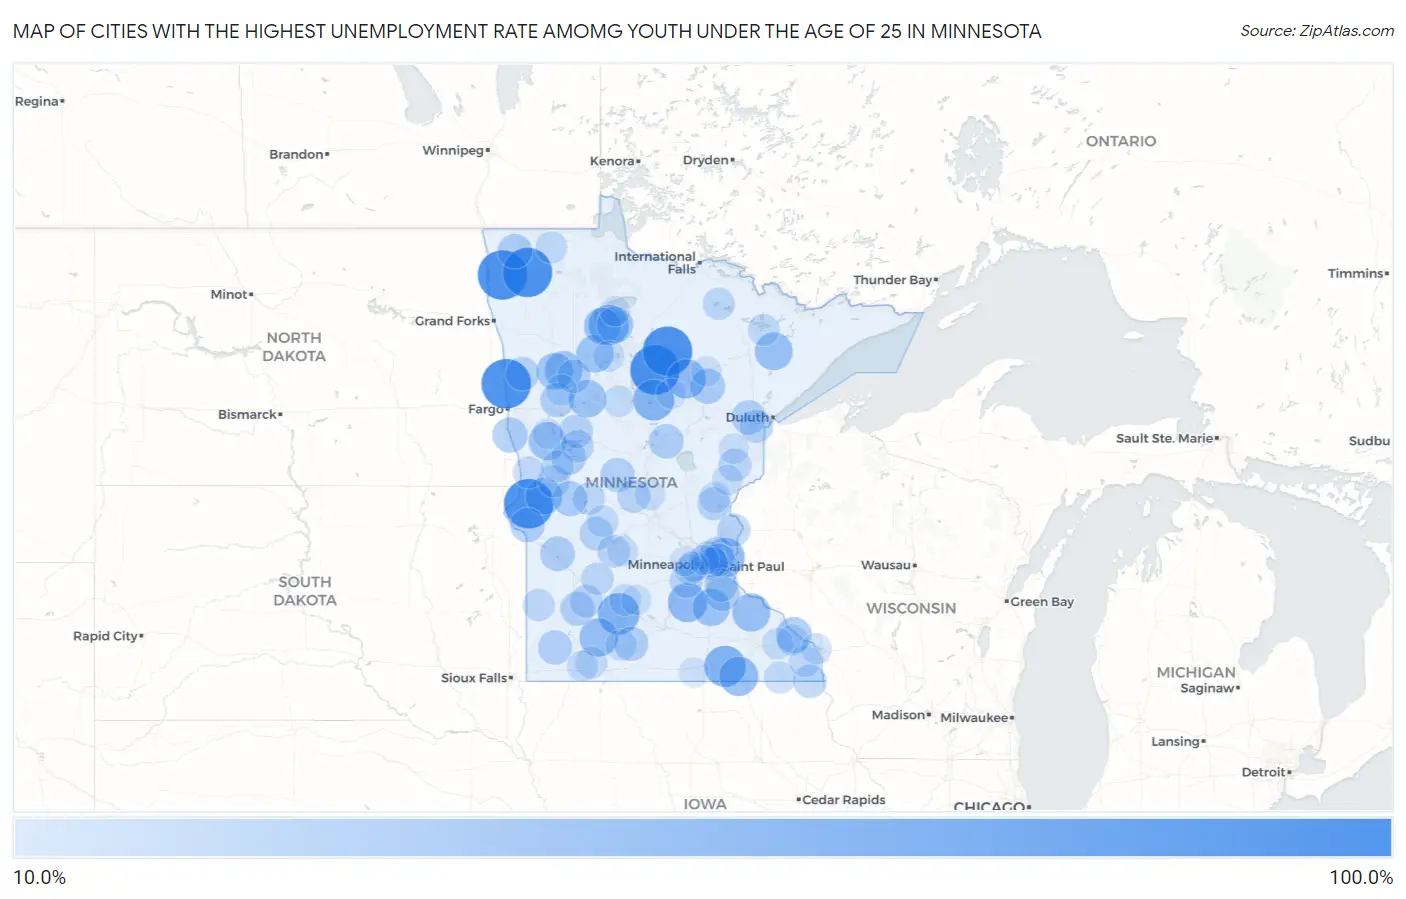
Map of Cities with the Highest Unemployment Rate Amomg Youth Under the Age of 25 in Minnesota
0.0%
100.0%
Cities with the Highest Unemployment Rate Amomg Youth Under the Age of 25 in Minnesota
| City | Youth Unemployment | vs State | vs National | |
| 1. | Stephen | 100.0% | 7.7%(+92.3)#1 | 10.9%(+89.1)#96 |
| 2. | Bena | 100.0% | 7.7%(+92.3)#2 | 10.9%(+89.1)#227 |
| 3. | Dumont | 100.0% | 7.7%(+92.3)#3 | 10.9%(+89.1)#233 |
| 4. | Perley | 100.0% | 7.7%(+92.3)#4 | 10.9%(+89.1)#243 |
| 5. | Inger | 100.0% | 7.7%(+92.3)#5 | 10.9%(+89.1)#273 |
| 6. | Strandquist | 100.0% | 7.7%(+92.3)#6 | 10.9%(+89.1)#290 |
| 7. | Evan | 66.6% | 7.7%(+58.9)#7 | 10.9%(+55.7)#653 |
| 8. | Mapleview | 64.7% | 7.7%(+57.0)#8 | 10.9%(+53.8)#677 |
| 9. | Longville | 63.6% | 7.7%(+55.9)#9 | 10.9%(+52.7)#700 |
| 10. | Red Lake | 61.0% | 7.7%(+53.3)#10 | 10.9%(+50.1)#745 |
| 11. | Willernie | 57.8% | 7.7%(+50.1)#11 | 10.9%(+46.9)#828 |
| 12. | Heidelberg | 57.1% | 7.7%(+49.4)#12 | 10.9%(+46.2)#858 |
| 13. | Cohasset | 56.8% | 7.7%(+49.1)#13 | 10.9%(+45.9)#868 |
| 14. | Adams | 56.2% | 7.7%(+48.5)#14 | 10.9%(+45.3)#879 |
| 15. | Jeffers | 53.5% | 7.7%(+45.8)#15 | 10.9%(+42.6)#973 |
| 16. | Bellechester | 51.8% | 7.7%(+44.1)#16 | 10.9%(+40.9)#1,035 |
| 17. | Hoyt Lakes | 51.3% | 7.7%(+43.6)#17 | 10.9%(+40.4)#1,047 |
| 18. | Shevlin | 50.0% | 7.7%(+42.3)#18 | 10.9%(+39.1)#1,135 |
| 19. | Erhard | 50.0% | 7.7%(+42.3)#19 | 10.9%(+39.1)#1,139 |
| 20. | Beaulieu | 50.0% | 7.7%(+42.3)#20 | 10.9%(+39.1)#1,154 |
| 21. | Pine Point | 49.9% | 7.7%(+42.2)#21 | 10.9%(+39.0)#1,177 |
| 22. | Dundas | 48.7% | 7.7%(+41.0)#22 | 10.9%(+37.8)#1,215 |
| 23. | Little Rock | 48.2% | 7.7%(+40.5)#23 | 10.9%(+37.3)#1,235 |
| 24. | Herman | 47.5% | 7.7%(+39.8)#24 | 10.9%(+36.6)#1,254 |
| 25. | Riverland | 46.6% | 7.7%(+38.9)#25 | 10.9%(+35.7)#1,286 |
| 26. | Redby | 45.4% | 7.7%(+37.7)#26 | 10.9%(+34.5)#1,337 |
| 27. | Minnesota City | 42.8% | 7.7%(+35.1)#27 | 10.9%(+31.9)#1,524 |
| 28. | Warba | 40.0% | 7.7%(+32.3)#28 | 10.9%(+29.1)#1,702 |
| 29. | Wolverton | 40.0% | 7.7%(+32.3)#29 | 10.9%(+29.1)#1,705 |
| 30. | Kensington | 38.8% | 7.7%(+31.1)#30 | 10.9%(+27.9)#1,799 |
| 31. | Lake Bronson | 38.5% | 7.7%(+30.8)#31 | 10.9%(+27.6)#1,810 |
| 32. | Battle Lake | 38.4% | 7.7%(+30.7)#32 | 10.9%(+27.5)#1,815 |
| 33. | Milan | 38.1% | 7.7%(+30.4)#33 | 10.9%(+27.2)#1,844 |
| 34. | Hampton | 37.7% | 7.7%(+30.0)#34 | 10.9%(+26.8)#1,875 |
| 35. | Ironton | 37.7% | 7.7%(+30.0)#35 | 10.9%(+26.8)#1,876 |
| 36. | Clinton | 37.5% | 7.7%(+29.8)#36 | 10.9%(+26.6)#1,894 |
| 37. | Lauderdale | 37.0% | 7.7%(+29.3)#37 | 10.9%(+26.1)#1,936 |
| 38. | Callaway | 36.8% | 7.7%(+29.1)#38 | 10.9%(+25.9)#1,955 |
| 39. | Mahnomen | 36.8% | 7.7%(+29.1)#39 | 10.9%(+25.9)#1,956 |
| 40. | St James | 36.7% | 7.7%(+29.0)#40 | 10.9%(+25.8)#1,957 |
| 41. | Browerville | 36.5% | 7.7%(+28.8)#41 | 10.9%(+25.6)#1,972 |
| 42. | Chandler | 36.3% | 7.7%(+28.6)#42 | 10.9%(+25.4)#1,986 |
| 43. | Milroy | 36.3% | 7.7%(+28.6)#43 | 10.9%(+25.4)#1,994 |
| 44. | Ada | 34.4% | 7.7%(+26.7)#44 | 10.9%(+23.5)#2,159 |
| 45. | Perham | 33.5% | 7.7%(+25.8)#45 | 10.9%(+22.6)#2,232 |
| 46. | North Oaks | 33.4% | 7.7%(+25.7)#46 | 10.9%(+22.5)#2,239 |
| 47. | Carlton | 33.3% | 7.7%(+25.6)#47 | 10.9%(+22.4)#2,256 |
| 48. | Naytahwaush | 33.3% | 7.7%(+25.6)#48 | 10.9%(+22.4)#2,274 |
| 49. | Eitzen | 33.3% | 7.7%(+25.6)#49 | 10.9%(+22.4)#2,295 |
| 50. | Coates | 33.3% | 7.7%(+25.6)#50 | 10.9%(+22.4)#2,335 |
| 51. | Sunburg | 33.3% | 7.7%(+25.6)#51 | 10.9%(+22.4)#2,341 |
| 52. | Carver | 32.6% | 7.7%(+24.9)#52 | 10.9%(+21.7)#2,382 |
| 53. | Braham | 31.5% | 7.7%(+23.8)#53 | 10.9%(+20.6)#2,503 |
| 54. | Upsala | 31.5% | 7.7%(+23.8)#54 | 10.9%(+20.6)#2,510 |
| 55. | Center City | 31.4% | 7.7%(+23.7)#55 | 10.9%(+20.5)#2,524 |
| 56. | Hilltop | 31.2% | 7.7%(+23.5)#56 | 10.9%(+20.3)#2,540 |
| 57. | Askov | 31.0% | 7.7%(+23.3)#57 | 10.9%(+20.1)#2,573 |
| 58. | Little Canada | 30.8% | 7.7%(+23.1)#58 | 10.9%(+19.9)#2,583 |
| 59. | Kandiyohi | 30.5% | 7.7%(+22.8)#59 | 10.9%(+19.6)#2,623 |
| 60. | Vesta | 30.4% | 7.7%(+22.7)#60 | 10.9%(+19.5)#2,638 |
| 61. | Ottertail | 30.0% | 7.7%(+22.3)#61 | 10.9%(+19.1)#2,680 |
| 62. | Elbow Lake | 29.1% | 7.7%(+21.4)#62 | 10.9%(+18.2)#2,801 |
| 63. | Renville | 28.8% | 7.7%(+21.1)#63 | 10.9%(+17.9)#2,837 |
| 64. | Nett Lake | 28.5% | 7.7%(+20.8)#64 | 10.9%(+17.6)#2,895 |
| 65. | Forada | 28.5% | 7.7%(+20.8)#65 | 10.9%(+17.6)#2,899 |
| 66. | Ivanhoe | 28.3% | 7.7%(+20.6)#66 | 10.9%(+17.4)#2,930 |
| 67. | Dalton | 27.7% | 7.7%(+20.0)#67 | 10.9%(+16.8)#3,016 |
| 68. | Harmony | 27.2% | 7.7%(+19.5)#68 | 10.9%(+16.3)#3,075 |
| 69. | Campbell | 27.2% | 7.7%(+19.5)#69 | 10.9%(+16.3)#3,090 |
| 70. | Okabena | 27.2% | 7.7%(+19.5)#70 | 10.9%(+16.3)#3,091 |
| 71. | Tower | 26.6% | 7.7%(+18.9)#71 | 10.9%(+15.7)#3,183 |
| 72. | Houston | 26.5% | 7.7%(+18.8)#72 | 10.9%(+15.6)#3,211 |
| 73. | Brooten | 26.4% | 7.7%(+18.7)#73 | 10.9%(+15.5)#3,225 |
| 74. | Badger | 26.3% | 7.7%(+18.6)#74 | 10.9%(+15.4)#3,247 |
| 75. | Fairfax | 26.0% | 7.7%(+18.3)#75 | 10.9%(+15.1)#3,305 |
| 76. | St Charles | 25.4% | 7.7%(+17.7)#76 | 10.9%(+14.5)#3,400 |
| 77. | Stockton | 25.4% | 7.7%(+17.7)#77 | 10.9%(+14.5)#3,409 |
| 78. | Nevis | 25.0% | 7.7%(+17.3)#78 | 10.9%(+14.1)#3,487 |
| 79. | Grasston | 25.0% | 7.7%(+17.3)#79 | 10.9%(+14.1)#3,506 |
| 80. | Butterfield | 24.9% | 7.7%(+17.2)#80 | 10.9%(+14.0)#3,535 |
| 81. | White Earth | 24.6% | 7.7%(+16.9)#81 | 10.9%(+13.7)#3,593 |
| 82. | Brewster | 24.1% | 7.7%(+16.4)#82 | 10.9%(+13.2)#3,687 |
| 83. | Wilton | 23.9% | 7.7%(+16.2)#83 | 10.9%(+13.0)#3,726 |
| 84. | Deephaven | 23.5% | 7.7%(+15.8)#84 | 10.9%(+12.6)#3,810 |
| 85. | Dakota | 23.5% | 7.7%(+15.8)#85 | 10.9%(+12.6)#3,823 |
| 86. | Royalton | 23.1% | 7.7%(+15.4)#86 | 10.9%(+12.2)#3,908 |
| 87. | Hinckley | 22.8% | 7.7%(+15.1)#87 | 10.9%(+11.9)#3,985 |
| 88. | Shorewood | 22.4% | 7.7%(+14.7)#88 | 10.9%(+11.5)#4,061 |
| 89. | Falcon Heights | 22.3% | 7.7%(+14.6)#89 | 10.9%(+11.4)#4,093 |
| 90. | Atwater | 22.2% | 7.7%(+14.5)#90 | 10.9%(+11.3)#4,132 |
| 91. | Woodland | 22.2% | 7.7%(+14.5)#91 | 10.9%(+11.3)#4,151 |
| 92. | Sturgeon Lake | 22.2% | 7.7%(+14.5)#92 | 10.9%(+11.3)#4,155 |
| 93. | Ponemah | 21.2% | 7.7%(+13.5)#93 | 10.9%(+10.3)#4,392 |
| 94. | Pelican Rapids | 20.8% | 7.7%(+13.1)#94 | 10.9%(+9.90)#4,498 |
| 95. | Gibbon | 20.8% | 7.7%(+13.1)#95 | 10.9%(+9.90)#4,509 |
| 96. | Marble | 20.8% | 7.7%(+13.1)#96 | 10.9%(+9.90)#4,512 |
| 97. | Remer | 20.5% | 7.7%(+12.8)#97 | 10.9%(+9.60)#4,579 |
| 98. | Robbinsdale | 20.3% | 7.7%(+12.6)#98 | 10.9%(+9.40)#4,616 |
| 99. | Maple Plain | 20.0% | 7.7%(+12.3)#99 | 10.9%(+9.10)#4,694 |
| 100. | Conger | 20.0% | 7.7%(+12.3)#100 | 10.9%(+9.10)#4,737 |
Common Questions
What are the Top 10 Cities with the Highest Unemployment Rate Amomg Youth Under the Age of 25 in Minnesota?
Top 10 Cities with the Highest Unemployment Rate Amomg Youth Under the Age of 25 in Minnesota are:
What city has the Highest Unemployment Rate Amomg Youth Under the Age of 25 in Minnesota?
Stephen has the Highest Unemployment Rate Amomg Youth Under the Age of 25 in Minnesota with 100.0%.
What is the Unemployment Rate Amomg Youth Under the Age of 25 in the State of Minnesota?
Unemployment Rate Amomg Youth Under the Age of 25 in Minnesota is 7.7%.
What is the Unemployment Rate Amomg Youth Under the Age of 25 in the United States?
Unemployment Rate Amomg Youth Under the Age of 25 in the United States is 10.9%.