Cities with the Highest Unemployment Rate Amomg Youth Under the Age of 25 in Idaho
RELATED REPORTS & OPTIONS
Highest Unemployment | Youth < 25
Idaho
Compare Cities
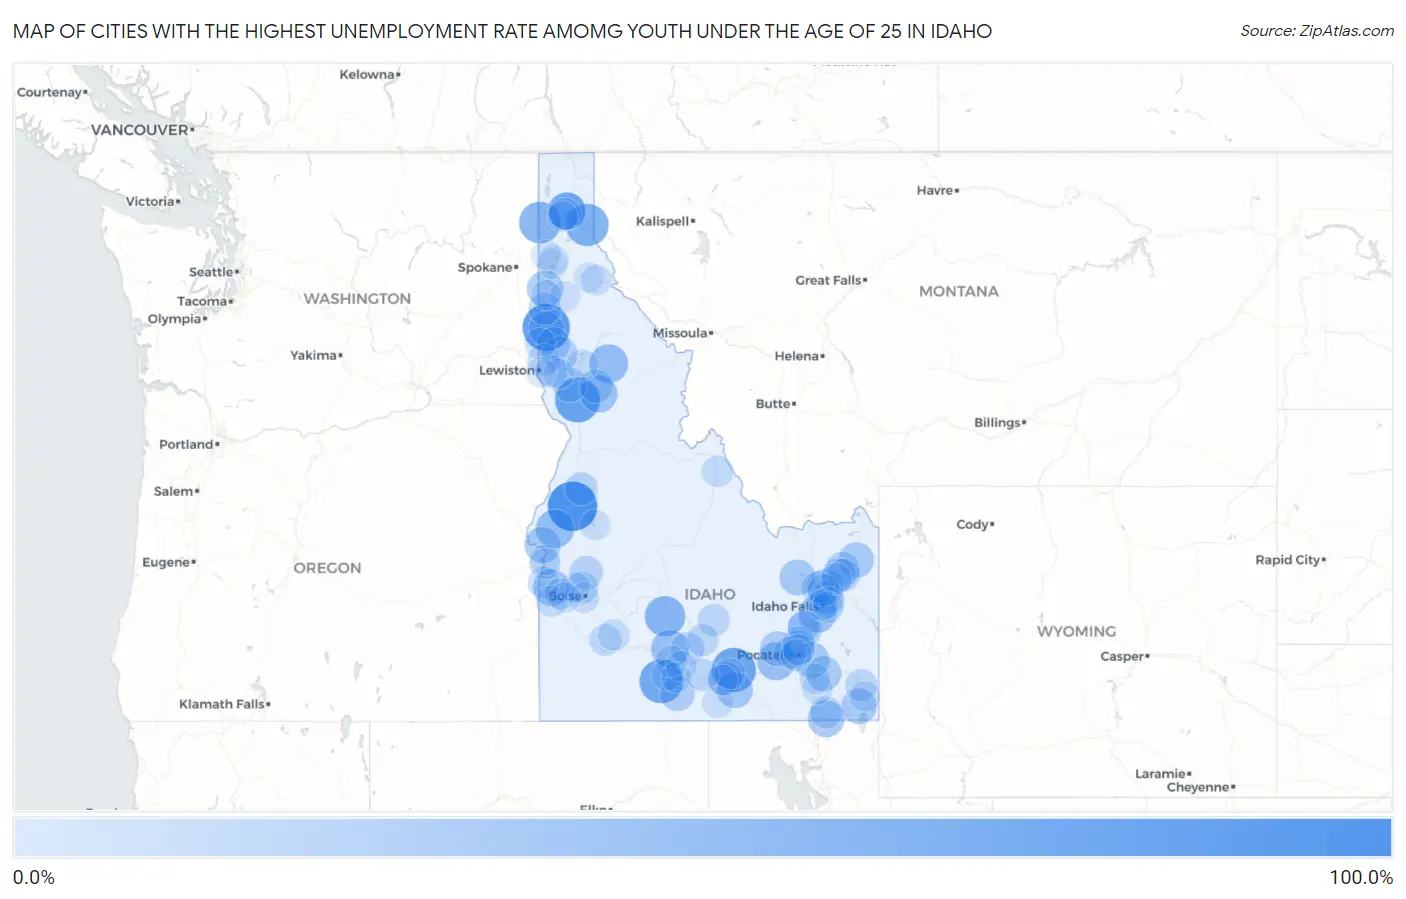
Map of Cities with the Highest Unemployment Rate Amomg Youth Under the Age of 25 in Idaho
0.0%
100.0%
Cities with the Highest Unemployment Rate Amomg Youth Under the Age of 25 in Idaho
| City | Youth Unemployment | vs State | vs National | |
| 1. | Council | 92.2% | 8.3%(+83.9)#1 | 10.9%(+81.3)#396 |
| 2. | Onaway | 81.8% | 8.3%(+73.5)#2 | 10.9%(+70.9)#448 |
| 3. | Cottonwood | 71.4% | 8.3%(+63.1)#3 | 10.9%(+60.5)#562 |
| 4. | Acequia | 68.4% | 8.3%(+60.1)#4 | 10.9%(+57.5)#610 |
| 5. | Castleford | 66.6% | 8.3%(+58.3)#5 | 10.9%(+55.7)#642 |
| 6. | Clark Fork | 59.2% | 8.3%(+50.9)#6 | 10.9%(+48.3)#796 |
| 7. | Oldtown | 55.9% | 8.3%(+47.6)#7 | 10.9%(+45.0)#887 |
| 8. | Fairfield | 50.9% | 8.3%(+42.6)#8 | 10.9%(+40.0)#1,059 |
| 9. | Pierce | 42.8% | 8.3%(+34.5)#9 | 10.9%(+31.9)#1,512 |
| 10. | Midvale | 41.6% | 8.3%(+33.3)#10 | 10.9%(+30.7)#1,600 |
| 11. | American Falls | 40.2% | 8.3%(+31.9)#11 | 10.9%(+29.3)#1,676 |
| 12. | Gooding | 39.2% | 8.3%(+30.9)#12 | 10.9%(+28.3)#1,763 |
| 13. | Ponderay | 38.8% | 8.3%(+30.5)#13 | 10.9%(+27.9)#1,796 |
| 14. | Shelley | 38.6% | 8.3%(+30.3)#14 | 10.9%(+27.7)#1,802 |
| 15. | Kooskia | 37.5% | 8.3%(+29.2)#15 | 10.9%(+26.6)#1,889 |
| 16. | Kootenai | 35.9% | 8.3%(+27.6)#16 | 10.9%(+25.0)#2,023 |
| 17. | Weston | 34.4% | 8.3%(+26.1)#17 | 10.9%(+23.5)#2,165 |
| 18. | Notus | 33.7% | 8.3%(+25.4)#18 | 10.9%(+22.8)#2,227 |
| 19. | Menan | 32.6% | 8.3%(+24.3)#19 | 10.9%(+21.7)#2,391 |
| 20. | Worley | 31.9% | 8.3%(+23.6)#20 | 10.9%(+21.0)#2,462 |
| 21. | Weiser | 31.6% | 8.3%(+23.3)#21 | 10.9%(+20.7)#2,490 |
| 22. | Albion | 31.2% | 8.3%(+22.9)#22 | 10.9%(+20.3)#2,547 |
| 23. | Inkom | 30.6% | 8.3%(+22.3)#23 | 10.9%(+19.7)#2,615 |
| 24. | Mud Lake | 30.4% | 8.3%(+22.1)#24 | 10.9%(+19.5)#2,636 |
| 25. | Ashton | 28.5% | 8.3%(+20.2)#25 | 10.9%(+17.6)#2,870 |
| 26. | Bloomington | 28.5% | 8.3%(+20.2)#26 | 10.9%(+17.6)#2,896 |
| 27. | Lava Hot Springs | 27.2% | 8.3%(+18.9)#27 | 10.9%(+16.3)#3,084 |
| 28. | Aberdeen | 26.1% | 8.3%(+17.8)#28 | 10.9%(+15.2)#3,285 |
| 29. | Potlatch | 25.0% | 8.3%(+16.7)#29 | 10.9%(+14.1)#3,471 |
| 30. | Hollister | 25.0% | 8.3%(+16.7)#30 | 10.9%(+14.1)#3,489 |
| 31. | Kendrick | 25.0% | 8.3%(+16.7)#31 | 10.9%(+14.1)#3,494 |
| 32. | Blackfoot | 24.2% | 8.3%(+15.9)#32 | 10.9%(+13.3)#3,655 |
| 33. | Heyburn | 22.8% | 8.3%(+14.5)#33 | 10.9%(+11.9)#3,980 |
| 34. | Craigmont | 22.2% | 8.3%(+13.9)#34 | 10.9%(+11.3)#4,153 |
| 35. | St Anthony | 20.9% | 8.3%(+12.6)#35 | 10.9%(+10.00)#4,472 |
| 36. | Sugar City | 20.1% | 8.3%(+11.8)#36 | 10.9%(+9.20)#4,674 |
| 37. | Tyhee | 20.1% | 8.3%(+11.8)#37 | 10.9%(+9.20)#4,678 |
| 38. | Kamiah | 19.6% | 8.3%(+11.3)#38 | 10.9%(+8.70)#4,852 |
| 39. | Ucon | 19.2% | 8.3%(+10.9)#39 | 10.9%(+8.30)#4,970 |
| 40. | Horseshoe Bend | 19.0% | 8.3%(+10.7)#40 | 10.9%(+8.10)#5,044 |
| 41. | Troy | 18.7% | 8.3%(+10.4)#41 | 10.9%(+7.80)#5,146 |
| 42. | Shoshone | 18.3% | 8.3%(+10.00)#42 | 10.9%(+7.40)#5,267 |
| 43. | New Meadows | 18.1% | 8.3%(+9.80)#43 | 10.9%(+7.20)#5,348 |
| 44. | Tensed | 16.6% | 8.3%(+8.30)#44 | 10.9%(+5.70)#6,017 |
| 45. | Teton | 16.3% | 8.3%(+8.00)#45 | 10.9%(+5.40)#6,105 |
| 46. | Fort Hall | 16.0% | 8.3%(+7.70)#46 | 10.9%(+5.10)#6,216 |
| 47. | Arbon Valley | 15.0% | 8.3%(+6.70)#47 | 10.9%(+4.10)#6,689 |
| 48. | Roberts | 15.0% | 8.3%(+6.70)#48 | 10.9%(+4.10)#6,692 |
| 49. | Carey | 14.9% | 8.3%(+6.60)#49 | 10.9%(+4.00)#6,740 |
| 50. | Hazelton | 14.5% | 8.3%(+6.20)#50 | 10.9%(+3.60)#6,932 |
| 51. | Georgetown | 14.5% | 8.3%(+6.20)#51 | 10.9%(+3.60)#6,937 |
| 52. | Genesee | 14.2% | 8.3%(+5.90)#52 | 10.9%(+3.30)#7,080 |
| 53. | Lewisville | 14.2% | 8.3%(+5.90)#53 | 10.9%(+3.30)#7,104 |
| 54. | Dayton | 14.0% | 8.3%(+5.70)#54 | 10.9%(+3.10)#7,234 |
| 55. | Groveland | 13.7% | 8.3%(+5.40)#55 | 10.9%(+2.80)#7,408 |
| 56. | Richfield | 13.7% | 8.3%(+5.40)#56 | 10.9%(+2.80)#7,425 |
| 57. | Hidden Springs | 13.5% | 8.3%(+5.20)#57 | 10.9%(+2.60)#7,539 |
| 58. | Lapwai | 13.3% | 8.3%(+5.00)#58 | 10.9%(+2.40)#7,645 |
| 59. | Sandpoint | 12.9% | 8.3%(+4.60)#59 | 10.9%(+2.00)#7,866 |
| 60. | Parma | 12.7% | 8.3%(+4.40)#60 | 10.9%(+1.80)#8,001 |
| 61. | Mountain Home Afb | 12.6% | 8.3%(+4.30)#61 | 10.9%(+1.70)#8,048 |
| 62. | Salmon | 11.6% | 8.3%(+3.30)#62 | 10.9%(+0.700)#8,672 |
| 63. | Chubbuck | 11.5% | 8.3%(+3.20)#63 | 10.9%(+0.600)#8,717 |
| 64. | Moscow | 11.3% | 8.3%(+3.00)#64 | 10.9%(+0.400)#8,837 |
| 65. | Iona | 11.1% | 8.3%(+2.80)#65 | 10.9%(+0.200)#8,990 |
| 66. | Mountain Home | 11.0% | 8.3%(+2.70)#66 | 10.9%(+0.100)#9,076 |
| 67. | Pocatello | 10.8% | 8.3%(+2.50)#67 | 10.9%(-0.100)#9,174 |
| 68. | Wendell | 10.5% | 8.3%(+2.20)#68 | 10.9%(-0.400)#9,421 |
| 69. | Ammon | 10.4% | 8.3%(+2.10)#69 | 10.9%(-0.500)#9,481 |
| 70. | Orofino | 10.4% | 8.3%(+2.10)#70 | 10.9%(-0.500)#9,514 |
| 71. | Idaho Falls | 9.8% | 8.3%(+1.50)#71 | 10.9%(-1.10)#9,949 |
| 72. | Marsing | 9.5% | 8.3%(+1.20)#72 | 10.9%(-1.40)#10,226 |
| 73. | Hammett | 9.5% | 8.3%(+1.20)#73 | 10.9%(-1.40)#10,241 |
| 74. | Caldwell | 9.3% | 8.3%(+1.00)#74 | 10.9%(-1.60)#10,322 |
| 75. | Rexburg | 9.2% | 8.3%(+0.900)#75 | 10.9%(-1.70)#10,419 |
| 76. | Buhl | 9.2% | 8.3%(+0.900)#76 | 10.9%(-1.70)#10,454 |
| 77. | Fruitland | 8.8% | 8.3%(+0.500)#77 | 10.9%(-2.10)#10,764 |
| 78. | Oakley | 8.8% | 8.3%(+0.500)#78 | 10.9%(-2.10)#10,803 |
| 79. | Rupert | 8.3% | 8.3%(=0.000)#79 | 10.9%(-2.60)#11,197 |
| 80. | Osburn | 8.3% | 8.3%(=0.000)#80 | 10.9%(-2.60)#11,217 |
| 81. | Downey | 8.3% | 8.3%(=0.000)#81 | 10.9%(-2.60)#11,227 |
| 82. | Culdesac | 8.3% | 8.3%(=0.000)#82 | 10.9%(-2.60)#11,242 |
| 83. | Jerome | 7.9% | 8.3%(-0.400)#83 | 10.9%(-3.00)#11,476 |
| 84. | Cascade | 7.8% | 8.3%(-0.500)#84 | 10.9%(-3.10)#11,593 |
| 85. | Arimo | 7.6% | 8.3%(-0.700)#85 | 10.9%(-3.30)#11,770 |
| 86. | Montpelier | 7.5% | 8.3%(-0.800)#86 | 10.9%(-3.40)#11,826 |
| 87. | Boise City | 7.4% | 8.3%(-0.900)#87 | 10.9%(-3.50)#11,854 |
| 88. | Eagle | 7.3% | 8.3%(-1.00)#88 | 10.9%(-3.60)#11,953 |
| 89. | Payette | 7.0% | 8.3%(-1.30)#89 | 10.9%(-3.90)#12,197 |
| 90. | Nampa | 6.4% | 8.3%(-1.90)#90 | 10.9%(-4.50)#12,622 |
| 91. | Burley | 6.4% | 8.3%(-1.90)#91 | 10.9%(-4.50)#12,644 |
| 92. | St Maries | 6.0% | 8.3%(-2.30)#92 | 10.9%(-4.90)#12,987 |
| 93. | Dover | 6.0% | 8.3%(-2.30)#93 | 10.9%(-4.90)#13,020 |
| 94. | Dalton Gardens | 5.9% | 8.3%(-2.40)#94 | 10.9%(-5.00)#13,077 |
| 95. | Coeur D Alene | 5.8% | 8.3%(-2.50)#95 | 10.9%(-5.10)#13,106 |
| 96. | Lewiston | 5.7% | 8.3%(-2.60)#96 | 10.9%(-5.20)#13,192 |
| 97. | Plummer | 5.7% | 8.3%(-2.60)#97 | 10.9%(-5.20)#13,247 |
| 98. | Filer | 5.5% | 8.3%(-2.80)#98 | 10.9%(-5.40)#13,385 |
| 99. | Kellogg | 5.5% | 8.3%(-2.80)#99 | 10.9%(-5.40)#13,389 |
| 100. | Rathdrum | 5.2% | 8.3%(-3.10)#100 | 10.9%(-5.70)#13,595 |
1
2Common Questions
What are the Top 10 Cities with the Highest Unemployment Rate Amomg Youth Under the Age of 25 in Idaho?
Top 10 Cities with the Highest Unemployment Rate Amomg Youth Under the Age of 25 in Idaho are:
#1
92.2%
#2
81.8%
#3
71.4%
#4
68.4%
#5
66.6%
#6
59.2%
#7
55.9%
#8
50.9%
#9
42.8%
#10
41.6%
What city has the Highest Unemployment Rate Amomg Youth Under the Age of 25 in Idaho?
Council has the Highest Unemployment Rate Amomg Youth Under the Age of 25 in Idaho with 92.2%.
What is the Unemployment Rate Amomg Youth Under the Age of 25 in the State of Idaho?
Unemployment Rate Amomg Youth Under the Age of 25 in Idaho is 8.3%.
What is the Unemployment Rate Amomg Youth Under the Age of 25 in the United States?
Unemployment Rate Amomg Youth Under the Age of 25 in the United States is 10.9%.