Cities with the Highest Unemployment Rate Amomg Youth Under the Age of 25 in North Dakota
RELATED REPORTS & OPTIONS
Highest Unemployment | Youth < 25
North Dakota
Compare Cities
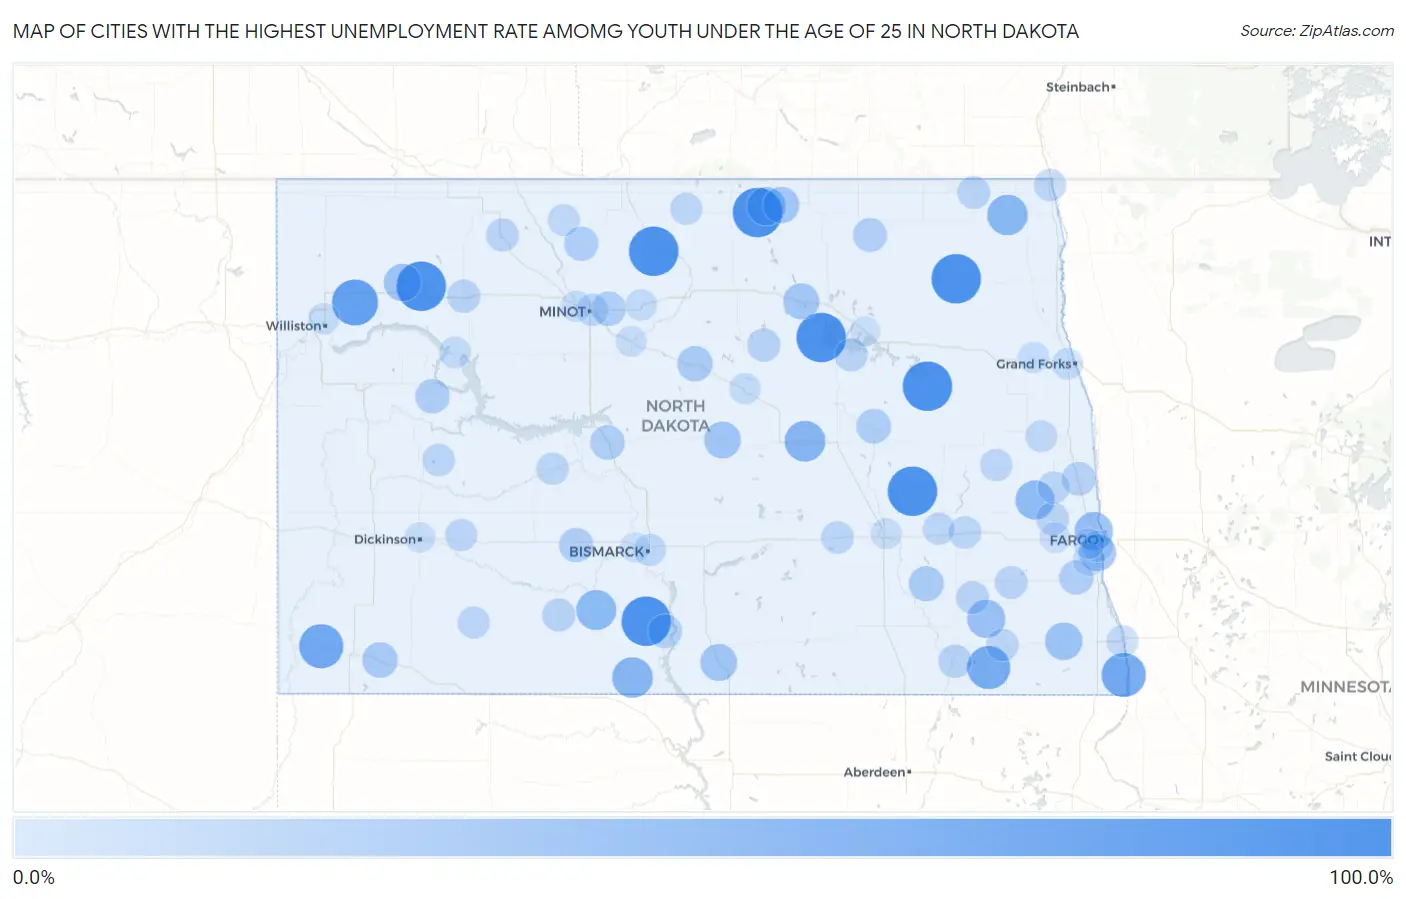
Map of Cities with the Highest Unemployment Rate Amomg Youth Under the Age of 25 in North Dakota
0.0%
100.0%
Cities with the Highest Unemployment Rate Amomg Youth Under the Age of 25 in North Dakota
| City | Youth Unemployment | vs State | vs National | |
| 1. | Upham | 100.0% | 6.4%(+93.6)#1 | 10.9%(+89.1)#196 |
| 2. | Minnewaukan | 100.0% | 6.4%(+93.6)#2 | 10.9%(+89.1)#214 |
| 3. | Wimbledon | 100.0% | 6.4%(+93.6)#3 | 10.9%(+89.1)#220 |
| 4. | Adams | 100.0% | 6.4%(+93.6)#4 | 10.9%(+89.1)#253 |
| 5. | White Earth | 100.0% | 6.4%(+93.6)#5 | 10.9%(+89.1)#288 |
| 6. | Solen | 100.0% | 6.4%(+93.6)#6 | 10.9%(+89.1)#291 |
| 7. | Pekin | 100.0% | 6.4%(+93.6)#7 | 10.9%(+89.1)#297 |
| 8. | Shell Valley | 99.9% | 6.4%(+93.5)#8 | 10.9%(+89.0)#332 |
| 9. | Apple Valley | 99.9% | 6.4%(+93.5)#9 | 10.9%(+89.0)#355 |
| 10. | Epping | 81.8% | 6.4%(+75.4)#10 | 10.9%(+70.9)#449 |
| 11. | Fairmount | 71.4% | 6.4%(+65.0)#11 | 10.9%(+60.5)#566 |
| 12. | Rhame | 71.4% | 6.4%(+65.0)#12 | 10.9%(+60.5)#568 |
| 13. | Cogswell | 66.6% | 6.4%(+60.2)#13 | 10.9%(+55.7)#650 |
| 14. | Sykeston | 53.8% | 6.4%(+47.4)#14 | 10.9%(+42.9)#961 |
| 15. | Selfridge | 53.3% | 6.4%(+46.9)#15 | 10.9%(+42.4)#984 |
| 16. | Cavalier | 52.5% | 6.4%(+46.1)#16 | 10.9%(+41.6)#1,008 |
| 17. | Flasher | 50.0% | 6.4%(+43.6)#17 | 10.9%(+39.1)#1,119 |
| 18. | Erie | 45.4% | 6.4%(+39.0)#18 | 10.9%(+34.5)#1,350 |
| 19. | Belcourt | 41.9% | 6.4%(+35.5)#19 | 10.9%(+31.0)#1,570 |
| 20. | Reile S Acres | 41.5% | 6.4%(+35.1)#20 | 10.9%(+30.6)#1,612 |
| 21. | Elliott | 40.0% | 6.4%(+33.6)#21 | 10.9%(+29.1)#1,718 |
| 22. | Wyndmere | 36.6% | 6.4%(+30.2)#22 | 10.9%(+25.7)#1,968 |
| 23. | Tioga | 36.3% | 6.4%(+29.9)#23 | 10.9%(+25.4)#1,977 |
| 24. | Frontier | 35.0% | 6.4%(+28.6)#24 | 10.9%(+24.1)#2,116 |
| 25. | Strasburg | 33.3% | 6.4%(+26.9)#25 | 10.9%(+22.4)#2,271 |
| 26. | Goodrich | 33.3% | 6.4%(+26.9)#26 | 10.9%(+22.4)#2,337 |
| 27. | Rolla | 31.1% | 6.4%(+24.7)#27 | 10.9%(+20.2)#2,558 |
| 28. | Leeds | 29.9% | 6.4%(+23.5)#28 | 10.9%(+19.0)#2,705 |
| 29. | Scranton | 26.6% | 6.4%(+20.2)#29 | 10.9%(+15.7)#3,184 |
| 30. | Drake | 26.3% | 6.4%(+19.9)#30 | 10.9%(+15.4)#3,253 |
| 31. | Marion | 25.0% | 6.4%(+18.6)#31 | 10.9%(+14.1)#3,507 |
| 32. | Grace City | 23.0% | 6.4%(+16.6)#32 | 10.9%(+12.1)#3,954 |
| 33. | Underwood | 22.2% | 6.4%(+15.8)#33 | 10.9%(+11.3)#4,145 |
| 34. | Mandaree | 21.7% | 6.4%(+15.3)#34 | 10.9%(+10.8)#4,259 |
| 35. | Surrey | 21.4% | 6.4%(+15.0)#35 | 10.9%(+10.5)#4,338 |
| 36. | New Salem | 21.4% | 6.4%(+15.0)#36 | 10.9%(+10.5)#4,343 |
| 37. | Lansford | 21.4% | 6.4%(+15.0)#37 | 10.9%(+10.5)#4,353 |
| 38. | Kindred | 20.8% | 6.4%(+14.4)#38 | 10.9%(+9.90)#4,505 |
| 39. | Munich | 20.0% | 6.4%(+13.6)#39 | 10.9%(+9.10)#4,715 |
| 40. | Cannon Ball | 19.3% | 6.4%(+12.9)#40 | 10.9%(+8.40)#4,948 |
| 41. | Grandin | 18.1% | 6.4%(+11.7)#41 | 10.9%(+7.20)#5,362 |
| 42. | Oakes | 16.1% | 6.4%(+9.70)#42 | 10.9%(+5.20)#6,171 |
| 43. | Stanley | 15.5% | 6.4%(+9.10)#43 | 10.9%(+4.60)#6,454 |
| 44. | Carson | 15.3% | 6.4%(+8.90)#44 | 10.9%(+4.40)#6,565 |
| 45. | Esmond | 15.3% | 6.4%(+8.90)#45 | 10.9%(+4.40)#6,572 |
| 46. | Kenmare | 14.8% | 6.4%(+8.40)#46 | 10.9%(+3.90)#6,805 |
| 47. | Fort Ransom | 14.2% | 6.4%(+7.80)#47 | 10.9%(+3.30)#7,149 |
| 48. | Fort Totten | 13.8% | 6.4%(+7.40)#48 | 10.9%(+2.90)#7,352 |
| 49. | Amenia | 13.6% | 6.4%(+7.20)#49 | 10.9%(+2.70)#7,505 |
| 50. | Enderlin | 13.5% | 6.4%(+7.10)#50 | 10.9%(+2.60)#7,549 |
| 51. | Walhalla | 13.4% | 6.4%(+7.00)#51 | 10.9%(+2.50)#7,598 |
| 52. | Cleveland | 12.5% | 6.4%(+6.10)#52 | 10.9%(+1.60)#8,154 |
| 53. | Valley City | 12.3% | 6.4%(+5.90)#53 | 10.9%(+1.40)#8,246 |
| 54. | Gwinner | 11.9% | 6.4%(+5.50)#54 | 10.9%(+1.00)#8,492 |
| 55. | Dunn Center | 11.9% | 6.4%(+5.50)#55 | 10.9%(+1.00)#8,504 |
| 56. | Hazen | 11.5% | 6.4%(+5.10)#56 | 10.9%(+0.600)#8,738 |
| 57. | Hope | 11.1% | 6.4%(+4.70)#57 | 10.9%(+0.200)#9,046 |
| 58. | Minot | 11.0% | 6.4%(+4.60)#58 | 10.9%(+0.100)#9,070 |
| 59. | Mott | 10.7% | 6.4%(+4.30)#59 | 10.9%(-0.200)#9,285 |
| 60. | Pembina | 10.7% | 6.4%(+4.30)#60 | 10.9%(-0.200)#9,287 |
| 61. | Hunter | 10.5% | 6.4%(+4.10)#61 | 10.9%(-0.400)#9,449 |
| 62. | Bottineau | 10.0% | 6.4%(+3.60)#62 | 10.9%(-0.900)#9,821 |
| 63. | Taylor | 10.0% | 6.4%(+3.60)#63 | 10.9%(-0.900)#9,855 |
| 64. | Sanborn | 10.0% | 6.4%(+3.60)#64 | 10.9%(-0.900)#9,857 |
| 65. | Bismarck | 9.7% | 6.4%(+3.30)#65 | 10.9%(-1.20)#10,016 |
| 66. | Mohall | 9.6% | 6.4%(+3.20)#66 | 10.9%(-1.30)#10,155 |
| 67. | Mayville | 8.8% | 6.4%(+2.40)#67 | 10.9%(-2.10)#10,785 |
| 68. | Wahpeton | 8.6% | 6.4%(+2.20)#68 | 10.9%(-2.30)#10,931 |
| 69. | Horace | 7.7% | 6.4%(+1.30)#69 | 10.9%(-3.20)#11,655 |
| 70. | New Town | 7.3% | 6.4%(+0.900)#70 | 10.9%(-3.60)#11,998 |
| 71. | Granville | 6.8% | 6.4%(+0.400)#71 | 10.9%(-4.10)#12,391 |
| 72. | Williston | 6.6% | 6.4%(+0.200)#72 | 10.9%(-4.30)#12,471 |
| 73. | Fargo | 6.4% | 6.4%(=0.000)#73 | 10.9%(-4.50)#12,620 |
| 74. | Grand Forks | 6.3% | 6.4%(-0.100)#74 | 10.9%(-4.60)#12,693 |
| 75. | Harvey | 6.3% | 6.4%(-0.100)#75 | 10.9%(-4.60)#12,742 |
| 76. | Grand Forks Afb | 5.1% | 6.4%(-1.30)#76 | 10.9%(-5.80)#13,706 |
| 77. | Burlington | 4.9% | 6.4%(-1.50)#77 | 10.9%(-6.00)#13,839 |
| 78. | Jamestown | 4.6% | 6.4%(-1.80)#78 | 10.9%(-6.30)#14,035 |
| 79. | Velva | 4.5% | 6.4%(-1.90)#79 | 10.9%(-6.40)#14,147 |
| 80. | Casselton | 2.6% | 6.4%(-3.80)#80 | 10.9%(-8.30)#15,415 |
| 81. | West Fargo | 2.5% | 6.4%(-3.90)#81 | 10.9%(-8.40)#15,438 |
| 82. | Dickinson | 2.0% | 6.4%(-4.40)#82 | 10.9%(-8.90)#15,712 |
| 83. | Devils Lake | 1.5% | 6.4%(-4.90)#83 | 10.9%(-9.40)#15,928 |
| 84. | Mandan | 0.90% | 6.4%(-5.50)#84 | 10.9%(-10.00)#16,073 |
1
2Common Questions
What are the Top 10 Cities with the Highest Unemployment Rate Amomg Youth Under the Age of 25 in North Dakota?
Top 10 Cities with the Highest Unemployment Rate Amomg Youth Under the Age of 25 in North Dakota are:
#1
100.0%
#2
100.0%
#3
100.0%
#4
100.0%
#5
100.0%
#6
100.0%
#7
100.0%
#8
99.9%
#9
81.8%
#10
71.4%
What city has the Highest Unemployment Rate Amomg Youth Under the Age of 25 in North Dakota?
Upham has the Highest Unemployment Rate Amomg Youth Under the Age of 25 in North Dakota with 100.0%.
What is the Unemployment Rate Amomg Youth Under the Age of 25 in the State of North Dakota?
Unemployment Rate Amomg Youth Under the Age of 25 in North Dakota is 6.4%.
What is the Unemployment Rate Amomg Youth Under the Age of 25 in the United States?
Unemployment Rate Amomg Youth Under the Age of 25 in the United States is 10.9%.