Cities with the Highest Percentage of Population Employed in Security & Protection in Washington
RELATED REPORTS & OPTIONS
Security & Protection
Washington
Compare Cities
Map of Cities with the Highest Percentage of Population Employed in Security & Protection in Washington
0.0%
25.0%
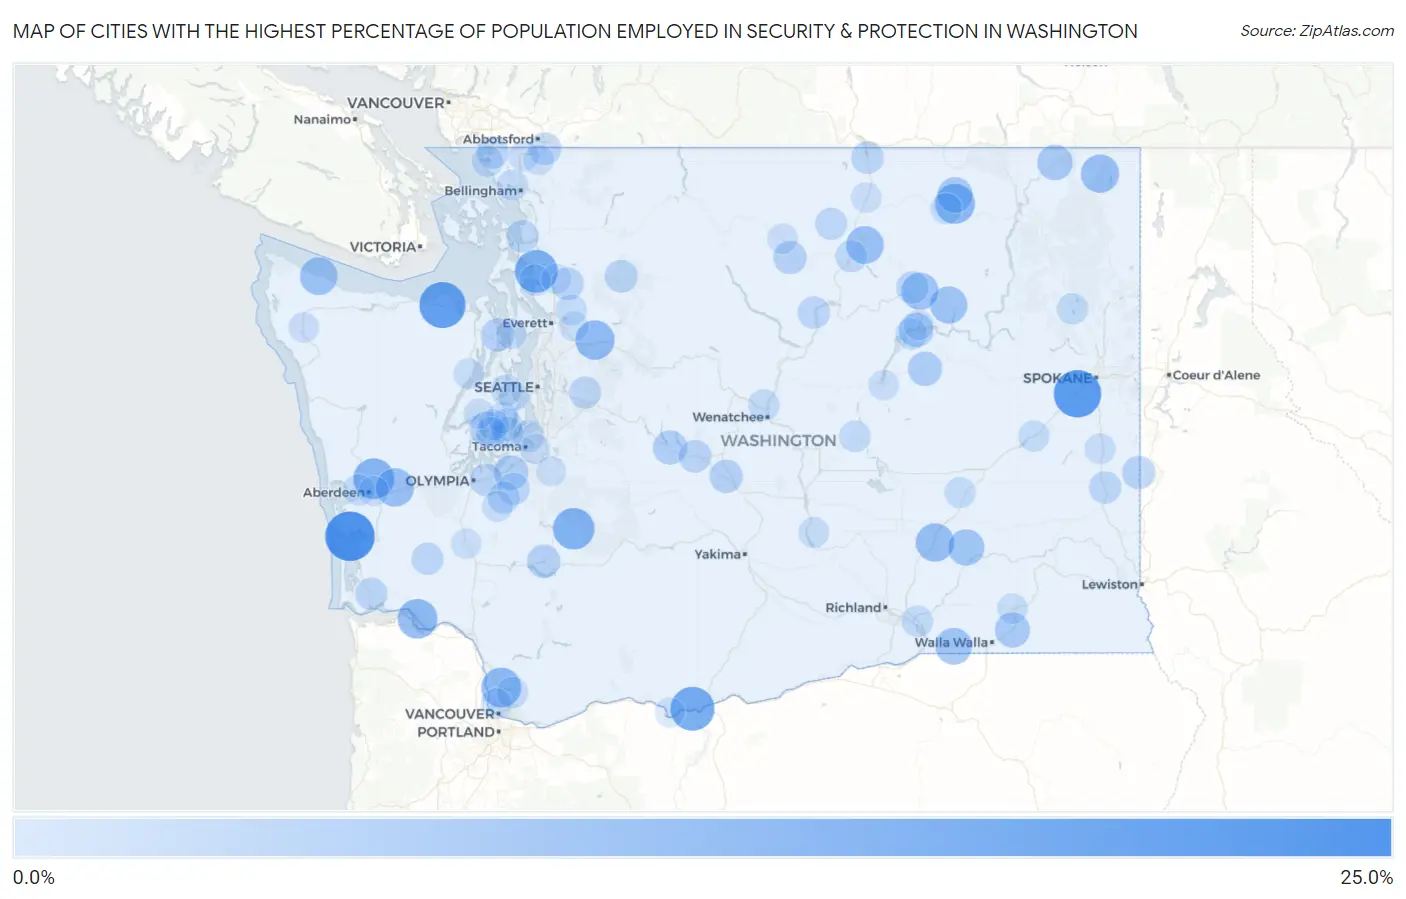
Cities with the Highest Percentage of Population Employed in Security & Protection in Washington
| City | % Employed | vs State | vs National | |
| 1. | Tokeland | 23.7% | 1.8%(+21.9)#1 | 2.1%(+21.5)#208 |
| 2. | Four Lakes | 21.5% | 1.8%(+19.6)#2 | 2.1%(+19.3)#244 |
| 3. | Carlsborg | 20.2% | 1.8%(+18.4)#3 | 2.1%(+18.1)#269 |
| 4. | Wishram | 18.0% | 1.8%(+16.2)#4 | 2.1%(+15.8)#337 |
| 5. | Lake Ketchum | 16.6% | 1.8%(+14.8)#5 | 2.1%(+14.5)#404 |
| 6. | Ashford | 15.4% | 1.8%(+13.5)#6 | 2.1%(+13.2)#470 |
| 7. | Aberdeen Gardens | 14.7% | 1.8%(+12.9)#7 | 2.1%(+12.6)#501 |
| 8. | Torboy | 13.7% | 1.8%(+11.9)#8 | 2.1%(+11.6)#587 |
| 9. | Duluth | 13.5% | 1.8%(+11.7)#9 | 2.1%(+11.4)#610 |
| 10. | Cathlamet | 13.5% | 1.8%(+11.7)#10 | 2.1%(+11.3)#616 |
| 11. | North Sultan | 13.1% | 1.8%(+11.3)#11 | 2.1%(+10.9)#654 |
| 12. | Connell | 12.1% | 1.8%(+10.3)#12 | 2.1%(+9.99)#743 |
| 13. | Montesano | 12.1% | 1.8%(+10.3)#13 | 2.1%(+9.92)#750 |
| 14. | Metaline | 12.0% | 1.8%(+10.2)#14 | 2.1%(+9.85)#759 |
| 15. | North Omak | 11.6% | 1.8%(+9.74)#15 | 2.1%(+9.41)#832 |
| 16. | Clallam Bay | 11.4% | 1.8%(+9.60)#16 | 2.1%(+9.26)#849 |
| 17. | Keller | 11.0% | 1.8%(+9.19)#17 | 2.1%(+8.85)#923 |
| 18. | Nespelem | 10.9% | 1.8%(+9.06)#18 | 2.1%(+8.72)#943 |
| 19. | Touchet | 10.5% | 1.8%(+8.71)#19 | 2.1%(+8.38)#1,005 |
| 20. | Kahlotus | 10.2% | 1.8%(+8.36)#20 | 2.1%(+8.02)#1,068 |
| 21. | Curlew Lake | 9.4% | 1.8%(+7.59)#21 | 2.1%(+7.25)#1,222 |
| 22. | Northport | 9.3% | 1.8%(+7.45)#22 | 2.1%(+7.11)#1,252 |
| 23. | Dixie | 9.0% | 1.8%(+7.14)#23 | 2.1%(+6.81)#1,344 |
| 24. | Almira | 8.3% | 1.8%(+6.52)#24 | 2.1%(+6.18)#1,538 |
| 25. | Grand Coulee | 8.2% | 1.8%(+6.43)#25 | 2.1%(+6.09)#1,575 |
| 26. | Fort Lewis | 8.1% | 1.8%(+6.33)#26 | 2.1%(+5.99)#1,606 |
| 27. | Easton | 8.1% | 1.8%(+6.29)#27 | 2.1%(+5.96)#1,617 |
| 28. | Vaughn | 7.6% | 1.8%(+5.75)#28 | 2.1%(+5.41)#1,819 |
| 29. | Morton | 7.3% | 1.8%(+5.50)#29 | 2.1%(+5.17)#1,937 |
| 30. | Thorp | 7.3% | 1.8%(+5.50)#30 | 2.1%(+5.17)#1,941 |
| 31. | Twisp | 7.2% | 1.8%(+5.41)#31 | 2.1%(+5.08)#1,974 |
| 32. | Farmington | 7.1% | 1.8%(+5.33)#32 | 2.1%(+4.99)#2,008 |
| 33. | Port Ludlow | 7.1% | 1.8%(+5.29)#33 | 2.1%(+4.96)#2,018 |
| 34. | Clear Lake Cdp Skagit County | 6.8% | 1.8%(+4.98)#34 | 2.1%(+4.65)#2,185 |
| 35. | Darrington | 6.7% | 1.8%(+4.92)#35 | 2.1%(+4.58)#2,228 |
| 36. | South Cle Elum | 6.7% | 1.8%(+4.85)#36 | 2.1%(+4.52)#2,258 |
| 37. | Arlington Heights | 6.6% | 1.8%(+4.83)#37 | 2.1%(+4.49)#2,284 |
| 38. | Bay View | 6.6% | 1.8%(+4.75)#38 | 2.1%(+4.41)#2,323 |
| 39. | Oroville | 6.6% | 1.8%(+4.75)#39 | 2.1%(+4.41)#2,324 |
| 40. | Sumas | 6.5% | 1.8%(+4.72)#40 | 2.1%(+4.39)#2,338 |
| 41. | Tanglewilde | 6.5% | 1.8%(+4.67)#41 | 2.1%(+4.33)#2,370 |
| 42. | Suncrest | 6.4% | 1.8%(+4.58)#42 | 2.1%(+4.24)#2,436 |
| 43. | Nespelem Community | 6.4% | 1.8%(+4.55)#43 | 2.1%(+4.22)#2,461 |
| 44. | Pateros | 6.3% | 1.8%(+4.51)#44 | 2.1%(+4.17)#2,485 |
| 45. | Steptoe | 6.2% | 1.8%(+4.44)#45 | 2.1%(+4.10)#2,532 |
| 46. | Blaine | 6.2% | 1.8%(+4.35)#46 | 2.1%(+4.01)#2,584 |
| 47. | Canterwood | 6.1% | 1.8%(+4.33)#47 | 2.1%(+3.99)#2,596 |
| 48. | Naselle | 6.1% | 1.8%(+4.30)#48 | 2.1%(+3.97)#2,616 |
| 49. | Fall City | 6.1% | 1.8%(+4.29)#49 | 2.1%(+3.96)#2,622 |
| 50. | Pe Ell | 6.0% | 1.8%(+4.19)#50 | 2.1%(+3.85)#2,707 |
| 51. | Conconully | 6.0% | 1.8%(+4.16)#51 | 2.1%(+3.82)#2,731 |
| 52. | Roy | 6.0% | 1.8%(+4.15)#52 | 2.1%(+3.81)#2,741 |
| 53. | Yelm | 5.9% | 1.8%(+4.13)#53 | 2.1%(+3.79)#2,757 |
| 54. | Okanogan | 5.9% | 1.8%(+4.06)#54 | 2.1%(+3.72)#2,835 |
| 55. | Tehaleh | 5.8% | 1.8%(+4.01)#55 | 2.1%(+3.67)#2,863 |
| 56. | Gig Harbor | 5.6% | 1.8%(+3.77)#56 | 2.1%(+3.43)#3,078 |
| 57. | Ephrata | 5.6% | 1.8%(+3.75)#57 | 2.1%(+3.41)#3,095 |
| 58. | Loon Lake | 5.5% | 1.8%(+3.68)#58 | 2.1%(+3.34)#3,172 |
| 59. | Meadow Glade | 5.5% | 1.8%(+3.65)#59 | 2.1%(+3.32)#3,200 |
| 60. | Sunnyslope | 5.5% | 1.8%(+3.64)#60 | 2.1%(+3.31)#3,208 |
| 61. | Dash Point | 5.4% | 1.8%(+3.62)#61 | 2.1%(+3.29)#3,229 |
| 62. | Republic | 5.4% | 1.8%(+3.62)#62 | 2.1%(+3.28)#3,235 |
| 63. | Electric City | 5.4% | 1.8%(+3.58)#63 | 2.1%(+3.25)#3,264 |
| 64. | Hoquiam | 5.4% | 1.8%(+3.57)#64 | 2.1%(+3.24)#3,273 |
| 65. | Burbank | 5.3% | 1.8%(+3.51)#65 | 2.1%(+3.17)#3,337 |
| 66. | Stanwood | 5.3% | 1.8%(+3.48)#66 | 2.1%(+3.14)#3,378 |
| 67. | Burley | 5.2% | 1.8%(+3.43)#67 | 2.1%(+3.09)#3,441 |
| 68. | Birch Bay | 5.2% | 1.8%(+3.41)#68 | 2.1%(+3.08)#3,456 |
| 69. | Lind | 5.2% | 1.8%(+3.41)#69 | 2.1%(+3.08)#3,458 |
| 70. | Sprague | 5.2% | 1.8%(+3.40)#70 | 2.1%(+3.07)#3,465 |
| 71. | Enetai | 5.2% | 1.8%(+3.35)#71 | 2.1%(+3.01)#3,516 |
| 72. | Marietta Alderwood | 5.2% | 1.8%(+3.34)#72 | 2.1%(+3.00)#3,530 |
| 73. | Lochsloy | 5.1% | 1.8%(+3.24)#73 | 2.1%(+2.91)#3,636 |
| 74. | Stansberry Lake | 5.0% | 1.8%(+3.15)#74 | 2.1%(+2.81)#3,733 |
| 75. | Mattawa | 4.9% | 1.8%(+3.12)#75 | 2.1%(+2.78)#3,768 |
| 76. | Key Center | 4.9% | 1.8%(+3.08)#76 | 2.1%(+2.75)#3,813 |
| 77. | Rainier | 4.9% | 1.8%(+3.07)#77 | 2.1%(+2.74)#3,821 |
| 78. | Rosalia | 4.9% | 1.8%(+3.06)#78 | 2.1%(+2.72)#3,848 |
| 79. | Lake Shore | 4.9% | 1.8%(+3.05)#79 | 2.1%(+2.71)#3,856 |
| 80. | Beacon Hill | 4.8% | 1.8%(+3.01)#80 | 2.1%(+2.68)#3,897 |
| 81. | Brinnon | 4.7% | 1.8%(+2.93)#81 | 2.1%(+2.59)#3,983 |
| 82. | Clear Lake Cdp Pierce County | 4.7% | 1.8%(+2.91)#82 | 2.1%(+2.58)#3,998 |
| 83. | Waitsburg | 4.7% | 1.8%(+2.89)#83 | 2.1%(+2.55)#4,036 |
| 84. | Winthrop | 4.6% | 1.8%(+2.78)#84 | 2.1%(+2.44)#4,197 |
| 85. | Lynden | 4.5% | 1.8%(+2.70)#85 | 2.1%(+2.36)#4,303 |
| 86. | Hansville | 4.5% | 1.8%(+2.70)#86 | 2.1%(+2.36)#4,304 |
| 87. | Tonasket | 4.5% | 1.8%(+2.69)#87 | 2.1%(+2.36)#4,309 |
| 88. | Forks | 4.5% | 1.8%(+2.69)#88 | 2.1%(+2.36)#4,317 |
| 89. | Coulee City | 4.5% | 1.8%(+2.67)#89 | 2.1%(+2.34)#4,332 |
| 90. | Nooksack | 4.4% | 1.8%(+2.63)#90 | 2.1%(+2.29)#4,406 |
| 91. | Belfair | 4.4% | 1.8%(+2.54)#91 | 2.1%(+2.21)#4,524 |
| 92. | Fife | 4.3% | 1.8%(+2.52)#92 | 2.1%(+2.19)#4,564 |
| 93. | Chehalis | 4.3% | 1.8%(+2.48)#93 | 2.1%(+2.15)#4,617 |
| 94. | Aberdeen | 4.3% | 1.8%(+2.44)#94 | 2.1%(+2.11)#4,666 |
| 95. | Coulee Dam | 4.2% | 1.8%(+2.40)#95 | 2.1%(+2.06)#4,744 |
| 96. | Orting | 4.2% | 1.8%(+2.35)#96 | 2.1%(+2.02)#4,811 |
| 97. | Bryant | 4.2% | 1.8%(+2.35)#97 | 2.1%(+2.02)#4,815 |
| 98. | Dallesport | 4.1% | 1.8%(+2.33)#98 | 2.1%(+1.99)#4,845 |
| 99. | Snohomish | 4.1% | 1.8%(+2.32)#99 | 2.1%(+1.98)#4,860 |
| 100. | Manchester | 4.1% | 1.8%(+2.31)#100 | 2.1%(+1.97)#4,880 |
Common Questions
What are the Top 10 Cities with the Highest Percentage of Population Employed in Security & Protection in Washington?
Top 10 Cities with the Highest Percentage of Population Employed in Security & Protection in Washington are:
#1
23.7%
#2
21.5%
#3
20.2%
#4
18.0%
#5
16.6%
#6
15.4%
#7
14.7%
#8
13.7%
#9
13.5%
#10
13.5%
What city has the Highest Percentage of Population Employed in Security & Protection in Washington?
Tokeland has the Highest Percentage of Population Employed in Security & Protection in Washington with 23.7%.
What is the Percentage of Population Employed in Security & Protection in the State of Washington?
Percentage of Population Employed in Security & Protection in Washington is 1.8%.
What is the Percentage of Population Employed in Security & Protection in the United States?
Percentage of Population Employed in Security & Protection in the United States is 2.1%.