Cities with the Highest Percentage of Population Employed in Security & Protection in Utah
RELATED REPORTS & OPTIONS
Security & Protection
Utah
Compare Cities
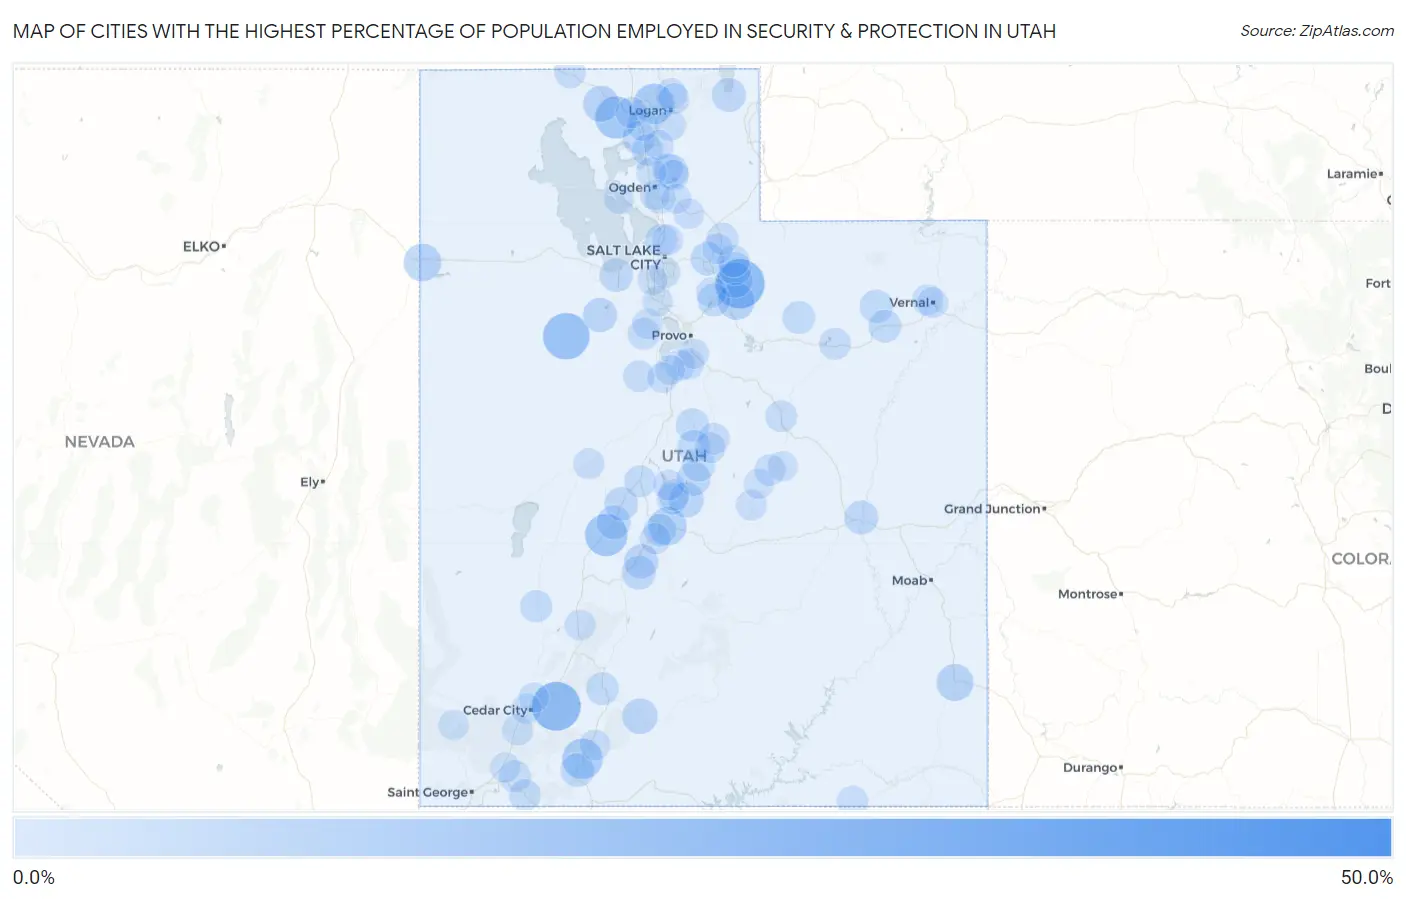
Map of Cities with the Highest Percentage of Population Employed in Security & Protection in Utah
0.0%
50.0%
Cities with the Highest Percentage of Population Employed in Security & Protection in Utah
| City | % Employed | vs State | vs National | |
| 1. | Lapoint | 43.8% | 1.6%(+42.1)#1 | 2.1%(+41.6)#49 |
| 2. | Woodland | 20.6% | 1.6%(+19.0)#2 | 2.1%(+18.5)#262 |
| 3. | Brian Head | 20.0% | 1.6%(+18.4)#3 | 2.1%(+17.9)#281 |
| 4. | Dugway | 17.6% | 1.6%(+16.0)#4 | 2.1%(+15.5)#349 |
| 5. | Meadow | 13.7% | 1.6%(+12.1)#5 | 2.1%(+11.6)#589 |
| 6. | Thatcher | 13.6% | 1.6%(+12.0)#6 | 2.1%(+11.5)#599 |
| 7. | Peter | 11.9% | 1.6%(+10.3)#7 | 2.1%(+9.72)#780 |
| 8. | Glendale | 11.8% | 1.6%(+10.2)#8 | 2.1%(+9.69)#783 |
| 9. | Salina | 9.8% | 1.6%(+8.16)#9 | 2.1%(+7.62)#1,147 |
| 10. | Wendover | 9.1% | 1.6%(+7.53)#10 | 2.1%(+6.99)#1,278 |
| 11. | Timber Lakes | 8.5% | 1.6%(+6.93)#11 | 2.1%(+6.39)#1,472 |
| 12. | Monticello | 8.5% | 1.6%(+6.92)#12 | 2.1%(+6.38)#1,478 |
| 13. | Howell | 7.8% | 1.6%(+6.17)#13 | 2.1%(+5.64)#1,732 |
| 14. | Francis | 7.2% | 1.6%(+5.63)#14 | 2.1%(+5.09)#1,962 |
| 15. | Tropic | 7.1% | 1.6%(+5.53)#15 | 2.1%(+4.99)#2,000 |
| 16. | Mayfield | 6.9% | 1.6%(+5.24)#16 | 2.1%(+4.71)#2,157 |
| 17. | Central Valley | 6.1% | 1.6%(+4.51)#17 | 2.1%(+3.98)#2,606 |
| 18. | Rush Valley | 6.0% | 1.6%(+4.43)#18 | 2.1%(+3.90)#2,673 |
| 19. | Monroe | 5.9% | 1.6%(+4.29)#19 | 2.1%(+3.76)#2,791 |
| 20. | Manti | 5.9% | 1.6%(+4.27)#20 | 2.1%(+3.73)#2,809 |
| 21. | Green River | 5.9% | 1.6%(+4.24)#21 | 2.1%(+3.70)#2,842 |
| 22. | Wolf Creek | 5.8% | 1.6%(+4.23)#22 | 2.1%(+3.70)#2,844 |
| 23. | Laketown | 5.8% | 1.6%(+4.16)#23 | 2.1%(+3.62)#2,911 |
| 24. | Fillmore | 5.7% | 1.6%(+4.08)#24 | 2.1%(+3.55)#2,969 |
| 25. | Orderville | 5.7% | 1.6%(+4.07)#25 | 2.1%(+3.53)#2,976 |
| 26. | Silver Summit | 5.6% | 1.6%(+4.03)#26 | 2.1%(+3.50)#3,013 |
| 27. | Holden | 5.6% | 1.6%(+3.94)#27 | 2.1%(+3.41)#3,105 |
| 28. | Stansbury Park | 5.4% | 1.6%(+3.83)#28 | 2.1%(+3.30)#3,219 |
| 29. | Fountain Green | 5.3% | 1.6%(+3.66)#29 | 2.1%(+3.13)#3,394 |
| 30. | Neola | 5.2% | 1.6%(+3.56)#30 | 2.1%(+3.02)#3,506 |
| 31. | Ephraim | 5.0% | 1.6%(+3.36)#31 | 2.1%(+2.83)#3,715 |
| 32. | Corinne | 5.0% | 1.6%(+3.36)#32 | 2.1%(+2.82)#3,718 |
| 33. | Charleston | 4.8% | 1.6%(+3.22)#33 | 2.1%(+2.69)#3,884 |
| 34. | Ballard | 4.8% | 1.6%(+3.17)#34 | 2.1%(+2.63)#3,941 |
| 35. | Panguitch | 4.7% | 1.6%(+3.08)#35 | 2.1%(+2.54)#4,049 |
| 36. | Wales | 4.7% | 1.6%(+3.07)#36 | 2.1%(+2.54)#4,053 |
| 37. | Tabiona | 4.7% | 1.6%(+3.07)#37 | 2.1%(+2.54)#4,054 |
| 38. | Marion | 4.6% | 1.6%(+2.97)#38 | 2.1%(+2.43)#4,205 |
| 39. | Woods Cross | 4.2% | 1.6%(+2.55)#39 | 2.1%(+2.02)#4,810 |
| 40. | Aurora | 4.1% | 1.6%(+2.50)#40 | 2.1%(+1.97)#4,896 |
| 41. | Perry | 4.1% | 1.6%(+2.45)#41 | 2.1%(+1.91)#4,989 |
| 42. | Milford | 4.0% | 1.6%(+2.42)#42 | 2.1%(+1.89)#5,029 |
| 43. | Scipio | 4.0% | 1.6%(+2.37)#43 | 2.1%(+1.83)#5,139 |
| 44. | Virgin | 3.9% | 1.6%(+2.33)#44 | 2.1%(+1.80)#5,201 |
| 45. | Helper | 3.9% | 1.6%(+2.31)#45 | 2.1%(+1.77)#5,245 |
| 46. | Honeyville | 3.9% | 1.6%(+2.27)#46 | 2.1%(+1.74)#5,316 |
| 47. | Duchesne | 3.8% | 1.6%(+2.23)#47 | 2.1%(+1.70)#5,402 |
| 48. | Fairfield | 3.8% | 1.6%(+2.23)#48 | 2.1%(+1.70)#5,424 |
| 49. | Oakley | 3.8% | 1.6%(+2.19)#49 | 2.1%(+1.65)#5,491 |
| 50. | Hoytsville | 3.8% | 1.6%(+2.18)#50 | 2.1%(+1.65)#5,496 |
| 51. | Apple Valley | 3.7% | 1.6%(+2.13)#51 | 2.1%(+1.59)#5,620 |
| 52. | Mount Pleasant | 3.6% | 1.6%(+1.95)#52 | 2.1%(+1.41)#5,992 |
| 53. | Centerfield | 3.5% | 1.6%(+1.86)#53 | 2.1%(+1.32)#6,192 |
| 54. | Snowville | 3.4% | 1.6%(+1.78)#54 | 2.1%(+1.24)#6,408 |
| 55. | Eureka | 3.4% | 1.6%(+1.75)#55 | 2.1%(+1.22)#6,459 |
| 56. | Hyrum | 3.4% | 1.6%(+1.74)#56 | 2.1%(+1.20)#6,498 |
| 57. | Huntington | 3.3% | 1.6%(+1.69)#57 | 2.1%(+1.16)#6,612 |
| 58. | Tremonton | 3.2% | 1.6%(+1.57)#58 | 2.1%(+1.03)#6,918 |
| 59. | Smithfield | 3.2% | 1.6%(+1.57)#59 | 2.1%(+1.03)#6,922 |
| 60. | Gunnison | 3.2% | 1.6%(+1.55)#60 | 2.1%(+1.02)#6,961 |
| 61. | Oljato Monument Valley | 3.1% | 1.6%(+1.54)#61 | 2.1%(+1.00)#7,012 |
| 62. | Fayette | 3.1% | 1.6%(+1.51)#62 | 2.1%(+0.977)#7,081 |
| 63. | Kanarraville | 3.1% | 1.6%(+1.51)#63 | 2.1%(+0.977)#7,082 |
| 64. | Salem | 3.1% | 1.6%(+1.50)#64 | 2.1%(+0.966)#7,120 |
| 65. | Ferron | 3.1% | 1.6%(+1.49)#65 | 2.1%(+0.951)#7,159 |
| 66. | Hyde Park | 3.1% | 1.6%(+1.48)#66 | 2.1%(+0.941)#7,195 |
| 67. | Sigurd | 3.1% | 1.6%(+1.46)#67 | 2.1%(+0.922)#7,260 |
| 68. | Delta | 3.1% | 1.6%(+1.45)#68 | 2.1%(+0.920)#7,268 |
| 69. | Bountiful | 3.0% | 1.6%(+1.39)#69 | 2.1%(+0.858)#7,469 |
| 70. | Maeser | 3.0% | 1.6%(+1.36)#70 | 2.1%(+0.830)#7,570 |
| 71. | Payson | 2.9% | 1.6%(+1.33)#71 | 2.1%(+0.800)#7,660 |
| 72. | Beaver | 2.9% | 1.6%(+1.31)#72 | 2.1%(+0.776)#7,740 |
| 73. | Spring City | 2.9% | 1.6%(+1.31)#73 | 2.1%(+0.771)#7,758 |
| 74. | Vernal | 2.9% | 1.6%(+1.30)#74 | 2.1%(+0.769)#7,767 |
| 75. | Alton | 2.8% | 1.6%(+1.20)#75 | 2.1%(+0.668)#8,099 |
| 76. | Liberty | 2.7% | 1.6%(+1.10)#76 | 2.1%(+0.568)#8,425 |
| 77. | Eden | 2.6% | 1.6%(+1.04)#77 | 2.1%(+0.501)#8,652 |
| 78. | Goshen | 2.6% | 1.6%(+1.04)#78 | 2.1%(+0.501)#8,653 |
| 79. | Wanship | 2.6% | 1.6%(+0.990)#79 | 2.1%(+0.456)#8,813 |
| 80. | Morgan | 2.6% | 1.6%(+0.964)#80 | 2.1%(+0.429)#8,905 |
| 81. | Eagle Mountain | 2.6% | 1.6%(+0.940)#81 | 2.1%(+0.405)#9,006 |
| 82. | Murray | 2.5% | 1.6%(+0.932)#82 | 2.1%(+0.398)#9,035 |
| 83. | Pleasant View | 2.5% | 1.6%(+0.900)#83 | 2.1%(+0.366)#9,158 |
| 84. | Bluffdale | 2.5% | 1.6%(+0.900)#84 | 2.1%(+0.365)#9,163 |
| 85. | Cedar City | 2.5% | 1.6%(+0.900)#85 | 2.1%(+0.365)#9,164 |
| 86. | Midway | 2.5% | 1.6%(+0.874)#86 | 2.1%(+0.339)#9,257 |
| 87. | Uintah | 2.5% | 1.6%(+0.859)#87 | 2.1%(+0.324)#9,316 |
| 88. | Enterprise | 2.5% | 1.6%(+0.839)#88 | 2.1%(+0.304)#9,379 |
| 89. | Orangeville | 2.4% | 1.6%(+0.833)#89 | 2.1%(+0.299)#9,403 |
| 90. | White | 2.4% | 1.6%(+0.747)#90 | 2.1%(+0.212)#9,759 |
| 91. | Washington Terrace | 2.3% | 1.6%(+0.717)#91 | 2.1%(+0.182)#9,877 |
| 92. | West Jordan | 2.3% | 1.6%(+0.677)#92 | 2.1%(+0.142)#10,036 |
| 93. | Spanish Fork | 2.3% | 1.6%(+0.676)#93 | 2.1%(+0.141)#10,044 |
| 94. | Genola | 2.3% | 1.6%(+0.674)#94 | 2.1%(+0.140)#10,048 |
| 95. | Toquerville | 2.3% | 1.6%(+0.674)#95 | 2.1%(+0.139)#10,052 |
| 96. | Cleveland | 2.3% | 1.6%(+0.669)#96 | 2.1%(+0.135)#10,067 |
| 97. | Hooper | 2.3% | 1.6%(+0.644)#97 | 2.1%(+0.109)#10,176 |
| 98. | Mountain Green | 2.2% | 1.6%(+0.634)#98 | 2.1%(+0.099)#10,212 |
| 99. | Mantua | 2.2% | 1.6%(+0.613)#99 | 2.1%(+0.078)#10,310 |
| 100. | Enoch | 2.2% | 1.6%(+0.608)#100 | 2.1%(+0.074)#10,325 |
Common Questions
What are the Top 10 Cities with the Highest Percentage of Population Employed in Security & Protection in Utah?
Top 10 Cities with the Highest Percentage of Population Employed in Security & Protection in Utah are:
#1
20.6%
#2
20.0%
#3
17.6%
#4
13.7%
#5
13.6%
#6
11.9%
#7
11.8%
#8
9.8%
#9
9.1%
#10
8.5%
What city has the Highest Percentage of Population Employed in Security & Protection in Utah?
Woodland has the Highest Percentage of Population Employed in Security & Protection in Utah with 20.6%.
What is the Percentage of Population Employed in Security & Protection in the State of Utah?
Percentage of Population Employed in Security & Protection in Utah is 1.6%.
What is the Percentage of Population Employed in Security & Protection in the United States?
Percentage of Population Employed in Security & Protection in the United States is 2.1%.